Embed Size (px)
Citation preview

Goulburn Ovens Institute of TAFE2021 people matter survey results report
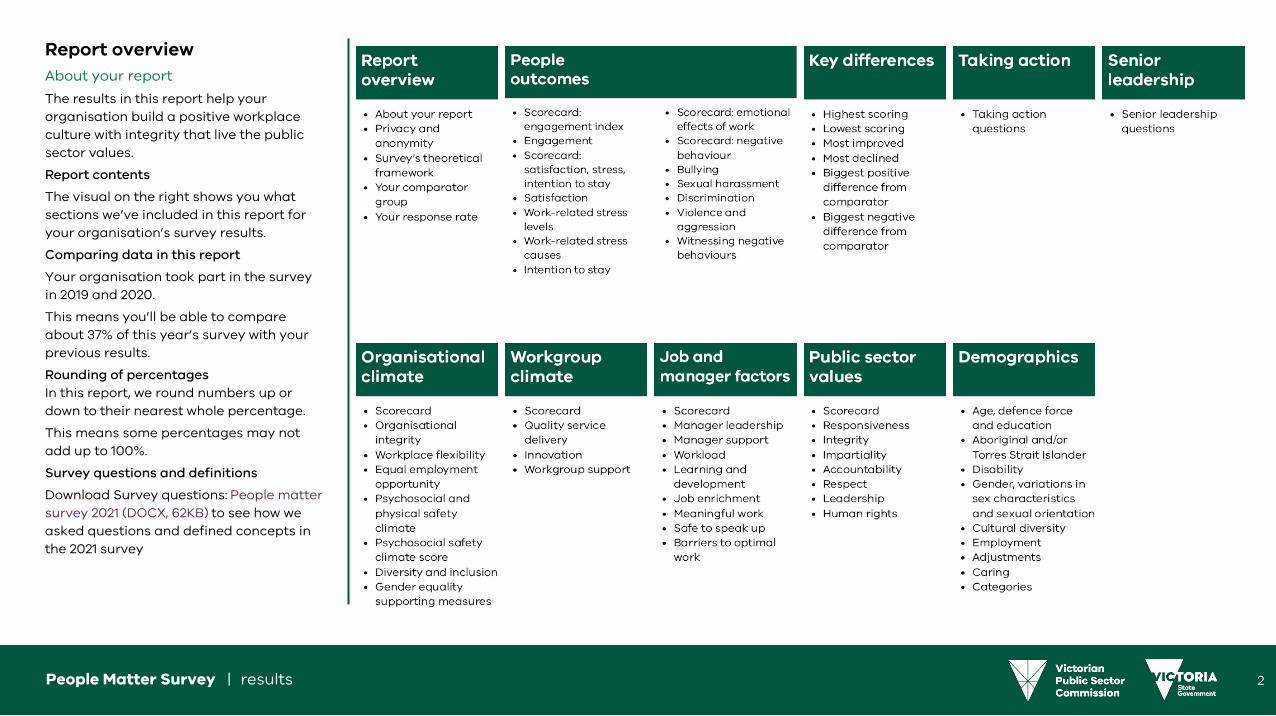
Report overviewAbout your report
The results in this report help your organisation build a positive workplace culture with integrity that live the public sector values.
Report contents
The visual on the right shows you what sections we’ve included in this report for your organisation’s survey results.
Comparing data in this report
Your organisation took part in the survey in 2019 and 2020.
This means you’ll be able to compare about 37% of this year’s survey with your previous results.
Rounding of percentages In this report, we round numbers up or down to their nearest whole percentage.
This means some percentages may not add up to 100%.
Survey questions and definitions
Download Survey questions: People matter survey 2021 (DOCX, 62KB) to see how we asked questions and defined concepts in the 2021 survey
2People Matter Survey | results 2
3People Matter Survey | results 3

Report overviewPrivacy and anonymity
To protect you, we:
• use an anonymous survey link and everyone in your organisation receives the same survey link
• de-identify all survey response data provided to your organisation
• don't collect your name, date of birth or employee ID
• don't release results when fewer than 10 people in a work group have responded to the survey
• don't release employee opinion results for demographic groups where organisations have fewer than 30 responses in total
• don't link the free-text comment reporting to any other survey information
Read more in our privacy policy.
4People Matter Survey | results 4

Report overviewSurvey's theoretical framework
What this is
The framework provides an overview of the workplace factors and outcomes that the survey measures.
Why this is important
Based on theory and research, the framework focuses on core themes that help guide organisations in creating better workplaces.
We developed the framework in consultation with stakeholders from the public sector and Deakin University.
Our public sector values
The public sector values inform the professional and ethical conduct of everyone who works in the public sector.
As such, these values underpin the theoretical framework of the survey.
There’s a strong link between workplace culture and how staff perceive their organisation lives the public sector values.
5People Matter Survey | results 5

Report overviewYour comparator group
What this is
This is a list of similar organisations to yours.
We try to make sure they’re in the same industry your organisation is in.
Some organisations may not have taken part in the survey previously. This means your comparator group may be different to previous years.
How we use this in your report
In this report, we compare your organisation’s survey results to your comparator group’s results.
This is so you can compare how your organisation is doing in your industry or to similar organisations.
We refer to your comparator group in this report as ‘comparator’.
Bendigo Kangan Institute
Box Hill Institute Group
Chisholm Institute
Gippsland Institute of TAFE
Gordon Institute of TAFE
Holmesglen Institute
Melbourne Polytechnic
South West Institute of TAFE
Sunraysia Institute of TAFE
William Angliss Institute of TAFE
Wodonga Institute of TAFE
6People Matter Survey | results 6

Report overviewYour response rate
What this is
This is how many staff in your organisation did the survey in 2021.
Why this is important
The higher the response rate, the more your results will reflect how staff feel.
If less than 100 completed the survey, consider how much one person could change your results.
For example, if only 25 people did the survey, 1 person would account for 4% of any result.
In this example, if your survey result and comparator group result or previous survey result are within 4% of each other, there is very little difference in the results.
How to read this
The number in the brackets () shows how many staff completed the survey this year.
We’ve also expressed this as a percentage of all the staff who work in your organisation.
2020
66%(344)
Comparator 54%Public Sector 49%
2021
87%(428)
Comparator 60%Public Sector 39%
7People Matter Survey | results 7

8People Matter Survey | results 8

People outcomesScorecard: employee engagement index
What this is
This is the psychological satisfaction staff get from their work.
The employee engagement index is a score out of 100. It is a weighting of all engagement question responses.
The weightings for each engagement response are:
• strongly agree is 100 points
• agree is 75 points
• neither agree nor disagree is 50 points
• disagree is 25 points
• strongly disagree is 0 points
Why this is important
High engagement may lead to greater satisfaction and lower absences, turnover and workplace stress.
2021
69
Comparator 68Public Sector 70
2020
74
Comparator 67Public Sector 68
9People Matter Survey | results 9

People outcomesEngagement question results 1 of 2
What this is
This is the overall sense of pride, attachment, inspiration, motivation and advocacy your employees have for your organisation.
Your organisation’s engagement index
Your 2021 index is 69.
Why this is important
High engagement drives greater productivity, employee wellbeing and lower absences, turnover and workplace stress.
How to read this
Under ‘Your results’, see results for each question in descending order by most agreed.
‘Agree’ combines responses for agree and strongly agree and ‘Disagree’ combines responses for disagree and strongly disagree.
Under ‘Benchmark results’, compare your comparator groups overall, lowest and highest scores with your own.
Example
76% of your staff who did the survey agreed or strongly agreed with 'I am proud to tell others I work for my organisation'.
I am proud to tell others I work for my organisation
77 % 83 % 76 % 68 % 75 % 84 %
I would recommend my organisation as a good place to work
74 % 79 % 68 % 61 % 67 % 78 %
My organisation motivates me to help achieve its objectives
72 % 68 % 66 % 54 % 61 % 74 %
My organisation inspires me to do the best in my job
72 % 70 % 64 % 51 % 59 % 72 %
Survey question Your results Benchmark agree results
Disagree Neither agree nor disagree
Agree
You Comparator
2019 2020 2021 Lowest Average Highest
10People Matter Survey | results 10

People outcomesEngagement question results 2 of 2
What this is
This is the overall sense of pride, attachment, inspiration, motivation and advocacy your employees have for your organisation.
Your organisation’s engagement index
Your 2021 index is 69.
Why this is important
High engagement drives greater productivity, employee wellbeing and lower absences, turnover and workplace stress.
How to read this
Under ‘Your results’, see results for each question in descending order by most agreed.
‘Agree’ combines responses for agree and strongly agree and ‘Disagree’ combines responses for disagree and strongly disagree.
Under ‘Benchmark results’, compare your comparator groups overall, lowest and highest scores with your own.
Example
63% of your staff who did the survey agreed or strongly agreed with 'I feel a strong personal attachment to my organisation'.
I feel a strong personal attachment to my organisation
69 % 74 % 63 % 56 % 64 % 70 %
Survey question Your results Benchmark agree results
Disagree Neither agree nor disagree
Agree
You Comparator
2019 2020 2021 Lowest Average Highest
11People Matter Survey | results 11

People outcomesScorecard: satisfaction, stress, intention to stay
What this is
This scorecard provides overall results for satisfaction, high to severe work-related stress, and intention to stay.
There are more people outcomes scorecards throughout this report.
Why this is important
This page shows which outcomes are performing well and which outcomes you can look to improve.
How to read this
Each label represents a group of questions in the survey about people outcomes.
Each result is the overall percentage of positive responses for your organisation, comparator and public sector.
Example
In 2021:
• 70% of your staff who did the survey responded positively to questions about Intention to stay.
Compared to:
• 68% of staff at your comparator and67% of staff across the public sector.
You 2019 You 2020 You 2021 Comparator 2021 Public sector 2021
12People Matter Survey | results 12

People outcomesSatisfaction question results 1 of 2
What this is
This is how satisfied staff are with their jobs, work-life balance and career development.
Why this is important
High satisfaction may lead to improved engagement, performance and lower absences and turnover.
How to read this
Under ‘Your results’, see results for each question in descending order by most agreed.
‘Agree’ combines responses for agree and strongly agree and ‘Disagree’ combines responses for disagree and strongly disagree.
Under ‘Benchmark results’, compare your comparator groups overall, lowest and highest scores with your own.
Example
79% of your staff who did the survey agreed or strongly agreed with 'I get a sense of accomplishment from my work'.
I get a sense of accomplishment from my work
82 %Not
asked79 % 76 % 81 % 86 %
I enjoy the work in my current job85 %
Not asked
76 % 75 % 81 % 87 %
Survey question Your results Benchmark agree results
Disagree Neither agree nor disagree
Agree
You Comparator
2019 2020 2021 Lowest Average Highest
13People Matter Survey | results 13

People outcomesSatisfaction question results 2 of 2
What this is
This is how satisfied staff are with their jobs, work-life balance and career development.
Why this is important
High satisfaction may lead to improved engagement, performance and lower absences and turnover.
How to read this
Under ‘Your results’, see results for each question in descending order by most satisfied.
‘Satisfied’ combines responses for satisfied and very satisfied and ‘Dissatisfied’ combines responses for dissatisfied and very dissatisfied.
Under ‘Benchmark results’, compare your comparator groups overall, lowest and highest scores with your own.
Example
70% of your staff who did the survey were satisfied or very satisfied with 'Considering everything, how satisfied are you with your current job'.
Considering everything, how satisfied are you with your current job
77 % 78 % 70 % 64 % 69 % 76 %
How satisfied are you with the work-life balance in your current job
67 % 64 % 66 % 60 % 65 % 72 %
How satisfied are you with your career development within your current organisation
60 % 58 % 58 % 44 % 51 % 60 %
Survey question Your results Benchmark satisfied results
Dissatisfied Neither satisfied nor dissatisfiedSatisfied
You Comparator
2019 2020 2021 Lowest Average Highest
14People Matter Survey | results 14

People outcomesWork-related stress levels
What this is
This is the level of stress experienced by employees in response to work-related factors.
Why this is important
Stress can negatively affect peoples health and wellbeing as well as their performance and behaviour.
How to read this
In this survey we asked staff to tell us their stress level.
The graph at the top shows how staff in your organisation rated their current levels of work-related stress.
The numbers below show the percentage of staff in your organisation who said they experienced high to severe stress in 2021 compared to 2020 and your comparator.
Example
31% of your staff who did the survey said they had high to severe stress in 2021. This is compared to 27% of staff in your comparator group and 26% of staff across the public sector.
How would you rate your current level of work-related stress? (You 2021)
Nil
Low / mild
Moderate
High
Very high
Severe
Reported levels of high to severe stress
2020
25%
Comparator 24%Public Sector 23%
2021
31%
Comparator 27%Public Sector 26%
15People Matter Survey | results 15

People outcomesWork-related stress causes
What this is
This is the main work-related causes of stress reported by staff.
Why this is important
Stress can negatively affect peoples health and wellbeing as well as their performance and behaviour.
How to read this
In the survey, we ask staff to tell us if they have experienced mild to severe stress at work, as shown in the visual above the table.
If they answer yes, we ask them to tell us what caused the stress. They can select more than one cause.
In descending order, the table shows the top 10 causes.
Example
90% of your staff who did the survey said they experienced mild to severe stress.
Of that 90%, 57% said the top reason was ‘Workload’.
Of those that experienced work related stress it was from ...You2020
You2021
Comparator 2021
Public sector 2021
Workload 53% 57% 49% 51%
Time pressure 45% 48% 41% 42%
Organisation or workplace change 9% 19% 11% 11%
Management of work (e.g. supervision, training, information, support) 10% 16% 14% 13%
Dealing with clients, patients or stakeholders 9% 14% 14% 14%
Other changes due to COVID-19 11% 11% 16% 15%
Unclear job expectations 9% 11% 14% 11%
Content, variety, or difficulty of work 9% 10% 10% 12%
Competing home and work responsibilities 13% 9% 9% 12%
Work that doesn't match my skills or experience 6% 8% 7% 7%
Experienced some work-related stress Did not experience some work-related stress
16People Matter Survey | results 16

People outcomesIntention to stay
What this is
This is what your staff intend to do with their careers in the near future.
Why this is important
In the public sector, we want to attract, keep, motivate and engage staff.
How to read this
In the survey, we ask staff to tell us if they intend to leave their organisation, leave the sector or stay.
If they say they intend to leave, we ask them to tell us why they want to. They can select more than one reason.
In descending order, the table shows the top 10 reasons for leaving.
The bar in the top right may not add up to 100% as it doesn’t include people who intend to retire, or those who answered 'don’t know’.
Example
11% of your staff who did the survey said they intended to leave.
Of that 11%, 45% said it was from ‘Lack of confidence in senior leadership’.
Of those who indicated they’re leaving your organisation (including leaving the sector) it was for ...
You2020
You2021
Comparator 2021
Public sector 2021
Lack of confidence in senior leadership 0% 45% 44% 34%
Excessive workload 0% 34% 32% 25%
Lack of organisational stability 0% 32% 25% 18%
Limited future career opportunities at my organisation 0% 26% 47% 42%
Limited recognition for doing a good job 0% 26% 38% 32%
Limited developmental/educational opportunities at my organisation 0% 19% 30% 24%
Limited involvement in decisions affecting my job and career 0% 19% 27% 20%
Better remuneration 0% 17% 43% 26%
Limited opportunities to gain further experience at my organisation 0% 17% 35% 33%
My interests do not match my job role 0% 15% 14% 14%
What is your likely career plan for the next 2 years?
Leaving your organisation Leaving the sector Staying
17People Matter Survey | results 17

People outcomesScorecard: emotional effects of work
What this is
This is the level of positive and negative feelings experienced by staff in the 3 months before the survey.
Why this is important
Positive feelings can lead to higher wellbeing and job satisfaction and a lower chance of burnout.
How to read this
Each label represents a question in the survey about emotional effects of work.
Each result is the percentage of staff who said they often, very often or always felt happy, enthusiastic, worried or miserable in the past 3 months.
You can compare these with your comparator and the public sector.
Example
In 2021:
• 56% of your staff who did the survey said work made them feel happy in 2021, which is down from 60% in 2020
Compared to:
• 53% of staff at your comparator and 50% of staff across the public sector.
Thinking about the last three months, how often has work made you feel …
You 2019 You 2020 You 2021 Comparator 2021 Public sector 2021
18People Matter Survey | results 18

People outcomesScorecard: negative behaviours
What this is
This is how many staff have experienced negative behaviours at work in the past 12 months.
Why this is important
Negative behaviours can be detrimental to health and wellbeing as well as performance and behaviour.
How to read this
Each label represents a question in the survey about negative behaviour.
Each result is the percentage of staff who said they experienced bullying, sexual harassment, discrimination or violence and aggression in the past 12 months.
You can compare these with your comparator and the public sector.
Example
In 2021:
• 9% of your staff who did the survey stated they experienced ' Bullying' in the last 12 months which is down from 14% in 2020.
Compared to:
• 15% of staff at your comparator and16% of staff across the public sector.
You 2019 You 2020 You 2021 Comparator 2021 Public sector 2021
19People Matter Survey | results 19
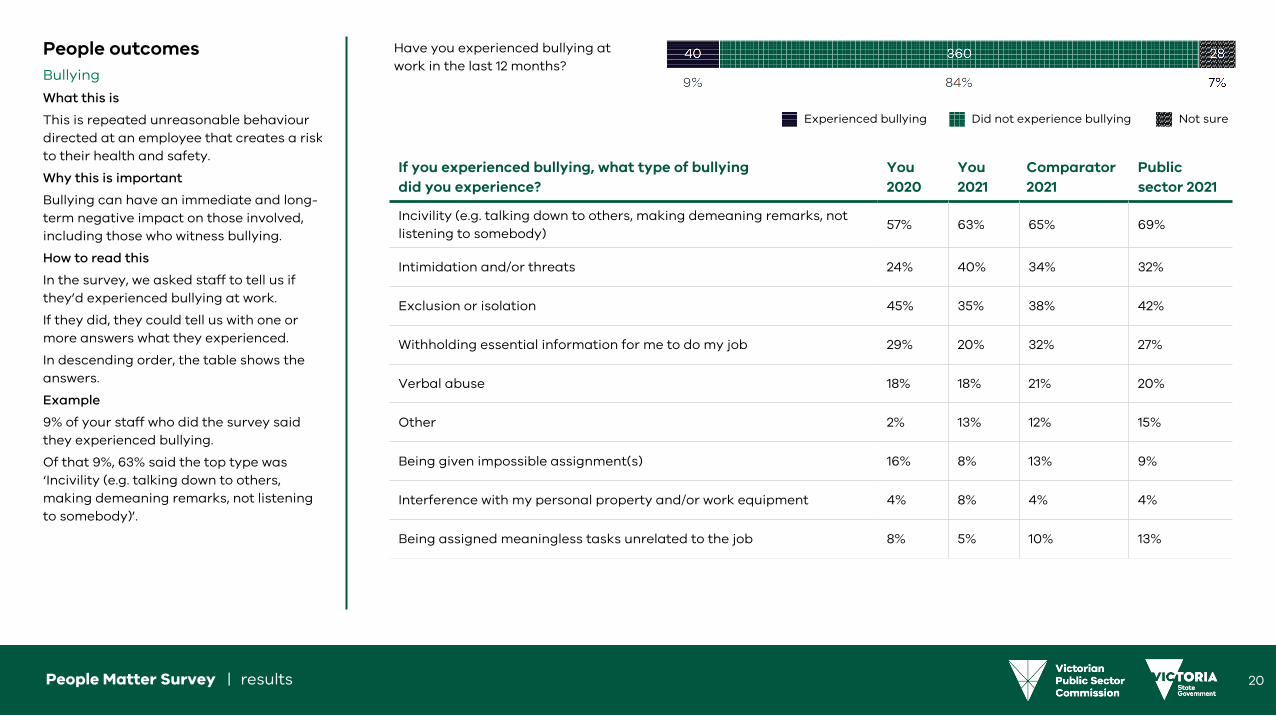
People outcomesBullying
What this is
This is repeated unreasonable behaviour directed at an employee that creates a risk to their health and safety.
Why this is important
Bullying can have an immediate and long-term negative impact on those involved, including those who witness bullying.
How to read this
In the survey, we asked staff to tell us if they’d experienced bullying at work.
If they did, they could tell us with one or more answers what they experienced.
In descending order, the table shows the answers.
Example
9% of your staff who did the survey said they experienced bullying.
Of that 9%, 63% said the top type was ‘Incivility (e.g. talking down to others, making demeaning remarks, not listening to somebody)’.
If you experienced bullying, what type of bullying did you experience?
You2020
You2021
Comparator 2021
Public sector 2021
Incivility (e.g. talking down to others, making demeaning remarks, not listening to somebody)
57% 63% 65% 69%
Intimidation and/or threats 24% 40% 34% 32%
Exclusion or isolation 45% 35% 38% 42%
Withholding essential information for me to do my job 29% 20% 32% 27%
Verbal abuse 18% 18% 21% 20%
Other 2% 13% 12% 15%
Being given impossible assignment(s) 16% 8% 13% 9%
Interference with my personal property and/or work equipment 4% 8% 4% 4%
Being assigned meaningless tasks unrelated to the job 8% 5% 10% 13%
Have you experienced bullying at work in the last 12 months?
Experienced bullying Did not experience bullying Not sure
20People Matter Survey | results 20

People outcomesTelling someone about the bullying
What this is
This is if staff told someone when they experienced bullying.
Why this is important
By understanding how staff report bullying, organisations can plan how to support and protect staff.
How to read this
In the survey, we asked staff to tell us if they’d experienced bullying at work.
If they did, they could tell us with one or more answers who they told about it.
In descending order, the table shows the answers.
Example
9% of your staff who did the survey said they experienced bullying, of which
• 58% said the top way they reported the bullying was 'Told a manager'.
• 88% said they didn't submit a formal complaint.
Did you tell anyone about the bullying?You2020
You2021
Comparator 2021
Public sector 2021
Told a manager 53% 58% 45% 47%
Told a colleague 27% 45% 43% 42%
Told Human Resources 24% 18% 18% 12%
Told a friend or family member 22% 15% 33% 34%
Submitted a formal complaint 8% 13% 11% 12%
Told employee assistance program (EAP) or peer support 0% 10% 10% 9%
Told the person the behaviour was not OK 0% 10% 15% 17%
Told someone else 4% 8% 12% 12%
I did not tell anyone about the bullying 20% 5% 12% 12%
Have you experienced bullying at work in the last 12 months?
Experienced bullying Did not experience bullying Not sure
21People Matter Survey | results 21

People outcomesBullying - reasons for not submitting a formal complaint
What this is
This is why staff who experienced bullying chose not to submit a formal complaint.
Why this is important
By understanding this, organisations can plan how to support staff.
How to read this
In the survey, we asked staff to tell us if they’d experienced bullying at work. We then asked them if they submitted a formal complaint. If they didn’t, they could tell us with one or more answers why not. In descending order, the table shows the top 10 answers.
Example
88% of your staff who experienced bullying did not submit a formal complaint, of which:
• 49% said the top reason was 'I didn't think it would make a difference'.
Please tell us why you did not submit a formal complaint?You2020
You2021
Comparator 2021
Public sector 2021
I didn't think it would make a difference 0% 49% 51% 50%
I believed there would be negative consequences for my reputation 0% 40% 50% 53%
I believed there would be negative consequences for my career 0% 17% 38% 40%
Other 0% 17% 11% 12%
I didn't feel safe to report the incident 0% 14% 15% 19%
I didn't need to because I no longer had contact with the person(s) who bullied me
0% 14% 8% 8%
I didn't know how to make a complaint 0% 11% 4% 5%
I didn't need to because I made the bullying stop 0% 11% 7% 7%
I believed there would be negative consequences for the person I was going to complain about
0% 6% 10% 10%
I thought the complaint process would be embarrassing or difficult 0% 6% 12% 14%
Did you submit a formal complaint?
Submitted formal complaint Did not submit a formal complaint
22People Matter Survey | results 22

People outcomesPerpetrators of bullying
What this is
This is who staff have said are responsible for bullying.
Why this is important
Understanding where bullying happens means organisations can work out what action to take.
How to read this
In this year’s survey, 9% of your staff said they experienced bullying.
If they did, they could tell us with one or more answers who the perpetrator was.
In descending order, the bar chart shows the perpetrators with the largest number of responses.
Each row is one perpetrator or group of perpetrators.
Example
9% of your staff who did the survey said they experienced bullying.
Of that 9%, 48% said it was by 'Colleague'.
40 people (9% of staff) experienced bullying (You 2021)
Colleague
A more senior manager than my manager
My immediate manager or supervisor
Group of colleagues
Client/ customer/ patient/ stakeholder
Someone I supervise or manage
A volunteer with my organisation
Member of the public
Member of your household
23People Matter Survey | results 23

People outcomesFrequency of bullying
What this is
This is how often staff experienced bullying.
Why this is important
Understanding how often bullying happens means organisations can work out what action to take.
How to read this
In this year’s survey, 9% of your staff said they experienced bullying.
If they did, they could tell us how often they experienced this behaviour.
Example
9% of your staff who did the survey said they experienced bullying.
Of that 9%, 3% said it was 'At least once a day'.
How often have you experienced bullying? (You 2021)
At least once a day
Once every few days
Once a week
Once a month
Less than once a month
24People Matter Survey | results 24

People outcomesSexual harassment
What this is
This is non-consensual or unwelcome sexual behaviour that could cause an employee to feel offended, humiliated or intimidated.
Why this is important
Sexual harassment can have an immediate and long-term negative impact on those involved, including those who witness sexual harassment.
Why there is no data here
We've not published the results for this section because less than 10 people said they experienced sexual harassment.
We do this to protect the respondents.
25People Matter Survey | results 25

People outcomesType of discrimination
What this is
This is what types of discrimination staff report experiencing in their organisation.
Why this is important
Understanding what types of discrimination happen means an organisation can work out what action to take.
How to read this
In the survey, we asked staff to tell us if they’d experienced discrimination.
If they did, they could tell us with one or more answers what they experienced.
In descending order, the table shows the top 10 types.
Example
4% of your staff who did the survey said they experienced discrimination.
Of that 4%, 40% said it was 'Opportunities for promotion'.
If you experienced discrimination, what type of discrimination did you experience?
You2020
You2021
Comparator 2021
Public sector 2021
Opportunities for promotion 20% 40% 25% 37%
Other 40% 33% 39% 38%
Employment security - threats of dismissal or termination 30% 27% 20% 11%
Denied flexible work arrangements or other adjustments 0% 13% 19% 21%
Opportunities for training 20% 13% 22% 24%
Opportunities for transfer/secondment 0% 13% 5% 19%
Access to leave 0% 7% 7% 8%
Have you experienced discrimination at work in the last 12 months?
Experienced discrimination Did not experience discrimination Not sure
26People Matter Survey | results 26

People outcomesTelling someone about the discrimination
What this is
This is who staff told about the discrimination they experienced.
Why this is important
Understanding who staff tell about their discrimination can inform how organisations can support staff.
How to read this
In the survey, we asked staff to tell us if they’d experienced discrimination.
If they did, they could tell us with one or more answers who they told.
In descending order, the table shows the answers.
Example
4% of your staff who did the survey said they experienced discrimination, of which
• 33% said the top way they reported the discrimination was 'Told Human Resources'.
• 93% said they didn't submit a formal complaint.
Did you tell anyone about the discrimination?You2020
You2021
Comparator 2021
Public sector 2021
Told Human Resources 30% 33% 13% 10%
I did not tell anyone about the discrimination 10% 27% 18% 24%
Told a manager 40% 27% 28% 28%
Told a colleague 50% 20% 39% 38%
Told someone else 10% 13% 15% 14%
Told the person the behaviour was not OK 0% 13% 10% 9%
Submitted a formal complaint 0% 7% 7% 8%
Told a friend or family member 50% 7% 31% 32%
Told employee assistance program (EAP) or peer support 0% 7% 15% 8%
Have you experienced discrimination at work in the last 12 months?
Experienced discrimination Did not experience discrimination Not sure
27People Matter Survey | results 27
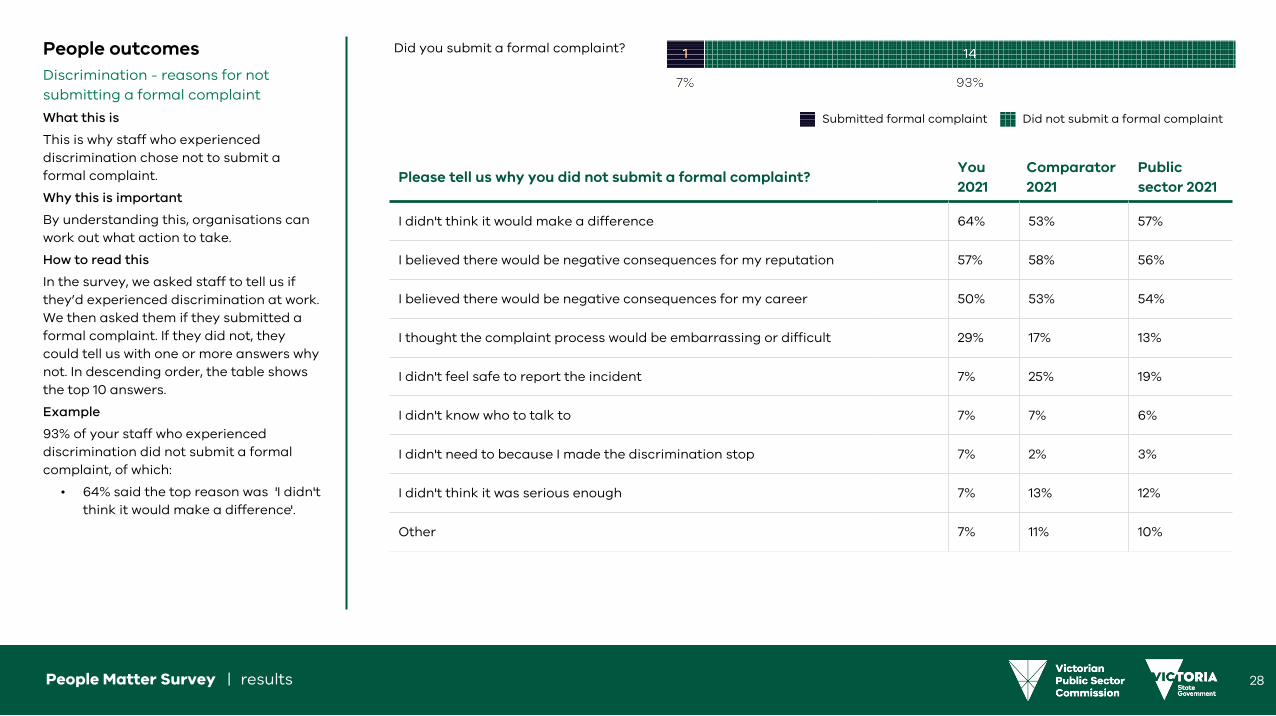
People outcomesDiscrimination - reasons for not submitting a formal complaint
What this is
This is why staff who experienced discrimination chose not to submit a formal complaint.
Why this is important
By understanding this, organisations can work out what action to take.
How to read this
In the survey, we asked staff to tell us if they’d experienced discrimination at work. We then asked them if they submitted a formal complaint. If they did not, they could tell us with one or more answers why not. In descending order, the table shows the top 10 answers.
Example
93% of your staff who experienced discrimination did not submit a formal complaint, of which:
• 64% said the top reason was 'I didn't think it would make a difference'.
Please tell us why you did not submit a formal complaint?You2020
You2021
Comparator 2021
Public sector 2021
I didn't think it would make a difference 0% 64% 53% 57%
I believed there would be negative consequences for my reputation 0% 57% 58% 56%
I believed there would be negative consequences for my career 0% 50% 53% 54%
I thought the complaint process would be embarrassing or difficult 0% 29% 17% 13%
I didn't feel safe to report the incident 0% 7% 25% 19%
I didn't know who to talk to 0% 7% 7% 6%
I didn't need to because I made the discrimination stop 0% 7% 2% 3%
I didn't think it was serious enough 0% 7% 13% 12%
Other 0% 7% 11% 10%
Did you submit a formal complaint?
Submitted formal complaint Did not submit a formal complaint
28People Matter Survey | results 28

People outcomesFrequency of discrimination
What this is
This is how often staff experienced discrimination.
Why this is important
Understanding the frequency staff experienced discrimination may help organisations work out what action to take.
How to read this
In this year’s survey, 4% of your staff said they experienced discrimination.
If they did, they could tell us how often they experienced this behaviour.
The graph shows how often staff were experiencing discrimination.
Example
4% of your staff who did the survey said they experienced discrimination.
Of that 4%, 7% said it was 'At least once a day’.
How often have you experienced the behaviour(s)? (You 2021)
At least once a day
Once every few days
Once a week
Once a month
Less than once a month
29People Matter Survey | results 29

Negative behaviourViolence and aggression
What this is
This is when staff are abused, threatened or assaulted in a situation related to their work.
Why this is important
Violence and aggression can have an immediate and long-term negative impact of those involved, including those who witness violence and aggression.
How to read this
In the survey, we asked staff to tell us if they’d experienced violence or aggression.
If they did, they could tell us with one or more answers what they experienced.
In descending order, the table shows the answers.
Example
4% of your staff who did the survey said they experienced violence or aggression.
Of that 4%, 61% said it was from ‘Intimidating behaviour’.
If you experienced violence or aggression, what type did you experience?
You2020
You2021
Comparator 2021
Public sector 2021
Intimidating behaviour 80% 61% 73% 69%
Abusive language 60% 44% 56% 81%
Other 12% 17% 9% 12%
Have you experienced violence or aggression at work in the last 12 months?
Experienced violence or aggression Did not experience violence or aggression Not sure
30People Matter Survey | results 30

Negative behaviourTelling someone about violence and aggression
What this is
This is who staff told about what violence and aggression they experienced.
Why this is important
Understanding this means organisations can plan how to support and protect staff.
How to read this
In the survey, we asked staff to tell us if they’d experienced violence or aggression.
If they did, they could tell us with one or more answers who they told.
In descending order, the table shows the answers.
Example
4% of your staff who did the survey said they experienced violence or aggression, fo which
• 78% said the top way they reported the violence or agression was 'Told a manager'
• 83% said they didn't submit a formal incident report.
Did you tell anyone about the incident? You2020
You2021
Comparator 2021
Public sector 2021
Told a manager 60% 78% 57% 52%
Told a colleague 32% 39% 44% 46%
Told the person the behaviour was not OK 0% 33% 23% 33%
Submitted a formal incident report 16% 17% 19% 32%
Told someone else 12% 17% 9% 6%
Told a friend or family member 12% 11% 21% 20%
Told employee assistance program (EAP) or peer support 0% 6% 8% 3%
Told Human Resources 28% 6% 11% 4%
Have you experienced violence or aggression at work in the last 12 months?
Experienced violence or aggression Did not experience violence or aggression Not sure
31People Matter Survey | results 31

Negative behaviourViolence and aggression - reasons for not submitting a formal incident report
What this is
This is why staff who experienced violence or aggression chose not to submit a formal incident report.
Why this is important
By understanding this, organisations can work out what action to take.
How to read this
In the survey, we asked staff to tell us if they’d experienced violence or aggression at work. We then asked them if they submitted a formal incident report. If they did not, they could tell us with one or more answers why not. In descending order, the table shows the top 10 answers.
Example
83% of your staff who experienced violence or aggression did not submit a formal incident report, of which:
• 47% said the top reason was 'Other'.
Please tell us why you did not submit a formal incident report?You2020
You2021
Comparator 2021
Public sector 2021
Other 0% 47% 17% 12%
I didn't need to because I no longer had contact with the person(s) who was aggressive or violent to me
0% 27% 13% 15%
I didn't think it was serious enough 0% 20% 22% 33%
I didn't think it would make a difference 0% 20% 36% 39%
I believed there would be negative consequences for my reputation 0% 13% 28% 16%
I believed there would be negative consequences for the person I was going to complain about
0% 13% 7% 4%
I didn't need to because I made the violence or aggression stop 0% 13% 12% 16%
I believed there would be negative consequences for my career 0% 7% 22% 12%
I didn't feel safe to report the incident 0% 7% 11% 5%
I didn't know how to make a complaint 0% 7% 4% 3%
Did you submit a formal incident report?
Submitted formal incident report Did not submit a formal incident report
32People Matter Survey | results 32

Negative behaviourPerpetrators of violence and aggression
What this is
This is who staff have said are responsible for violence and aggression.
Why this is important
Understanding this means organisations can plan how to support and protect staff.
How to read this
In the survey, we asked staff to tell us if they’d experienced violence or aggression.
If they did, they could tell us with one or more answers who the perpetrator was.
In descending order, the bar chart shows the perpetrators with the largest number of responses.
Each row is one perpetrator or a group of perpetrators.
Example
4% of your staff who did the survey said they experienced violence or aggression.
Of that 4%, 56% said it was 'Client/ customer/ patient/ stakeholder'.
18 people (4% of staff) experienced violence or aggression (You 2021)
Client/ customer/ patient/ stakeholder
Member of the public
Colleague
A more senior manager than my manager
My immediate manager or supervisor
A volunteer with my organisation
Group of colleagues
Member of your household
Someone I supervise or manage
33People Matter Survey | results 33

Negative behaviourFrequency of violence and aggression
What this is
This is how often staff experienced violence or aggression.
Why this is important
Understanding the frequency staff experienced violence or aggression may help organisations work out what action to take.
How to read this
In this year’s survey, 4% of your staff said they experienced violence or aggression.
If they did, they could tell us how often they experienced this behaviour.
The graph shows how often staff were experiencing violence or aggression.
Example
4% of your staff who did the survey said they experienced violence or aggression.
Of that 4%, 0% said it was by 'At least once a day’.
How often have you experienced the behaviour(s)? (You 2021)
At least once a day
Once every few days
Once a week
Once a month
Less than once a month
34People Matter Survey | results 34

Negative behaviourWitnessing negative behaviours
What this is
This is where staff witnessed people acting in a negative way against a colleague.
Why this is important
Witnessing negative behaviour can still have a negative impact on the person, as it does on the victim.
How to read this
In the survey, we asked staff to tell us if they’d witnessed any negative behaviour at work.
They could tell us with one or more answers if they witnessed negative behaviour and what type they witnessed.
In descending order, the table shows the answers.
Example
10% of your staff who did the survey said they witnessed some negative behaviour at work.
90% said they witnessed No, I have not witnessed any of the situations above'.
During the last 12 months in your current organisation, have you witnessed any of the following negative behaviours at work?
You2020
You2021
Comparator 2021
Public sector 2021
No, I have not witnessed any of the situations above 0% 90% 81% 77%
Bullying of a colleague 0% 7% 15% 16%
Discrimination against a colleague 0% 4% 6% 8%
Violence or aggression against a colleague 0% 2% 2% 6%
Sexual harassment of a colleague 0% 0% 1% 1%
Have you witnessed any negative behaviour at work in the last 12 months?
Witnessed some negative behaviour Did not witness some negative behaviour
35People Matter Survey | results 35

Negative behaviourTaking action when witnessing negative behaviours
What this is
This is what your staff did when they witnessed negative behaviour at work.
Why this is important
What staff do when they witness negative behaviour may help organisations understand what support their staff need.
How to read this
In the survey, we asked staff to tell us if they’d witnessed any negative behaviour at work.
If they did, they could tell us with one or more answers what action they took.
The table shows the answers in descending order.
Example
10% of your staff who did the survey witnessed negative behaviour, of which:
• 64% said the top action they took was 'Spoke to the person who experienced the behaviour'.
• 9% took no action.
When you witnessed the above behaviour(s), did you do any of the following?
You2020
You2021
Comparator 2021
Public sector 2021
Spoke to the person who experienced the behaviour 0% 64% 72% 72%
Told a manager 0% 32% 33% 37%
Told a colleague 0% 23% 23% 21%
Spoke to the person who behaved in a negative way 0% 16% 15% 22%
Other 0% 11% 6% 7%
Told Human Resources 0% 11% 9% 6%
Told the person the behaviour was not OK 0% 9% 20% 25%
Took no action 0% 9% 8% 7%
Submitted a formal complaint 0% 5% 4% 6%
Have you witnessed any negative behaviour at work in the last 12 months?
Witnessed some negative behaviour Did not witness some negative behaviour
36People Matter Survey | results 36

People outcomesNegative behaviour — satisfaction with making a formal complaint
What this is
This is how satisfied a staff member was with how your organisation managed their complaint.
Why this is important
When staff submit a formal complaint for negative behaviours, they should feel your organisation will manage it effectively and professionally.
How to read this
Under ‘Your results’, see results for each question in descending order by yes.
Under ‘Benchmark results’, compare your comparator groups overall, lowest and highest scores with your own.
Example
33% of staff who did the survey were satisfied with the way your organisation handled their formal 'Violence or aggression' complaint.
Violence or aggression20 %
Not asked
33 % 0 % 45 % 63 %
Bullying17 %
Not asked
20 % 0 % 24 % 50 %
Discrimination0 %
Not asked
0 % 0 % 0 % 0 %
Survey question Your results Benchmark satisfied results
Were you satisfied with the way your formal complaint was handled
No Don't know
Yes
You Comparator
2019 2020 2021 Lowest Average Highest
37People Matter Survey | results 37

38People Matter Survey | results 38

Key differencesHighest scoring questions
What this is
These are the questions your organisation had the highest agreement or satisfaction with in 2021.
How to read this
Use this data to see where your organisation has the highest agreement or satisfaction with questions from the 2021 survey.
In this table, your score for this year is shown in the ‘you 2021 column’.
You can also compare your 2021 scores against your 2020 scores and your 2021 comparator group.
Example
On the first row ‘Workgroup support’, the ‘You 2021’ column shows 94% of your staff agreed with 'I am able to work effectively with others in my workgroup'.In the ‘Change from 2020’ column, you have a 3% increase, which is a positive trend.
Question group Highest scoring questionsYou2021
Changefrom 2020
Comparator 2021
Workgroup support I am able to work effectively with others in my workgroup 94% +3% 89%
Quality service delivery
My workgroup values human rights 92%Not asked in 2020
84%
Job enrichmentI understand how my job contributes to my organisation’s purpose
92% -2% 89%
Workgroup supportPeople in my workgroup actively support diversity and inclusion in the workplace
91%Not asked in 2020
84%
Workgroup supportI am able to work effectively with others outside my immediate workgroup
90% +4% 86%
Manager leadership My manager treats employees with dignity and respect 90%Not asked in 2020
83%
Organisational integrity
My organisation encourages respectful workplace behaviours
89%Not asked in 2020
80%
Workgroup support People in my workgroup treat each other with respect 89% +2% 82%
Manager leadership My manager is committed to workplace safety 89%Not asked in 2020
85%
Manager leadershipMy manager works effectively with people from diverse backgrounds
89%Not asked in 2020
85%
39People Matter Survey | results 39

Key differencesLowest scoring questions
What this is
These are the questions your organisation had the lowest agreement or satisfaction with in 2021.
How to read this
Use this data to see where your organisation has the lowest agreement or satisfaction with questions from the 2021 survey.
In this table, your score for this year is shown in the ‘you 2021 column’.
You can also compare your 2021 scores against your 2020 scores and your 2021 comparator group.
Example
On the first row ‘Learning and development’, the ‘You 2021’ column shows 21% of your staff agreed with 'I am satisfied with the availability of opportunities to take up roles in other organisations (e.g. temporary or permanent transfers or secondments)'.This question was not asked in 2020.
Question subgroup Lowest scoring questionsYou2021
Changefrom 2020
Comparator 2021
Learning and development
I am satisfied with the availability of opportunities to take up roles in other organisations (e.g. temporary or permanent transfers or secondments)
21%Not asked in 2020
25%
Learning and development
I am satisfied with the availability of opportunities to move between roles within my organisation (e.g. temporary or permanent transfers)
35%Not asked in 2020
35%
Workload I have enough time to do my job effectively 42% -5% 48%
Learning and development
I feel I have an equal chance at promotion in my organisation
43%Not asked in 2020
39%
Workload The workload I have is appropriate for the job that I do 48% -7% 54%
Safety climateAll levels of my organisation are involved in the prevention of stress
49% -11% 40%
Taking actionMy organisation has taken positive action on the results of last year’s survey
50%Not asked in 2020
31%
Learning and development
I am satisfied with the way my learning and development needs have been addressed in the last 12 months
51%Not asked in 2020
52%
Organisational integrity
My organisation makes fair recruitment and promotion decisions, based on merit
52%Not asked in 2020
49%
Workgroup supportWorkgroups across my organisation willingly share information with each other
54% -7% 49%
40People Matter Survey | results 40

Key differencesMost improved
What this is
This is where staff feel their organisation has most improved.
How to read this
Use this data to see if your organisation has a developing or changing trend.
In this table, your trend is shown in the ‘Increase from 2020’ column.
When you use this data, focus on the increase instead of individual numbers.
This is because the increase from 2020 shows you where the most positive changes are happening in your organisation.
Example
On the first row ‘Job enrichment’, the ‘You 2021’ column shows 78% of your staff agreed with 'I have a choice in deciding how I do my work'.In the ‘Increase from 2020’ column, you have a 7% increase, which is a positive trend.
Question group Most improved from last yearYou2021
Increasefrom 2020
Comparator 2021
Job enrichment I have a choice in deciding how I do my work 78% +7% 74%
Manager support My manager involves me in decisions about my work 81% +4% 76%
Workgroup supportI am able to work effectively with others outside my immediate workgroup
90% +4% 86%
Workgroup support I am able to work effectively with others in my workgroup 94% +3% 89%
Workgroup supportPeople in my workgroup work together effectively to get the job done
84% +2% 81%
SatisfactionHow satisfied are you with the work-life balance in your current job
66% +2% 65%
Workgroup support People in my workgroup treat each other with respect 89% +2% 82%
Safe to speak upPeople in your workgroup are able to bring up problems and tough issues
78% +1% 71%
41People Matter Survey | results 41

Key differencesMost declined
What this is
This is where staff feel their organisation has most declined.
How to read this
Use this data to see if your organisation has a developing or changing trend.
In this table, your trend is shown in the ‘Decrease from 2020’ column.
When you use this data, focus on the decrease instead of individual numbers.
This is because the decrease from 2020 shows you where the most negative changes are happening in your organisation.
Example
On the first row ‘Safety climate’, the ‘You 2021’ column shows 54% of your staff agreed with 'Senior leaders show support for stress prevention through involvement and commitment'.In the ‘Decrease from 2020’ column, you have a 16% decrease, which is a negative trend.
Question subgroup Largest decline from last yearYou2021
Decreasefrom 2020
Comparator 2021
Safety climateSenior leaders show support for stress prevention through involvement and commitment
54% -16% 48%
Safety climateSenior leaders consider the psychological health of employees to be as important as productivity
58% -15% 50%
Senior leadershipSenior leaders support staff to work in an environment of change
61% -14% 58%
Senior leadership Senior leaders provide clear strategy and direction 61% -13% 58%
EngagementI would recommend my organisation as a good place to work
68% -12% 67%
Safety climateAll levels of my organisation are involved in the prevention of stress
49% -11% 40%
Engagement I feel a strong personal attachment to my organisation 63% -11% 64%
SatisfactionConsidering everything, how satisfied are you with your current job
70% -8% 69%
Safety climateIn my workplace, there is good communication about psychological safety issues that affect me
60% -8% 51%
Workgroup supportWorkgroups across my organisation willingly share information with each other
54% -7% 49%
42People Matter Survey | results 42

Key differencesBiggest positive difference from comparator
What this is
This is where your staff have agreed more to a question compared to staff at similar organisations.
How to read this
Use this data to see where your organisation has the biggest positive difference with questions from the 2021 survey compared to your comparator group.
In this table, the difference to your comparator is shown in the ‘difference’ column.
Example
On the first row ‘Diversity and inclusion’, the ‘You 2021’ column shows 84% of your staff agreed with 'There is a positive culture within my organisation in relation to employees who identify as LGBTIQ+'.
The 'difference' column, shows that agreement for this question was 22 percentage points higher in your organisation than in your comparator.
Question group Biggest positive difference from comparatorYou2021 Difference
Comparator 2021
Diversity and inclusionThere is a positive culture within my organisation in relation to employees who identify as LGBTIQ+
84% +22% 62%
Taking actionMy organisation has taken positive action on the results of last year’s survey
50% +20% 31%
Workplace flexibilityThere is a positive culture within my organisation in relation to employees who use flexible work arrangements
77% +19% 59%
Workplace flexibilityUsing flexible work arrangements is not a barrier to success in my organisation
77% +18% 59%
Diversity and inclusionThere is a positive culture within my organisation in relation to employees who are Aboriginal and / or Torres Strait Islander
82% +15% 67%
Organisational integrity
My organisation takes steps to eliminate bullying, harassment and discrimination
82% +15% 67%
Diversity and inclusionThere is a positive culture within my organisation in relation to employees with disability
80% +15% 66%
Workplace flexibilityI am confident that if I requested a flexible work arrangement, it would be given due consideration
82% +14% 67%
Workplace flexibilityThere is a positive culture within my organisation in relation to employees who have caring responsibilities
74% +13% 61%
Equal employment opportunity
Disability is not a barrier to success in my organisation 79% +13% 66%
43People Matter Survey | results 43

Key differencesBiggest negative difference from comparator
What this is
This is where your staff have agreed less to a question compared to staff at similar organisations.
How to read this
Use this data to see where your organisation has the biggest negative difference with questions from the 2021 survey compared to your comparator group.
In this table, the difference to your comparator is shown in the ‘difference’ column.
Example
On the first row ‘Workload’, the ‘You 2021’ column shows 42% of your staff agreed with 'I have enough time to do my job effectively'.
The 'difference' column, shows that agreement for this question was 6 percentage points lower in your organisation than in your comparator.
Question subgroup Biggest negative difference from comparatorYou2021 Difference
Comparator 2021
Workload I have enough time to do my job effectively 42% -6% 48%
Workload The workload I have is appropriate for the job that I do 48% -5% 54%
Satisfaction I enjoy the work in my current job 76% -5% 81%
Learning and development
I am satisfied with the availability of opportunities to take up roles in other organisations (e.g. temporary or permanent transfers or secondments)
21% -3% 25%
Satisfaction I get a sense of accomplishment from my work 79% -3% 81%
Learning and development
In the last 12 months I have learned skills that have helped me do my job better
68% -2% 70%
Engagement I feel a strong personal attachment to my organisation 63% -1% 64%
Job enrichment My work performance is assessed against clear criteria 55% -1% 56%
Learning and development
I am satisfied with the way my learning and development needs have been addressed in the last 12 months
51% -1% 52%
Learning and development
I am satisfied with the availability of opportunities to move between roles within my organisation (e.g. temporary or permanent transfers)
35% 0% 35%
44People Matter Survey | results 44

45People Matter Survey | results 45

Taking actionWhat this is
This is how well staff feel their organisation takes action and makes improvements from your survey results.
Why this is important
If your organisation takes action as a result of survey results, your staff may feel their feedback is valuable.
How to read this
Under ‘Your results’, see results for each question in descending order by most agreed.
‘Agree’ combines responses for agree and strongly agree and ‘Disagree’ combines responses for disagree and strongly disagree.
Under ‘Benchmark results’, compare your comparator groups overall, lowest and highest scores with your own.
Example
63% of your staff who did the survey agreed or strongly agreed with 'I believe my organisation will take positive action on the results of this year’s survey'.
I believe my organisation will take positive action on the results of this year’s survey
Not asked
Not asked
63 % 36 % 50 % 58 %
My organisation has taken positive action on the results of last year’s survey
Not asked
Not asked
50 % 15 % 31 % 44 %
Survey question Your results Benchmark agree results
Disagree Neither agree nor disagree
Don't know Agree
You Comparator
2019 2020 2021 Lowest Average Highest
46People Matter Survey | results 46

47People Matter Survey | results 47

Senior leadershipSenior leadership 1 of 2
What this is
This is how supported staff feel by senior leaders in their organisation and how well they believe senior leaders communicate.
Why this is important
Supportive senior leaders who communicate well mean staff may feel more connected to their work and organisation.
How to read this
Under ‘Your results’, see results for each question in descending order by most agreed.
‘Agree’ combines responses for agree and strongly agree and ‘Disagree’ combines responses for disagree and strongly disagree.
Under ‘Benchmark results’, compare your comparator groups overall, lowest and highest scores with your own.
Example
82% of your staff who did the survey agreed or strongly agreed with 'Senior leaders actively support diversity and inclusion in the workplace'.
Senior leaders actively support diversity and inclusion in the workplace
79 %Not
asked82 % 62 % 70 % 80 %
Senior leaders model my organisation's values
71 %Not
asked66 % 47 % 61 % 73 %
Senior leaders demonstrate honesty and integrity
72 %Not
asked61 % 47 % 60 % 73 %
Senior leaders support staff to work in an environment of change
72 % 75 % 61 % 45 % 58 % 71 %
Survey question Your results Benchmark agree results
Disagree Neither agree nor disagree
Don't know Agree
You Comparator
2019 2020 2021 Lowest Average Highest
48People Matter Survey | results 48
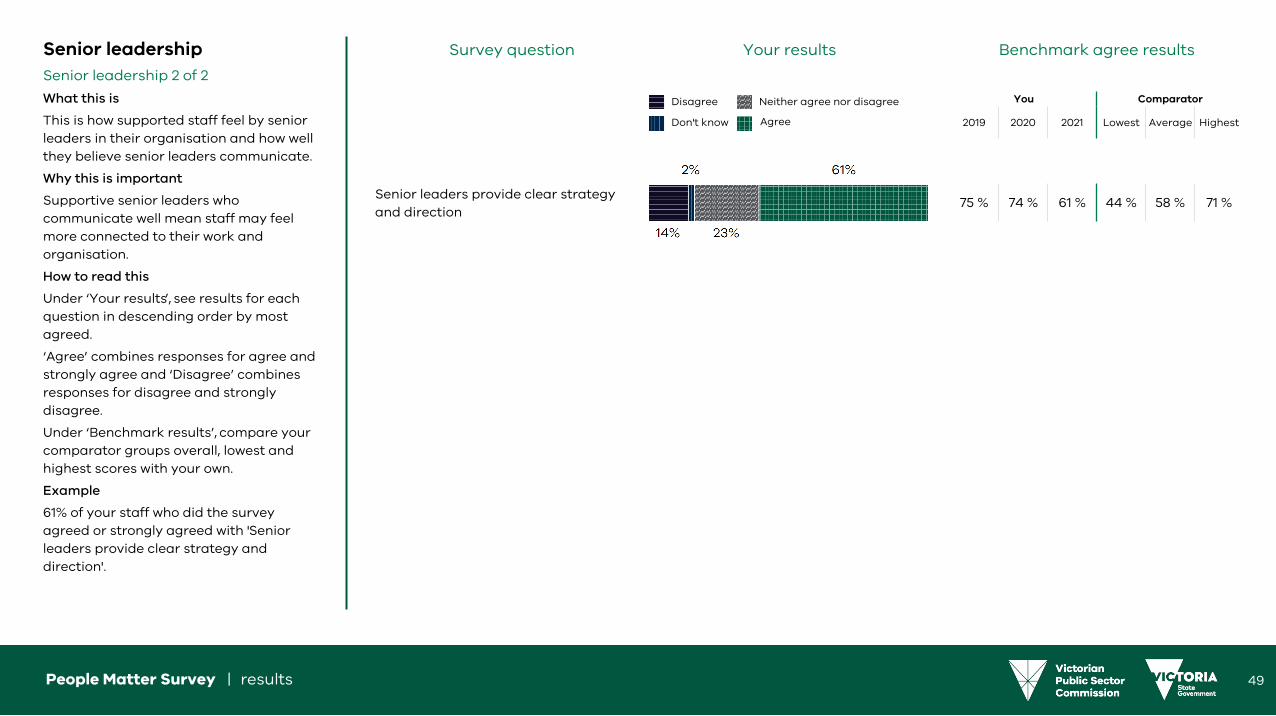
Senior leadershipSenior leadership 2 of 2
What this is
This is how supported staff feel by senior leaders in their organisation and how well they believe senior leaders communicate.
Why this is important
Supportive senior leaders who communicate well mean staff may feel more connected to their work and organisation.
How to read this
Under ‘Your results’, see results for each question in descending order by most agreed.
‘Agree’ combines responses for agree and strongly agree and ‘Disagree’ combines responses for disagree and strongly disagree.
Under ‘Benchmark results’, compare your comparator groups overall, lowest and highest scores with your own.
Example
61% of your staff who did the survey agreed or strongly agreed with 'Senior leaders provide clear strategy and direction'.
Senior leaders provide clear strategy and direction
75 % 74 % 61 % 44 % 58 % 71 %
Survey question Your results Benchmark agree results
Disagree Neither agree nor disagree
Don't know Agree
You Comparator
2019 2020 2021 Lowest Average Highest
49People Matter Survey | results 49

50People Matter Survey | results 50

Organisational climateScorecard 1 of 2
What this is
This scorecard provides overall results for each factor in the organisation climate part of the survey’s theoretical framework.
Why this is important
This page shows which factors are performing well and which factors you can look to improve.
How to read this
Each label represents a group of questions in the survey about organisational climate.
Each result is the overall percentage of positive responses for your organisation, comparator and public sector.
Example
In 2021:
• 82% of your staff who did the survey responded positively to questions about Diversity and inclusion.
Compared to:
• 70% of staff at your comparator and71% of staff across the public sector.
You 2019 You 2020 You 2021 Comparator 2021 Public sector 2021
51People Matter Survey | results 51

Organisational climateScorecard 2 of 2
What this is
This scorecard provides overall results for each factor in the organisation climate part of the survey’s theoretical framework.
Why this is important
This page shows which factors are performing well and which factors you can look to improve.
How to read this
Each label represents a group of questions in the survey about organisational climate.
Each result is the overall percentage of positive responses for your organisation, comparator and public sector.
Example
In 2021:
• 66% of your staff who did the survey responded positively to questions about Safety climate.
Compared to:
• 59% of staff at your comparator and60% of staff across the public sector.
You 2019 You 2020 You 2021 Comparator 2021 Public sector 2021
52People Matter Survey | results 52

Organisational climateOrganisational integrity 1 of 2
What this is
This is how much trust staff have in your organisation's ability to operate, implement policy and deliver services for Victorians.
Why this is important
We need the community to have high trust in how we work and what we do.
How to read this
Under ‘Your results’, see results for each question in descending order by most agreed.
‘Agree’ combines responses for agree and strongly agree and ‘Disagree’ combines responses for disagree and strongly disagree.
Under ‘Benchmark results’, compare your comparator groups overall, lowest and highest scores with your own.
Example
89% of your staff who did the survey agreed or strongly agreed with 'My organisation encourages respectful workplace behaviours'.
My organisation encourages respectful workplace behaviours
86 %Not
asked89 % 73 % 80 % 86 %
My organisation encourages employees to act in ways that are consistent with human rights
86 %Not
asked88 % 73 % 79 % 91 %
My organisation respects the human rights of employees
85 %Not
asked86 % 71 % 78 % 87 %
My organisation takes steps to eliminate bullying, harassment and discrimination
75 %Not
asked82 % 55 % 67 % 73 %
Survey question Your results Benchmark agree results
Disagree Neither agree nor disagree
Don't know Agree
You Comparator
2019 2020 2021 Lowest Average Highest
53People Matter Survey | results 53

Organisational climateOrganisational integrity 2 of 2
What this is
This is how much trust staff have in your organisation's ability to operate, implement policy and deliver services for Victorians.
Why this is important
We need the community to have high trust in how we work and what we do.
How to read this
Under ‘Your results’, see results for each question in descending order by most agreed.
‘Agree’ combines responses for agree and strongly agree and ‘Disagree’ combines responses for disagree and strongly disagree.
Under ‘Benchmark results’, compare your comparator groups overall, lowest and highest scores with your own.
Example
81% of your staff who did the survey agreed or strongly agreed with 'My organisation is committed to earning a high level of public trust'.
My organisation is committed to earning a high level of public trust
81 %Not
asked81 % 64 % 74 % 89 %
My organisation does not tolerate improper conduct
74 %Not
asked78 % 53 % 68 % 75 %
My organisation makes fair recruitment and promotion decisions, based on merit
55 %Not
asked52 % 39 % 49 % 58 %
Survey question Your results Benchmark agree results
Disagree Neither agree nor disagree
Don't know Agree
You Comparator
2019 2020 2021 Lowest Average Highest
54People Matter Survey | results 54

Organisational climateWorkplace flexibility 1 of 4
What this is
This is how well you organisation supports staff to work flexibly.
Why this is important
Supporting flexible working can improve employee wellbeing.
How to read this
Under ‘Your results’, see results for each question in descending order by most agreed.
‘Agree’ combines responses for agree and strongly agree and ‘Disagree’ combines responses for disagree and strongly disagree.
Under ‘Benchmark results’, compare your comparator groups overall, lowest and highest scores with your own.
Example
82% of your staff who did the survey agreed or strongly agreed with 'I am confident that if I requested a flexible work arrangement, it would be given due consideration'.
I am confident that if I requested a flexible work arrangement, it would be given due consideration
75 % 83 % 82 % 58 % 67 % 72 %
My organisation supports employees with family or other caring responsibilities, regardless of gender
Not asked
Not asked
78 % 63 % 69 % 79 %
There is a positive culture within my organisation in relation to employees who use flexible work arrangements
77 %Not
asked77 % 46 % 59 % 64 %
Using flexible work arrangements is not a barrier to success in my organisation
Not asked
Not asked
77 % 52 % 59 % 64 %
Survey question Your results Benchmark agree results
Disagree Neither agree nor disagree
Don't know Agree
You Comparator
2019 2020 2021 Lowest Average Highest
55People Matter Survey | results 55

Organisational climateWorkplace flexibility 2 of 4
What this is
This is how well you organisation supports staff to work flexibly.
Why this is important
Supporting flexible working can improve employee wellbeing.
How to read this
Under ‘Your results’, see results for each question in descending order by most agreed.
‘Agree’ combines responses for agree and strongly agree and ‘Disagree’ combines responses for disagree and strongly disagree.
Under ‘Benchmark results’, compare your comparator groups overall, lowest and highest scores with your own.
Example
75% of your staff who did the survey agreed or strongly agreed with 'There is a positive culture within my organisation in relation to employees who have family responsibilities'.
There is a positive culture within my organisation in relation to employees who have family responsibilities
Not asked
Not asked
75 % 53 % 63 % 70 %
I have the flexibility I need to manage my work and non-work activities and responsibilities
Not asked
Not asked
74 % 64 % 70 % 75 %
There is a positive culture within my organisation in relation to employees who have caring responsibilities
83 %Not
asked74 % 51 % 61 % 67 %
Having family responsibilities is not a barrier to success in my organisation
Not asked
Not asked
74 % 57 % 61 % 66 %
Survey question Your results Benchmark agree results
Disagree Neither agree nor disagree
Don't know Agree
You Comparator
2019 2020 2021 Lowest Average Highest
56People Matter Survey | results 56

Organisational climateWorkplace flexibility 3 of 4
What this is
This is how well you organisation supports staff to work flexibly.
Why this is important
Supporting flexible working can improve employee wellbeing.
How to read this
Under ‘Your results’, see results for each question in descending order by most agreed.
‘Agree’ combines responses for agree and strongly agree and ‘Disagree’ combines responses for disagree and strongly disagree.
Under ‘Benchmark results’, compare your comparator groups overall, lowest and highest scores with your own.
Example
71% of your staff who did the survey agreed or strongly agreed with 'Having caring responsibilities is not a barrier to success in my organisation'.
Having caring responsibilities is not a barrier to success in my organisation
78 %Not
asked71 % 52 % 58 % 63 %
Survey question Your results Benchmark agree results
Disagree Neither agree nor disagree
Don't know Agree
You Comparator
2019 2020 2021 Lowest Average Highest
57People Matter Survey | results 57

Organisational climateWorkplace flexibility 4 of 4
What this is
This is how well you organisation supports staff to work flexibly.
Why this is important
Supporting flexible working can improve employee wellbeing.
How to read this
The table shows you what flexible work arrangements staff use.
Each row represents one use. Staff can select more than one.
You can compare between your organisation, comparator and the public sector.
Example
44% of staff who did the survey said the flexible work arrangement they used was ‘Working from an alternative location (e.g. home, hub/shared work space)’.
Do you use any of the following flexible work arrangements?You 2020
You2021
Comparator 2021
Public sector 2021
Working from an alternative location (e.g. home, hub/shared work space) 44% 35% 24%
No, I do not use any flexible work arrangements 34% 44% 38%
Flexible start and finish times 29% 18% 23%
Part-time 13% 14% 19%
Using leave to work flexible hours 4% 4% 8%
Working more hours over fewer days 3% 3% 6%
Other 3% 2% 2%
Purchased leave 2% 1% 2%
Shift swap 1% 2% 12%
Job sharing 1% 1% 1%
58People Matter Survey | results 58

Organisational climateEqual employment opportunity 1 of 2
What this is
This is how well staff feel your organisation supports equal opportunity in the workplace.
Why this is important
This is a Victorian employment principle and is set out in the charter of Human Rights and Responsibilities Act 2006.
How to read this
Under ‘Your results’, see results for each question in descending order by most agreed.
‘Agree’ combines responses for agree and strongly agree and ‘Disagree’ combines responses for disagree and strongly disagree.
Under ‘Benchmark results’, compare your comparator groups overall, lowest and highest scores with your own.
Example
85% of your staff who did the survey agreed or strongly agreed with 'Sexual orientation is not a barrier to success in my organisation'.
Sexual orientation is not a barrier to success in my organisation
87 %Not
asked85 % 65 % 74 % 82 %
Gender is not a barrier to success in my organisation
Not asked
Not asked
84 % 71 % 78 % 86 %
Cultural background is not a barrier to success in my organisation
88 %Not
asked83 % 68 % 76 % 81 %
Being Aboriginal and/or Torres Strait Islander is not a barrier to success in my organisation
Not asked
Not asked
79 % 60 % 66 % 78 %
Survey question Your results Benchmark agree results
Disagree Neither agree nor disagree
Don't know Agree
You Comparator
2019 2020 2021 Lowest Average Highest
59People Matter Survey | results 59

Organisational climateEqual employment opportunity 2 of 2
What this is
This is how well staff feel your organisation supports equal opportunity in the workplace.
Why this is important
This is a Victorian employment principle and is set out in the charter of Human Rights and Responsibilities Act 2006.
How to read this
Under ‘Your results’, see results for each question in descending order by most agreed.
‘Agree’ combines responses for agree and strongly agree and ‘Disagree’ combines responses for disagree and strongly disagree.
Under ‘Benchmark results’, compare your comparator groups overall, lowest and highest scores with your own.
Example
79% of your staff who did the survey agreed or strongly agreed with 'Disability is not a barrier to success in my organisation'.
Disability is not a barrier to success in my organisation
86 %Not
asked79 % 59 % 66 % 76 %
Age is not a barrier to success in my organisation
83 %Not
asked76 % 68 % 73 % 81 %
Survey question Your results Benchmark agree results
Disagree Neither agree nor disagree
Don't know Agree
You Comparator
2019 2020 2021 Lowest Average Highest
60People Matter Survey | results 60

Organisational climatePsychosocial and physical safety climate question results 1 of 2
What this is
This is how well staff feel your organisation supports safety at work.
Why this is important
A safe workplace is a key outcome of Leading the way and the Victorian public sector mental health and wellbeing charter.
How to read this
Under ‘Your results’, see results for each question in descending order by most agreed.
‘Agree’ combines responses for agree and strongly agree and ‘Disagree’ combines responses for disagree and strongly disagree.
Under ‘Benchmark results’, compare your comparator groups overall, lowest and highest scores with your own.
Example
84% of your staff who did the survey agreed or strongly agreed with 'My organisation provides a physically safe work environment'.
My organisation provides a physically safe work environment
Not asked
Not asked
84 % 75 % 81 % 91 %
I feel culturally safe at work Not asked
Not asked
82 % 74 % 79 % 86 %
My organisation consults employees on health and safety matters
66 %Not
asked72 % 53 % 65 % 74 %
My organisation has effective procedures in place to support employees who may experience stress
65 % 68 % 64 % 48 % 57 % 67 %
Survey question Your results Benchmark agree results
Disagree Neither agree nor disagree
Don't know Agree
You Comparator
2019 2020 2021 Lowest Average Highest
61People Matter Survey | results 61

Organisational climatePsychosocial and physical safety climate question results 2 of 2
What this is
This is how well staff feel your organisation supports safety at work.
Why this is important
A safe workplace is a key outcome of Leading the way and the Victorian public sector mental health and wellbeing charter.
How to read this
Under ‘Your results’, see results for each question in descending order by most agreed.
‘Agree’ combines responses for agree and strongly agree and ‘Disagree’ combines responses for disagree and strongly disagree.
Under ‘Benchmark results’, compare your comparator groups overall, lowest and highest scores with your own.
Example
60% of your staff who did the survey agreed or strongly agreed with 'In my workplace, there is good communication about psychological safety issues that affect me'.
In my workplace, there is good communication about psychological safety issues that affect me
51 % 67 % 60 % 38 % 51 % 55 %
Senior leaders consider the psychological health of employees to be as important as productivity
46 % 73 % 58 % 36 % 50 % 59 %
Senior leaders show support for stress prevention through involvement and commitment
44 % 71 % 54 % 36 % 48 % 56 %
All levels of my organisation are involved in the prevention of stress
38 % 60 % 49 % 28 % 40 % 49 %
Survey question Your results Benchmark agree results
Disagree Neither agree nor disagree
Don't know Agree
You Comparator
2019 2020 2021 Lowest Average Highest
62People Matter Survey | results 62

Organisational climatePsychosocial safety climate score
What this is
Psychosocial safety climate score reflects how well your organisation’s workplace practices and processes support a climate for good psychological health.
How we work out your score
We work out your score from these 4 questions:
1. In my workplace, there is good communication about psychological safety issues that affect me
2. All levels of my organisation are involved in the prevention of stress
3. Senior leaders consider the psychological health of employees to be as important as productivity
4. Senior leaders show support for stress prevention through involvement and commitment
To work out your score, we rate each response and add them together
• strongly agree is 5
• agree is 4
• neither agree or disagree is 3
• disagree is 2
• strongly disagree is 1
You 2019 You 2020 You 2021 Comparator 2021 Public sector 2021
How to interpret your score
Under 'Benchmark results', compare your organisation to your comparator and the highest and lowest score in your comparator group for 2021. We also show the lowest (4) and highest (20) scores possible.
A score of:
• 12 or less indicates a poor climate and a high risk of adverse outcomes
• 13 indicates a moderate climate and medium risk of adverse outcomes
• 14 or more indicates a high climate and low risk of adverse outcomes
Adverse outcomes can include:
• poor work quality
• negative acts such as bullying and harassment
• mental health problems such as depression, distress and emotional exhaustion
• sickness absence
• presenteeism (coming to work when sick)
• worker compensation
• reduced engagement
Positive climate
Poor climate
Moderate climate
Benchmark results
63People Matter Survey | results 63
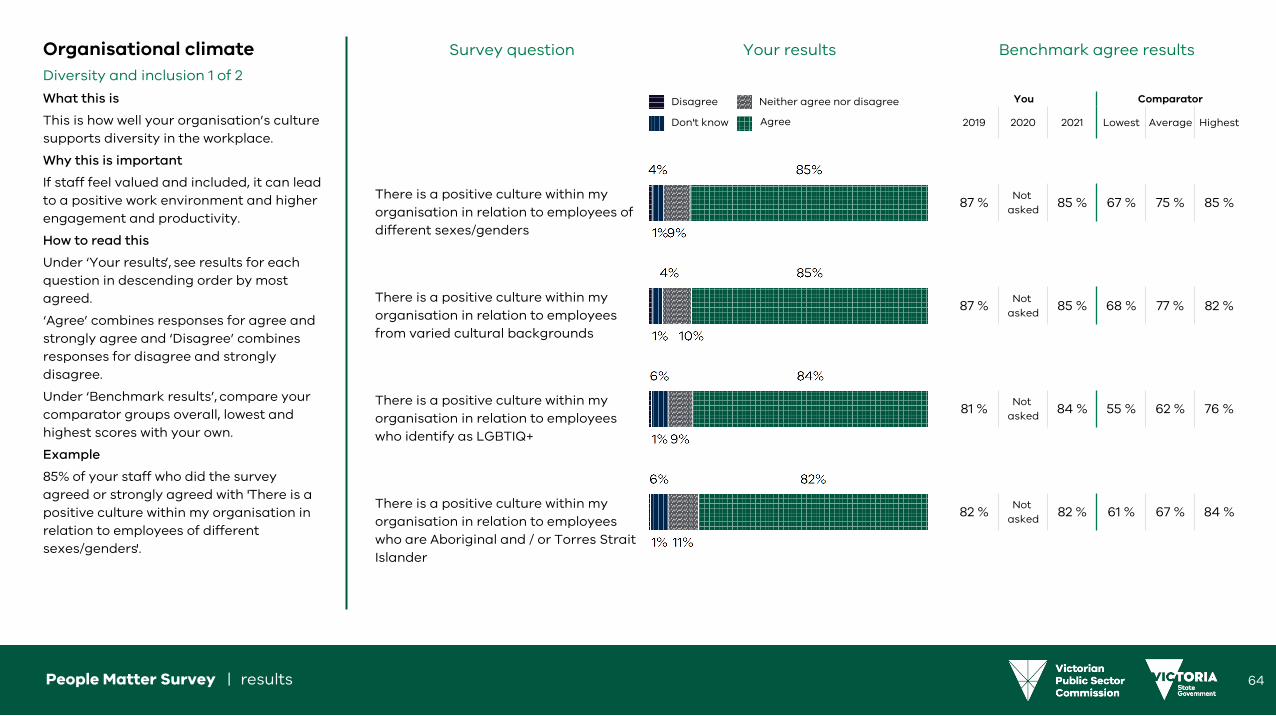
Organisational climateDiversity and inclusion 1 of 2
What this is
This is how well your organisation’s culture supports diversity in the workplace.
Why this is important
If staff feel valued and included, it can lead to a positive work environment and higher engagement and productivity.
How to read this
Under ‘Your results’, see results for each question in descending order by most agreed.
‘Agree’ combines responses for agree and strongly agree and ‘Disagree’ combines responses for disagree and strongly disagree.
Under ‘Benchmark results’, compare your comparator groups overall, lowest and highest scores with your own.
Example
85% of your staff who did the survey agreed or strongly agreed with 'There is a positive culture within my organisation in relation to employees of different sexes/genders'.
There is a positive culture within my organisation in relation to employees of different sexes/genders
87 %Not
asked85 % 67 % 75 % 85 %
There is a positive culture within my organisation in relation to employees from varied cultural backgrounds
87 %Not
asked85 % 68 % 77 % 82 %
There is a positive culture within my organisation in relation to employees who identify as LGBTIQ+
81 %Not
asked84 % 55 % 62 % 76 %
There is a positive culture within my organisation in relation to employees who are Aboriginal and / or Torres Strait Islander
82 %Not
asked82 % 61 % 67 % 84 %
Survey question Your results Benchmark agree results
Disagree Neither agree nor disagree
Don't know Agree
You Comparator
2019 2020 2021 Lowest Average Highest
64People Matter Survey | results 64

Organisational climateDiversity and inclusion 2 of 2
What this is
This is how well your organisation’s culture supports diversity in the workplace.
Why this is important
If staff feel valued and included, it can lead to a positive work environment and higher engagement and productivity.
How to read this
Under ‘Your results’, see results for each question in descending order by most agreed.
‘Agree’ combines responses for agree and strongly agree and ‘Disagree’ combines responses for disagree and strongly disagree.
Under ‘Benchmark results’, compare your comparator groups overall, lowest and highest scores with your own.
Example
80% of your staff who did the survey agreed or strongly agreed with 'There is a positive culture within my organisation in relation to employees with disability'.
There is a positive culture within my organisation in relation to employees with disability
83 %Not
asked80 % 58 % 66 % 84 %
There is a positive culture within my organisation in relation to employees of different age groups
85 %Not
asked76 % 64 % 74 % 83 %
Survey question Your results Benchmark agree results
Disagree Neither agree nor disagree
Don't know Agree
You Comparator
2019 2020 2021 Lowest Average Highest
65People Matter Survey | results 65

Organisational climateGender equality supporting measures
What this is
These are new questions to support Workplace Gender Audits, in addition to existing People matter survey questions on gender equality.Your excel files show all of the questions you can use in your workplace gender audits.
Why this is important
Under the Gender Equality Act 2020, organisations have obligations to promote gender equality in the workplace.
How to read this
Under ‘Your results’, see results for each question in descending order by most agreed.
‘Agree’ combines responses for agree and strongly agree and ‘Disagree’ combines responses for disagree and strongly disagree.
Under ‘Benchmark results’, compare your comparator groups overall, lowest and highest scores with your own.
Example
89% of your staff who did the survey agreed or strongly agreed with 'My organisation uses inclusive and respectful images and language'.
My organisation uses inclusive and respectful images and language
Not asked
Not asked
89 % 80 % 84 % 92 %
In my workgroup work is allocated fairly, regardless of gender
Not asked
Not asked
83 % 77 % 79 % 85 %
My organisation would support me if I needed to take family violence leave
Not asked
Not asked
78 % 61 % 69 % 78 %
Survey question Your results Benchmark agree results
Disagree Neither agree nor disagree
Don't know Agree
You Comparator
2019 2020 2021 Lowest Average Highest
66People Matter Survey | results 66

67People Matter Survey | results 67

Workgroup climateScorecard
What this is
This scorecard provides overall results for each factor in the workgroup climate part of the survey’s theoretical framework.
Why this is important
This page shows which factors are performing well and which factors you can look to improve.
How to read this
Each label represents a group of questions in the survey about workgroup climate.
Each result is the overall percentage of positive responses for your organisation, comparator and public sector.
Example
In 2021:
• 83% of your staff who did the survey responded positively to questions about .
Compared to:
• 78% of staff at your comparator and80% of staff across the public sector.
You 2019 You 2020 You 2021 Comparator 2021 Public sector 2021
68People Matter Survey | results 68

Workgroup climateQuality service delivery 1 of 2
What this is
This is how well workgroups in your organisation operate to deliver quality services.
Why this is important
The public sector must provide high-quality services in a timely way to meet the needs of Victorians.
Workgroups need to be motivated, make impartial decisions and have clear accountabilities.
How to read this
Under ‘Your results’, see results for each question in descending order by most agreed.
‘Agree’ combines responses for agree and strongly agree and ‘Disagree’ combines responses for disagree and strongly disagree.
Under ‘Benchmark results’, compare your comparator groups overall, lowest and highest scores with your own.
Example
92% of your staff who did the survey agreed or strongly agreed with 'My workgroup values human rights'.
My workgroup values human rights87 %
Not asked
92 % 79 % 84 % 93 %
My workgroup strives to provide high quality advice and services
94 %Not
asked89 % 81 % 84 % 93 %
My workgroup strives to deliver services in a timely manner
92 %Not
asked89 % 81 % 84 % 90 %
My workgroup places a priority on acting fairly and without bias
82 %Not
asked83 % 69 % 73 % 82 %
Survey question Your results Benchmark agree results
Disagree Neither agree nor disagree
Don't know Agree
You Comparator
2019 2020 2021 Lowest Average Highest
69People Matter Survey | results 69

Workgroup climateQuality service delivery 2 of 2
What this is
This is how well workgroups in your organisation operate to deliver quality services.
Why this is important
The public sector must provide high-quality services in a timely way to meet the needs of Victorians.
Workgroups need to be motivated, make impartial decisions and have clear accountabilities.
How to read this
Under ‘Your results’, see results for each question in descending order by most agreed.
‘Agree’ combines responses for agree and strongly agree and ‘Disagree’ combines responses for disagree and strongly disagree.
Under ‘Benchmark results’, compare your comparator groups overall, lowest and highest scores with your own.
Example
81% of your staff who did the survey agreed or strongly agreed with 'My workgroup strives to make the best use of its resources'.
My workgroup strives to make the best use of its resources
88 %Not
asked81 % 74 % 77 % 84 %
My workgroup has clear lines of responsibility
74 %Not
asked75 % 66 % 71 % 78 %
My workgroup focuses on making decisions informed by all relevant facts
84 %Not
asked75 % 68 % 70 % 83 %
Survey question Your results Benchmark agree results
Disagree Neither agree nor disagree
Don't know Agree
You Comparator
2019 2020 2021 Lowest Average Highest
70People Matter Survey | results 70

Workgroup climateInnovation 1 of 2
What this is
This is how well staff feel their workgroup innovates its operations.
Why this is important
Innovation can reduce costs, create public value and lead to higher engagement.
How to read this
Under ‘Your results’, see results for each question in descending order by most agreed.
‘Agree’ combines responses for agree and strongly agree and ‘Disagree’ combines responses for disagree and strongly disagree.
Under ‘Benchmark results’, compare your comparator groups overall, lowest and highest scores with your own.
Example
84% of your staff who did the survey agreed or strongly agreed with 'My workgroup respectfully consults with clients and stakeholders to improve outcomes'.
My workgroup respectfully consults with clients and stakeholders to improve outcomes
81 %Not
asked84 % 73 % 77 % 87 %
My workgroup encourages employee creativity
71 %Not
asked75 % 59 % 67 % 79 %
My workgroup is quick to respond to opportunities to do things better
73 %Not
asked75 % 65 % 69 % 83 %
My workgroup learns from failures and mistakes
77 %Not
asked73 % 64 % 67 % 81 %
Survey question Your results Benchmark agree results
Disagree Neither agree nor disagree
Don't know Agree
You Comparator
2019 2020 2021 Lowest Average Highest
71People Matter Survey | results 71

Workgroup climateInnovation 2 of 2
What this is
This is how well staff feel their workgroup innovates its operations.
Why this is important
Innovation can reduce costs, create public value and lead to higher engagement.
How to read this
Under ‘Your results’, see results for each question in descending order by most agreed.
‘Agree’ combines responses for agree and strongly agree and ‘Disagree’ combines responses for disagree and strongly disagree.
Under ‘Benchmark results’, compare your comparator groups overall, lowest and highest scores with your own.
Example
68% of your staff who did the survey agreed or strongly agreed with 'My workgroup takes reasonable risks to improve its services'.
My workgroup takes reasonable risks to improve its services
67 %Not
asked68 % 57 % 61 % 70 %
Survey question Your results Benchmark agree results
Disagree Neither agree nor disagree
Don't know Agree
You Comparator
2019 2020 2021 Lowest Average Highest
72People Matter Survey | results 72

Workgroup climateWorkgroup support 1 of 3
What this is
This is how well staff feel people work together and support each other in your organisation.
Why this is important
Collaboration can lead to higher team satisfaction, performance and effectiveness.
How to read this
Under ‘Your results’, see results for each question in descending order by most agreed.
‘Agree’ combines responses for agree and strongly agree and ‘Disagree’ combines responses for disagree and strongly disagree.
Under ‘Benchmark results’, compare your comparator groups overall, lowest and highest scores with your own.
Example
94% of your staff who did the survey agreed or strongly agreed with 'I am able to work effectively with others in my workgroup'.
I am able to work effectively with others in my workgroup
Not asked
90 % 94 % 85 % 89 % 92 %
People in my workgroup actively support diversity and inclusion in the workplace
88 %Not
asked91 % 77 % 84 % 91 %
I am able to work effectively with others outside my immediate workgroup
Not asked
87 % 90 % 82 % 86 % 93 %
People in my workgroup treat each other with respect
82 % 88 % 89 % 77 % 82 % 85 %
Survey question Your results Benchmark agree results
Disagree Neither agree nor disagree
Don't know Agree
You Comparator
2019 2020 2021 Lowest Average Highest
73People Matter Survey | results 73

Workgroup climateWorkgroup support 2 of 3
What this is
This is how well staff feel people work together and support each other in your organisation.
Why this is important
Collaboration can lead to higher team satisfaction, performance and effectiveness.
How to read this
Under ‘Your results’, see results for each question in descending order by most agreed.
‘Agree’ combines responses for agree and strongly agree and ‘Disagree’ combines responses for disagree and strongly disagree.
Under ‘Benchmark results’, compare your comparator groups overall, lowest and highest scores with your own.
Example
84% of your staff who did the survey agreed or strongly agreed with 'People in my workgroup work together effectively to get the job done'.
People in my workgroup work together effectively to get the job done
84 % 81 % 84 % 77 % 81 % 86 %
People in my workgroup are honest, open and transparent in their dealings
77 %Not
asked81 % 65 % 71 % 84 %
People in my workgroup regularly reach out to support me and my wellbeing
Not asked
78 % 78 % 66 % 71 % 78 %
People in my workgroup are politically impartial in their work
75 %Not
asked76 % 62 % 70 % 81 %
Survey question Your results Benchmark agree results
Disagree Neither agree nor disagree
Don't know Agree
You Comparator
2019 2020 2021 Lowest Average Highest
74People Matter Survey | results 74

Workgroup climateWorkgroup support 3 of 3
What this is
This is how well staff feel people work together and support each other in your organisation.
Why this is important
Collaboration can lead to higher team satisfaction, performance and effectiveness.
How to read this
Under ‘Your results’, see results for each question in descending order by most agreed.
‘Agree’ combines responses for agree and strongly agree and ‘Disagree’ combines responses for disagree and strongly disagree.
Under ‘Benchmark results’, compare your comparator groups overall, lowest and highest scores with your own.
Example
73% of your staff who did the survey agreed or strongly agreed with 'People in my workgroup appropriately manage conflicts of interest'.
People in my workgroup appropriately manage conflicts of interest
73 %Not
asked73 % 63 % 67 % 82 %
Workgroups across my organisation willingly share information with each other
49 % 61 % 54 % 38 % 49 % 65 %
Survey question Your results Benchmark agree results
Disagree Neither agree nor disagree
Don't know Agree
You Comparator
2019 2020 2021 Lowest Average Highest
75People Matter Survey | results 75

76People Matter Survey | results 76

Job and manager factorsScorecard 1 of 2
What this is
This scorecard provides overall results for each job and manager factor in the survey’s theoretical framework.
Why this is important
This page shows which factors are performing well and which factors you can look to improve.
How to read this
Each label represents a group of questions in the survey about job and manager factors.
Each result is the overall percentage of positive responses for your organisation, comparator and public sector.
Example
In 2021:
• 88% of your staff who did the survey responded positively to questions about Manager leadership.
Compared to:
• 82% of staff at your comparator and84% of staff across the public sector.
You 2019 You 2020 You 2021 Comparator 2021 Public sector 2021
77People Matter Survey | results 77

Job and manager factorsScorecard 2 of 2
What this is
This scorecard provides overall results for each job and manager factor in the survey’s theoretical framework.
Why this is important
This page shows which factors are performing well and which factors you can look to improve.
How to read this
Each label represents a group of questions in the survey about job and manager factors.
Each result is the overall percentage of positive responses for your organisation, comparator and public sector.
Example
In 2021:
• 72% of your staff who did the survey responded positively to questions about Safe to speak up.
Compared to:
• 66% of staff at your comparator and67% of staff across the public sector.
You 2019 You 2020 You 2021 Comparator 2021 Public sector 2021
78People Matter Survey | results 78

Job and manager factorsManager leadership 1 of 2
What this is
This is how well staff perceive their direct managers lead.
Why this is important
Great managers can foster the right environment for staff engagement.
They can act as role models for your organisation’s strategy and values.
How to read this
Under ‘Your results’, see results for each question in descending order by most agreed.
‘Agree’ combines responses for agree and strongly agree and ‘Disagree’ combines responses for disagree and strongly disagree.
Under ‘Benchmark results’, compare your comparator groups overall, lowest and highest scores with your own.
Example
90% of your staff who did the survey agreed or strongly agreed with 'My manager treats employees with dignity and respect'.
My manager treats employees with dignity and respect
83 %Not
asked90 % 79 % 83 % 89 %
My manager is committed to workplace safety
86 %Not
asked89 % 80 % 85 % 88 %
My manager works effectively with people from diverse backgrounds
86 %Not
asked89 % 80 % 85 % 89 %
My manager demonstrates honesty and integrity
84 %Not
asked86 % 75 % 81 % 88 %
Survey question Your results Benchmark agree results
Disagree Neither agree nor disagree
Don't know Agree
You Comparator
2019 2020 2021 Lowest Average Highest
79People Matter Survey | results 79

Job and manager factorsManager leadership 2 of 2
What this is
This is how well staff perceive their direct managers lead.
Why this is important
Great managers can foster the right environment for staff engagement.
They can act as role models for your organisation’s strategy and values.
How to read this
Under ‘Your results’, see results for each question in descending order by most agreed.
‘Agree’ combines responses for agree and strongly agree and ‘Disagree’ combines responses for disagree and strongly disagree.
Under ‘Benchmark results’, compare your comparator groups overall, lowest and highest scores with your own.
Example
86% of your staff who did the survey agreed or strongly agreed with 'My manager models my organisation’s values'.
My manager models my organisation’s values
81 %Not
asked86 % 74 % 78 % 85 %
My manager ensures clients receive a high standard of service
84 %Not
asked85 % 78 % 82 % 88 %
Survey question Your results Benchmark agree results
Disagree Neither agree nor disagree
Don't know Agree
You Comparator
2019 2020 2021 Lowest Average Highest
80People Matter Survey | results 80
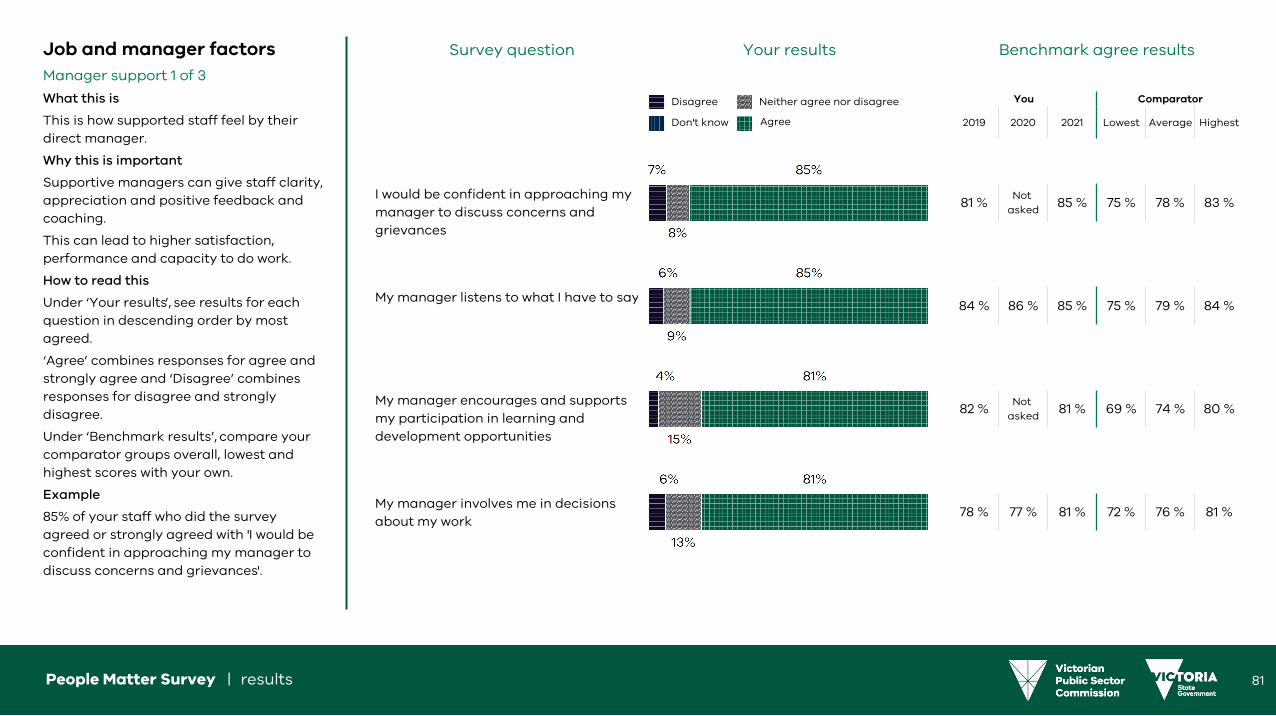
Job and manager factorsManager support 1 of 3
What this is
This is how supported staff feel by their direct manager.
Why this is important
Supportive managers can give staff clarity, appreciation and positive feedback and coaching.
This can lead to higher satisfaction, performance and capacity to do work.
How to read this
Under ‘Your results’, see results for each question in descending order by most agreed.
‘Agree’ combines responses for agree and strongly agree and ‘Disagree’ combines responses for disagree and strongly disagree.
Under ‘Benchmark results’, compare your comparator groups overall, lowest and highest scores with your own.
Example
85% of your staff who did the survey agreed or strongly agreed with 'I would be confident in approaching my manager to discuss concerns and grievances'.
I would be confident in approaching my manager to discuss concerns and grievances
81 %Not
asked85 % 75 % 78 % 83 %
My manager listens to what I have to say84 % 86 % 85 % 75 % 79 % 84 %
My manager encourages and supports my participation in learning and development opportunities
82 %Not
asked81 % 69 % 74 % 80 %
My manager involves me in decisions about my work
78 % 77 % 81 % 72 % 76 % 81 %
Survey question Your results Benchmark agree results
Disagree Neither agree nor disagree
Don't know Agree
You Comparator
2019 2020 2021 Lowest Average Highest
81People Matter Survey | results 81

Job and manager factorsManager support 2 of 3
What this is
This is how supported staff feel by their direct manager.
Why this is important
Supportive managers can give staff clarity, appreciation and positive feedback and coaching.
This can lead to higher satisfaction, performance and capacity to do work.
How to read this
Under ‘Your results’, see results for each question in descending order by most agreed.
‘Agree’ combines responses for agree and strongly agree and ‘Disagree’ combines responses for disagree and strongly disagree.
Under ‘Benchmark results’, compare your comparator groups overall, lowest and highest scores with your own.
Example
80% of your staff who did the survey agreed or strongly agreed with 'My manager provides me with enough support when I need it'.
My manager provides me with enough support when I need it
Not asked
83 % 80 % 70 % 74 % 78 %
My manager keeps me informed about what's going on
71 % 79 % 79 % 68 % 73 % 80 %
My manager provides feedback to me in a way that helps me improve my performance
72 % 75 % 74 % 58 % 65 % 71 %
My manager has regular conversations with me about my learning and development
Not asked
Not asked
59 % 44 % 53 % 61 %
Survey question Your results Benchmark agree results
Disagree Neither agree nor disagree
Don't know Agree
You Comparator
2019 2020 2021 Lowest Average Highest
82People Matter Survey | results 82

Job and manager factorsManager support 3 of 3
What this is
This is how supported staff feel by their direct manager.
Why this is important
Supportive managers can give staff clarity, appreciation and positive feedback and coaching.
This can lead to higher satisfaction, performance and capacity to do work.
How to read this
Under ‘Your results’, see results for each question in descending order by most agreed.
‘Agree’ combines responses for agree and strongly agree and ‘Disagree’ combines responses for disagree and strongly disagree.
Under ‘Benchmark results’, compare your comparator groups overall, lowest and highest scores with your own.
Example
58% of your staff who did the survey agreed or strongly agreed with 'I receive adequate recognition for my contributions and accomplishments'.
I receive adequate recognition for my contributions and accomplishments
52 %Not
asked58 % 48 % 54 % 59 %
Survey question Your results Benchmark agree results
Disagree Neither agree nor disagree
Don't know Agree
You Comparator
2019 2020 2021 Lowest Average Highest
83People Matter Survey | results 83

Job and manager factorsWorkload
What this is
This is how staff feel about workload and time pressure.
Why this is important
Workload and time pressure are the most prominent causes of work-related stress.
How to read this
Under ‘Your results’, see results for each question in descending order by most agreed.
‘Agree’ combines responses for agree and strongly agree and ‘Disagree’ combines responses for disagree and strongly disagree.
Under ‘Benchmark results’, compare your comparator groups overall, lowest and highest scores with your own.
Example
48% of your staff who did the survey agreed or strongly agreed with 'The workload I have is appropriate for the job that I do'.
The workload I have is appropriate for the job that I do
53 % 55 % 48 % 48 % 54 % 63 %
I have enough time to do my job effectively
49 % 47 % 42 % 45 % 48 % 58 %
Survey question Your results Benchmark agree results
Disagree Neither agree nor disagree
Agree
You Comparator
2019 2020 2021 Lowest Average Highest
84People Matter Survey | results 84

Job and manager factorsLearning and development 1 of 2
What this is
This is how well staff feel they can learn and grow in your organisation.
Why this is important
Good learning and career development can build engagement, efficiency and capability in organisations. It may also help staff retention.
How to read this
Under ‘Your results’, see results for each question in descending order by most agreed.
‘Agree’ combines responses for agree and strongly agree and ‘Disagree’ combines responses for disagree and strongly disagree.
Under ‘Benchmark results’, compare your comparator groups overall, lowest and highest scores with your own.
Example
72% of your staff who did the survey agreed or strongly agreed with 'I am developing and learning in my role'.
I am developing and learning in my role Not asked
Not asked
72 % 67 % 71 % 77 %
My organisation places a high priority on the learning and development of staff
74 %Not
asked70 % 44 % 58 % 70 %
In the last 12 months I have learned skills that have helped me do my job better
Not asked
Not asked
68 % 67 % 70 % 76 %
There are adequate opportunities for me to develop skills and experience in my organisation
71 %Not
asked58 % 42 % 53 % 61 %
Survey question Your results Benchmark agree results
Disagree Neither agree nor disagree
Agree
You Comparator
2019 2020 2021 Lowest Average Highest
85People Matter Survey | results 85

Job and manager factorsLearning and development 2 of 2
What this is
This is how well staff feel they can learn and grow in your organisation.
Why this is important
Good learning and career development can build engagement, efficiency and capability in organisations. It may also help staff retention.
How to read this
Under ‘Your results’, see results for each question in descending order by most agreed.
‘Agree’ combines responses for agree and strongly agree and ‘Disagree’ combines responses for disagree and strongly disagree.
Under ‘Benchmark results’, compare your comparator groups overall, lowest and highest scores with your own.
Example
51% of your staff who did the survey agreed or strongly agreed with 'I am satisfied with the way my learning and development needs have been addressed in the last 12 months'.
I am satisfied with the way my learning and development needs have been addressed in the last 12 months
Not asked
Not asked
51 % 45 % 52 % 59 %
I feel I have an equal chance at promotion in my organisation
Not asked
Not asked
43 % 33 % 39 % 50 %
I am satisfied with the availability of opportunities to move between roles within my organisation (e.g. temporary or permanent transfers)
Not asked
Not asked
35 % 27 % 35 % 45 %
I am satisfied with the availability of opportunities to take up roles in other organisations (e.g. temporary or permanent transfers or secondments)
Not asked
Not asked
21 % 18 % 25 % 33 %
Survey question Your results Benchmark agree results
Disagree Neither agree nor disagree
Agree
You Comparator
2019 2020 2021 Lowest Average Highest
86People Matter Survey | results 86

Job and manager factorsJob enrichment 1 of 2
What this is
This is how staff feel about their autonomy at work and role clarity.
Why this is important
Job enrichment is one of the main drivers of employee engagement and workplace wellbeing.
How to read this
Under ‘Your results’, see results for each question in descending order by most agreed.
‘Agree’ combines responses for agree and strongly agree and ‘Disagree’ combines responses for disagree and strongly disagree.
Under ‘Benchmark results’, compare your comparator groups overall, lowest and highest scores with your own.
Example
92% of your staff who did the survey agreed or strongly agreed with 'I understand how my job contributes to my organisation’s purpose'.
I understand how my job contributes to my organisation’s purpose
94 % 93 % 92 % 84 % 89 % 94 %
My job allows me to utilise my skills, knowledge and abilities
82 % 85 % 82 % 78 % 82 % 84 %
I understand how the Charter of Human Rights and Responsibilities applies to my work
77 %Not
asked80 % 63 % 73 % 90 %
I have a choice in deciding how I do my work
68 % 72 % 78 % 70 % 74 % 79 %
Survey question Your results Benchmark agree results
Disagree Neither agree nor disagree
Agree
You Comparator
2019 2020 2021 Lowest Average Highest
87People Matter Survey | results 87

Job and manager factorsJob enrichment 2 of 2
What this is
This is how staff feel about their autonomy at work and role clarity.
Why this is important
Job enrichment is one of the main drivers of employee engagement and workplace wellbeing.
How to read this
Under ‘Your results’, see results for each question in descending order by most agreed.
‘Agree’ combines responses for agree and strongly agree and ‘Disagree’ combines responses for disagree and strongly disagree.
Under ‘Benchmark results’, compare your comparator groups overall, lowest and highest scores with your own.
Example
78% of your staff who did the survey agreed or strongly agreed with 'I clearly understand what I am expected to do in this job'.
I clearly understand what I am expected to do in this job
75 % 79 % 78 % 73 % 78 % 82 %
I have the authority to do my job effectively
74 %Not
asked76 % 69 % 75 % 81 %
My work performance is assessed against clear criteria
Not asked
Not asked
55 % 45 % 56 % 65 %
Survey question Your results Benchmark agree results
Disagree Neither agree nor disagree
Agree
You Comparator
2019 2020 2021 Lowest Average Highest
88People Matter Survey | results 88

Job and manager factorsMeaningful work
What this is
This is how staff feel about their contribution and how worthwhile their work is.
Why this is important
Staff who feel their work is meaningful can help achieve individual, team and organisational outcomes.
How to read this
Under ‘Your results’, see results for each question in descending order by most agreed.
‘Agree’ combines responses for agree and strongly agree and ‘Disagree’ combines responses for disagree and strongly disagree.
Under ‘Benchmark results’, compare your comparator groups overall, lowest and highest scores with your own.
Example
88% of your staff who did the survey agreed or strongly agreed with 'I feel that I can make a worthwhile contribution at work'.
I feel that I can make a worthwhile contribution at work
Not asked
89 % 88 % 84 % 87 % 90 %
I am achieving something important through my work
Not asked
90 % 85 % 78 % 83 % 86 %
Survey question Your results Benchmark agree results
Disagree Neither agree nor disagree
Agree
You Comparator
2019 2020 2021 Lowest Average Highest
89People Matter Survey | results 89

Job and manager factorsSafe to speak up 1 of 2
What this is
This is how freely and confidently staff feel they can talk about issues without fear of retribution.
Why this is important
Organisations with psychologically safe cultures empower staff to report negative behaviour and integrity issues.
How to read this
Under ‘Your results’, see results for each question in descending order by most agreed.
‘Agree’ combines responses for agree and strongly agree and ‘Disagree’ combines responses for disagree and strongly disagree.
Under ‘Benchmark results’, compare your comparator groups overall, lowest and highest scores with your own.
Example
78% of your staff who did the survey agreed or strongly agreed with 'People in your workgroup are able to bring up problems and tough issues'.
People in your workgroup are able to bring up problems and tough issues
Not asked
77 % 78 % 68 % 71 % 78 %
I am confident that I would be protected from reprisal for reporting improper conduct
57 %Not
asked66 % 51 % 61 % 69 %
I feel safe to challenge inappropriate behaviour at work
Not asked
Not asked
65 % 57 % 63 % 67 %
I am confident that if I raised a grievance in my organisation, it would be investigated in a thorough and objective manner
57 %Not
asked60 % 45 % 56 % 65 %
Survey question Your results Benchmark agree results
Disagree Neither agree nor disagree
Agree
You Comparator
2019 2020 2021 Lowest Average Highest
90People Matter Survey | results 90

Job and manager factorsSafe to speak up 2 of 2
What this is
This is how freely and confidently staff feel they can talk about issues without fear of retribution.
Why this is important
Organisations with psychologically safe cultures empower staff to report negative behaviour and integrity issues.
How to read this
Under ‘Your results’, see results for each question in descending order by most disagreed.
‘Agree’ combines responses for agree and strongly agree and ‘Disagree’ combines responses for disagree and strongly disagree.
Under ‘Benchmark results’, compare your comparator groups overall, lowest and highest scores with your own.
Example
87% of your staff who did the survey disagreed or strongly disagreed with 'People in my workgroup often reject others for being different'.
People in my workgroup often reject others for being different
Not asked
Not asked
87 % 70 % 78 % 87 %
If I make a mistake in my workgroup, it is often held against me
Not asked
Not asked
76 % 65 % 69 % 77 %
Survey question Your results Benchmark disagree results
Disagree Neither agree nor disagree
Agree
You Comparator
2019 2020 2021 Lowest Average Highest
91People Matter Survey | results 91

Job and manager factorsBarriers to optimal work
What this is
This is what staff feel stops them from working in an optimal way.
Why this is important
Workplace barriers prevent employees from working efficiently and effectively.
How to read this
In the survey, we asked staff to tell us the most significant barriers that prevented them from working optimally. They could select more than one barrier.
Example
44% of staff who did the survey said 'Too many competing priorities' was a significant barrier to performing optimally at work.
Which of the following are currently the most significant barriers (if any) that prevent you performing optimally at work?
You 2020
You2021
Comparator 2021
Public sector 2021
Too many competing priorities 44% 35% 36%
Administrative processes (including leave and HR requirements) 38% 23% 19%
Communication processes 24% 25% 19%
Decision making and authorisation processes 21% 27% 23%
Technology limitations 18% 20% 20%
There are no noticeable barriers 17% 17% 18%
Difficulties in separating work from other aspects of my life 11% 9% 10%
Limited social interactions with the team 11% 10% 11%
Poor work-life balance 10% 10% 12%
Other 10% 12% 13%
92People Matter Survey | results 92

93People Matter Survey | results 93

Public sector valuesScorecard 1 of 2
What this is
This is a set of 7 values that form the basis for the professional and ethical conduct of everyone who works in the public sector.
Why this is important
There’s a strong link between workplace culture and how staff perceive their organisation lives the public sector values.
How to read this
Each label represents a group of questions in the survey about public sector values.
Each result is the overall percentage of positive responses for your organisation, comparator and public sector.
Example
In 2021:
• 88% of your staff who did the survey responded positively to questions about Responsiveness , which is down 2% in 2019.
Compared to:
• 84% of staff at your comparator and87% of staff across the public sector.
You 2019 You 2020 You 2021 Comparator 2021 Public sector 2021
94People Matter Survey | results 94

Public sector valuesScorecard 2 of 2
What this is
This is a set of 7 values that form the basis for the professional and ethical conduct of everyone who works in the public sector.
Why this is important
There’s a strong link between workplace culture and how staff perceive their organisation lives the public sector values.
How to read this
Each label represents a group of questions in the survey about public sector values.
Each result is the overall percentage of positive responses for your organisation, comparator and public sector.
Example
In 2021:
• 76% of your staff who did the survey responded positively to questions about Leadership , which is up 0% in 2019.
Compared to:
• 70% of staff at your comparator and73% of staff across the public sector.
You 2019 You 2020 You 2021 Comparator 2021 Public sector 2021
95People Matter Survey | results 95

Public sector valuesResponsiveness
What this is
This is how responsive your staff feel they are to the community.
Why this is important
Staff need to feel they can adapt to the changing demands and circumstances of our clients and stakeholders.
How to read this
Under ‘Your results’, see results for each question in descending order by most agreed.
‘Agree’ combines responses for agree and strongly agree and ‘Disagree’ combines responses for disagree and strongly disagree.
Under ‘Benchmark results’, compare your comparator groups overall, lowest and highest scores with your own.
Example
89% of staff who did the survey agreed or strongly agreed with 'My workgroup strives to provide high quality advice and services'.
My workgroup strives to provide high quality advice and services
94 %Not
asked89 % 81 % 84 % 93 %
My workgroup strives to deliver services in a timely manner
92 %Not
asked89 % 81 % 84 % 90 %
My manager ensures clients receive a high standard of service
84 %Not
asked85 % 78 % 82 % 88 %
Survey question Your results Benchmark agree results
Disagree Neither agree nor disagree
Don't know Agree
You Comparator
2019 2020 2021 Lowest Average Highest
96People Matter Survey | results 96

My manager demonstrates honesty and integrity
84 %Not
asked86 % 75 % 81 % 88 %
My organisation is committed to earning a high level of public trust
81 %Not
asked81 % 64 % 74 % 89 %
People in my workgroup are honest, open and transparent in their dealings
77 %Not
asked81 % 65 % 71 % 84 %
My organisation does not tolerate improper conduct
74 %Not
asked78 % 53 % 68 % 75 %
Survey question Your results Benchmark agree results
Disagree Neither agree nor disagree
Don't know Agree
You Comparator
2019 2020 2021 Lowest Average Highest
Public sector valuesIntegrity 1 of 2
What this is
Integrity is being honest and transparent, conducting ourselves properly and using our powers responsibly.
Why this is important
The Victorian community need high trust in how everyone in the public sector works and what they do.
How to read this
Under ‘Your results’, see results for each question in descending order by most agreed.
‘Agree’ combines responses for agree and strongly agree and ‘Disagree’ combines responses for disagree and strongly disagree.
Under ‘Benchmark results’, compare your comparator groups overall, lowest and highest scores with your own.
Example
86% of staff who did the survey agreed or strongly agreed with 'My manager demonstrates honesty and integrity'.
97People Matter Survey | results 97

Public sector valuesIntegrity 2 of 2
What this is
Integrity is being honest and transparent, conducting ourselves properly and using our powers responsibly.
Why this is important
The Victorian community need high trust in how everyone in the public sector works and what they do.
How to read this
Under ‘Your results’, see results for each question in descending order by most agreed.
‘Agree’ combines responses for agree and strongly agree and ‘Disagree’ combines responses for disagree and strongly disagree.
Under ‘Benchmark results’, compare your comparator groups overall, lowest and highest scores with your own.
Example
73% of staff who did the survey agreed or strongly agreed with 'People in my workgroup appropriately manage conflicts of interest'.
People in my workgroup appropriately manage conflicts of interest
73 %Not
asked73 % 63 % 67 % 82 %
I am confident that I would be protected from reprisal for reporting improper conduct
57 %Not
asked66 % 51 % 61 % 69 %
I feel safe to challenge inappropriate behaviour at work
Not asked
Not asked
65 % 57 % 63 % 67 %
Senior leaders demonstrate honesty and integrity
72 %Not
asked61 % 47 % 60 % 73 %
Survey question Your results Benchmark agree results
Disagree Neither agree nor disagree
Don't know Agree
You Comparator
2019 2020 2021 Lowest Average Highest
98People Matter Survey | results 98

Public sector valuesImpartiality
What this is
Impartiality is how your staff feel an organisation makes informed decisions and provides stable advice on merit, without bias, favouritism or self interest.
Why this is important
We all have an obligation to be impartial and make objective and fair decisions that are open to scrutiny.
How to read this
Under ‘Your results’, see results for each question in descending order by most agreed.
‘Agree’ combines responses for agree and strongly agree and ‘Disagree’ combines responses for disagree and strongly disagree.
Under ‘Benchmark results’, compare your comparator groups overall, lowest and highest scores with your own.
Example
83% of staff who did the survey agreed or strongly agreed with 'My workgroup places a priority on acting fairly and without bias'.
My workgroup places a priority on acting fairly and without bias
82 %Not
asked83 % 69 % 73 % 82 %
People in my workgroup are politically impartial in their work
75 %Not
asked76 % 62 % 70 % 81 %
My workgroup focuses on making decisions informed by all relevant facts
84 %Not
asked75 % 68 % 70 % 83 %
My organisation makes fair recruitment and promotion decisions, based on merit
55 %Not
asked52 % 39 % 49 % 58 %
Survey question Your results Benchmark agree results
Disagree Neither agree nor disagree
Don't know Agree
You Comparator
2019 2020 2021 Lowest Average Highest
99People Matter Survey | results 99

Public sector valuesAccountability 1 of 2
What this is
Accountability is if your staff feel they work to clear objectives in a transparent manner and can accept responsibility for decisions.
Why this is important
As we all make decisions on behalf of Victorians, we must be accountable in the resources we use.
How to read this
Under ‘Your results’, see results for each question in descending order by most agreed.
‘Agree’ combines responses for agree and strongly agree and ‘Disagree’ combines responses for disagree and strongly disagree.
Under ‘Benchmark results’, compare your comparator groups overall, lowest and highest scores with your own.
Example
92% of staff who did the survey agreed or strongly agreed with 'I understand how my job contributes to my organisation’s purpose'.
I understand how my job contributes to my organisation’s purpose
94 % 93 % 92 % 84 % 89 % 94 %
My workgroup strives to make the best use of its resources
88 %Not
asked81 % 74 % 77 % 84 %
I clearly understand what I am expected to do in this job
75 % 79 % 78 % 73 % 78 % 82 %
My workgroup has clear lines of responsibility
74 %Not
asked75 % 66 % 71 % 78 %
Survey question Your results Benchmark agree results
Disagree Neither agree nor disagree
Don't know Agree
You Comparator
2019 2020 2021 Lowest Average Highest
100People Matter Survey | results 100

Public sector valuesAccountability 2 of 2
What this is
Accountability is if your staff feel they work to clear objectives in a transparent manner and can accept responsibility for decisions.
Why this is important
As we all make decisions on behalf of Victorians, we must be accountable in the resources we use.
How to read this
Under ‘Your results’, see results for each question in descending order by most agreed.
‘Agree’ combines responses for agree and strongly agree and ‘Disagree’ combines responses for disagree and strongly disagree.
Under ‘Benchmark results’, compare your comparator groups overall, lowest and highest scores with your own.
Example
61% of staff who did the survey agreed or strongly agreed with 'Senior leaders provide clear strategy and direction'.
Senior leaders provide clear strategy and direction
75 % 74 % 61 % 44 % 58 % 71 %
Survey question Your results Benchmark agree results
Disagree Neither agree nor disagree
Don't know Agree
You Comparator
2019 2020 2021 Lowest Average Highest
101People Matter Survey | results 101

Public sector valuesRespect 1 of 2
What this is
Respect is how your staff feel they’re treated in the workplace and community.
Why this is important
All staff need to treat their colleagues and Victorians with respect.
How to read this
Under ‘Your results’, see results for each question in descending order by most agreed.
‘Agree’ combines responses for agree and strongly agree and ‘Disagree’ combines responses for disagree and strongly disagree.
Under ‘Benchmark results’, compare your comparator groups overall, lowest and highest scores with your own.
Example
90% of staff who did the survey agreed or strongly agreed with 'My manager treats employees with dignity and respect'.
My manager treats employees with dignity and respect
83 %Not
asked90 % 79 % 83 % 89 %
My organisation encourages respectful workplace behaviours
86 %Not
asked89 % 73 % 80 % 86 %
People in my workgroup treat each other with respect
82 % 88 % 89 % 77 % 82 % 85 %
My manager listens to what I have to say84 % 86 % 85 % 75 % 79 % 84 %
Survey question Your results Benchmark agree results
Disagree Neither agree nor disagree
Don't know Agree
You Comparator
2019 2020 2021 Lowest Average Highest
102People Matter Survey | results 102

Public sector valuesRespect 2 of 2
What this is
Respect is how your staff feel they’re treated in the workplace and community.
Why this is important
All staff need to treat their colleagues and Victorians with respect.
How to read this
Under ‘Your results’, see results for each question in descending order by most agreed.
‘Agree’ combines responses for agree and strongly agree and ‘Disagree’ combines responses for disagree and strongly disagree.
Under ‘Benchmark results’, compare your comparator groups overall, lowest and highest scores with your own.
Example
84% of staff who did the survey agreed or strongly agreed with 'My workgroup respectfully consults with clients and stakeholders to improve outcomes'.
My workgroup respectfully consults with clients and stakeholders to improve outcomes
81 %Not
asked84 % 73 % 77 % 87 %
My organisation takes steps to eliminate bullying, harassment and discrimination
75 %Not
asked82 % 55 % 67 % 73 %
My manager keeps me informed about what's going on
71 % 79 % 79 % 68 % 73 % 80 %
Survey question Your results Benchmark agree results
Disagree Neither agree nor disagree
Don't know Agree
You Comparator
2019 2020 2021 Lowest Average Highest
103People Matter Survey | results 103

Public sector valuesLeadership
What this is
Leadership is how your staff feel an organisation implements and promotes the public sector values.
Why this is important
Good leadership plays a role in the development of workplace culture.
It also gives Victorians confidence that staff in the public sector behave to a high standard.
How to read this
Under ‘Your results’, see results for each question in descending order by most agreed.
‘Agree’ combines responses for agree and strongly agree and ‘Disagree’ combines responses for disagree and strongly disagree.
Under ‘Benchmark results’, compare your comparator groups overall, lowest and highest scores with your own.
Example
86% of staff who did the survey agreed or strongly agreed with 'My manager models my organisation’s values'.
My manager models my organisation’s values
81 %Not
asked86 % 74 % 78 % 85 %
Senior leaders model my organisation's values
71 %Not
asked66 % 47 % 61 % 73 %
Survey question Your results Benchmark agree results
Disagree Neither agree nor disagree
Don't know Agree
You Comparator
2019 2020 2021 Lowest Average Highest
104People Matter Survey | results 104

Public sector valuesHuman rights
What this is
Human rights is how your staff feel their organisation upholds basic human rights.
Why this is important
Using the Victorian Charter of Human Rights, organisations must consider human rights in how they work and act.
How to read this
Under ‘Your results’, see results for each question in descending order by most agreed.
‘Agree’ combines responses for agree and strongly agree and ‘Disagree’ combines responses for disagree and strongly disagree.
Under ‘Benchmark results’, compare your comparator groups overall, lowest and highest scores with your own.
Example
92% of staff who did the survey agreed or strongly agreed with 'My workgroup values human rights'.
My workgroup values human rights87 %
Not asked
92 % 79 % 84 % 93 %
My organisation encourages employees to act in ways that are consistent with human rights
86 %Not
asked88 % 73 % 79 % 91 %
My organisation respects the human rights of employees
85 %Not
asked86 % 71 % 78 % 87 %
I understand how the Charter of Human Rights and Responsibilities applies to my work
77 %Not
asked80 % 63 % 73 % 90 %
Survey question Your results Benchmark agree results
Disagree Neither agree nor disagree
Don't know Agree
You Comparator
2019 2020 2021 Lowest Average Highest
105People Matter Survey | results 105

106People Matter Survey | results 106

DemographicsAge, Australian defence force and education
What this is
These are the employment characteristics of staff.
Why this is important
This helps organisations understand the diversity of their staff.
How to read this
Each table shows the breakdown of responses from your survey.
The (n) column shows the number of respondents in each category.
How we protect anonymity and privacy
To protect you, we:
• de-identify all survey response data provided to your organisation
• don’t release results when fewer than 10 people in a demographic group have responded to the survey
• don’t release employee opinion results for demographic groups where organisations have fewer than 30 responses in total.
Age (n) %
15-34 years 69 16%
35-54 years 205 48%
55+ years 121 28%
Prefer not to say 33 8%
Have you served in the Australian Defence Force (permanent or reservist)? (n) %
Yes 7 2%
No 403 94%
Prefer not to say 18 4%
Highest level of formal education (n) %
Doctoral Degree level 2 0%
Master Degree level 38 9%
Graduate Diploma or Graduate Certificate level
94 22%
Bachelor Degree level incl. honours degrees 69 16%
Advanced Diploma or Diploma level 103 24%
Certificate III or IV level 84 20%
Year 12 or equivalent (VCE/Leaving certificate)
6 1%
Certificate I or II level 3 1%
Prefer not to say 29 7%
107People Matter Survey | results 107

DemographicsAboriginal and/or Torres Strait Islander employees
What this is
This is staff who identify as Aboriginal and/or Torres Strait Islander.
Why this is important
This helps organisations understand the diversity of their staff and inform workforce strategies.
How to read this
Each table shows the breakdown of responses from your survey. The (n) column shows the number of respondents in each category.An asterisk (*) means this is a new question for the 2021 survey.
How we protect anonymity and privacy
To protect you, we:
• de-identify all survey response data provided to your organisation
• don’t release results when fewer than 10 people in a demographic group have responded to the survey
• don’t release employee opinion results for demographic groups where organisations have fewer than 30 responses in total.
Aboriginal and/or Torres Strait Islander (n) %
Yes 8 2%
Non Aboriginal and/or Torres Strait Islander 395 92%
Prefer not to say 25 6%
108People Matter Survey | results 108

DemographicsDisability
What this is
This is staff who identify as a person with disability and how they share that information.
Why this is important
This helps organisations understand the diversity of their staff and inform workforce strategies.
How to read this
Each table shows the breakdown of responses from your survey. This is staff who identify as a person with disability and how they share that information
The (n) column shows the number of respondents in each category.How we protect anonymity and privacy
To protect you, we:
• de-identify all survey response data provided to your organisation
• don’t release results when fewer than 10 people in a demographic group have responded to the survey
• don’t release employee opinion results for demographic groups where organisations have fewer than 30 responses in total.
Do you identify as a person with a disability? (n) %
Yes 37 9%
No 359 84%
Prefer not to say 32 7%
If so, have you shared your disability information within your organisation (e.g. to your manager or Human Resources staff)? (n) %
Yes 24 65%
No 12 32%
Prefer not to say 1 3%
If not, which statement most accurately reflects your decision not to share your disability information within your organisation? (n) %
I feel that sharing my disability information will reflect negatively on me 6 50%
My disability does not impact on my ability to perform my role 3 25%
I do not require any adjustments to be made to perform my role 2 17%
Other 1 8%
109People Matter Survey | results 109

DemographicsGender, variations in sex characteristics and sexual orientation
What this is
This is how staff describe their gender, variations in sex characteristics and sexual orientation.
Why this is important
This helps organisations understand the diversity of their staff and inform workforce strategies.
How to read this
Each table shows the breakdown of responses from your survey.
The (n) column shows the number of respondents in each category.
An asterisk (*) means this is a new question for the 2021 survey.
How we protect anonymity and privacy
To protect you, we:
• de-identify all survey response data provided to your organisation
• don’t release results when fewer than 10 people in a demographic group have responded to the survey
• don’t release employee opinion results for demographic groups where organisations have fewer than 30 responses in total.
How would you describe your gender? (n) %
Woman 249 58%
Man 136 32%
Prefer not to say 36 8%
Non-binary and I use a different term 7 2%
Are you trans, non-binary or gender diverse? (n) %
Yes 2 0%
No 388 91%
Prefer not to say 38 9%
To your knowledge, do you have innate variation(s) of sex characteristics (often called intersex)?* (n) %
No 391 91%
Don't know 8 2%
Prefer not to say 29 7%
How do you describe your sexual orientation? (n) %
Straight (heterosexual) 352 82%
Prefer not to say 53 12%
Gay or lesbian 11 3%
Bisexual 4 1%
I use a different term 3 1%
Don't know 2 0%
Pansexual 2 0%
Asexual 1 0%
110People Matter Survey | results 110
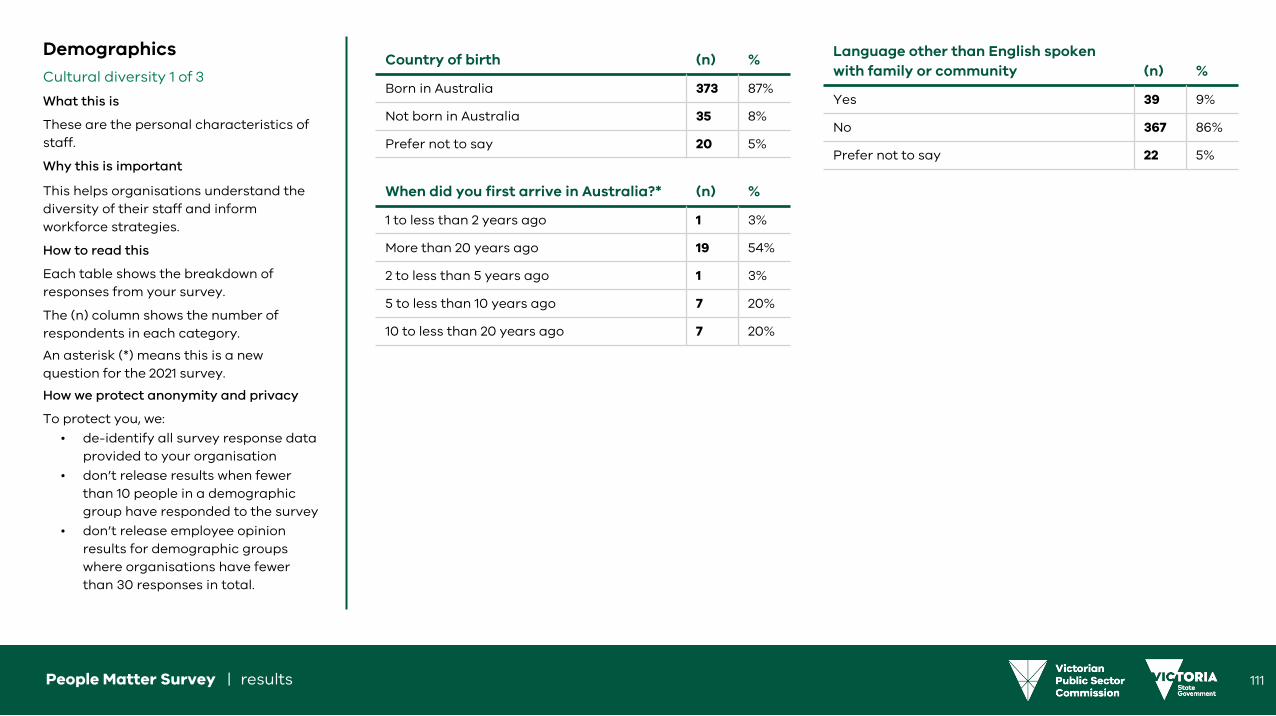
DemographicsCultural diversity 1 of 3
What this is
These are the personal characteristics of staff.
Why this is important
This helps organisations understand the diversity of their staff and inform workforce strategies.
How to read this
Each table shows the breakdown of responses from your survey.
The (n) column shows the number of respondents in each category.
An asterisk (*) means this is a new question for the 2021 survey.
How we protect anonymity and privacy
To protect you, we:
• de-identify all survey response data provided to your organisation
• don’t release results when fewer than 10 people in a demographic group have responded to the survey
• don’t release employee opinion results for demographic groups where organisations have fewer than 30 responses in total.
Country of birth (n) %
Born in Australia 373 87%
Not born in Australia 35 8%
Prefer not to say 20 5%
When did you first arrive in Australia?* (n) %
1 to less than 2 years ago 1 3%
More than 20 years ago 19 54%
2 to less than 5 years ago 1 3%
5 to less than 10 years ago 7 20%
10 to less than 20 years ago 7 20%
Language other than English spoken with family or community (n) %
Yes 39 9%
No 367 86%
Prefer not to say 22 5%
111People Matter Survey | results 111

DemographicsCultural diversity 2 of 3
What this is
These are the personal characteristics of staff.
Why this is important
This helps organisations understand the diversity of their staff and inform workforce strategies.
How to read this
Each table shows the breakdown of responses from your survey.
The (n) column shows the number of respondents in each category.
An asterisk (*) means this is a new question for the 2021 survey.
How we protect anonymity and privacy
To protect you, we:
• de-identify all survey response data provided to your organisation
• don’t release results when fewer than 10 people in a demographic group have responded to the survey
• don’t release employee opinion results for demographic groups where organisations have fewer than 30 responses in total.
If you speak another language with your family or community, what language(s) do you speak?* (n) %
Other 15 38%
Italian 12 31%
Hindi 4 10%
Mandarin 3 8%
Urdu 3 8%
Arabic 2 5%
German 2 5%
Macedonian 2 5%
Punjabi 2 5%
Tamil 2 5%
Australian Indigenous Language 1 3%
Cantonese 1 3%
Filipino 1 3%
Greek 1 3%
Indonesian 1 3%
If you speak another language with your family or community, what language(s) do you speak?* (n) %
Spanish 1 3%
Tagalog 1 3%
112People Matter Survey | results 112

DemographicsCultural diversity 3 of 3
What this is
This is the cultural identity and religion of staff.
Why this is important
This helps organisations understand the diversity of their staff and inform workforce strategies.
How to read this
Each table shows the breakdown of responses from your survey.
The (n) column shows the number of respondents in each category.
An asterisk (*) means this is a new question for the 2021 survey.
How we protect anonymity and privacy
To protect you, we:
• de-identify all survey response data provided to your organisation
• don’t release results when fewer than 10 people in a demographic group have responded to the survey
• don’t release employee opinion results for demographic groups where organisations have fewer than 30 responses in total.
Cultural identity (n) %
Australian 347 81%
Prefer not to say 31 7%
English, Irish, Scottish and/or Welsh 29 7%
European (including Western, Eastern and South-Eastern Europe, and Scandinavia)
28 7%
Aboriginal and/or Torres Strait Islander 8 2%
Other 5 1%
East and/or South-East Asian 5 1%
New Zealander 4 1%
Maori 3 1%
North American 2 0%
South Asian 2 0%
Pacific Islander 1 0%
Central and/or South American 1 0%
Central Asian 1 0%
Religion (n) %
No religion 192 45%
Christianity 147 34%
Prefer not to say 64 15%
Other 16 4%
Hinduism 4 1%
Islam 2 0%
Buddhism 1 0%
Judaism 1 0%
Sikhism 1 0%
113People Matter Survey | results 113

DemographicsEmployment characteristics 1 of 2
What this is
These are the employment characteristics of staff.
Why this is important
This helps organisations understand the diversity of their staff and inform workforce strategies.
How to read this
Each table shows the breakdown of responses from your survey.
The (n) column shows the number of respondents in each category.
An asterisk (*) means this is a new question for the 2021 survey.
How we protect anonymity and privacy
To protect you, we:
• de-identify all survey response data provided to your organisation
• don’t release results when fewer than 10 people in a demographic group have responded to the survey
• don’t release employee opinion results for demographic groups where organisations have fewer than 30 responses in total.
Working arrangement (n) %
Full-Time 319 75%
Part-Time 109 25%
Gross base salary (ongoing/fixed term only) (n) %
Below $65k 78 20%
$65k to $95k 154 40%
$95k to $125k 84 22%
$125k or more 22 6%
Prefer not to say 49 13%
Organisational tenure (n) %
<1 year 85 20%
1 to less than 2 years 48 11%
2 to less than 5 years 109 25%
5 to less than 10 years 72 17%
10 to less than 20 years 80 19%
More than 20 years 34 8%
Management responsibility (n) %
Non-manager 366 86%
Other manager 39 9%
Manager of other manager(s) 23 5%
Employment type (n) %
Ongoing and executive 341 80%
Fixed term 46 11%
Other 41 10%
Have you moved between roles in the last 12 months?* (n) %
I have not moved between roles 321 75%
I have moved to a different role within my organisation (including acting roles)
82 19%
I have moved to my role from outside the Victorian public sector
18 4%
I have moved to my role from a different Victorian public sector organisation
7 2%
114People Matter Survey | results 114

DemographicsEmployment characteristics 2 of 2
What this is
These are the employment characteristics of staff.
Why this is important
This helps organisations understand the diversity of their staff and inform workforce strategies.
How to read this
Each table shows the breakdown of responses from your survey.
The (n) column shows the number of respondents in each category.
An asterisk (*) means this is a new question for the 2021 survey
How we protect anonymity and privacy
To protect you, we:
• de-identify all survey response data provided to your organisation
• don’t release results when fewer than 10 people in a demographic group have responded to the survey
• don’t release employee opinion results for demographic groups where organisations have fewer than 30 responses in total.
Primary workplace location over the last 3 months (n) %
Shepparton 220 51%
Wangaratta 117 27%
Other city or town 61 14%
Melbourne: Suburbs 20 5%
Outside Victoria 7 2%
Melbourne CBD 1 0%
Bendigo 1 0%
Wodonga 1 0%
Primary workplace type over the past 3 months* (n) %
Home/private location 172 40%
A main office 135 32%
A frontline or service delivery location (that is not a main office or home/private location)
55 13%
A hub/shared work space 51 12%
Other (please specify) 15 4%
Other workplace type over the past 3 months* (n) %
Home/private location 229 54%
A main office 139 32%
No, I have not worked from any other locations
69 16%
A frontline or service delivery location (that is not a main office or home/private location)
38 9%
A hub/shared work space 35 8%
Other 10 2%
115People Matter Survey | results 115

DemographicsAdjustments
What this is
These are adjustments staff requested to perform in their role.
Why this is important
This shows organisations how flexible they are in adjusting for staff.
How to read this
Each demographic area shows the breakdown of responses from your survey results.
The (n) column shows the number of respondents in each category.
How we protect anonymity and privacy
To protect you, we:
• de-identify all survey response data provided to your organisation
• don’t release results when fewer than 10 people in a demographic group have responded to the survey
• don’t release employee opinion results for demographic groups where organisations have fewer than 30 responses in total.
Have you requested any of the following adjustments at work?* (n) %
No, I have not requested adjustments 343 80%
Flexible working arrangements 64 15%
Physical modifications or improvements to the workplace
16 4%
Career development support strategies 9 2%
Other 6 1%
Job redesign or role sharing 3 1%
Why did you make this request?* (n) %
Work-life balance 32 38%
Health 27 32%
Family responsibilities 18 21%
Caring responsibilities 13 15%
Other 12 14%
Study commitments 9 11%
Disability 7 8%
What was your experience with making the request? (n) %
The adjustments I needed were made and the process was satisfactory
67 79%
The adjustments I needed were not made 15 18%
The adjustments I needed were made but the process was unsatisfactory
3 4%
116People Matter Survey | results 116

DemographicsCaring
What this is
These are staff-reported caring responsibilities.
Why this is important
This shows organisations what caring responsibilities their staff have.
How to read this
Each demographic area shows the breakdown of responses from your survey results.
The (n) column shows the number of respondents in each category.
How we protect anonymity and privacy
To protect you, we:
• de-identify all survey response data provided to your organisation
• don’t release results when fewer than 10 people in a demographic group have responded to the survey
• don’t release employee opinion results for demographic groups where organisations have fewer than 30 responses in total.
Caring responsibility (n) %
None of the above 146 34%
Secondary school aged child(ren) 86 20%
Primary school aged child(ren) 75 18%
Frail or aged person(s) 62 14%
Child(ren) - younger than preschool age 39 9%
Prefer not to say 34 8%
Person(s) with a medical condition 33 8%
Person(s) with disability 27 6%
Person(s) with a mental illness 27 6%
Preschool aged child(ren) 14 3%
Other 14 3%
117People Matter Survey | results 117

Demographics
Employment categories
What is this
This shows how many people in each employee category responded to the survey.
Why this is important
This helps you assess how representative of your organisation your survey was.
How to read this
Each demographic area shows the breakdown of responses from your survey results.
The (n) column shows the number of respondents in each category.
How we protect anonymity and privacy
To protect you, we:
• de-identify all survey response data provided to your organisation
• don’t release results when fewer than 10 people in a demographic group have responded to the survey
• don’t release employee opinion results for demographic groups where organisations have fewer than 30 responses in total.
Which of the following categories best describes your current position? (n) %
Vocational education teacher 184 43%
Clerical and administrative worker 118 28%
ESL teacher 9 2%
Other 117 27%
118People Matter Survey | results 118

119People Matter Survey | results 119