Embed Size (px)
Citation preview

www.taxpayersalliance.com
GORDON BROWN’S ECONOMIC FAILURE
By Matthew Sinclair with Corin Taylor and Mike Denham

43 Old Queen Street, London SW1H 9JA � www.taxpayersalliance.com
0845 330 9554 (office hours) � 07795 084 113 (media – 24 hours)
2
Contents About the authors 3 Executive Summary 4 Introduction 6 1. Growth 8 2. Stability 17 3. Public spending 28 4. The burden on ordinary people 36 5. Conclusions 41 Appendix 42

43 Old Queen Street, London SW1H 9JA � www.taxpayersalliance.com
0845 330 9554 (office hours) � 07795 084 113 (media – 24 hours)
3
About the authors Matthew Sinclair began his work as a Policy Analyst at the TPA in May 2007, specializing in public service delivery, economic and environmental policy. He is the principal author of, among others, ‘Wasting Lives: A statistical analysis of NHS performance in a European context since 1981’ (TPA, January 2008), ‘Funding Hate Education’ (TPA, January 2008), ‘The Case Against Further Green Taxes’ (TPA, September 2007), ‘The Cost of Crime (TPA, July 2008) and ‘The Burden of Green Taxes’ (TPA, August 2008). Corin Taylor is Research Director at the TaxPayers’ Alliance. As well as overseeing the TPA’s extensive research programme, his research projects have included the commissioning of a dynamic model of the UK economy, which showed the economic benefits of reducing the tax burden. He has also written a number of opinion pieces on tax for the Financial Times. In 2006, he was Political Secretary to the Tax Reform Commission and wrote several sections of the Commission’s report. Prior to that he worked for the think tank Reform for two years as Economics Research Officer. Corin is also a Senior Policy Adviser at the Institute of Directors, working on fiscal policy and public sector reform issues, and sits on the Economic Dependency Committee of the Centre for Social Justice. Mike Denham is a former Treasury economist who worked extensively on public spending and fiscal analysis during the 1970s and early 1980s. His work included cost benefit appraisal of public projects, analysis of public sector cost inflation and value for money studies. For the next 20 years he worked in the City as an investment manager, closely following fiscal and monetary policy developments. Now semi-retired, he scrutinises public spending on his blog, Burning Our Money.

43 Old Queen Street, London SW1H 9JA � www.taxpayersalliance.com
0845 330 9554 (office hours) � 07795 084 113 (media – 24 hours)
4
Executive Summary This paper examines Gordon Brown’s record as Chancellor: the performance of the British economy under his stewardship compared to other countries and Britain in earlier years. It aims to address the vital question of whether the current downturn is an unavoidable result of global problems or whether an end to benign global conditions has exposed the effects of harmful economic policy. The report’s findings illustrate how British relative economic performance has weakened over the last ten years: � Growth has only been strong relative to sluggish European economies; all of the other English-speaking countries have seen faster economic growth. Had Britain matched US levels of growth since 1997, GDP in 2006 would be £14 billion higher. British productivity rates continue to lag, and Britain was catching up a lot faster before Gordon Brown became Chancellor. Our employment rate has remained roughly constant while other countries have enjoyed significant improvements.
� This poor growth performance is driven by an increasing burden of government spending, Britain falling behind in cutting corporate tax and increasing regulation and tax complexity. Britain slipped from having the 5th lowest corporate tax rate in the OECD to the 10th highest, out of 30.
� Initially, while the Government was committed to tight spending limits, debt and borrowing fell significantly. Since that commitment ended in 2000, debt has risen by 5.1 percentage points of GDP. If the Government's true liabilities, including commitments to pay public sector pensions, are counted, then Britain's deficit becomes 129 per cent of GDP. That situation is worsening; in 2008 Britain has the fifth largest budget deficit in the 30 OECD countries. By contrast, the UK only had the 13th largest deficit in 1997.
� Low inflation has been the product of international trends, rather than a policy success. Over the last ten years inflation and long term interest rates in Britain have been higher, on average, than in the United States and the Euro area.
� In 1997 taxes on pension funds were increased sharply, this has cost pension funds between £100-150 billion so far and accelerated the shift away from defined benefit schemes in the private sector. If present trends were to continue there would be no active members of defined benefit schemes in the private sector in 10 years, and no active members of occupational schemes of any kind in just 12 years.
� Contrary to rhetoric about making ‘tough choices’, energy policy over the last ten years has stored up problems for the future. Huge subsidies have been provided to renewable energy companies, at significant cost to the

43 Old Queen Street, London SW1H 9JA � www.taxpayersalliance.com
0845 330 9554 (office hours) � 07795 084 113 (media – 24 hours)
5
consumer, while new capacity has not been installed to replace ageing nuclear and coal power plants. This is leading to a significant capacity crunch with between 25 and 40 per cent of the generating fleet needing to be replaced by 2016. Gas, much of it from unreliable foreign sources, is expected to increase as a share of production from 37 per cent to 55 per cent in 2020.
� Spending on a range of public services has increased substantially but the results have been poor. The trend in falling mortality amenable to healthcare has not improved, Britain has fallen down international education rankings, recorded crime has increased and Britain has the lowest ratio of motorway network to the number of cars of any major European economy. A range of estimates show public sector productivity falling; for example, NHS productivity is estimated to have fallen 1 per cent each year. The welfare system has become far more complicated and this has resulted in £7.3 billion of overpaid tax credits and a 147 per cent increase in the number of people facing a marginal deduction rate of 60 per cent or more.
� The tax burden has increased by 51 per cent in real terms since 1997-98 as tax rates have increased and the thresholds for many taxes have not been increased in line with inflation. Real disposable incomes increased by an average of 3.2 per cent each year before Gordon Brown became Chancellor but have gone up by just 2.6 per cent in each year since.
It is clear that Britain’s economic performance has been worsening over the last ten years and this has been the result of poor economic policy. Ordinary people and businesses alike have been buried under an increasingly onerous burden of taxes and regulations, while rising public spending has produced little improvement in infrastructure or the public services. International problems have exposed, rather than created, the weaknesses that seem likely to produce a recession.

43 Old Queen Street, London SW1H 9JA � www.taxpayersalliance.com
0845 330 9554 (office hours) � 07795 084 113 (media – 24 hours)
6
Introduction
“You only find out who is swimming naked when the tide goes out” – Warren Buffett, Berkshire Hathaway 2001 Chairman’s Letter
For a long time Gordon Brown enjoyed a reputation for effective economic management. A combination of a strong global economy and the benefits of economic liberalisation in the 1980s and early 1990s created superb conditions for British economic success. Warning signs that Britain’s competitiveness was being endangered by an increasing burden of tax and ineffective government spending never created much of a sense of urgency. Since the beginning of the credit crunch a year ago things have changed substantially. Most mainstream economic commentators now paint a far darker picture of underlying weaknesses in the performance of the economy over the last ten years. The OECD expects that Britain will be the only major economy to experience a recession this year.1 This report will provide a comprehensive account of economic performance while Brown was Chancellor. It will become apparent that, in area after area where the Government claim a strong record, Britain has performed poorly by comparison with the rest of the world or before 1997. Chapter 1 examines the record of GDP and productivity growth in the last ten years and compares Britain's performance with that in other developed countries. The report argues that Britain has only done well compared with sclerotic European countries and not with the other English speaking developed countries. Chapter 2 asks whether or not Britain has enjoyed noticeably low inflation and interest rates or, instead, has benefitted from benign international trends. It also looks at whether Britain has properly prepared for the long term in pension provision and energy infrastructure. Chapter 3 argues that increases in public spending have delivered poor results across a range of public services. It also describes how the benefits system is growing more complex and undermining incentives for people to work. Chapter 4 sets out the burden that rising taxes and ineffective public spending have imposed on ordinary people and how this has stunted household disposable income growth.
1 Elmeskov, J. ‘What is the economic outlook for OECD countries? An interim assessment’, OECD, September 2008

43 Old Queen Street, London SW1H 9JA � www.taxpayersalliance.com
0845 330 9554 (office hours) � 07795 084 113 (media – 24 hours)
7
Chapter 5 concludes the report by arguing that Gordon Brown's economic record is now accepted, by a broad range of economic commentators, as a disaster. Another report, produced in co-operation with Conservative Way Forward, argues that Britain could improve its economic performance dramatically by cutting corporate tax rates.
43 Old Queen Street, London SW1H 9JA � www.taxpayersalliance.com
0845 330 9554 (office hours) � 07795 084 113 (media – 24 hours)
8
1. Growth Britain’s economic performance in the last decade has been buoyed by a concentration of the European financial services industry in London and the legacy of economic liberalisations in the Eighties and early Nineties. Britain appears to have done well compared to European competitors but poorly compared to other English-speaking nations. 1.1 GDP growth
“While other countries have suffered recessions, the British economy has now been growing continuously for over a decade – the longest period of sustained growth in our history.” – Alistair Darling, Budget Speech 2008
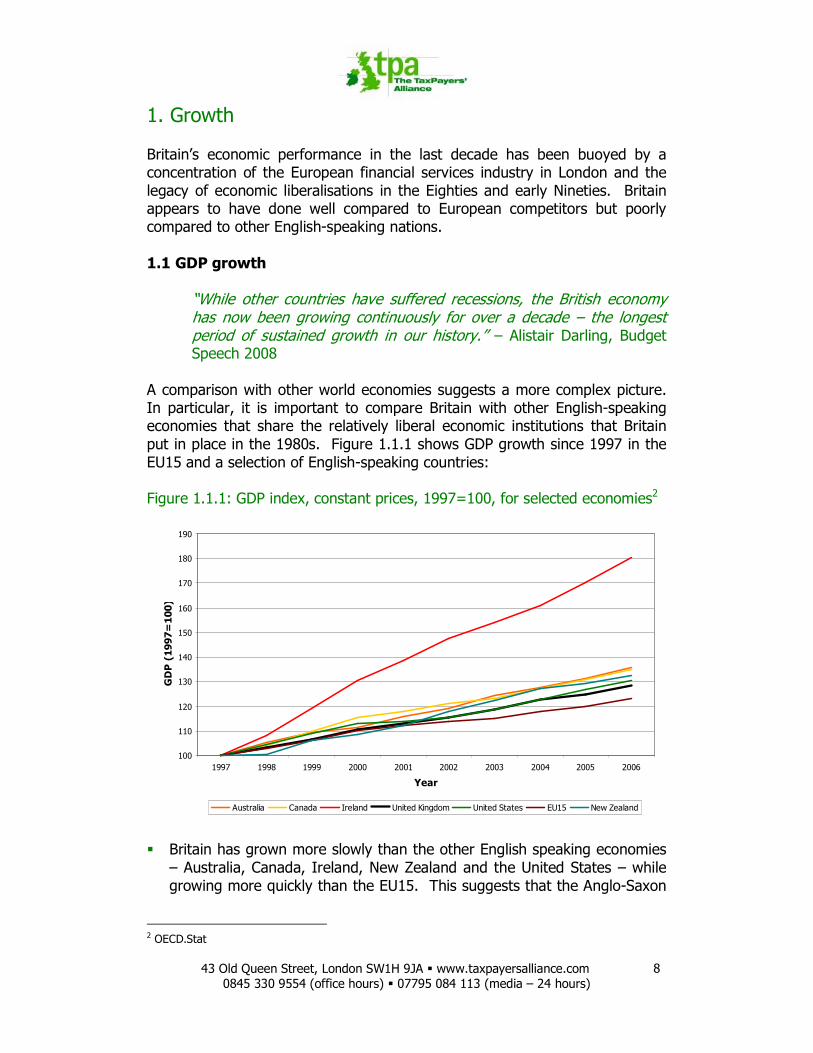
A comparison with other world economies suggests a more complex picture. In particular, it is important to compare Britain with other English-speaking economies that share the relatively liberal economic institutions that Britain put in place in the 1980s. Figure 1.1.1 shows GDP growth since 1997 in the EU15 and a selection of English-speaking countries: Figure 1.1.1: GDP index, constant prices, 1997=100, for selected economies2
100
110
120
130
140
150
160
170
180
190
1997 1998 1999 2000 2001 2002 2003 2004 2005 2006
Year
GDP (1997=100)
Australia Canada Ireland United Kingdom United States EU15 New Zealand
� Britain has grown more slowly than the other English speaking economies – Australia, Canada, Ireland, New Zealand and the United States – while growing more quickly than the EU15. This suggests that the Anglo-Saxon
2 OECD.Stat

43 Old Queen Street, London SW1H 9JA � www.taxpayersalliance.com
0845 330 9554 (office hours) � 07795 084 113 (media – 24 hours)
9
economies, and particularly Ireland, have generally outperformed their Continental rivals but that Britain is increasingly struggling to keep up.
� Had Britain matched US levels of growth since 1997, GDP in 2006 would have been nearly £14 billion higher. If Britain had done even better and matched Irish levels of growth, GDP would be over £380 billion higher.
A similar picture can be seen from looking at the productivity and employment record. There are several ways that Gordon Brown, as Chancellor of the Exchequer, contributed to this relative failure. In particular, increased government spending and slow progress in cutting corporate tax rates have reduced economic growth.

43 Old Queen Street, London SW1H 9JA � www.taxpayersalliance.com
0845 330 9554 (office hours) � 07795 084 113 (media – 24 hours)
10
1.2 Productivity
“Over the next few years we must seize this opportunity – by challenging ourselves to lift our productivity in each and every industry towards the levels of the world's best.” – Gordon Brown, Budget Speech 1998
How has Gordon Brown fared in closing the labour productivity gap between Britain and other countries? Figure 1.2.1 shows labour productivity, with constant prices, for the EU15 and English-speaking countries. There has been little apparent progress since 1997: Figure 1.2.1: Labour productivity, $/hr worked, constant prices3
0
5
10
15
20
25
30
35
40
45
50
1997 1998 1999 2000 2001 2002 2003 2004 2005 2006
Year
Labour productivity, $/hr worked,
constant prices
Australia Canada Ireland United Kingdom United States EU15 New Zealand
The United States is normally used as a benchmark for the productivity performance of different economies as it is the major economy with the highest productivity, and it is on this score that the weakness of Gordon Brown’s record becomes clear compared with earlier governments. � Between 1979 and 1997 UK labour productivity as a percentage of US labour productivity rose from 46.59 per cent to 52.96 per cent. Between 1997 and 2006 the rise was from 53.17 per cent to 53.24 per cent.
� The annual catch-up between 1979 and 1997 was nearly 39 times as fast as the annual catch-up between 1997 and 2006.
3 OECD.Stat

43 Old Queen Street, London SW1H 9JA � www.taxpayersalliance.com
0845 330 9554 (office hours) � 07795 084 113 (media – 24 hours)
11
1.3 Employment
“I can also report that in the last year employment has risen, with 220,000 more men and women in work…. Britain has a higher proportion of men and women in employment than America, Japan and all our major European neighbours.” – Gordon Brown, Budget Speech 2007
Britain’s employment rate has historically been high, thanks to a relatively liberal labour market. However, there is little evidence that Britain has done particularly well recently. The unemployment rate can be a misleading measure as it only compares to those actively looking for work, a number that can vary significantly. Equally, the number of jobs created can be a misleading measure as it may reflect increases in the underlying population. For that reason, we look at the employment rate within the working age population. OECD statistics on the number employed and the size of the population aged 15-64 were used to produce Figure 1.3.1. Figure 1.3.1: Employment as a fraction of total population aged 15-644
0.56
0.58
0.6
0.62
0.64
0.66
0.68
0.7
0.72
0.74
0.76
0.78
2000 2001 2002 2003 2004 2005 2006 2007
Year
Employment as a fraction of total population
aged 15-64
Australia Canada Ireland United Kingdom United States European Union 15 New Zealand
� While the UK started from a relatively strong position in 2000 (the earliest year that data is available) it did not see the improvement enjoyed by other countries such as Australia and Canada, which overtook the UK, and Ireland and the EU15 which are rapidly catching up. Britain’s employment rate is still relatively high but in recent years performance has been subdued.
4 OECD.Stat

43 Old Queen Street, London SW1H 9JA � www.taxpayersalliance.com
0845 330 9554 (office hours) � 07795 084 113 (media – 24 hours)
12
1.4 Size of government
“The myth that the solution to every problem is increased spending has been comprehensively dispelled under the Conservatives. Spending has risen.… It is what money is actually spent on that counts more than how much money is spent.” – Labour Party Manifesto 1997
Spending has increased substantially since 2000. Government spending in Britain has grown significantly faster than the OECD average. Figure 1.4.1: Government spending as a percentage of GDP, growth in OECD average and UK5
100
105
110
115
120
125
2000 2001 2002 2003 2004 2005 2006 2007
Year
Sp
en
din
g a
s a
perc
en
tag
e o
f G
DP
(2000=
100)
UK OECD
This has resulted in government spending as a proportion of GDP in Britain rising to above the OECD average.
5 OECD, “Economic Outlook 81”, Annex Table 25, May 2007

43 Old Queen Street, London SW1H 9JA � www.taxpayersalliance.com
0845 330 9554 (office hours) � 07795 084 113 (media – 24 hours)
13
Figure 1.4.2: Government spending as a percentage of GDP, OECD average and UK6
35
37
39
41
43
45
47
2000 2001 2002 2003 2004 2005 2006 2007
Year
Spending/GDP, %
UK OECD
This increase in the size of the state has significant economic effects. A series of institutions and academics have produced estimates of the effect of growth in the size of the state on economic growth. Growth in the size of the British state since 2000, when Gordon Brown began aggressive increases in state spending, will already have had significant effects on annual GDP. There are a number of estimates of the effect of the size of the state on economic growth. These estimates can be found in the Appendix. An average of three estimates by respected economists and institutions suggests that our GDP per annum is £12 billion lower than it would have been if government’s share of the economy had not increased. This is pure deadweight loss and does not include other government decisions that may reduce growth, such as increased regulation. Table 1.4.1: Estimates of loss of annual GDP due to dynamic costs from post-1999 spending growth Organisation Implied loss to annual GDP from
post-1999 spending growth
European Central Bank £13.7 billion
Barro £14.3 billion
Stockholm School of Economics £7.9 billion
Average £12 billion
6 Ibid.

43 Old Queen Street, London SW1H 9JA � www.taxpayersalliance.com
0845 330 9554 (office hours) � 07795 084 113 (media – 24 hours)
14
1.5 Corporate tax
“Britain's corporate tax rate, the lowest of all the major economies.” – Gordon Brown, Budget Speech 2007
Britain’s corporate tax rate is significantly higher than the rate in many other OECD countries and substantial economic gains could be obtained by cutting corporate tax rates: � While Brown was chancellor Britain slipped from having the 5th lowest corporate tax rate in the OECD in 1996 (of the 26 countries with data available) to having the 10th highest rate of the 30 OECD countries in 2007. Even with a cut to 28 per cent the UK is still above the 2007 OECD average rate.7
Between 1994 and 2003 the Irish rate of corporate tax fell from 40 per cent to the current rate of 12.5 per cent. This led to a number of economic benefits: � In 1993 Ireland was significantly poorer than the United Kingdom, with income per capita 28 per cent higher in the UK. Its economy then took off, with average real terms economic growth between 1994 and 2006 of 7.4 per cent. In contrast, the UK managed just 2.9 per cent real terms growth in the same period. Today income per capita is 20 per cent higher in Ireland than it is in the UK.
Figure 1.5.1: GDP per capita, UK and Ireland, current $8
0
5,000
10,000
15,000
20,000
25,000
30,000
35,000
40,000
45,000
1987 1988 1989 1990 1991 1992 1993 1994 1995 1996 1997 1998 1999 2000 2001 2002 2003 2004 2005 2006
Year
GDP per capita, $
Ireland United Kingdom
� The expansion of Ireland’s economy, as low corporate tax rates attracted international investment, led to a huge increase in corporate tax revenue.
7 KPMG, ‘Corporate Tax Rate Survey 2007’ 8 World Bank
43 Old Queen Street, London SW1H 9JA � www.taxpayersalliance.com
0845 330 9554 (office hours) � 07795 084 113 (media – 24 hours)
15
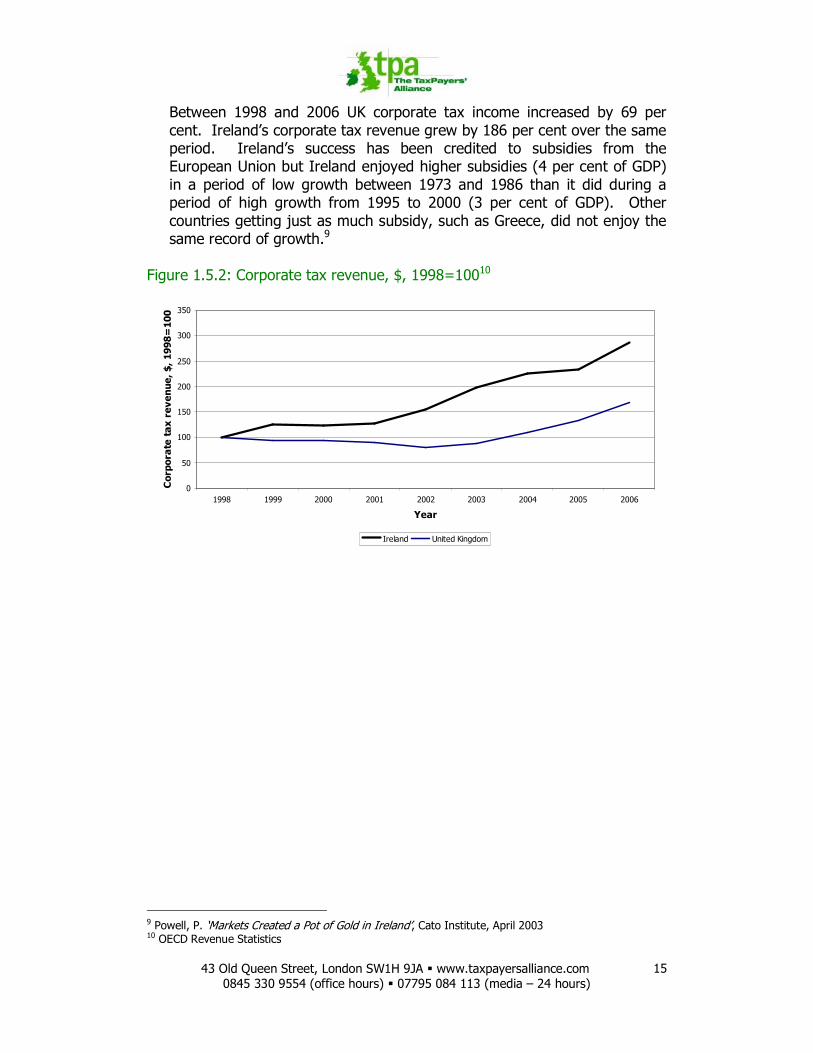
Between 1998 and 2006 UK corporate tax income increased by 69 per cent. Ireland’s corporate tax revenue grew by 186 per cent over the same period. Ireland’s success has been credited to subsidies from the European Union but Ireland enjoyed higher subsidies (4 per cent of GDP) in a period of low growth between 1973 and 1986 than it did during a period of high growth from 1995 to 2000 (3 per cent of GDP). Other countries getting just as much subsidy, such as Greece, did not enjoy the same record of growth.9
Figure 1.5.2: Corporate tax revenue, $, 1998=10010
0
50
100
150
200
250
300
350
1998 1999 2000 2001 2002 2003 2004 2005 2006
Year
Corporate tax revenue, $, 1998=100
Ireland United Kingdom
9 Powell, P. ‘Markets Created a Pot of Gold in Ireland’, Cato Institute, April 2003 10 OECD Revenue Statistics

43 Old Queen Street, London SW1H 9JA � www.taxpayersalliance.com
0845 330 9554 (office hours) � 07795 084 113 (media – 24 hours)
16
1.6 Regulation and the complexity of the tax system “This Budget continues a programme of tax simplification. I am today announcing further steps to help small companies simplify their tax calculations.” – Alistair Darling, Budget Speech 2008 The tax system has steadily grown more complicated:11 � Tolley’s Yellow Tax Handbook of the British Tax Code was 4,555 pages in 1997. In nine years it doubled in length to 9,841 pages.
� The Inland Revenue’s spending on administration increased by 75 per cent from £1.6 billion in 1997 to £2.8 billion in 2004.
� Over the 2000-05 period the Finance Act averaged 481 pages compared with 157 in the early 1980s. The most recent five-year period saw an increase of over 50 per cent on the previous five-year period.
� There were over 240 reliefs and exemptions providing £157 billion in 2005-06.
A business survey for the Tax Reform Commission in 2006 found that:12 � 60 per cent of firms were increasing their spending on tax planning and compliance with tax law. Only three per cent were decreasing spending.
� 78 per cent said that the level of tax complexity has increased over the last five years. Only 2 per cent said that it had decreased.
11 Tax Reform Commission, ‘Tax Matters: Reforming the Tax System’, October 2006 12 Ibid.

43 Old Queen Street, London SW1H 9JA � www.taxpayersalliance.com
0845 330 9554 (office hours) � 07795 084 113 (media – 24 hours)
17
2. Stability In the period between when Gordon Brown became Chancellor of the Exchequer in 1997 and the beginning of the credit crunch in 2007, remarkably benign conditions prevailed in the international economy. Low cost imports from emerging economies, particularly China, drove down inflation and capital surpluses in East Asian economies kept interest rates down. For that reason we need to look at how Britain’s inflation and interest rates compare to other major economies. 2.1 Debt
“Debt is 44 per cent of national income in the USA, 50 per cent in the euro area, and 92 per cent in Japan, but in Britain we expect debt from 2007-08 to 2012 to be 38.2, 38.5, 38.8, 38.8 and 38.6 per cent - at all times meeting our second fiscal rule.” – Gordon Brown, Budget Speech 2007
This suggests that there is not a significant problem with high levels of government borrowing. However, it omits two facts about Brown’s record. � During the initial years Gordon Brown was chancellor debt fell rapidly as spending was constrained by a manifesto commitment to match Conservative spending plans until 1999.
� When this commitment expired and the spending boom began, from 2000, debt began to rise quite rapidly again. Between 2000 and 2007 debt rose by 5.1 percentage points of GDP.
This illustrates that, in the absence of the restraint of prior manifesto commitments, Brown failed to control borrowing.

43 Old Queen Street, London SW1H 9JA � www.taxpayersalliance.com
0845 330 9554 (office hours) � 07795 084 113 (media – 24 hours)
18
Figure 2.1.1: Government net debt, percentage of GDP13
0
5
10
15
20
25
30
35
40
45
1997 1998 1999 2000 2001 2002 2003 2004 2005 2006 2007
Year
Government Net Debt, %
of GDP
More importantly, the official debt figures only reflect a small portion of total government debt. Table 2.1.1 shows other government financial commitments that would, outside government, normally be understood as debt. These include commitments under Private Finance Initiative schemes and the government guaranteed debt of Network Rail. Table 2.1.1: Government liabilities14
Item Debt
Public Sector Net Debt £543 billion
PFI debt £91 billion
Nuclear decommissioning £73 billion
Public sector pensions £1,071 billion
Northern Rock £100 billion
Network Rail £20 billion
Total £1,898 billion
GDP £1,473 billion
% of GDP 129%
13 Office for National Statistics, ‘Public Sector Finances’ 14 Office for National Statistics, ‘Public Sector Finances’; Public Accounts Committee, ‘HM Treasury: Tendering and benchmarking in PFI’, Sixty-third Report of Session 2006-07, October 2007; Public Accounts Committee, ‘Nuclear Decommissioning Authority – Taking forward decommissioning’, Thirty-eighth Report of Session 2007-08, June 2008; Record, N. ‘Sir Humphrey’s Legacy: An Update’, IEA, January 2008; Porter, A. & Conway, E. ‘Gordon Brown suffers over Northern Rock debt’, Daily Telegraph, February 2008; Network Rail Limited, ‘Annual Report and Accounts 2008’

43 Old Queen Street, London SW1H 9JA � www.taxpayersalliance.com
0845 330 9554 (office hours) � 07795 084 113 (media – 24 hours)
19
As Table 2.1.1 shows, a more complete account of government debt suggests that around 129 per cent of GDP is owed. Many of these liabilities, such as the PFI debt and the debts of stricken mortgage bank Northern Rock, have been incurred since Gordon Brown became Chancellor.

43 Old Queen Street, London SW1H 9JA � www.taxpayersalliance.com
0845 330 9554 (office hours) � 07795 084 113 (media – 24 hours)
20
2.2 Borrowing
“The disciplines we have imposed mean that borrowing is much lower than it was before 1997 – and so too is debt.” – Alistair Darling, Budget Speech 2008
At 2.6 per cent of GDP in 2008, the United Kingdom has the fifth largest budget deficit of the 30 OECD countries. By contrast, in 1997 the UK only had the 13th largest deficit in the OECD. It is likely that the final picture of 2008 will be far worse. Figure 2.2.1: Government deficit/surplus, OECD countries, percentage of GDP, 200815
-10
-5
0
5
10
15
20
Norway
Denmark
Finland
Sweden
Korea
New Zealand
Ireland
Spain
Luxembourg
Switzerland
Australia
Canada
Netherlands
Belgium
Iceland
Germany
Austria
Euro area
Total OECD
France
Slovak Republic
Greece
Portugal
Poland
Italy
United Kingdom
United States
Japan
Czech Republic
Hungary
Surplus (+) or deficit (-) as %
of nominal GDP
A large part of the problem is caused by the fact that, since the beginning of the big increases in public spending, the Government’s predictions of spending have been somewhat optimistic and their estimates for taxation extremely optimistic: 2001-02 £million Forecast,
2001 Budget Outturn, 2003 Budget
Error
Current receipts 398,400 389,900 8,500 overestimate
Spending 393,700 389,600 4,100 overestimate
15 OECD, “Economic Outlook 81”, Annex Table 27, May 2007

43 Old Queen Street, London SW1H 9JA � www.taxpayersalliance.com
0845 330 9554 (office hours) � 07795 084 113 (media – 24 hours)
21
2002-03 £million Forecast,
2002 Budget Outturn, 2004 Budget
Error
Current receipts 407,200 396,200 11,000 overestimate
Spending 418,400 419,100 700 underestimate
2003-04 £million Forecast,
2003 Budget Outturn, 2005 Budget
Error
Current receipts 428,300 418,900 9,400 overestimate
Spending 455,700 454,300 1,400 underestimate
2004-05 £million Forecast,
2004 Budget Outturn, 2006 Budget
Error
Current receipts 454,700 451,300 3,400 overestimate
Spending 487,600 491,000 3,400 underestimate
2005-06 £million Forecast,
2005 Budget Outturn, 2007 Budget
Error
Current receipts 486,700 485,700 1,000 overestimate
Spending 518,600 523,400 4,800 underestimate
� Over this period, current receipts outturns were net £33.3 billion lower than expected in each Budget immediately preceding the financial year. Net spending outturns were £3.4 billion higher than expected in each Budget immediately preceding the financial year.
� The fiscal position turned out worse than expected as higher taxes failed to deliver the revenues expected by static analyses.

43 Old Queen Street, London SW1H 9JA � www.taxpayersalliance.com
0845 330 9554 (office hours) � 07795 084 113 (media – 24 hours)
22
2.3 Inflation
“Every country has faced a trebling of oil and commodity prices. But while inflation peaked at 4.7 per cent in America and went as high as 3.3 per cent in the G7, here in Britain, inflation has never gone beyond 3 per cent, has fallen from 3 per cent to 2.8 per cent, and will fall further this year to 2 per cent.” – Gordon Brown, Budget Speech 2007
Low inflation has been the benign product of international trends rather than a genuine policy success. Over the last ten years inflation in the UK has been higher, on average, than in the United States and the Euro area. The mean inflation rate in the UK was 2.4 per cent against 2.2 per cent in the United States and 2.0 per cent in the Euro area. Figure 2.3.1: GDP deflators16
0.0
0.5
1.0
1.5
2.0
2.5
3.0
3.5
1997 1998 1999 2000 2001 2002 2003 2004 2005 2006 2007
Year
GDP deflator, %
United Kingdom United States Euro area
16 OECD, “Economic Outlook 81”, Annex Table 16, May 2007

43 Old Queen Street, London SW1H 9JA � www.taxpayersalliance.com
0845 330 9554 (office hours) � 07795 084 113 (media – 24 hours)
23
2.4 Long term interest rates
“And by holding firm to our commitment to maintain discipline in public sector pay, we will not only secure our 2 per cent inflation target but create the conditions for maintaining the low interest and mortgage rates that since 1997 have been half the 11 per cent average of the previous twenty years. And we will never return to the old boom and bust.” – Gordon Brown, Budget Speech 2007
Over the last ten years Britain’s long-term interest rates have fallen, as they have in the United States and the Euro area. However, Britain’s average long-term interest rate over the period, 5.1 per cent, is higher than that in the United States at 5.0 per cent or the Euro area’s 4.6 per cent. This suggests that low interest rates have been less an achievement of the government than a result of international economic conditions. Figure 2.4.1: Long-term interest rates17
0
1
2
3
4
5
6
7
8
1997 1998 1999 2000 2001 2002 2003 2004 2005 2006 2007
Year
Long-term
interest rates, %
United Kingdom United States Euro area
17 OECD, “Economic Outlook 81”, Annex Table 35, May 2007

43 Old Queen Street, London SW1H 9JA � www.taxpayersalliance.com
0845 330 9554 (office hours) � 07795 084 113 (media – 24 hours)
24
2.5 Pensions
“The provision of adequate pensions in old age is a major challenge for the future.... We will encourage saving for retirement, with proper protection for savings.” – Labour Party Manifesto 1997
While rising life expectancy and a higher old-age dependency ratio place stresses on all pension arrangements, Gordon Brown’s abolition of advance corporation tax relief – his infamous tax raid on pension funds – has been instrumental in destroying Britain’s private sector occupational pension system, which was once regarded as one of the best in the world. Terry Arthur, a Fellow of the Institute of Actuaries, has calculated that the 1997 tax increase has cost pension funds a cumulative £100-£150 billion, through lower-than-otherwise share dividends and growth.18 The resulting collapse of occupational schemes in the private sector has been remarkable, as the table below shows: Table 2.5.1: The collapse of private sector occupational scheme membership19 Millions Number of active members of private sector occupational schemes
Year Defined Benefit Defined Contribution Hybrid Total
1995 4.7 1.1 0.3 6.1
2000 4.6 0.9 0.1 5.7
2004 3.6 1.2 - 4.8
2005 3.7 1.0 - 4.7
2006 3.0 1.0 - 4.0
2007 2.7 0.9 - 3.6
Change 1995-2007
-2.0 -0.2 -0.3 -2.5
% change 1995-2007
-43% -18% -100% -41%
NB: Figures rounded to nearest 100,000. Figures may not sum to totals due to rounding.
A 43 per cent fall in the number of active members of private sector defined benefit schemes, and a 41 per cent fall overall, in just 12 years, is a devastating indictment of the impact of Gordon Brown’s misguided policies. The pace of decline has also been accelerating: � Since 2000, the annual average fall in the number of active members of defined benefit schemes in the private sector has been 270,000. If this
18 Conclusion of Terry Arthur’s paper submitted to the Pensions Board of the Actuarial Profession in August 2005 19 Occupational pension scheme surveys, 1995, 2000, 2004 and 2005, Government Actuary’s Department; Occupational pension scheme survey 2007, Office for National Statistics

43 Old Queen Street, London SW1H 9JA � www.taxpayersalliance.com
0845 330 9554 (office hours) � 07795 084 113 (media – 24 hours)
25
rate of decline were to continue there would be no active members of defined benefit schemes in the private sector in just 10 years.
� Since 2000, the annual average fall in the number of active members of all private sector occupational schemes has been 300,000. If this trend were to continue there would be no active members of any occupational schemes in the private sector in just 12 years.
It’s not just the number of active members of private sector occupational schemes that has collapsed. The number of open schemes themselves has also fallen dramatically, as is shown below: Table 2.5.2: The collapse of open private sector occupational pension schemes20 Year Number of open private sector
occupational pension schemes
1995 Data not available
2000 62,100
2004 54,000
2005 51,300
2006 32,600
2007 28,700
Change 2000-2007 -33,400
% change 2000-2007 -54% NB: Figures rounded to nearest 100.
� Since 2000, the annual average fall in the number of open occupational schemes in the private sector has been almost 4,800. If this rate of decline were to continue there would be no open occupational private sector pension schemes in just 7 years.
Public sector pension arrangements, however, remain extremely generous. Most public sector schemes still have a pension age of 60, with generous early retirement provision, while the number of active members of defined benefit schemes in the public sector has actually increased – from 4.2 million in 1995 to 5.2 million in 2007.21 Most public sector pension schemes are not funded, and therefore leave an enormous burden for taxpayers, now and in the future. Estimates of total unfunded public sector pension liabilities vary, but all are alarmingly high:
20 Occupational pension scheme surveys, 1995, 2000, 2004 and 2005, Government Actuary’s Department; Occupational pension scheme survey 2007, Office for National Statistics 21 Occupational pension scheme survey, 1995, Government Actuary’s Department; Occupational pension scheme survey 2007, Office for National Statistics

43 Old Queen Street, London SW1H 9JA � www.taxpayersalliance.com
0845 330 9554 (office hours) � 07795 084 113 (media – 24 hours)
26
� The Treasury estimates total unfunded public sector pension liabilities to be £530 billion, or £21,000 per household.22
� Consultant actuaries Watson Wyatt estimate the bill to be £960 billion, or £38,000 per household.23
� The Institute of Economic Affairs estimate the bill to be £1,071 billion, or over £40,000 per household.24
The Government did attempt to reform public sector pensions in 2005, proposing to raise the retirement age for future accrual of existing members. However, it soon backed down in the face of nationwide strike threats from the unions, with the result that the public sector retirement age is now 65 only for new members. In 40 years’ time, when the majority of these new members retire, the state pension age will have increased to 68. Gordon Brown has overseen the collapse of occupational private sector pension provision, while his failure to reform public sector pensions will leave an enormous bill for decades to come. Taxpayers, many of whom have now have no pension of their own, will be forced to pay dearly every year to prop up gold-plated schemes in the public sector. This is Gordon Brown’s pension legacy.
22 House of Commons Hansard, 25 June 2007, Col. 393W 23 Watson Wyatt press release, 8 March 2006 http://www.watsonwyatt.com/news/press.asp?ID=15784 24 Record, N. ‘Sir Humphrey’s Legacy: An Update’, IEA, January 2008

43 Old Queen Street, London SW1H 9JA � www.taxpayersalliance.com
0845 330 9554 (office hours) � 07795 084 113 (media – 24 hours)
27
2.6 Energy
“Third, we need the same long termism in our approach to energy. We must – and will – take the right long term decisions to invest now for the next generation of sustainable and secure energy supplies.” – Gordon Brown, Speech to the CBI Annual Conference 2007
Government regulation is making a significant contribution to the cost of energy to consumers: � The Government estimates that climate change regulations make up 14 per cent of the average household electricity bill. The regulations that make the largest contribution to household electricity bills are the Renewables Obligation and the European Union Emissions Trading Scheme.25
� Despite massive subsidies under the Renewables Obligation, the amount of wind power (the main source of renewable power) added in 2007 was less than three quarters the amount installed in 2006.26
� Under the EU Emissions Trading Scheme each country was allowed to set its own targets for emissions reduction and the UK, which set a strict target, paid a subsidy of £470 million to other countries which did not. Almost every other nation participating in the scheme made a profit. The result was that British consumers of electricity paid a substantial premium while the scheme failed to achieve significant emissions reductions.27
Government policy over the last ten years, and a failure to take long-term decisions, has led a ‘capacity crunch’ to develop. This endangers Britain’s future energy security and means that our economy is overly dependent on imported gas that is becoming increasingly difficult to obtain: � The Renewable Energy Foundation estimates that by 2016 falling capacity at existing plants will require the replacement of between 25 and 40 per cent of the UK’s current generating fleet.28 This will be extremely challenging.
� The percentage of the UK’s electricity supplied by gas-fired power stations is expected to rise from 37 per cent to 55 per cent by 2020.29
25 BERR, ‘UK Renewable Energy Strategy: Consultation’, June 2008, para 10.5.3, p. 231. 26 Harvey, F. & Bream, R. ‘Setback for UK wind farm push’, Financial Times, February 2008 27 Open Europe, ‘The high price of hot air: Why the EU Emissions Trading Scheme is an environmental and economic failure’, July 2006 28 Renewable Energy Foundation, ‘Future Proofing UK Energy: A Commentary on the Government’s Energy Review Report’, October 2006, pg. 67 29 Department of Trade and Industry, ‘The Energy Challenge: Energy Review Report 2006’, July 2006 pg. 93

43 Old Queen Street, London SW1H 9JA � www.taxpayersalliance.com
0845 330 9554 (office hours) � 07795 084 113 (media – 24 hours)
28
3. Public spending As shown earlier in this report, the level of public spending has risen substantially, at huge cost to the taxpayer. Big increases in spending do not; however, appear to have translated into improved performance. There is good evidence that the public sector is now less efficient, and wastes more money, than ten years ago. 3.1 Health
“In health policy, we will safeguard the basic principles of the NHS, which we founded, but will not return to the top-down management of the 1970s. So we will keep the planning and provision of healthcare separate, but put planning on a longer-term, decentralised and more co-operative basis. The key is to root out unnecessary administrative cost, and to spend money on the right things – frontline care.” – Labour Party Manifesto 1997
Spending on healthcare has risen substantially since 1999 with real terms public spending on healthcare of £58.7 billion in 1999-00 and £99.4 billion in 2007-08. Figure 3.1.1: Total government healthcare spending30
40
50
60
70
80
90
100
110
1999-00 2000-01 2001-02 2002-03 2003-04 2004-05 2005-06 2006-07 2007-08
Year
Spending, £ billion, 2006-07 prices
30 2006-07 prices. HM Treasury, “Public Expenditure Statistical Analysis 2008”, April 2008, Table 4.3

43 Old Queen Street, London SW1H 9JA � www.taxpayersalliance.com
0845 330 9554 (office hours) � 07795 084 113 (media – 24 hours)
29
NHS performance does not appear to have improved in line with this massive increase in funding: � The TaxPayers’ Alliance study Wasting Lives: A statistical analysis of NHS performance in a European context since 1981 found that poor NHS performance was resulting in 17,000 deaths per year.
� Mortality amenable to healthcare was 26.9 per cent higher in the UK than in comparable European countries.31
� The study also found that Gordon Brown’s additional spending since 1999, despite significantly outpacing spending growth in comparable European countries, has made no discernable difference to the pattern of improving mortality amenable to healthcare.
Several factors have meant that additional resources for the healthcare sector have not translated into better results at the frontline: � Additional money led to significant cost inflation, particularly in staff pay, which has produced significant pressures within existing spending. The Kings’ Fund estimated that 73 per cent of additional spending in the NHS in 2004-2005, for example, was consumed by cost pressures.32
� Increases in staffing have been faster among administrative, rather than clinical, functions. Between 1999 and 2004 the number of managers and senior managers increased more than twice as quickly as the number of clinical staff.33
� While reform has always been limited the process over the last ten years of reversing, reinstating34 and then reversing again35 reforms aimed at introducing more competition within the NHS has been enormously disruptive.
31 Sinclair, M. ‘Wasting Lives: A statistical analysis of NHS performance in European context since 1981’, TaxPayers’ Alliance, January 2008 32 King’s Fund ‘An Independent Audit of the NHS under Labour (1997-2005)’, March 2005, Figure 2.6: Allocation of Hospital and Community Health Services Growth Funding, 2004-05 33 Office for National Statistics ‘Public Sector Employment Trends 2005’, October 2005, Table 6.4: NHS workforce by location and occupation group, Headcount 34 Jenkins, S. ‘A painful lesson on healthcare in the NHS Bermuda triangle’, Sunday Times, April 2006 35 Timmins, N. ‘Private sector health scheme role to be cut’, Financial Times, November 2007

43 Old Queen Street, London SW1H 9JA � www.taxpayersalliance.com
0845 330 9554 (office hours) � 07795 084 113 (media – 24 hours)
30
3.2 Education
“Education available to all – not one size fits all but responding to individual needs. This is the future for our public services. Accessible to all, personal to you. Not just a basic standard but the best quality tailored to your needs. Education is my passion.” – Gordon Brown, Speech to the 2007 Labour Party Conference
Spending on education has risen substantially since 1999 with real terms spending of £48.4 billion in 1999-00 and £73.9 billion in 2007-08. Figure 3.2.1: Total government education spending36
40
45
50
55
60
65
70
75
80
1999-00 2000-01 2001-02 2002-03 2003-04 2004-05 2005-06 2006-07 2007-08
Year
Spending, £ billion,
2006-07 prices
Despite these increases, Britain’s educational performance has been poor: � During that time the UK has fallen down the OECD’s PISA international ranking of educational performance. British educational performance ranked far higher in the 2000 edition37 of the respected OECD PISA international comparison of educational standards than it did in the 2006 survey.38 In scientific literacy Britain fell from 4th to 14th; in mathematical literacy from 8th to 24th and in reading literacy from 7th to 17th.
� This poor educational performance is contributing to a rise in the proportion of young people who are economically inactive. The OECD reports that the proportion of the UK 16-25 population who are not in employment, education or training is 13 per cent, up from 11.6 per cent in 1997. This does not reflect an international pattern as the linear average of the 16-25 not in employment, education or training rate across the OECD has fallen from 12.4 to 12 per cent.39
36 2006-07 prices. HM Treasury, “Public Expenditure Statistical Analysis 2008”, April 2008, Table 4.3 37 Office for National Statistics, “International Student Assessment: Results for England 2000”, December 2001 38 OECD, “The Programme for International Student Assessment (PISA)”, December 2007 39 OECD, “Disadvantaged youth in Britain need better skills and effective job-search help”, July 2008

43 Old Queen Street, London SW1H 9JA � www.taxpayersalliance.com
0845 330 9554 (office hours) � 07795 084 113 (media – 24 hours)
31
3.3 Law and order
“I stand for a Britain that defends its citizens and both punishes crime and prevents it by dealing with the root causes.” – Gordon Brown, Speech to the 2007 Labour Party Conference
Spending on law and order has risen substantially since 1999 with real terms public spending on public order and safety of £21.6 billion in 1999-00 and £31.5 billion in 2007-08. Figure 3.3.1: Total government law and order spending40
20
22
24
26
28
30
32
34
1999-00 2000-01 2001-02 2002-03 2003-04 2004-05 2005-06 2006-07 2007-08
Year
Spending, £ billion, 2006-07 prices
While there is a limited body of evidence due to weaknesses in the recording of crime, there are signs that the performance of the police and criminal justice system in fighting crime has been poor: � Between 1997-98 and 2007-08 total recorded crime rose 9 per cent.41 � In the same period recorded violent crime rose 275 per cent.42
40 2006-07 prices. HM Treasury, “Public Expenditure Statistical Analysis 2008”, April 2008, Table 4.3 41 Home Office, “Recorded Crime Statistics 1898 to 2001/02”; Home Office, “Recorded Crime Statistics 2002/03 to 2007/08” 42 Ibid.

43 Old Queen Street, London SW1H 9JA � www.taxpayersalliance.com
0845 330 9554 (office hours) � 07795 084 113 (media – 24 hours)
32
3.4 Transport infrastructure
“And today like every advanced nation Britain faces a stark economic choice: we could repeat the mistakes of the past, once again failing to invest long term in our science, infrastructure and skills, or, just as together we forged a British way to stability in the global economy, together we forge a British way to success in the new economy.” – Gordon Brown, Budget Speech 2005
Spending on transport has risen substantially in real terms since 1999 from £9.4 billion in 1999-00 to £20.6 billion in 2007-08. Figure 3.4.1: Total government transport spending43
5
7
9
11
13
15
17
19
21
23
1999-00 2000-01 2001-02 2002-03 2003-04 2004-05 2005-06 2006-07 2007-08
Year
Spending, £ billion, 2006-07 prices
Road transport accounts for 82 per cent of passenger travel and around 63 per cent of freight traffic.44 A reliable road network is therefore particularly crucial for both ordinary people and economic competitiveness. Unfortunately, The UK has fewer miles of motorway per car than all other major European economies and less than half the EU-25 average.45
43 2006-07 prices. HM Treasury, “Public Expenditure Statistical Analysis 2008”, April 2008, Table 4.3 44 Department for Transport, “Transport Statistics: Great Britain 2007”, September 2007 45 Road Users’ Alliance, ‘Road File 2007/08’, October 2007

43 Old Queen Street, London SW1H 9JA � www.taxpayersalliance.com
0845 330 9554 (office hours) � 07795 084 113 (media – 24 hours)
33
3.5 Public sector productivity Part of the reason for the failure of the extra spending since 1999 to deliver commensurate results has been falling productivity in the public sector. There have been various official estimates of productivity growth in the public sector: � In 2003 the Office for National Statistics (ONS) produced an experimental measure of the productivity of the whole public sector:
- Between 1995 and 1998, productivity increased by around 2 per cent. That is lower productivity growth than in the private sector but still implies that efficiency improved.
- Between 1998 and 2001, when spending increases were much larger, productivity fell by about 5 per cent.
- The ONS also made crude productivity estimates for the individual public services, finding that NHS productivity had fallen by 5 per cent and education productivity by 13 per cent between 1995 and 2001.46
� In April 2004, leaked figures from the Prime Minister’s Strategy Unit showed that public sector productivity had fallen by 10 per cent since 1997, with 15-20 per cent declines in health and education.47
� In October 2004, the ONS published a range of updated estimates of NHS productivity, covering three-quarters of NHS output, following the recommendations of the interim report of the Atkinson Review. The range of estimates showed that between 1995 and 2003, NHS productivity fell by an annual average of between 0 and 1 per cent.48
� In October 2005 the ONS published an updated estimate of education productivity, following the recommendations of the final report of the Atkinson Review. It found that education productivity rose between 1998 and 2000 and then fell sharply. Between 1998 and 2004, education productivity fell by 0.5 per cent per year on average.49
� In February 2006, the ONS published three updated estimates of NHS productivity, again following the recommendations of the final report of the Atkinson Review:50
- The first set of NHS productivity estimates presented were based on NHS output as currently published in the National Accounts. On this basis, NHS productivity fell from 1995 to 2004 by an average of between 0.6 and 1.3 per cent per year.
46 Pritchard, A., Understanding government output and productivity, Economic Trends 596, July 2003. 47 ‘Leak reveals Labour has wasted Pounds 20bn’, Sunday Times, 25 April 2004 48 Office for National Statistics (October 2004), ‘Public Service Productivity – Health’ 49 Office for National Statistics (October 2005), ‘Public Service Productivity – Education’ 50 Office for National Statistics (February 2006), ‘Public Service Productivity – Health’

43 Old Queen Street, London SW1H 9JA � www.taxpayersalliance.com
0845 330 9554 (office hours) � 07795 084 113 (media – 24 hours)
34
- Including adjustments for quality change but not for increasing value of health, NHS productivity was estimated to have changed on average by between +0.2 per cent or -0.5 per cent per year from 1999 to 2004, the period for which the quality change information is available.
- Including adjustments for quality change and for increasing value of health, NHS productivity was estimated to have risen on average by between 0.9 and 1.6 per cent per year over the same 1999 to 2004 period. The increasing value of health is related to GDP growth and, while it may have advantages for national accounting purposes, says little about the efficiency with which the NHS uses its resources.
� In January 2008, the ONS published a further estimate of NHS productivity, finding that between 2001 and 2005, NHS productivity fell by 2.5 per cent per annum, or by 2 per cent per annum including quality adjustments. The study also showed that between 1995 and 2000, NHS productivity fell by less than 1 per cent per annum, again implying that the extra spending since 1999 has severely undermined productivity.51
Figure 3.5.1: 2008 Office for National Statistics healthcare productivity estimate, including quality adjustment, 2001=100
80
90
100
110
120
130
140
2001 2002 2003 2004 2005
Year
Productivity index: 2001=100
Output Input Productivity
51 Office for National Statistics (January 2008), ‘Public Service Productivity – Health’

43 Old Queen Street, London SW1H 9JA � www.taxpayersalliance.com
0845 330 9554 (office hours) � 07795 084 113 (media – 24 hours)
35
3.6 Tax credits and the welfare system
“The old welfare state we inherited paid out benefits, too often without regard to individual circumstances or personal responsibility. Today, the Working Families Tax Credit is making work pay for nearly 1.3 million families.” – Gordon Brown, Pre-Budget Report Speech 2001
Changes to the welfare system have increased its complexity and the number of people who keep well under half of any increases in their income: � The increasing use of tax credits also adds massively to the complexity of administering the tax and benefits system. The National Audit Office has refused to sign off the accounts of HM Revenue & Customs for six successive years. In the four years since the tax credit system was introduced, the department has overpaid by £7.3 billion.52
� Since 1997 there has been a 147 per cent increase in the number of people facing a marginal deduction rate (the percentage of their income they lose to increased taxes and the withdrawal of benefits) of more than 60 per cent; from 760,000 before Budget 1998 to 1,875,000 under the 2008-09 system of tax and benefits.
� The number of benefits increased from 45 to 51 between 1998 and 2005.53
� Only 19 per cent of non-pension welfare spending involves any “responsibilities” such as actively looking for work.54
52 Burns, J. ‘Audit spots possible £1.5bn tax credit error’, Financial Times, July 2008 53 Boys Smith, N. ‘Reforming Welfare’, Reform, November 2006 54 Ibid.

43 Old Queen Street, London SW1H 9JA � www.taxpayersalliance.com
0845 330 9554 (office hours) � 07795 084 113 (media – 24 hours)
36
4. The burden on ordinary people Increasing demands for more taxation and regulation have imposed a significant burden on ordinary people. This has sometimes been clearly apparent and sometimes concealed in fiscal drag as thresholds are not increased with inflation. An increasing burden of tax has contributed to slow growth in disposable incomes over the last ten years. 4.1 The increased tax burden
“Save to invest is our approach, not tax and spend.” – Labour Party Manifesto 1997
In the decade from 1997-98 to 2007-08 the total tax burden increased by £223 billion to £517 billion per annum, a 76 per cent rise. Taxes have been rising much faster than the general price level. Over this period, the Government’s preferred measure of inflation, the Consumer Price Index (CPI), has registered a 17 per cent increase, which means that in real terms the tax burden has increased by 51 per cent. Table 4.1.1 sets out the detail: Table 4.1.1: Growth of the tax burden55
Year Tax Burden, £ billion
Tax Burden Index
Consumer Price Index
Real Tax Burden
1997-98 293.8 100 100 100
1998-99 313.3 107 102 105
1999-00 336.7 115 103 111
2000-01 357.4 122 104 117
2001-02 365.3 124 105 118
2002-03 372.1 127 106 119
2003-04 397.7 135 108 126
2004--05 426.5 145 109 133
2005-06 456.5 155 111 139
2006-07 488.8 166 114 146
2007-08 517.1 176 117 151
Apart from a pause around the time of the 2001 election, taxes have grown rapidly throughout the decade, as shown in Figure 4.1.1:
55 Office for National Statistics; HM Treasury, ‘Budget 2008’, March 2008

43 Old Queen Street, London SW1H 9JA � www.taxpayersalliance.com
0845 330 9554 (office hours) � 07795 084 113 (media – 24 hours)
37
Figure 4.1.1: A decade of rapid tax growth
100
110
120
130
140
150
160
170
180
1997-98
1998-99
1999-00
2000-01
2001-02
2002-03
2003-04
2004--05
2005-06
2006-07
2007-08
Tax Burden Index
Real Tax Burden
Taxes per household have also grown sharply: � In 1997-98, there were approximately 24 million households56, so taxes per household were about £12,200 per annum. By 2007-08, the number of households had increased to around 25 million, so taxes per household were £20,700, a rise of 70 per cent, or £8,500 per annum.
� The following table shows those that have gone up most, ranked by their percentage increases. Together, they comprise about three quarters of the total tax burden.
Table 4.1.2: The biggest tax increases57 Tax Cost in 2007-08,
£billion Increase since 1997-98, £billion
Increase since 1997-98, %
Total taxes 517.1 223.3 76
Of which:
Stamp Duty 14.3 10.8 314
Air Passenger Duty 2.0 1.5 306
Capital Gains Tax 4.8 3.3 230
Inheritance Tax 3.9 2.2 132
Insurance Tax 2.4 1.3 120
National Insurance 97.4 49.6 104
Income tax 150.9 74.1 96
Council tax 23.7 10.6 80
VAT 80.5 29.6 60
� The largest increase was in Stamp Duty, with a percentage cost increase of 314 per cent. This was one of the first taxes increased by Gordon
56 Office for National Statistics, ‘Households’, October 2007 57 HM Treasury, ‘Budget 2008’, March 2008; HMRC

43 Old Queen Street, London SW1H 9JA � www.taxpayersalliance.com
0845 330 9554 (office hours) � 07795 084 113 (media – 24 hours)
38
Brown, and it has been further powered by the rise in house prices and the failure to index thresholds.
� Of the largest taxes, by revenue, National Insurance has increased most, more than doubling, and again reflecting a combination of open tax increases and stealth taxation. But note also that income tax is not far behind, despite headline rate cuts.

43 Old Queen Street, London SW1H 9JA � www.taxpayersalliance.com
0845 330 9554 (office hours) � 07795 084 113 (media – 24 hours)
39
4.2 Fiscal drag Cumulatively, we estimate that Gordon Brown boosted the Treasury coffers by about £80 billion through fiscal drag while he was Chancellor. In 2007-08 alone, fiscal drag contributed around £14 billion, or £550 per household:58 � The tax-free income tax personal allowance was £5,225 in 2007-08. But if it had increased in line with average earnings over the previous decade, it would have been £5,712. That would not only have saved a basic or higher rate taxpayer over £100, but would have meant that around half a million more people would not have to pay income tax at all.
� Over 1.5 million more people are now paying income tax at 40 per cent than a decade ago. If the top rate had increased in line with earnings it would now be around £5,000 per annum higher than it actually was in 2007-08 (£44,395 instead of £39,825).
� The threshold for the 1 per cent rate of stamp duty has increased from £60,000 to £125,000 since 1996, but in 2007-08 it would have been £183,000 if it had kept pace with house price growth. The average first-time buyer now has to pay stamp duty, an imposition that few first time buyers would have faced a decade ago.
� Rates of stamp duty increased from 1 per cent to 3 per cent for properties above £250,000 and to 4 per cent for properties above £500,000. Thresholds have not been increased at all. If they had tracked house price growth, only properties worth £717,250 or more would face the 3 per cent rate, while the 4 per cent rate would only affect houses worth at least £1,434,500. The average first-time buyer in London faces a stamp duty bill of at least £7,500.
� The Inheritance Tax threshold increased from £200,000 to £300,000. If it had increased in line with house prices, by 2007-08 it would have been at least £610,000.
� The threshold for the small companies’ rate of corporation tax stayed at £300,000. If it had increased in line with average earnings over the past decade it would have risen to over £450,000. Similarly if the individual threshold for capital gains tax had increased in line with earnings growth it would have increased to £9,557 instead of the actual level of £9,200.
58 Denham, M., ‘The Great British Taxpayer Rip Off’, The TaxPayers’ Alliance, May 2008

43 Old Queen Street, London SW1H 9JA � www.taxpayersalliance.com
0845 330 9554 (office hours) � 07795 084 113 (media – 24 hours)
40
4.3 Real disposable income
“This is a Budget to expand prosperity and fairness for Britain's families” – Gordon Brown, Budget Speech 2007
The end result of the tax squeeze on ordinary families, relatively high inflation compared to the US and the Eurozone and a growth record that does not match the performance of other English speaking nations is slowing growth in real disposable incomes. � Between 1986 and 1996 real disposable incomes grew by an average of 3.2 per cent each year. By contrast, between 1997 and 2007 real disposable incomes grew by an average of 2.6 per cent each year.
Figure 4.3.1: Real household disposable income growth, 1986-200759
0%
1%
2%
3%
4%
5%
6%
198619871988
1989199019911992199319941995199619971998199920002001200220032004200520062007
Year
Growth in real household
disposable income
59 Office for National Statistics, ‘Real Household Disposable Income’, NRJR, 2008

43 Old Queen Street, London SW1H 9JA � www.taxpayersalliance.com
0845 330 9554 (office hours) � 07795 084 113 (media – 24 hours)
41
5. Conclusions
“There can be no more doubt. Northern Rock is Gordon Brown's Black Wednesday. The Prime Minister, like John Major before him, remains in office, but he is no longer in power. The mini-Budget in October, with its misconceived plagiarism of Tory tax policies, marked the beginning of the end, when Mr Brown handed over his hard-won economic credibility to David Cameron and George Osborne.” – Anatole Kaletsky, Times, January 2008
“With the exception of granting the Bank of England independence on interest-rate setting, he chose not to build on the improvements of his predecessors. On the contrary, he has undermined the economy's ability to withstand the economic squalls it will inevitably face.” – Ruth Lea, Telegraph, September 2007
“The foreword was by Gordon Brown, who was inspired by his own achievement. The reforms of 1997 ranked alongside those of the 1940s, he suggested, as he traced the “intellectual journey” to “an institutional framework that commanded market credibility and public trust.” “The three pillars of this new framework were an independent Bank of England to deliver low inflation, “a fiscal policy framework which is delivering sound public finances” and a Financial Services Authority to ensure financial stability. The book was sold as suitable for students. Maybe it is now only appropriate for historians, particularly those interested in crumbling pillars.” – David Smith, Times, July 2008
After long years of good fortune the effects of the steady weakening of Britain’s economy by Gordon Brown’s combination of high, wasteful government spending and an ever more complex system of rules and regulations is becoming apparent. The public finances are in a mess, there are alarming weaknesses in Britain’s energy and transport infrastructure and ordinary people are hard-pressed by a massive rise in the burden of tax. After his time as Chancellor of the Exchequer Gordon Brown left a poisonous legacy for his own Government, future governments and, more importantly, British businesses and families.

43 Old Queen Street, London SW1H 9JA � www.taxpayersalliance.com
0845 330 9554 (office hours) � 07795 084 113 (media – 24 hours)
42
Appendix: Effects of the size of government on economic growth
The European Central Bank (2008) – Based in Frankfurt and responsible for monetary policy covering the 15 member countries of the Eurozone, the European Central Bank also maintains a research programme which releases regular working papers. Their estimate60 that each 1 per cent growth in government consumption as
a share of GDP leads to a 0.13 per cent fall in GDP growth was produced by António Afonso, from the ECB’s UECE – Research Unit on Complexity and Economics, and Davide Furceri, from the University of Palermo and the University of Illinois at Chicago. If the result obtained by the researchers at the European Central bank has held for Britain since the start of the major growth in government consumption as a percentage of GDP since 2000, then it will already be costing us £13.7 billion in lost GDP each year.
Robert J. Barro (1997) – Rated by IDEAS/RePEc as the most influential economist in the world.61 Robert Barro is currently Paul M. Warburg Professor of Economics at Harvard University and has produced numerous widely cited studies on a diverse range of subjects and has a particular reputation for his work on economic growth. His estimate62 that each 1 per cent growth in government consumption as a proportion of GDP leads to a 0.136 fall in economic growth is contained in a 1997 book The Determinants of Economic Growth: A Cross-Country Empirical Study.
If the result obtained by Barro has held for Britain since the start of the major growth in government consumption as a percentage of GDP since 2000, then it will already be costing us £14.4 billion in lost GDP each year.
60 Afonso, A. & Furceri, D. ‘Government size, composition, volatility and economic growth’, European Central Bank: Working Paper no. 849, January 2008 61 IDEAS/RePEc, ‘Economist Rankings at IDEAS’, January 2008, http://ideas.repec.org/top/top.person.all.html 62 Barro, R. J. ‘Determinants of Economic Growth: A Cross-Country Empirical Study’, MIT Press, 1997

43 Old Queen Street, London SW1H 9JA � www.taxpayersalliance.com
0845 330 9554 (office hours) � 07795 084 113 (media – 24 hours)
43
Folster & Henrekson (2001) – Researchers at the Swedish Research Institute of Trade and the Stockholm School of Economics estimated63 the effect of the size of government on economic growth using an econometric panel study on a sample of rich countries over the period 1970-95. They found
that as econometric problems were addressed the relationship between small government and high economic growth became more robust and found that each 1 per cent growth in government consumption as a proportion of GDP leads to a 0.07-0.08 per cent fall in economic growth. If the result obtained by the researchers at the Stockholm School of Economics has held for Britain since the start of the major growth in government consumption as a percentage of GDP since 2000, then it will already be costing us £7.9 billion in lost GDP each year.
63 Fölster, S. & Henrekson, M. ‘Growth effects of Government Expenditure and Taxation in Rich Countries’, Stockholm School of Economics: Working Paper no. 503, Research Institute of Industrial Economics, June 2000

43 Old Queen Street, London SW1H 9JA � www.taxpayersalliance.com
0845 330 9554 (office hours) � 07795 084 113 (media – 24 hours)
44
Table A.1: European Central Bank estimate of loss of annual GDP due to dynamic costs from post-1999 spending growth 2000 2001 2002 2003 2004 2005 2006 2007 2008
Government expenditure % of GDP 37.5 40.9 42.0 43.4 43.7 44.7 45.1 44.9 45.1
Percentage point increase 3.4 1.1 1.5 0.3 1.0 0.4 -0.2 0.1
Effect on growth 0.44% 0.14% 0.19% 0.03% 0.14% 0.05% -0.02% 0.02%
Cumulative effect on growth 0.44% 0.58% 0.77% 0.80% 0.93% 0.98% 0.96% 0.98% Money GDP, 07-08, £bn
GDP per annum cost, £ billion 6.1 8.1 10.7 11.2 13.1 13.8 13.5 13.7 1,404
Table A.2: Barro estimate of loss of annual GDP due to dynamic costs from post-1999 spending growth 2000 2001 2002 2003 2004 2005 2006 2007 2008
Government expenditure % of GDP 37.5 40.9 42.0 43.4 43.7 44.7 45.1 44.9 45.1
Percentage point increase 3.4 1.1 1.5 0.3 1.0 0.4 -0.2 0.1
Effect on growth 0.46% 0.15% 0.20% 0.03% 0.14% 0.05% -0.02% 0.02%
Cumulative effect on growth 0.46% 0.60% 0.80% 0.84% 0.98% 1.03% 1.01% 1.02% Money GDP, 07-08, £bn
GDP per annum cost, £ billion 6.4 8.5 11.2 11.7 13.7 14.4 14.1 14.4 1,404
Table A.3: Stockholm School of Economics estimate of loss of annual GDP due to dynamic costs from post-1999 spending growth 2000 2001 2002 2003 2004 2005 2006 2007 2008
Government expenditure % of GDP 37.5 40.9 42.0 43.4 43.7 44.7 45.1 44.9 45.1
Percentage point increase 3.4 1.1 1.5 0.3 1.0 0.4 -0.2 0.1
Effect on growth 0.25% 0.08% 0.11% 0.02% 0.08% 0.03% -0.01% 0.01%
Cumulative effect on growth 0.25% 0.33% 0.44% 0.46% 0.54% 0.57% 0.55% 0.56% Money GDP, 07-08, £bn
GDP per annum cost, £ billion 3.5 4.7 6.2 6.5 7.6 8.0 7.8 7.9 1,404
The TaxPayers’ Alliance is Britain’s independent, grassroots campaign for lower taxes and better government. The TPA has 15,000 supporters across the country, is backed by some of the UK’s best-known business people and
opinion formers and generates more media coverage than any other independent political organisation in the UK.
The TaxPayers’ Alliance 43 Old Queen Street London SW1H 9JA
0845 330 9554
www.taxpayersalliance.com