Embed Size (px)
Citation preview

Creating your own Google Earth to Insight At5 Charts by John Easton
1. Download Google Earth Pro 2. Follow instructions and install to computer 3. If it asks you to login the first time use your email address as username and GEPFREE as the password 4. Getting the settings right – these are found under Tools - Options

a. 3D View – Terrain: This is a CRITICAL step – reduce exaggeration to 0.01
b. Units of measure – Select Meters

c. Navigation – Do NOT tilt while zooming MUST be selected
5. Prepare the display – a. Orientation: It is CRITICAL that the earth is perfectly positioned to North up. This is done by clicking on the little N top of the compass.
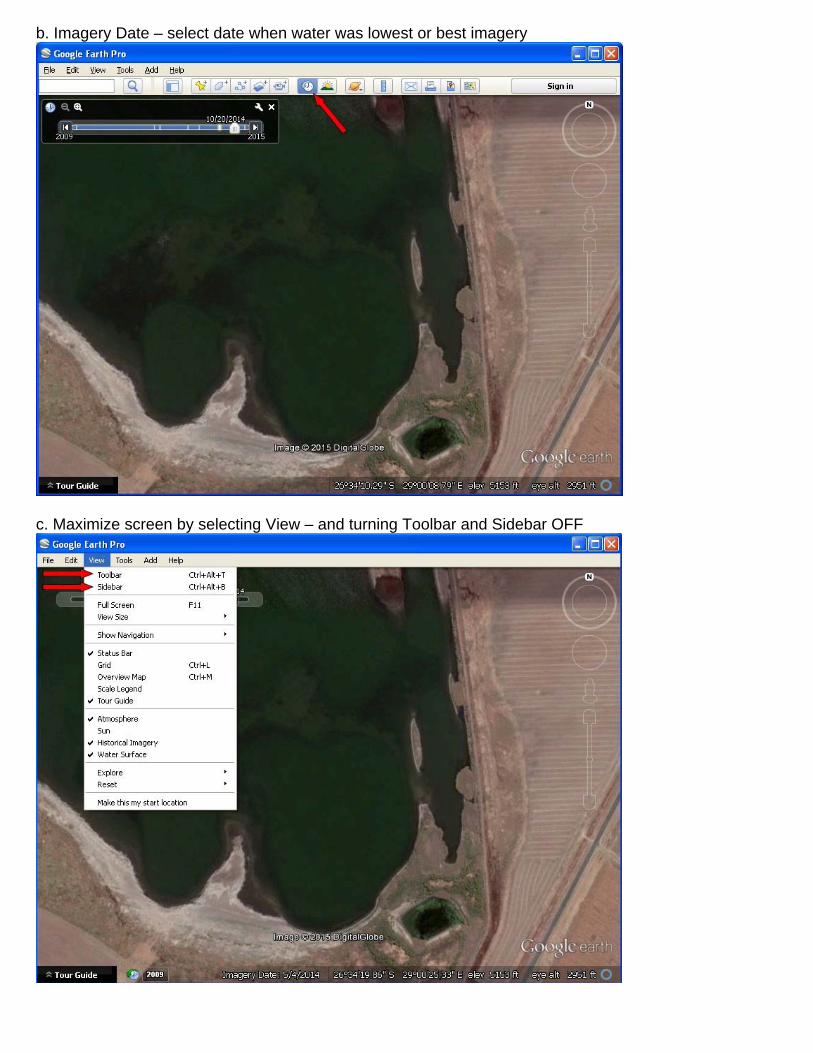
b. Imagery Date – select date when water was lowest or best imagery
c. Maximize screen by selecting View – and turning Toolbar and Sidebar OFF

d. Eye Elevation – There are two elevations, we are only interested in Eye Elevation. Using the mouse as shown click and drag until the desired eye elevation is obtained.
For maximum resolution use 634m

6. Saving the screen display: a. Press F11 for full screen and decide where you want to start
b. Last Minute Check – CHECK ELEVATION AND WRITE IT DOWN SOMEWHERE CLICK ON ‘N’ TOP OF COMPASS TO ENSURE ORIENTATION (this can change when zooming so BEWARE) c. Save Image Options: Turn off all viewable options and select 1080HD for resolution or closest full screen resolution depending on your PC monitor. DO NOT GO BIGGER!

d. Select Save Image and name short ending with 001 – such as dwd001 and place in a folder on your desktop with the dam’s name. Repeat this step while moving the image remembering where the end of the previous screenshot was allowing for a small overlap and keep repeating until you have the shoreline covered.
7. Stitching Images together – in order to save time you can stitch a few images together using Microsoft Digital Image. There are auto stitch programs out there, but they have resolution issues and very often get it wrong a. Open 5 images at a time and place them on a new page of a size say 6000 x 6000 pixels max.

b. Once placed in the correct position to the image on either side, use the Edite – Select All function and click on the join icon seen at the bottom of the page here.
c. Copy the image and then select new page and the size of the page will automatically be exactly right for you to paste what you have just copied.

d. If you want to remove the water you can use the magic wand tool to select, then delete. If you do want to use this option, remember to save the image as a .PNG and not a .JPG
8. Calibrating the image – a. Go back into Google Earth and use the History button to go back to the same time that the imagery was copied. b. Create a new folder under My Places with the name of the dam

c. With the new folder highlighted, select Add Image from the Toolbar and name it dwd001 and select the png file from the folder on the desktop containing all the images
d. Leaving this dialogue box open you will see the green border frame around your image. Slide the Opaque ruler to about the middle so you can see the original imagery behind it. Massage this frame into place until it matches perfectly with the original image in the background

e. Save the place as a .KML file in the same folder you created on the desktop with the same name as the first image – dwd001.kml
Continue repeating these steps until the entire dam is complete leaving you with a full set of kml and png files.
Creating an At5 file using Insight Map Creator: Setting up IMC a. Open IMC

b. Change Processing Mode to Raster – note why orientating your chart to North up is so important (no rotation)
c. First you need to create the folders in the C:\ drive on your PC – one for source and the other for output

d. The output folder IMC Output must have another sub folder named Raster. This is where IMC will send the processed data folder (BoundAt5) to.
e. Add source folder – C:\Raster

f. The source folder should look exactly like this. While you are here change the output resolution to 1 min and 1024 max. Note, the lower the min er the higher the resolution and the higher the max, the higher the altitude (zoom level on your HDS) the map will be visible.
g. Add the out folder – C:\IMC Output\Raster
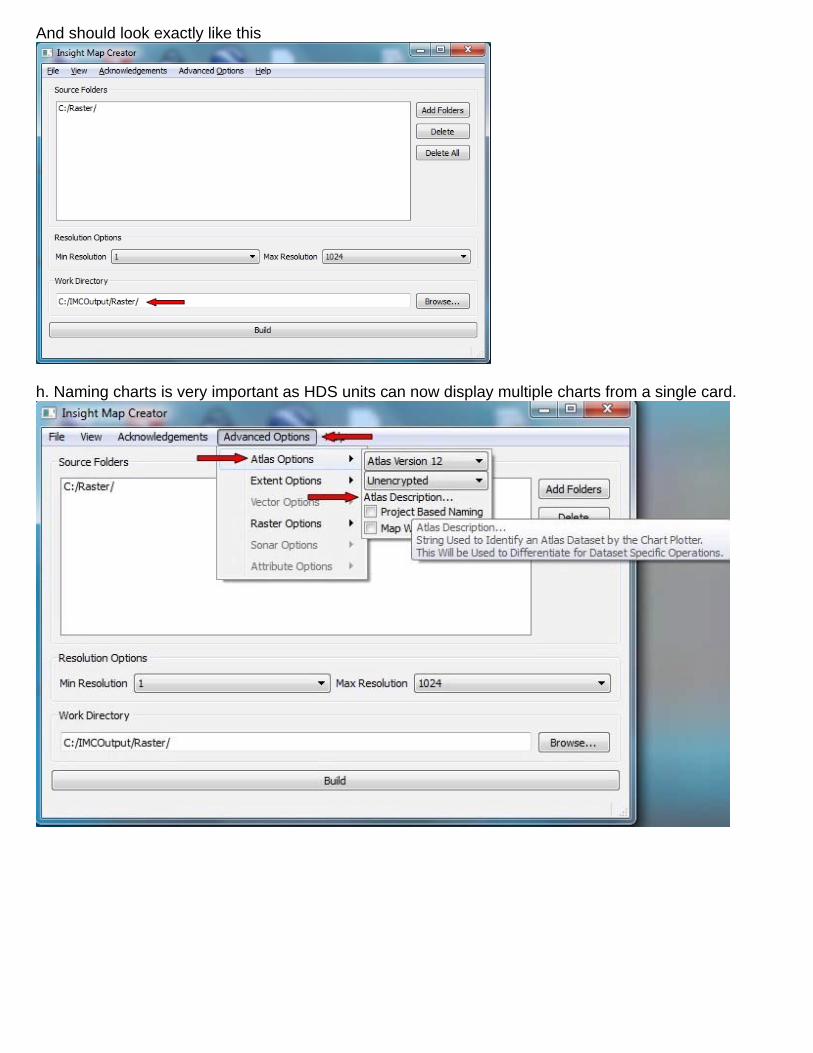
And should look exactly like this
h. Naming charts is very important as HDS units can now display multiple charts from a single card.
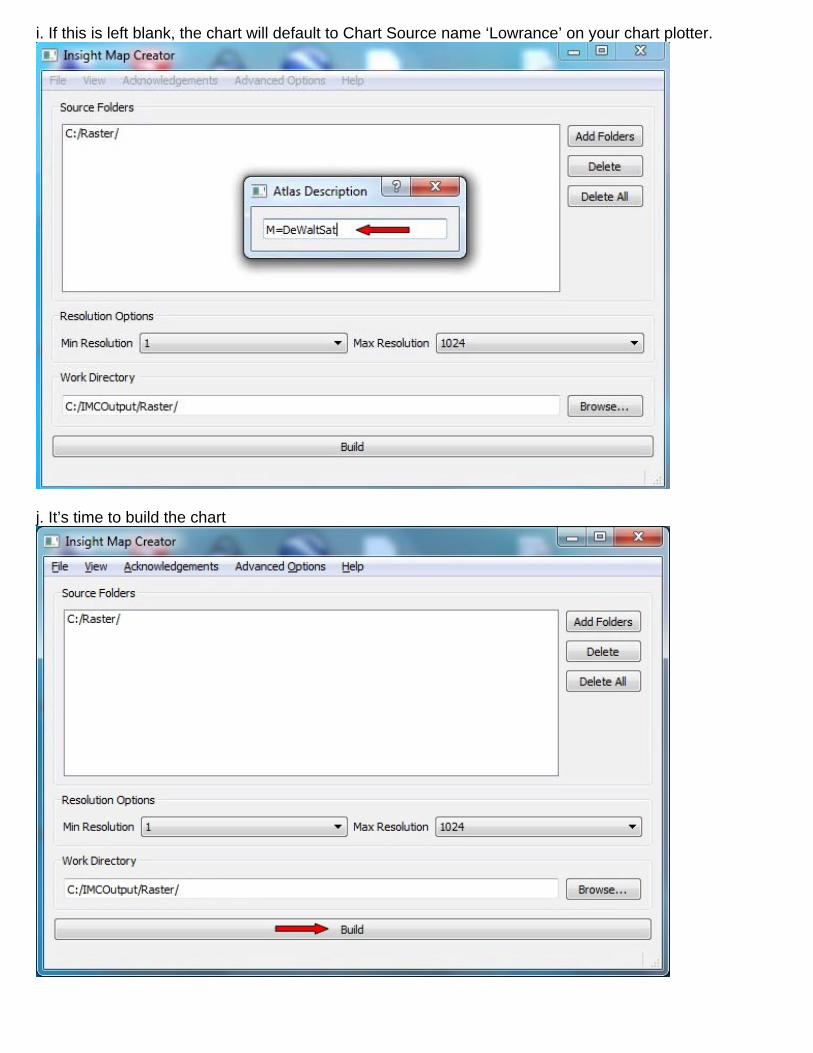
i. If this is left blank, the chart will default to Chart Source name ‘Lowrance’ on your chart plotter.
j. It’s time to build the chart

k. This processing can take anything from a few minutes to many hours depending on how many and how big the files are in the C:\:\Raster folder and the Min Resolution value.
l. When it is done it will say Process Complete!

m. Go to the C:\IMC Output/Raster folder and under the BoundAT5s folder you will find the .at5 files that you need to copy to your SD card with a folder containing the name of the dam you are working on.
CONGRATULATIONS YOU HAVE CREATED YOUR OWN AT5 CHART