Embed Size (px)
Citation preview
The registered office of Goodman Fielder Limited and its Australian subsidiaries is T2, 39 Delhi Road North Ryde NSW 2113
Goodman Fielder LimitedABN 51 116 399 430
T2, 39 Delhi Road North Ryde NSW 2113 AustraliaLocked Bag 2222 North Ryde NSW 2113 Australia
Tel: 61 2 8899 7000 Fax: 61 2 8026 4200www.goodmanfielder.com.au
16 February 2012 Announcements Officer Listed Company Relations ASX Market Announcements New Zealand Exchange Limited ASX Limited Level 2, NZX Centre Exchange Centre 11 Cable Street 20 Bridge Street WELLINGTON SYDNEY NSW 2000 NEW ZEALAND
Goodman Fielder Limited Analyst Briefing – Results for the period ended 31 December 2011
I attach a copy of the Analyst Briefing to be presented today in connection with the financial results of Goodman Fielder Limited for the half year ended 31 December 2011. The Analyst Briefing will be posted to Goodman Fielder’s website once released to the market. Yours sincerely,
JONATHON WEST Company Secretary
For
per
sona
l use
onl
y

Investor PresentationInvestor PresentationInvestor PresentationInvestor PresentationHalf Year, FY12Half Year, FY12
For
per
sona
l use
onl
y
Disclaimer and Basis of PreparationDisclaimer and Basis of PreparationDISCLAIMER
This presentation is provided for information purposes only. The information contained in this presentation is not intended to be relied upon as advice to investors and does not take into account the investment objectives, financial situation or needs of any particular investor. Investors should consider their own individual investment and financial circumstance in relation to any investment decisionInvestors should consider their own individual investment and financial circumstance in relation to any investment decision.
Certain statements contained in this presentation may constitute forward-looking statements or statements about future matters that are based upon information known and assumptions made as of the date of this presentation. These statements are subject to risks and uncertainties. Actual results may differ materially from any future results or performance expressed, predicted or implied by the statements contained in this presentation.
Unless otherwise indicated, any market share information contained in this presentation is sourced from Aztec.
BASIS OF PREPARATION
Normalised EBIT, EBITDA and NPAT are non-IFRS measures that reflect, in the opinion of the Directors, the ongoing operating activities ofNormalised EBIT, EBITDA and NPAT are non IFRS measures that reflect, in the opinion of the Directors, the ongoing operating activities of Goodman Fielder in a way that appropriately presents its underlying performance. The non-IFRS underlying profit measures exclude restructuring expenses and unrealised foreign exchange losses.
KPMG has undertaken a set of agreed procedures to agree the financial information contained in this presentation corresponds to the underlying Goodman Fielder financial information. These procedures do not constitute a review or an audit.
2For
per
sona
l use
onl
y
AgendaAgenda
• Context Setting - Chris Delaney (Chief Executive Officer)
• Key Themes – Chris Delaney
• Group Financial Results – Shane GannonGroup Financial Results Shane Gannon(Chief Financial Officer)
• Segment Results – Shane GannonSegment Results Shane Gannon
• Strategic Review Update – Chris Delaney
3For
per
sona
l use
onl
y
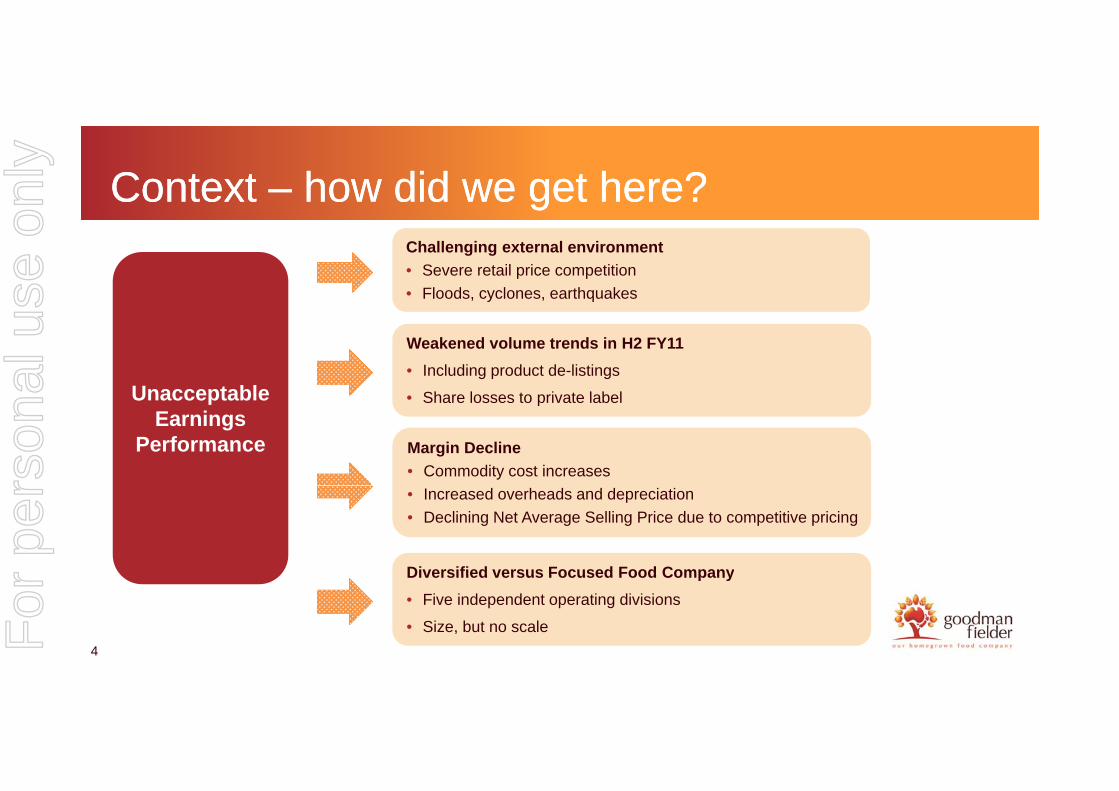
Context Context –– how did we get here?how did we get here?Challenging external environment
• Severe retail price competition
• Floods, cyclones, earthquakes
Unacceptable
Weakened volume trends in H2 FY11
• Including product de-listings
• Share losses to private labelUnacceptable Earnings
Performance
• Share losses to private label
Margin Decline
• Commodity cost increases
• Increased overheads and depreciation
• Declining Net Average Selling Price due to competitive pricing
Diversified versus Focused Food Company
4
Diversified versus Focused Food Company
• Five independent operating divisions
• Size, but no scaleFor
per
sona
l use
onl
y

Context: Strategic Plan Context: Strategic Plan ––Restoring Shareholder ReturnRestoring Shareholder Return
Portfolio
gg
• A focused food company with best in class innovation and category leading brands
Acategory leading brands
Group Structure• Re-organise to provide one face to the customer and bring the
full weight of Goodman Fielder innovation to the marketplaceB
Optimising
Manufacturing &Supply Chain
• Deliver the highest quality brands with best in class safety and cost structures
C
Optimising shareholder
value remains number one
priority
• Create a culture that attracts and retains the brightest and best, by making Goodman Fielder a “Great Place to Work”People
E l t ffi i t d ff ti ti d lC t B
D
E
5
• Ensure a low cost, efficient and effective operating modelCost BaseE
For
per
sona
l use
onl
y
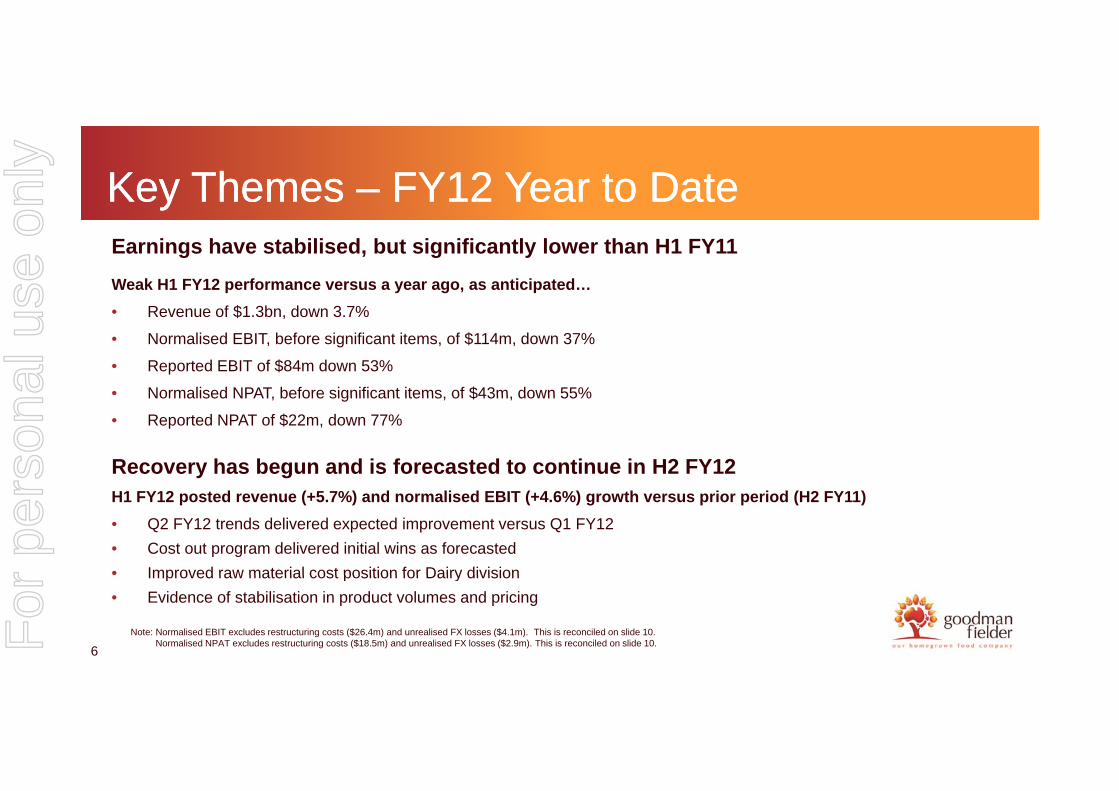
Key Themes Key Themes –– FY12 Year to DateFY12 Year to DateEarnings have stabilised, but significantly lower than H1 FY11
Weak H1 FY12 performance versus a year ago, as anticipated…
R f $1 3b d 3 7%• Revenue of $1.3bn, down 3.7%
• Normalised EBIT, before significant items, of $114m, down 37%
• Reported EBIT of $84m down 53%
• Normalised NPAT before significant items of $43m down 55%Normalised NPAT, before significant items, of $43m, down 55%
• Reported NPAT of $22m, down 77%
Recovery has begun and is forecasted to continue in H2 FY12H1 FY12 posted revenue (+5.7%) and normalised EBIT (+4.6%) growth versus prior period (H2 FY11)
• Q2 FY12 trends delivered expected improvement versus Q1 FY12
• Cost out program delivered initial wins as forecasted
• Improved raw material cost position for Dairy division
6
Improved raw material cost position for Dairy division
• Evidence of stabilisation in product volumes and pricing
Note: Normalised EBIT excludes restructuring costs ($26.4m) and unrealised FX losses ($4.1m). This is reconciled on slide 10.Normalised NPAT excludes restructuring costs ($18.5m) and unrealised FX losses ($2.9m). This is reconciled on slide 10.For
per
sona
l use
onl
y
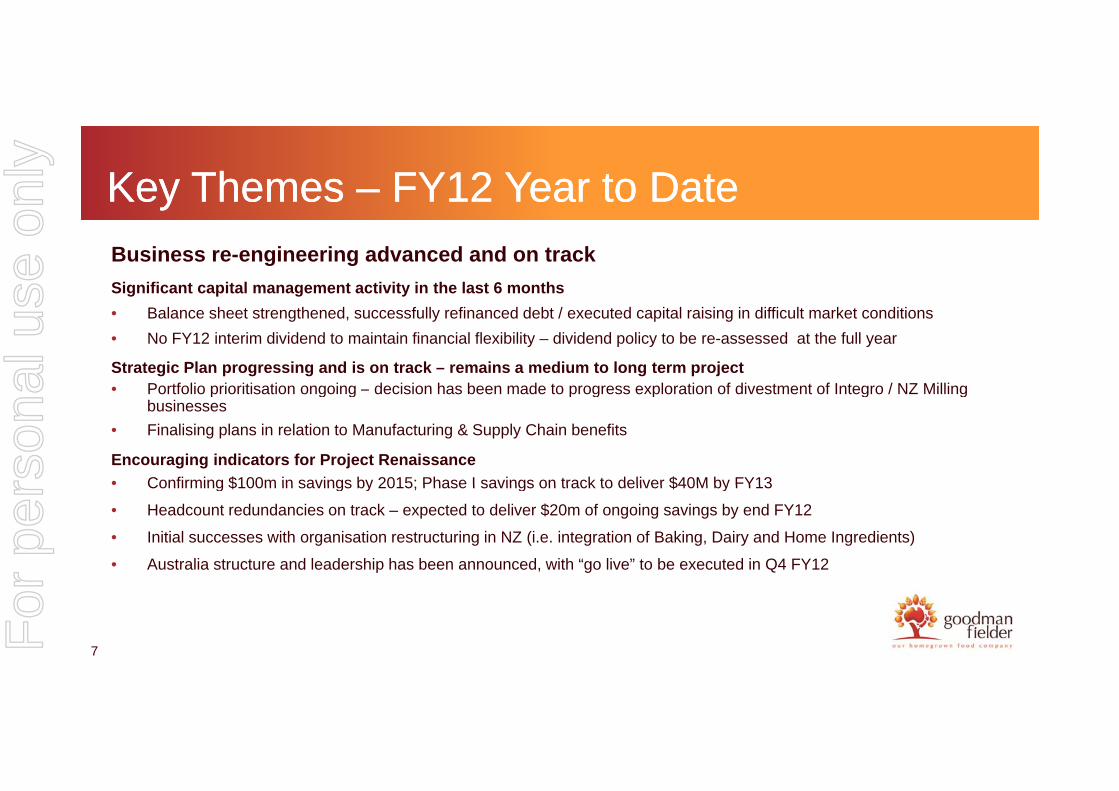
Key Themes Key Themes –– FY12 Year to DateFY12 Year to Date
Business re-engineering advanced and on track
Significant capital management activity in the last 6 months
• Balance sheet strengthened, successfully refinanced debt / executed capital raising in difficult market conditions
• No FY12 interim dividend to maintain financial flexibility – dividend policy to be re-assessed at the full year
Strategic Plan progressing and is on track – remains a medium to long term project• Portfolio prioritisation ongoing – decision has been made to progress exploration of divestment of Integro / NZ Milling p g g p g p g g
businesses
• Finalising plans in relation to Manufacturing & Supply Chain benefits
Encouraging indicators for Project Renaissance
• Confirming $100m in savings by 2015; Phase I savings on track to deliver $40M by FY13Confirming $100m in savings by 2015; Phase I savings on track to deliver $40M by FY13
• Headcount redundancies on track – expected to deliver $20m of ongoing savings by end FY12
• Initial successes with organisation restructuring in NZ (i.e. integration of Baking, Dairy and Home Ingredients)
• Australia structure and leadership has been announced, with “go live” to be executed in Q4 FY12
7For
per
sona
l use
onl
y

Key Themes Key Themes –– FY12 Year to DateFY12 Year to Date
• Trading conditions and external environment remain challenging, however offsetting this is the recent stabilisation of the business andhowever, offsetting this is the recent stabilisation of the business and the progress of the Strategic Plan, which allows management to resume guidance for FY12
EBIT range, before significant items, for FY12 expected to be $230m to $245m
• Run rates established in Q2Run rates established in Q2
• Major projects on track, initiatives are scoped and paced
• Assumes no further deterioration to trading conditions
8
• Further background and assumptions outlined on slide 31
For
per
sona
l use
onl
y

Group Financial ResultsGroup Financial ResultsShSh GGShane Shane GannonGannon
Chief Financial OfficerChief Financial Officer
9For
per
sona
l use
onl
y
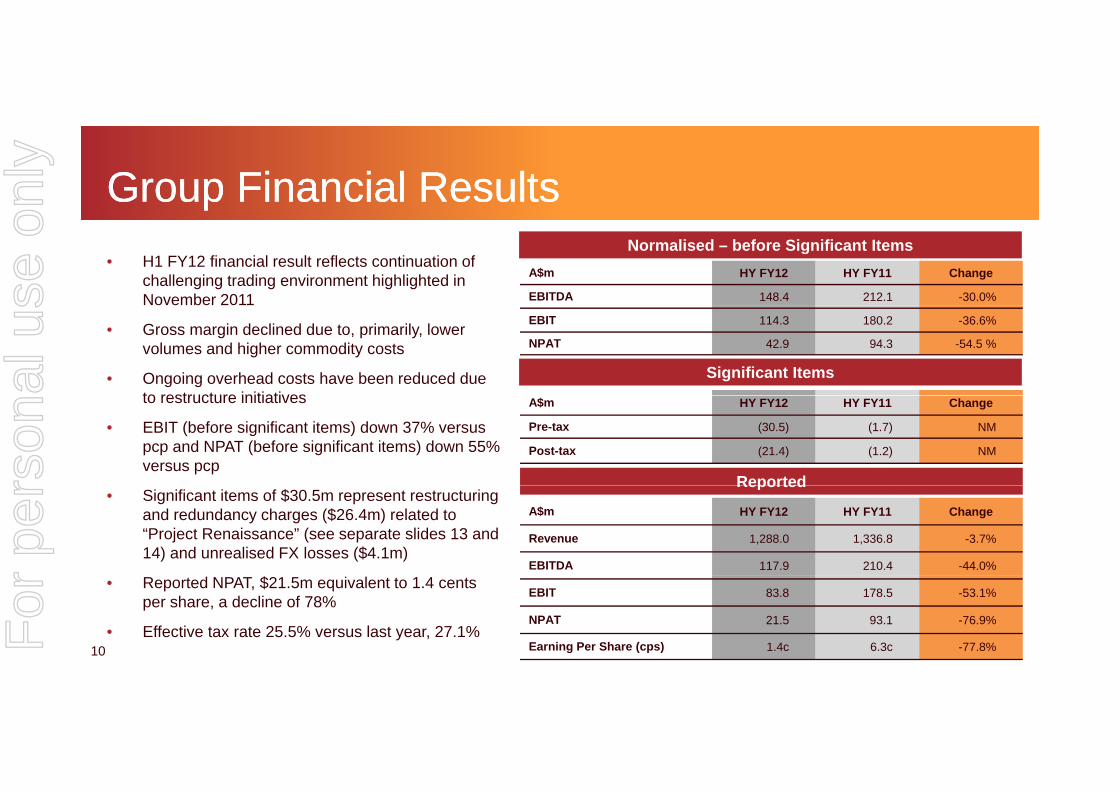
Group Financial ResultsGroup Financial Results
A$m HY FY12 HY FY11 Change
EBITDA 148.4 212.1 -30.0%
• H1 FY12 financial result reflects continuation of challenging trading environment highlighted in November 2011
Normalised – before Significant Items
EBIT 114.3 180.2 -36.6%
NPAT 42.9 94.3 -54.5 %• Gross margin declined due to, primarily, lower
volumes and higher commodity costs
• Ongoing overhead costs have been reduced due to restructure initiatives
Significant Items
A$m HY FY12 HY FY11 Change
Pre-tax (30.5) (1.7) NM
Post-tax (21.4) (1.2) NM
to restructure initiatives
• EBIT (before significant items) down 37% versus pcp and NPAT (before significant items) down 55% versus pcp
Reported
A$m HY FY12 HY FY11 Change
Revenue 1,288.0 1,336.8 -3.7%
EBITDA 117.9 210.4 -44.0%
• Significant items of $30.5m represent restructuring and redundancy charges ($26.4m) related to “Project Renaissance” (see separate slides 13 and 14) and unrealised FX losses ($4.1m)
Reported
10
EBIT 83.8 178.5 -53.1%
NPAT 21.5 93.1 -76.9%
Earning Per Share (cps) 1.4c 6.3c -77.8%
• Reported NPAT, $21.5m equivalent to 1.4 cents per share, a decline of 78%
• Effective tax rate 25.5% versus last year, 27.1%For
per
sona
l use
onl
y
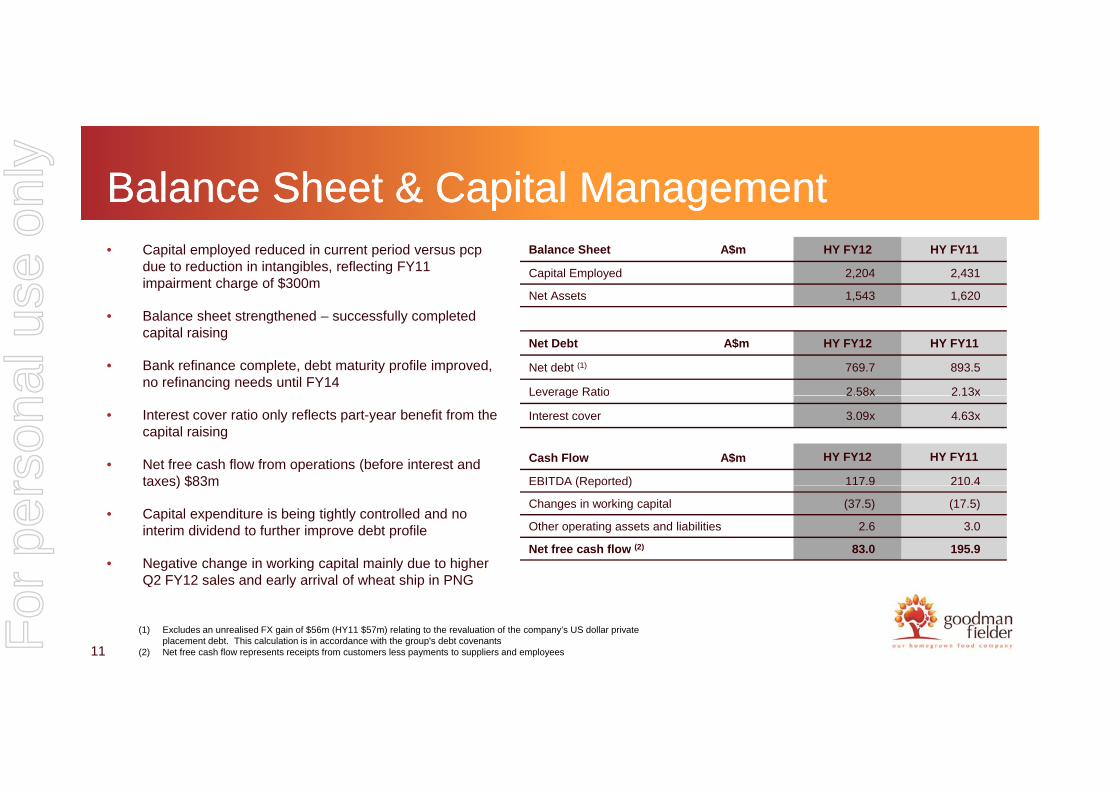
Balance Sheet & Capital ManagementBalance Sheet & Capital ManagementBalance Sheet A$m HY FY12 HY FY11
Capital Employed 2,204 2,431
Net Assets 1,543 1,620
• Capital employed reduced in current period versus pcp due to reduction in intangibles, reflecting FY11 impairment charge of $300m
Net Debt A$m HY FY12 HY FY11
Net debt (1) 769.7 893.5
Leverage Ratio 2.58x 2.13x
• Balance sheet strengthened – successfully completed capital raising
• Bank refinance complete, debt maturity profile improved, no refinancing needs until FY14
Leverage Ratio 2.58x 2.13x
Interest cover 3.09x 4.63x• Interest cover ratio only reflects part-year benefit from the capital raising
• Net free cash flow from operations (before interest and taxes) $83m
Cash Flow A$m HY FY12 HY FY11
EBITDA (Reported) 117.9 210.4taxes) $83m
• Capital expenditure is being tightly controlled and no interim dividend to further improve debt profile
• Negative change in working capital mainly due to higher Q2 FY12 l d l i l f h t hi i PNG
( p )
Changes in working capital (37.5) (17.5)
Other operating assets and liabilities 2.6 3.0
Net free cash flow (2) 83.0 195.9
11
Q2 FY12 sales and early arrival of wheat ship in PNG
(1) Excludes an unrealised FX gain of $56m (HY11 $57m) relating to the revaluation of the company’s US dollar private placement debt. This calculation is in accordance with the group's debt covenants
(2) Net free cash flow represents receipts from customers less payments to suppliers and employeesFor
per
sona
l use
onl
y

Project Renaissance UpdateProject Renaissance Update
Identified & Plans in Place
Work Plans in Progress
Savings Targeted(FY14 / FY15)
Place(FY12 / FY13)
Progress(FY13 / FY14)
(FY14 / FY15)
Ongoing Savings $40m $25m $35mOngoing Savings $40m $25m $35m
Restructuring Costs $33m $20m - $25m TBD
Baking Australia Manufacturing & Supply Manufacturing & SupplyKey Projects
Baking Australia Overheads
Project Tower
Manufacturing & SupplyChain Optimisation
(Phase I)
Manufacturing & Supply Chain Optimisation
(Phase II)
On target - See next slide
12For
per
sona
l use
onl
y
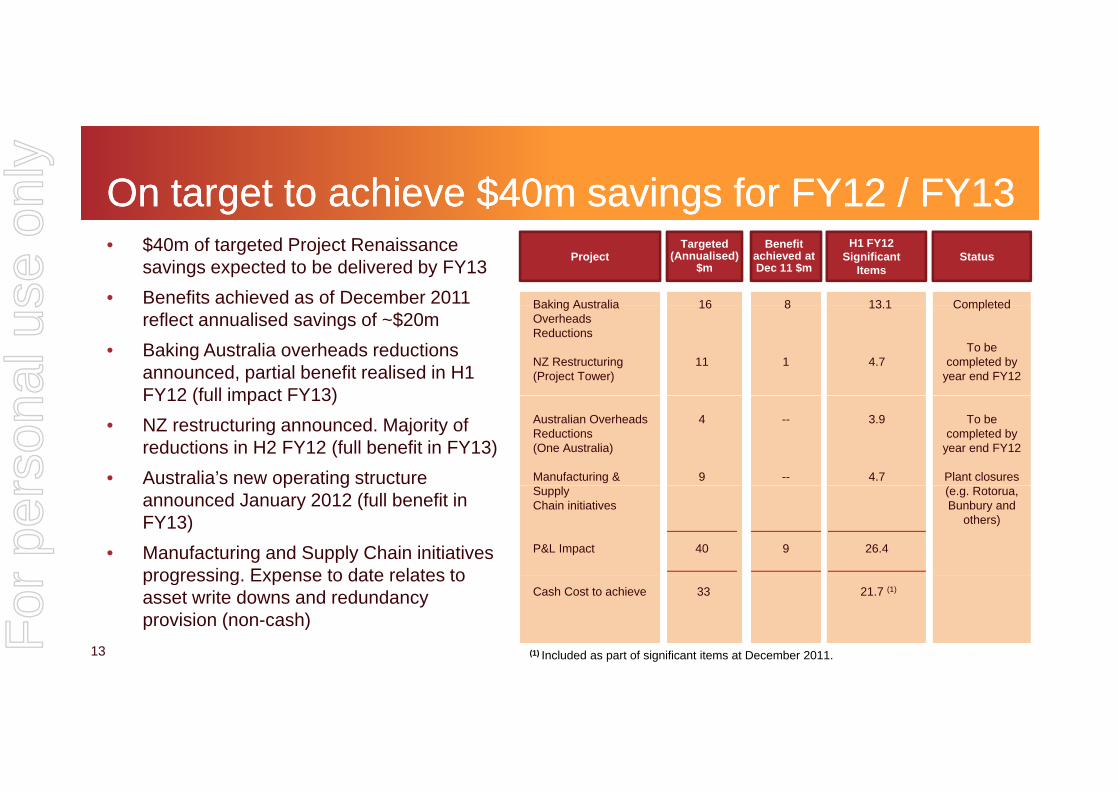
On target to achieve $40m savings for FY12 / FY13On target to achieve $40m savings for FY12 / FY13• $40m of targeted Project Renaissance
savings expected to be delivered by FY13
• Benefits achieved as of December 2011
ProjectTargeted
(Annualised) $m
Status
Baking Australia 16 Completed
H1 FY12 Significant
Items
Benefit achieved at Dec 11 $m
8 13 1
reflect annualised savings of ~$20m
• Baking Australia overheads reductions announced, partial benefit realised in H1 FY12 (full impact FY13)
Baking Australia OverheadsReductions
NZ Restructuring(Project Tower)
16
11
Completed
To be completed by
year end FY12
8
1
13.1
4.7
FY12 (full impact FY13)
• NZ restructuring announced. Majority of reductions in H2 FY12 (full benefit in FY13)
• Australia’s new operating structure
Australian Overheads Reductions(One Australia)
Manufacturing &
4
9
To be completed by
year end FY12
Plant closures
--
--
3.9
4.7p gannounced January 2012 (full benefit in FY13)
• Manufacturing and Supply Chain initiatives progressing Expense to date relates to
Supply Chain initiatives
P&L Impact 40
(e.g. Rotorua, Bunbury and
others)
9 26.4
13
progressing. Expense to date relates to asset write downs and redundancy provision (non-cash)
(1) Included as part of significant items at December 2011.
Cash Cost to achieve 33 21.7 (1)
For
per
sona
l use
onl
y

S t R ltS t R ltSegment ResultsSegment ResultsShane GannonShane GannonShane GannonShane Gannon
Chief Financial OfficerChief Financial Officer
14For
per
sona
l use
onl
y

BakingBaking• Revenue $490.1m, down 8.2%
– Loss of Private Label volume
– Volume mix shift from Proprietary to Private LabelA$m, unless otherwise stated HY FY12 HY FY11 Change
• Gross Margins were under pressure with increased commodity costs and further promotional activity to support proprietary market shares
• EBITDA (before significant items) decline versus pcp,
Volumes (m units) 296.2 324.9 -8.8%
NASP (A$) 1.65 1.64 +0.6%
R 490 1 534 0 8 2%47%. Main drivers were:
– Reduced volumes and mix shift away from Proprietary business
– Inability to recover commodity cost increase versus last year
Inability to recover fixed costs associated with reduced
Revenue 490.1 534.0 -8.2%
EBITDA Normalised (*) 43.1 81.6 -47.2%
EBITDA Margin (*) (%) 8.8% 15.3% -6.5 pts– Inability to recover fixed costs associated with reduced volumes
• Higher capital spend in HY12; Erskine Park artisan bread line, Moorebank automation and ongoing compliance upgrades
EBITDA Margin (%) 8.8% 15.3% 6.5 pts
Free Cash Flow 16.1 81.6 -80.3%
Capital Expenditure 22.1 11.4 +93.9%
• Free cash flow reduction due to reduced earnings, and significant restructure costs in HY12
15Note: (*) Represents EBITDA before restructuring costs as per note 2 ‘segment information’ in the 31 December 2011 half year financial report
NASP = Net Average Selling PriceFor
per
sona
l use
onl
y
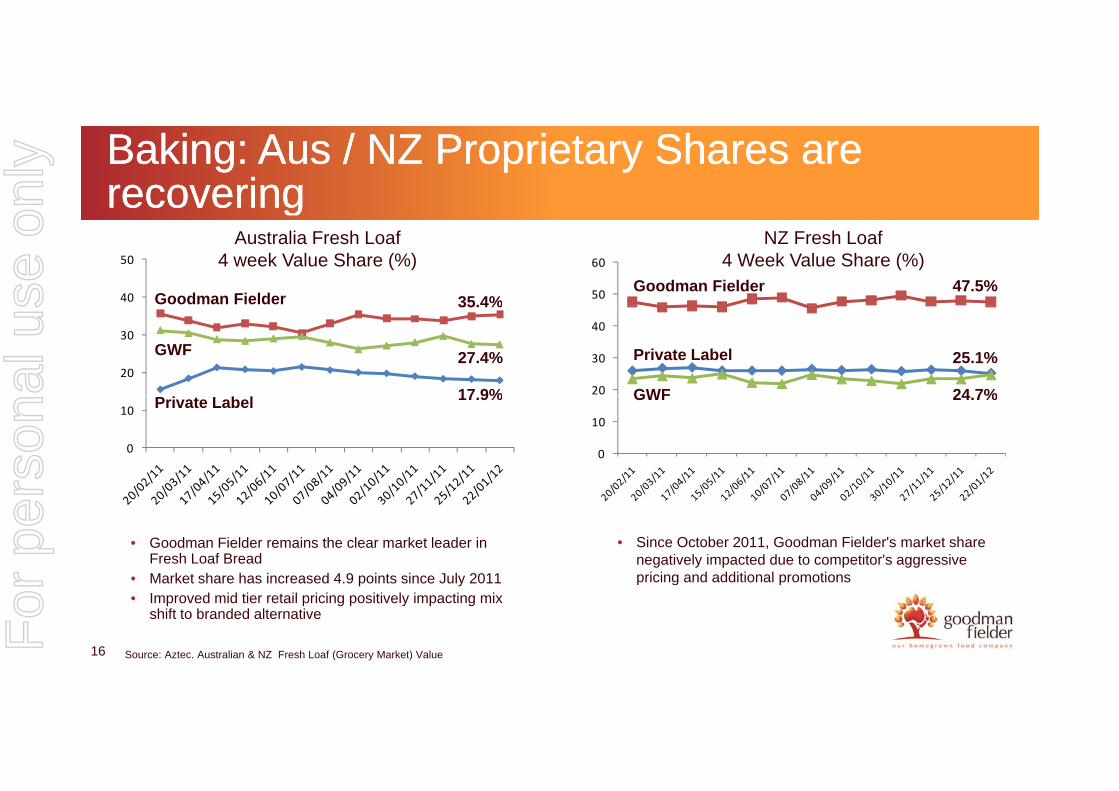
Baking: Aus / NZ Proprietary Shares are Baking: Aus / NZ Proprietary Shares are recoveringrecovering
40
50
50
60
ggAustralia Fresh Loaf
4 week Value Share (%)NZ Fresh Loaf
4 Week Value Share (%)Goodman Fielder 47.5%
Goodman Fielder 35.4%
20
30
20
30
40
Private Label
GWF
25.1%
24 7%
GWF
35.4%
27.4%
17 9%
0
10
0
10
GWF 24.7%Private Label 17.9%
• Goodman Fielder remains the clear market leader in Fresh Loaf BreadM k t h h i d 4 9 i t i J l 2011
• Since October 2011, Goodman Fielder's market share negatively impacted due to competitor's aggressive pricing and additional promotions
16
• Market share has increased 4.9 points since July 2011• Improved mid tier retail pricing positively impacting mix
shift to branded alternative
Source: Aztec. Australian & NZ Fresh Loaf (Grocery Market) Value
pricing and additional promotions
For
per
sona
l use
onl
y

Baking: Proprietary Pricing ImprovingBaking: Proprietary Pricing Improving
3 504.00
$
3.00
3.50Australian Market New Zealand Market
1.502.002.503.003.50
2.00
2.50
0.000.501.00 Total GF Baking Australia Fresh Loaf
Total Retailer PL Fresh Loaf
1.00
1.50 Total Loaf Bread Private LabelTotal Loaf Bread Goodman Fielder
• Premium Private Label pricing has (gradually) increased behind Value Added Private Label – not yet
• Proprietary pricing in NZ continues to improve
17 Source Aztec. Measuring Average Australian (Grocery) scanned prices
yat levels from a year ago
For
per
sona
l use
onl
y
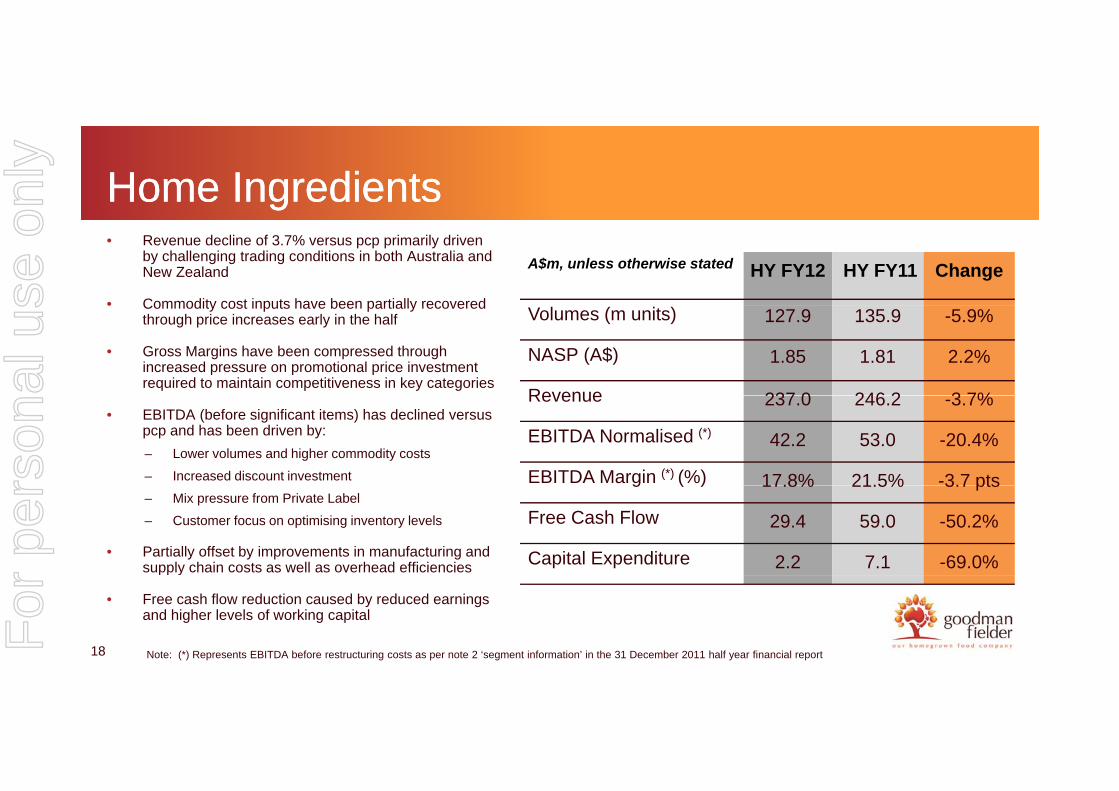
Home IngredientsHome Ingredients• Revenue decline of 3.7% versus pcp primarily driven
by challenging trading conditions in both Australia and New Zealand
• Commodity cost inputs have been partially recovered
A$m, unless otherwise stated HY FY12 HY FY11 Change
Commodity cost inputs have been partially recovered through price increases early in the half
• Gross Margins have been compressed through increased pressure on promotional price investment required to maintain competitiveness in key categories
Volumes (m units) 127.9 135.9 -5.9%
NASP (A$) 1.85 1.81 2.2%
Revenue 237 0 246 2 3 7%• EBITDA (before significant items) has declined versus
pcp and has been driven by:
– Lower volumes and higher commodity costs
– Increased discount investment
Revenue 237.0 246.2 -3.7%
EBITDA Normalised (*) 42.2 53.0 -20.4%
EBITDA Margin (*) (%) 17.8% 21.5% -3.7 pts– Mix pressure from Private Label
– Customer focus on optimising inventory levels
• Partially offset by improvements in manufacturing and supply chain costs as well as overhead efficiencies
g ( ) 17.8% 21.5% 3.7 pts
Free Cash Flow 29.4 59.0 -50.2%
Capital Expenditure 2.2 7.1 -69.0%
18
pp y
• Free cash flow reduction caused by reduced earnings and higher levels of working capital
Note: (*) Represents EBITDA before restructuring costs as per note 2 ‘segment information’ in the 31 December 2011 half year financial report
For
per
sona
l use
onl
y

Home Ingredients: Goodman Fielder Brands Home Ingredients: Goodman Fielder Brands Driving Category GrowthDriving Category Growth
Category GFHI
g g yg g y• Home Ingredients has strong
credentials as No. 1 or No. 2 brand in 8 out of 10 of its top categories
Goodman Fielder $ Growth 26 weeks to 1/1/12 versus pcp
14%
18%
27%
9%
Category GFHI8 out of 10 of its top categories
• Latest $ scan data (1/1/12) indicates Goodman Fielder is outperforming respective category growth in key
1%3%
6%
0%
7%
‐1%
0%
‐7%
3%
8%
3%
‐2%
0% 0%
9%respective category growth in key categories
• This demonstrates the robust focus on growing key categories despite
‐14% ‐14%
Total of Categories GF Plays in*
Spreads & Shortenings
Dressings And Mayo
Sweet Biscuits
Baking Mixes Seeded Oil Frozen Pastry Flour Chilled Dips Vinegar
g g y g pcompetitive challenges
19 Source: Aztec. Australian (Grocery Market) Value
For
per
sona
l use
onl
y
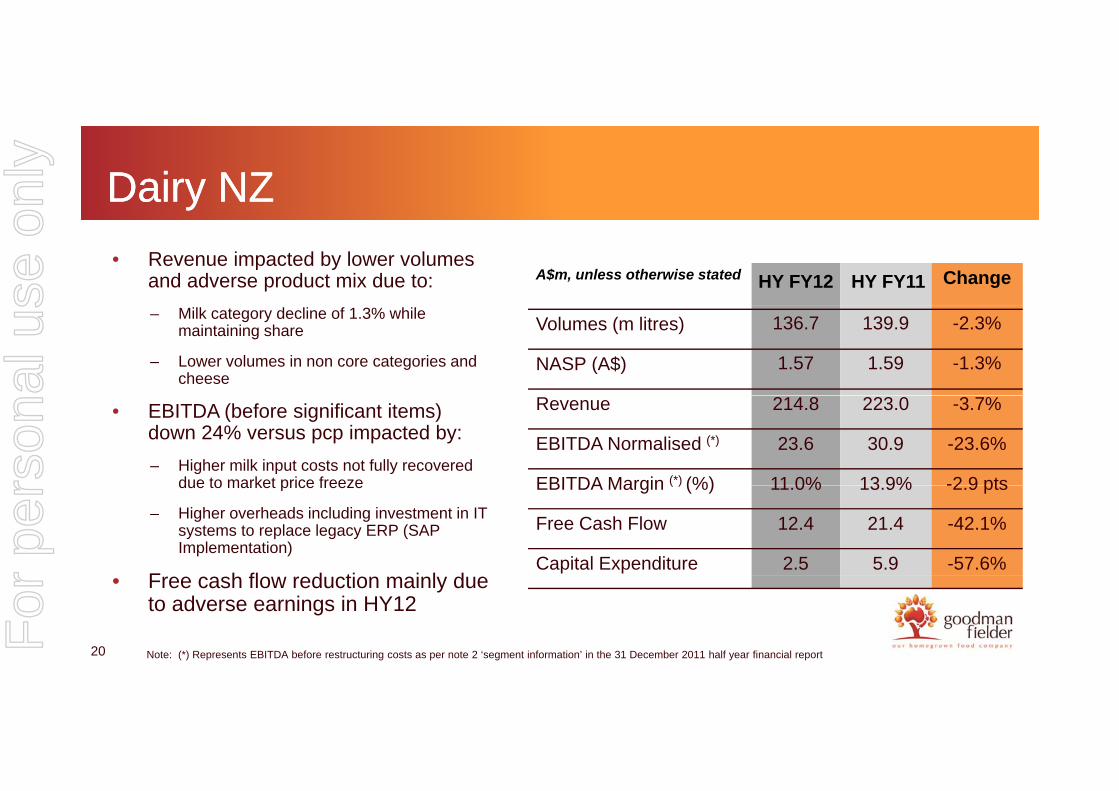
Dairy NZ Dairy NZ
• Revenue impacted by lower volumes and adverse product mix due to: A$m, unless otherwise stated HY FY12 HY FY11 Change
– Milk category decline of 1.3% while maintaining share
– Lower volumes in non core categories and cheese
Volumes (m litres) 136.7 139.9 -2.3%
NASP (A$) 1.57 1.59 -1.3%
• EBITDA (before significant items) down 24% versus pcp impacted by:
– Higher milk input costs not fully recovered due to market price freeze
Revenue 214.8 223.0 -3.7%
EBITDA Normalised (*) 23.6 30.9 -23.6%
EBITDA Margin (*) (%) 11 0% 13 9% -2 9 ptsdue to market price freeze
– Higher overheads including investment in IT systems to replace legacy ERP (SAP Implementation)
F h fl d ti i l d
EBITDA Margin ( ) (%) 11.0% 13.9% -2.9 pts
Free Cash Flow 12.4 21.4 -42.1%
Capital Expenditure 2.5 5.9 -57.6%
20
• Free cash flow reduction mainly due to adverse earnings in HY12
Note: (*) Represents EBITDA before restructuring costs as per note 2 ‘segment information’ in the 31 December 2011 half year financial report
For
per
sona
l use
onl
y
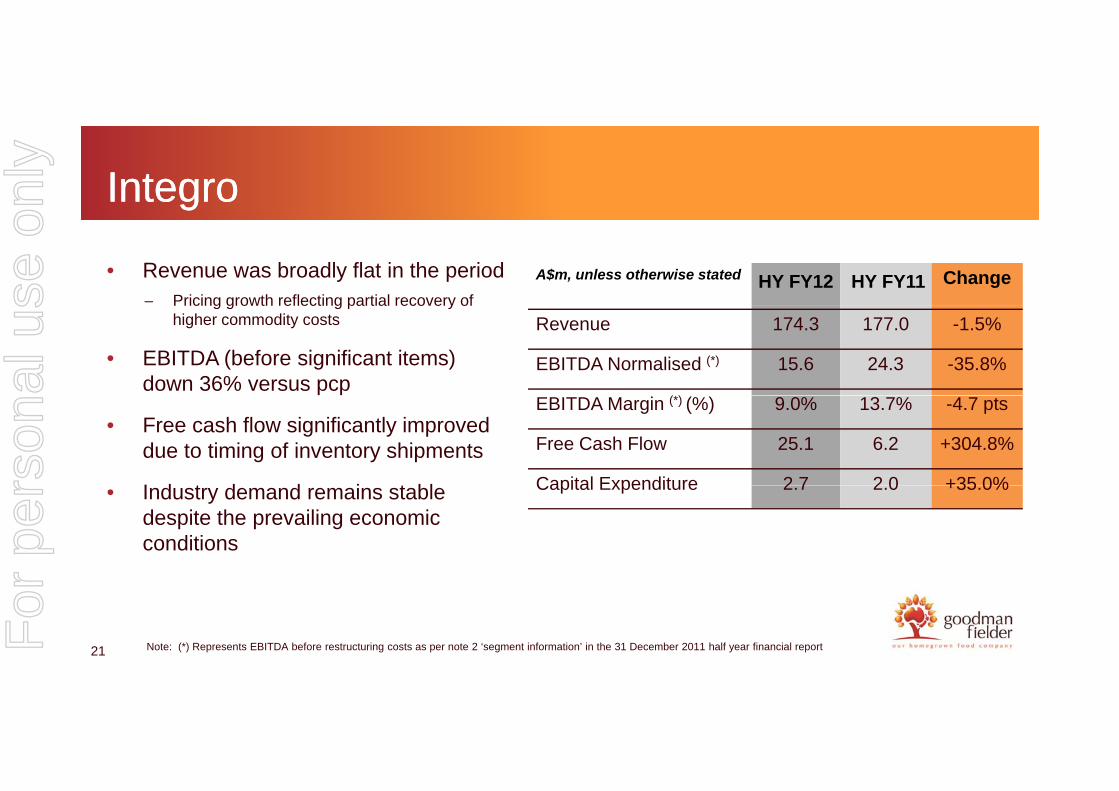
IntegroIntegro
• Revenue was broadly flat in the period– Pricing growth reflecting partial recovery of
A$m, unless otherwise stated HY FY12 HY FY11 Changec g g o t e ect g pa t a eco e y o
higher commodity costs
• EBITDA (before significant items) down 36% versus pcp
Revenue 174.3 177.0 -1.5%
EBITDA Normalised (*) 15.6 24.3 -35.8%
(*)
• Free cash flow significantly improved due to timing of inventory shipments
I d t d d i t bl
EBITDA Margin (*) (%) 9.0% 13.7% -4.7 pts
Free Cash Flow 25.1 6.2 +304.8%
Capital Expenditure 2 7 2 0 +35 0%• Industry demand remains stable despite the prevailing economic conditions
Capital Expenditure 2.7 2.0 +35.0%
21 Note: (*) Represents EBITDA before restructuring costs as per note 2 ‘segment information’ in the 31 December 2011 half year financial reportFor
per
sona
l use
onl
y
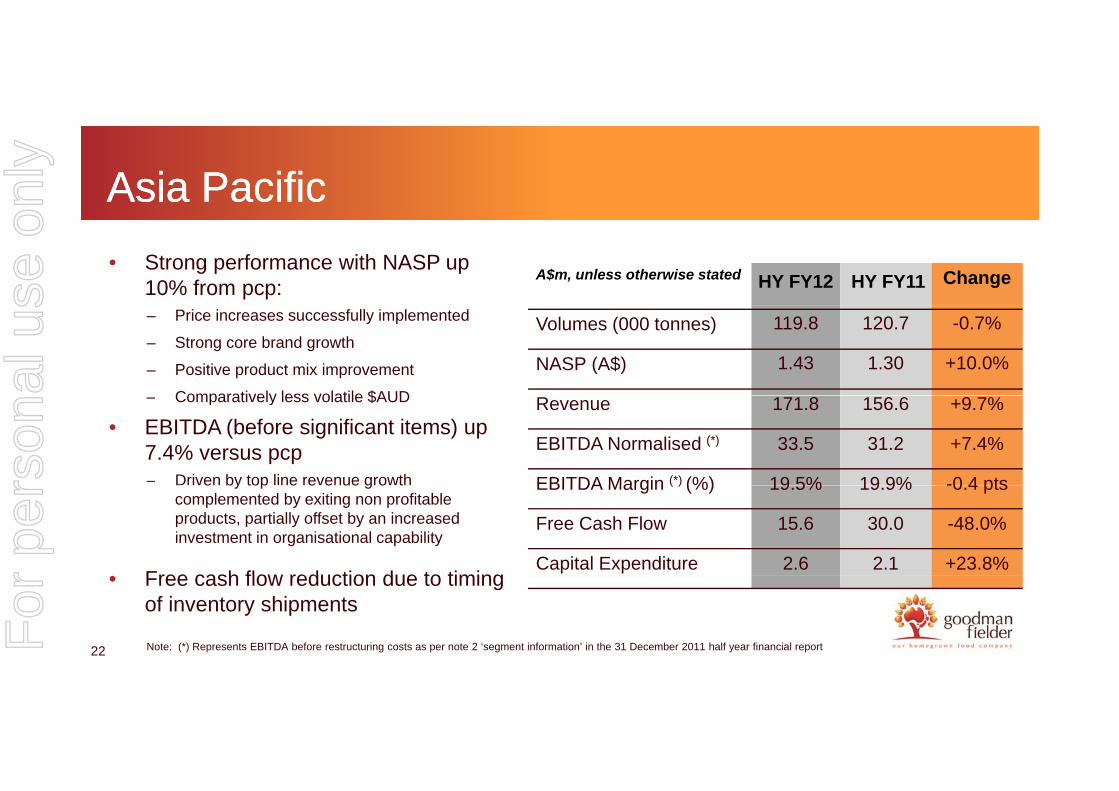
Asia PacificAsia Pacific
• Strong performance with NASP up 10% from pcp:
A$m, unless otherwise stated HY FY12 HY FY11 Change
– Price increases successfully implemented
– Strong core brand growth
– Positive product mix improvement
Comparatively less volatile $AUD
Volumes (000 tonnes) 119.8 120.7 -0.7%
NASP (A$) 1.43 1.30 +10.0%
– Comparatively less volatile $AUD
• EBITDA (before significant items) up 7.4% versus pcp– Driven by top line revenue growth
Revenue 171.8 156.6 +9.7%
EBITDA Normalised (*) 33.5 31.2 +7.4%
EBITDA Margin (*) (%) 19 5% 19 9% -0 4 ptse by top e e e ue g o tcomplemented by exiting non profitable products, partially offset by an increased investment in organisational capability
Free cash flow reduction due to timing
EBITDA Margin ( ) (%) 19.5% 19.9% -0.4 pts
Free Cash Flow 15.6 30.0 -48.0%
Capital Expenditure 2.6 2.1 +23.8%• Free cash flow reduction due to timing
of inventory shipments
22 Note: (*) Represents EBITDA before restructuring costs as per note 2 ‘segment information’ in the 31 December 2011 half year financial reportFor
per
sona
l use
onl
y

Strategic Review UpdateStrategic Review UpdateStrategic Review UpdateStrategic Review UpdateChris DelaneyChris DelaneyChris DelaneyChris Delaney
Chief Executive OfficerChief Executive Officer
23For
per
sona
l use
onl
y
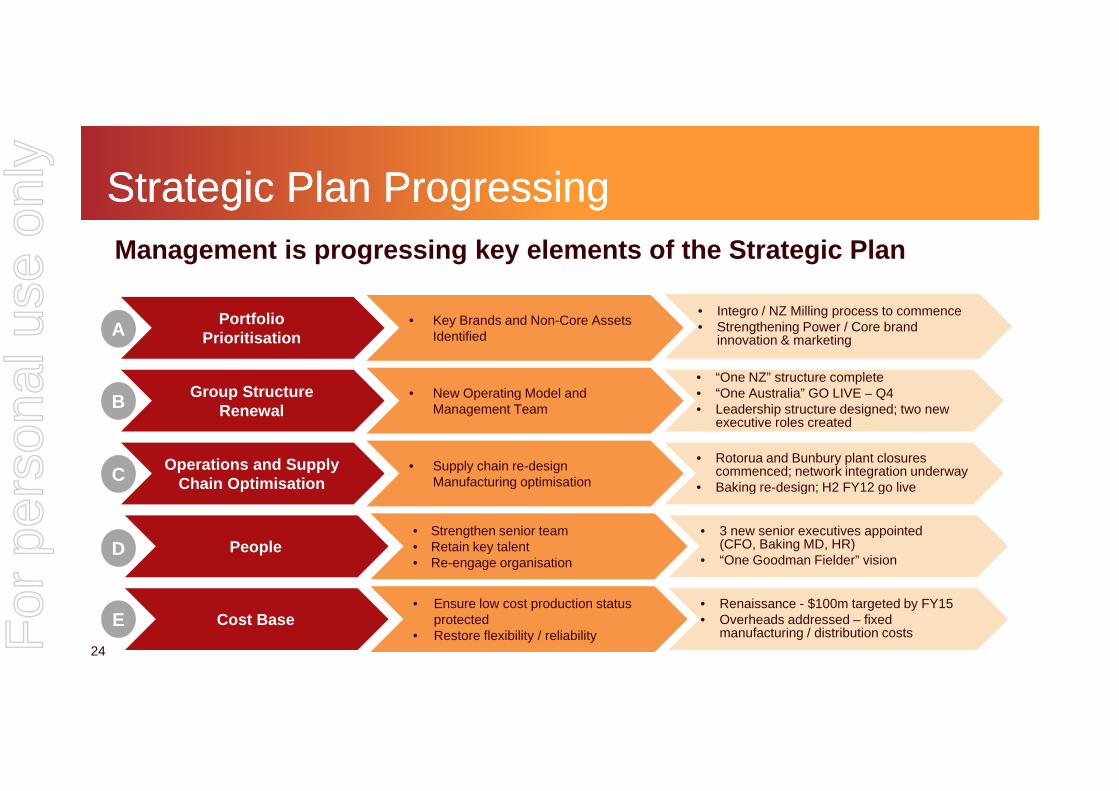
Strategic Plan ProgressingStrategic Plan Progressing
I / NZ Milli
Management is progressing key elements of the Strategic Plan
Portfolio Prioritisation
Group Structure
• Key Brands and Non-Core Assets Identified
• Integro / NZ Milling process to commence • Strengthening Power / Core brand
innovation & marketing
• New Operating Model and• “One NZ” structure complete• “One Australia” GO LIVE – Q4B
A
Group Structure Renewal
Operations and Supply Chain Optimisation
New Operating Model and Management Team
One Australia GO LIVE Q4• Leadership structure designed; two new
executive roles created
• Supply chain re-design Manufacturing optimisation
• Rotorua and Bunbury plant closures commenced; network integration underway
• Baking re design; H2 FY12 go live
B
C Chain Optimisation Manufacturing optimisation • Baking re-design; H2 FY12 go live
People• Strengthen senior team• Retain key talent• Re-engage organisation
• 3 new senior executives appointed (CFO, Baking MD, HR)
• “One Goodman Fielder” visionD
24
Cost Base• Ensure low cost production status
protected• Restore flexibility / reliability
E• Renaissance - $100m targeted by FY15• Overheads addressed – fixed
manufacturing / distribution costsFor
per
sona
l use
onl
y
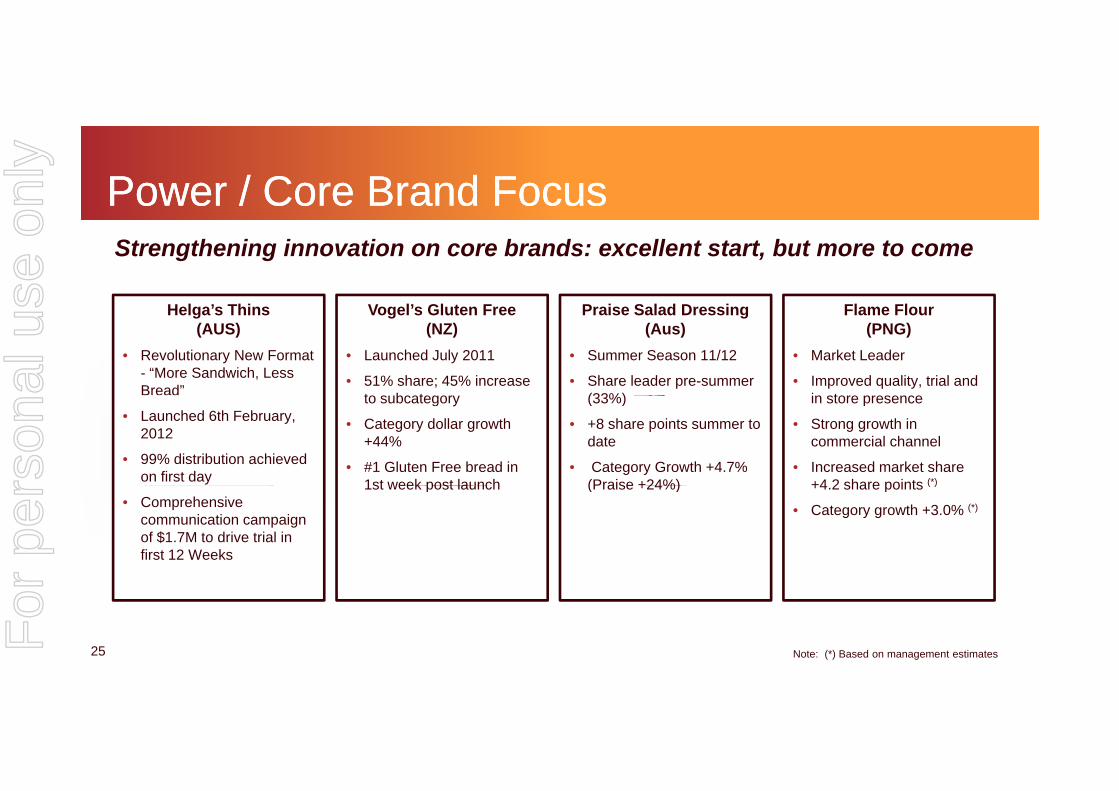
Power / Core Brand FocusPower / Core Brand FocusStrengthening innovation on core brands: excellent start, but more to come
H l ’ Thi V l’ Gl t F P i S l d D i Fl FlHelga’s Thins(AUS)
• Revolutionary New Format - “More Sandwich, Less Bread”
Vogel’s Gluten Free (NZ)
• Launched July 2011
• 51% share; 45% increase to s bcategor
Praise Salad Dressing (Aus)
• Summer Season 11/12
• Share leader pre-summer (33%)
Flame Flour (PNG)
• Market Leader
• Improved quality, trial and in store presence
• Launched 6th February, 2012
• 99% distribution achieved on first day
to subcategory
• Category dollar growth +44%
• #1 Gluten Free bread in 1st week post launch
(33%)
• +8 share points summer to date
• Category Growth +4.7% (Praise +24%)
in store presence
• Strong growth in commercial channel
• Increased market share +4 2 share points (*)
• Comprehensive communication campaign of $1.7M to drive trial in first 12 Weeks
1st week post launch (Praise +24%) +4.2 share points ( )
• Category growth +3.0% (*)
25 Note: (*) Based on management estimates
For
per
sona
l use
onl
y

Portfolio Prioritisation / NonPortfolio Prioritisation / Non--core Assetscore Assets
Integro / NZ Milling divestment / partnership process to commence
Att ti d f i b i b t t G d Fi ld• Attractive, good performing businesses, but non-core to Goodman Fielder
• Unsolicited interest in both businesses
• Processes are expected to be launched during March• Processes are expected to be launched during March
• No timing imperative or pressing need to transact in relation to the non-core assets – a change in status quo will only be pursued if it optimises shareholder value
Further work underway on portfolio prioritisation
• FY13 Strategic Plan to incorporate power and core brand resource focus
26
• Range reviews in consultation with strategic customers underway
For
per
sona
l use
onl
y
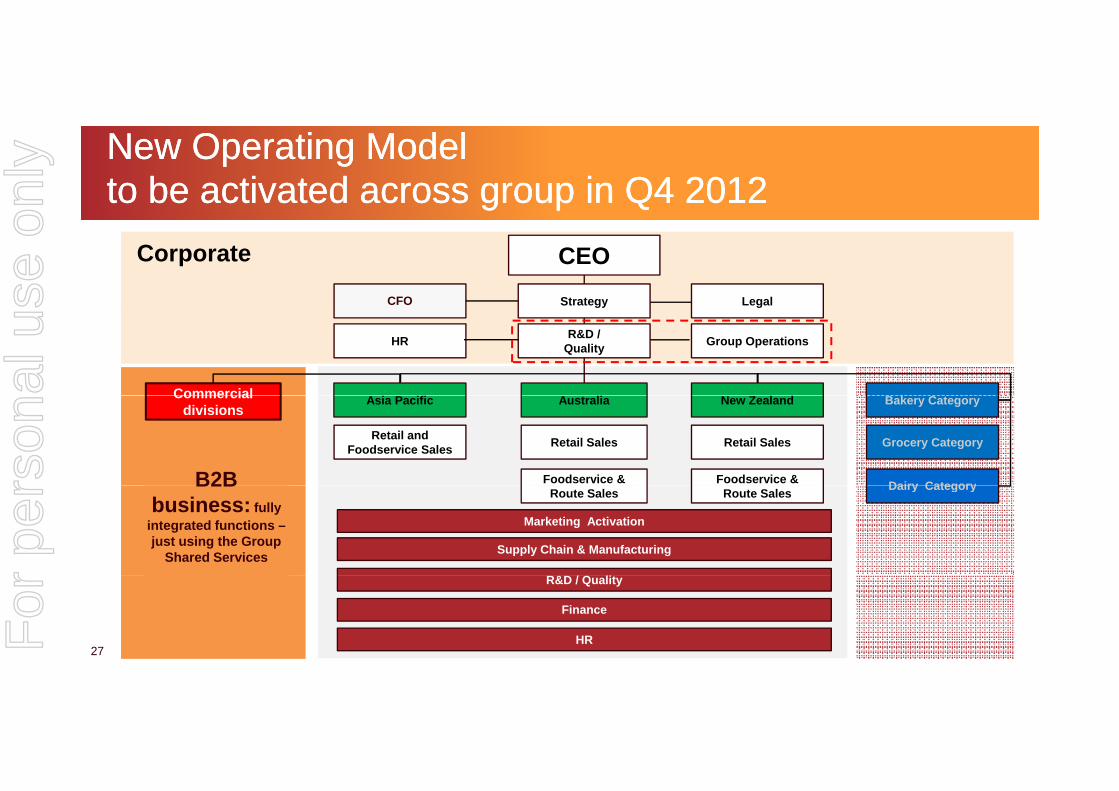
New Operating Model New Operating Model to be activated across group in Q4 2012to be activated across group in Q4 2012
n
CEO
CFO Legal
Corporate
Strategy
HR
g
Group Operations
gy
R&D / Quality
Commercial Australia
B2B
Grocery Category
Dairy Category
Retail and Foodservice Sales
Retail Sales Retail Sales
Bakery Category
Foodservice & Foodservice &
New ZealandAsia PacificCommercial divisions
B2B business: fully
integrated functions –just using the Group
Shared Services
Dairy Category
Supply Chain & Manufacturing
Marketing Activation
Route Sales Route Sales
27
Finance
HR
R&D / Quality
For
per
sona
l use
onl
y
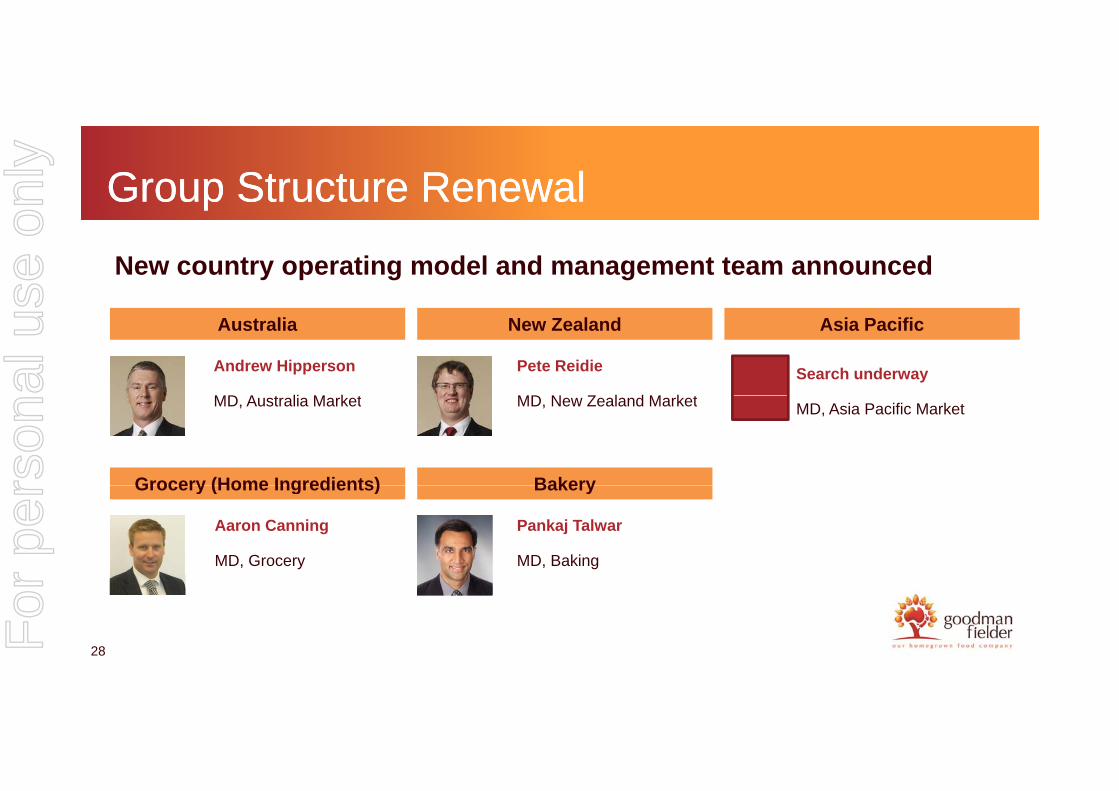
Group Structure RenewalGroup Structure Renewal
New country operating model and management team announced
Australia New Zealand
Andrew Hipperson
MD A t li M k t
Pete Reidie
MD N Z l d M k t
Asia Pacific
Search underway
MD, Australia Market MD, New Zealand Market
Grocery (Home Ingredients) Bakery
MD, Asia Pacific Market
Aaron Canning
MD, Grocery
Pankaj Talwar
MD, Baking
Grocery (Home Ingredients) Bakery
28For
per
sona
l use
onl
y

Project Renaissance UpdateProject Renaissance Update
Identified & Plans in Place
(FY12 / FY13)
Work Plans in Progress(FY13 / FY14)
Savings Targeted(FY14 / FY15)
( )
Ongoing Savings $40m $25m $35m
Restructuring Costs $33m $20m - $25m TBD
Key ProjectsBaking Australia overheads
Project TowerManufacturing & Supply
Chain Optimisation (Phase I)
Manufacturing & Supply Chain Optimisation
(Phase II)
• $60m in supply chain / operations project underway
– Plans include Baking redesign, and the associated benefits on the baking supply chain from portfolio prioritisationchain from portfolio prioritisation
– No significant news versus November update; progress as planned
– Plans to be complete before financial year end. Will announce as ready
29For
per
sona
l use
onl
y
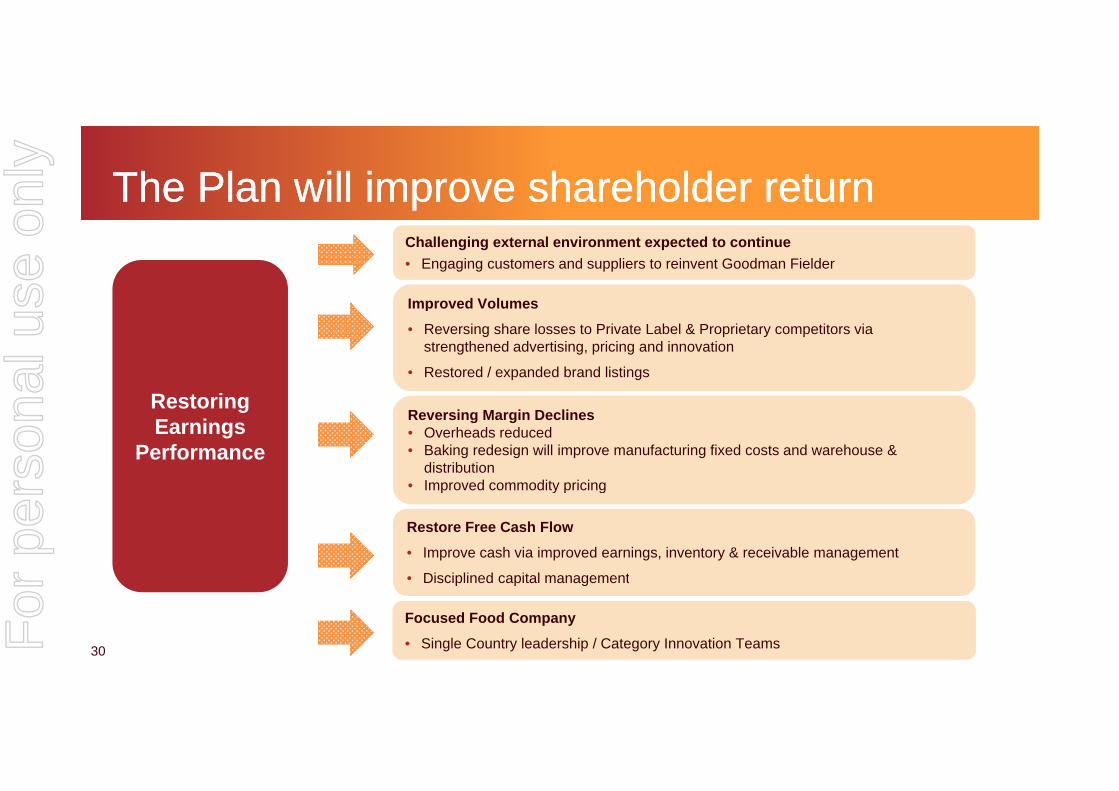
The Plan will improve shareholder returnThe Plan will improve shareholder returnChallenging external environment expected to continue
• Engaging customers and suppliers to reinvent Goodman Fielder
Improved Volumes
R t i
Improved Volumes
• Reversing share losses to Private Label & Proprietary competitors via strengthened advertising, pricing and innovation
• Restored / expanded brand listings
RestoringEarnings
Performance
Reversing Margin Declines• Overheads reduced• Baking redesign will improve manufacturing fixed costs and warehouse &
distribution• Improved commodity pricing• Improved commodity pricing
Restore Free Cash Flow
• Improve cash via improved earnings, inventory & receivable management
Di i li d it l t
30
• Disciplined capital management
Focused Food Company
• Single Country leadership / Category Innovation TeamsFor
per
sona
l use
onl
y

FY12 Outlook and GuidanceFY12 Outlook and Guidance
• Trading conditions and external environment remain challenging, however, offsetting this is the recent stabilisation of the business and the progress of the Strategic Plan, which allows management to resume guidance for FY12– EBIT range, before significant items, for FY12 expected to be $230m to $245mg g p
• Underpinning second half performance:– Favourable commodity costs for wheat and oils
– Volume increases, mainly in Baking New Zealand (new private label contracts recently negotiated)
– Further cost reductions achieved from Project Renaissance
– Trading conditions with key retailers continue on current terms and conditions
31For
per
sona
l use
onl
y
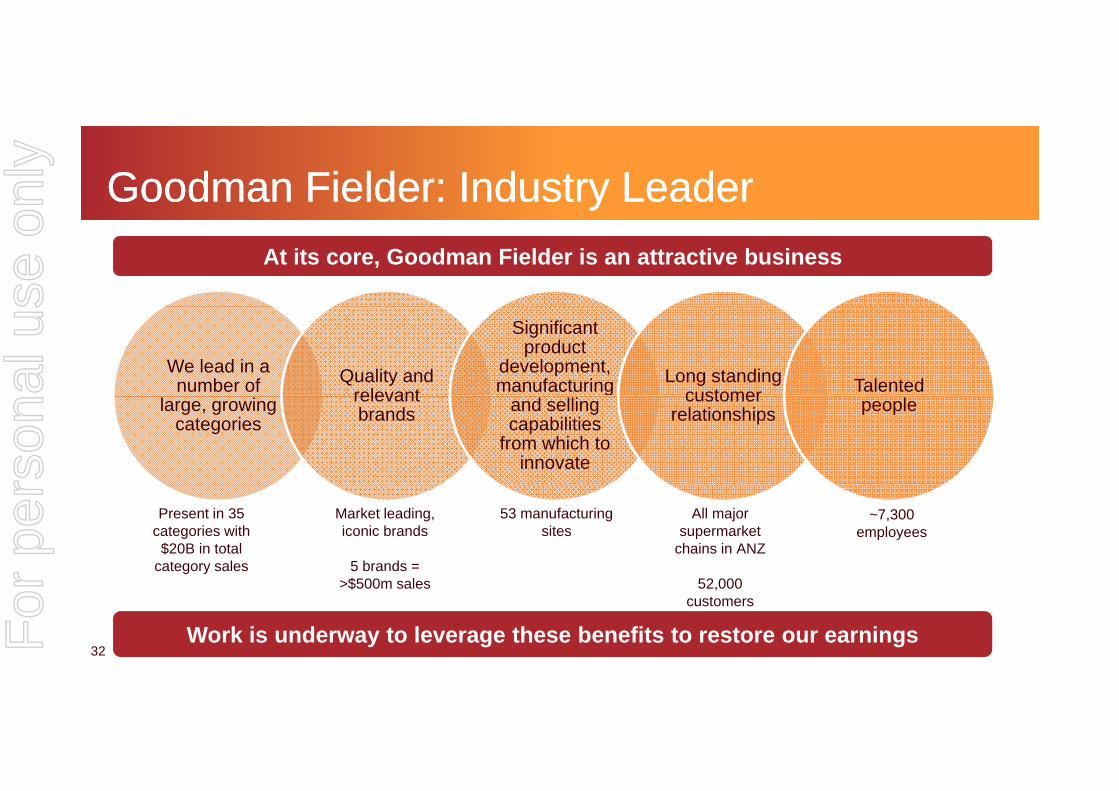
Goodman Fielder: Industry LeaderGoodman Fielder: Industry Leader
At its core, Goodman Fielder is an attractive business
We lead in a number of Quality and
relevant
Significant product
development, manufacturing Long standing
customer Talented large, growing
categories
relevant brands
gand selling capabilities
from which to innovate
customer relationships people
Present in 35 categories with$20B in total
category sales
53 manufacturing sites
Market leading, iconic brands
5 brands =
All major supermarket
chains in ANZ
~7,300employees
32Work is underway to leverage these benefits to restore our earnings
>$500m sales 52,000 customers
For
per
sona
l use
onl
y

Q&AQ&A
33For
per
sona
l use
onl
y

34For
per
sona
l use
onl
y