Embed Size (px)
Citation preview
SYMP2006\CaseStudies\MMC-Hays-KS 1 Copyright David G Barton 12/30/2005
“Good to Great” Path to Profitability: Performance Profile of Midland Marketing Co-op
Case Study of
Midland Marketing Co-op Hays, Kansas
Prepared for
2006 Symposium and Leadership Roundtable January 16-17, 2006 Grand Prairie Hotel Hutchinson, Kansas
Prepared by
David Barton Professor and Director
Arthur Capper Cooperative Center Kansas State University
December 30, 2005
1
SYMP2006\CaseStudies\MMC-Hays-KS 2 Copyright David G Barton 12/30/2005
Introduction
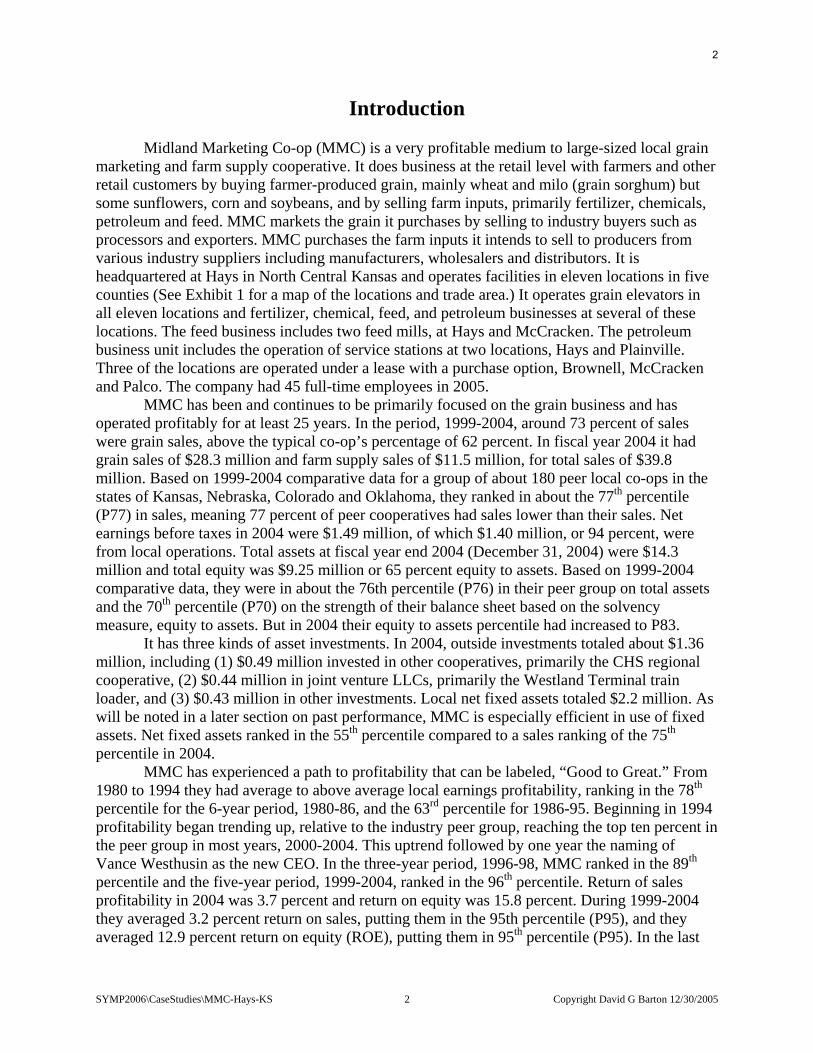
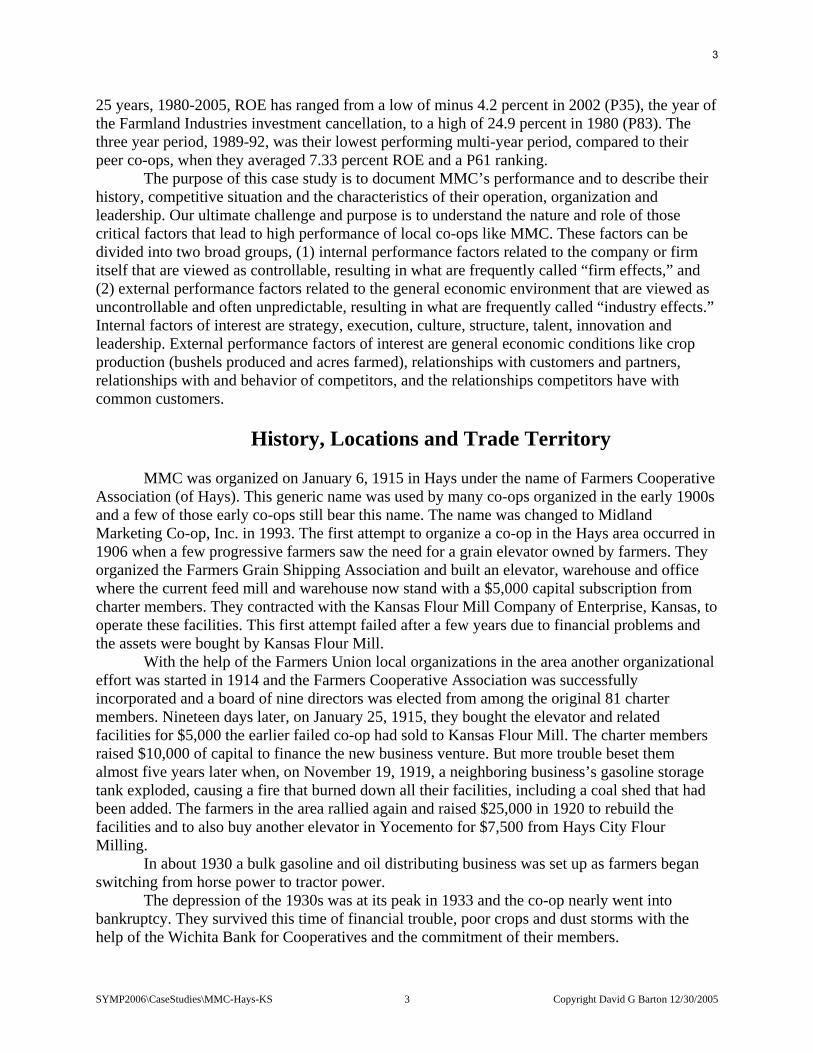
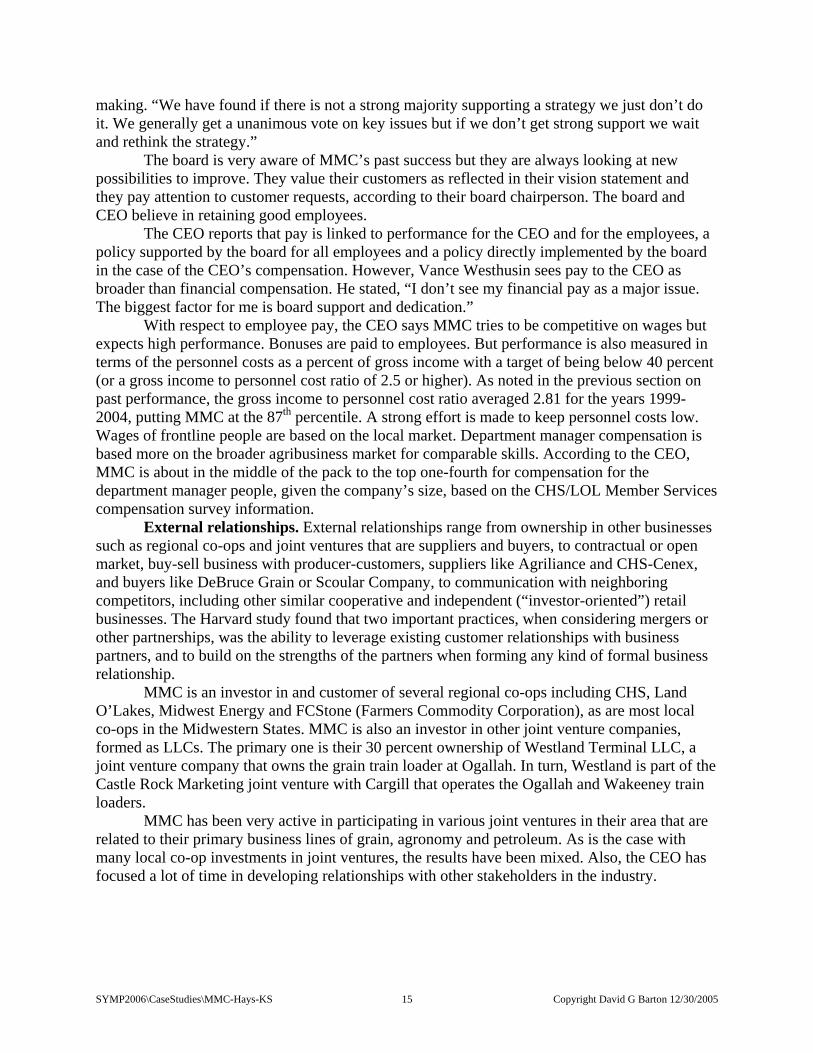
Midland Marketing Co-op (MMC) is a very profitable medium to large-sized local grain marketing and farm supply cooperative. It does business at the retail level with farmers and other retail customers by buying farmer-produced grain, mainly wheat and milo (grain sorghum) but some sunflowers, corn and soybeans, and by selling farm inputs, primarily fertilizer, chemicals, petroleum and feed. MMC markets the grain it purchases by selling to industry buyers such as processors and exporters. MMC purchases the farm inputs it intends to sell to producers from various industry suppliers including manufacturers, wholesalers and distributors. It is headquartered at Hays in North Central Kansas and operates facilities in eleven locations in five counties (See Exhibit 1 for a map of the locations and trade area.) It operates grain elevators in all eleven locations and fertilizer, chemical, feed, and petroleum businesses at several of these locations. The feed business includes two feed mills, at Hays and McCracken. The petroleum business unit includes the operation of service stations at two locations, Hays and Plainville. Three of the locations are operated under a lease with a purchase option, Brownell, McCracken and Palco. The company had 45 full-time employees in 2005.
MMC has been and continues to be primarily focused on the grain business and has operated profitably for at least 25 years. In the period, 1999-2004, around 73 percent of sales were grain sales, above the typical co-op’s percentage of 62 percent. In fiscal year 2004 it had grain sales of $28.3 million and farm supply sales of $11.5 million, for total sales of $39.8 million. Based on 1999-2004 comparative data for a group of about 180 peer local co-ops in the states of Kansas, Nebraska, Colorado and Oklahoma, they ranked in about the 77th percentile (P77) in sales, meaning 77 percent of peer cooperatives had sales lower than their sales. Net earnings before taxes in 2004 were $1.49 million, of which $1.40 million, or 94 percent, were from local operations. Total assets at fiscal year end 2004 (December 31, 2004) were $14.3 million and total equity was $9.25 million or 65 percent equity to assets. Based on 1999-2004 comparative data, they were in about the 76th percentile (P76) in their peer group on total assets and the 70th percentile (P70) on the strength of their balance sheet based on the solvency measure, equity to assets. But in 2004 their equity to assets percentile had increased to P83.
It has three kinds of asset investments. In 2004, outside investments totaled about $1.36 million, including (1) $0.49 million invested in other cooperatives, primarily the CHS regional cooperative, (2) $0.44 million in joint venture LLCs, primarily the Westland Terminal train loader, and (3) $0.43 million in other investments. Local net fixed assets totaled $2.2 million. As will be noted in a later section on past performance, MMC is especially efficient in use of fixed assets. Net fixed assets ranked in the 55th percentile compared to a sales ranking of the 75th percentile in 2004.
MMC has experienced a path to profitability that can be labeled, “Good to Great.” From 1980 to 1994 they had average to above average local earnings profitability, ranking in the 78th percentile for the 6-year period, 1980-86, and the 63rd percentile for 1986-95. Beginning in 1994 profitability began trending up, relative to the industry peer group, reaching the top ten percent in the peer group in most years, 2000-2004. This uptrend followed by one year the naming of Vance Westhusin as the new CEO. In the three-year period, 1996-98, MMC ranked in the 89th percentile and the five-year period, 1999-2004, ranked in the 96th percentile. Return of sales profitability in 2004 was 3.7 percent and return on equity was 15.8 percent. During 1999-2004 they averaged 3.2 percent return on sales, putting them in the 95th percentile (P95), and they averaged 12.9 percent return on equity (ROE), putting them in 95th percentile (P95). In the last
2
SYMP2006\CaseStudies\MMC-Hays-KS 3 Copyright David G Barton 12/30/2005
25 years, 1980-2005, ROE has ranged from a low of minus 4.2 percent in 2002 (P35), the year of the Farmland Industries investment cancellation, to a high of 24.9 percent in 1980 (P83). The three year period, 1989-92, was their lowest performing multi-year period, compared to their peer co-ops, when they averaged 7.33 percent ROE and a P61 ranking.
The purpose of this case study is to document MMC’s performance and to describe their history, competitive situation and the characteristics of their operation, organization and leadership. Our ultimate challenge and purpose is to understand the nature and role of those critical factors that lead to high performance of local co-ops like MMC. These factors can be divided into two broad groups, (1) internal performance factors related to the company or firm itself that are viewed as controllable, resulting in what are frequently called “firm effects,” and (2) external performance factors related to the general economic environment that are viewed as uncontrollable and often unpredictable, resulting in what are frequently called “industry effects.” Internal factors of interest are strategy, execution, culture, structure, talent, innovation and leadership. External performance factors of interest are general economic conditions like crop production (bushels produced and acres farmed), relationships with customers and partners, relationships with and behavior of competitors, and the relationships competitors have with common customers.
History, Locations and Trade Territory
MMC was organized on January 6, 1915 in Hays under the name of Farmers Cooperative
Association (of Hays). This generic name was used by many co-ops organized in the early 1900s and a few of those early co-ops still bear this name. The name was changed to Midland Marketing Co-op, Inc. in 1993. The first attempt to organize a co-op in the Hays area occurred in 1906 when a few progressive farmers saw the need for a grain elevator owned by farmers. They organized the Farmers Grain Shipping Association and built an elevator, warehouse and office where the current feed mill and warehouse now stand with a $5,000 capital subscription from charter members. They contracted with the Kansas Flour Mill Company of Enterprise, Kansas, to operate these facilities. This first attempt failed after a few years due to financial problems and the assets were bought by Kansas Flour Mill.
With the help of the Farmers Union local organizations in the area another organizational effort was started in 1914 and the Farmers Cooperative Association was successfully incorporated and a board of nine directors was elected from among the original 81 charter members. Nineteen days later, on January 25, 1915, they bought the elevator and related facilities for $5,000 the earlier failed co-op had sold to Kansas Flour Mill. The charter members raised $10,000 of capital to finance the new business venture. But more trouble beset them almost five years later when, on November 19, 1919, a neighboring business’s gasoline storage tank exploded, causing a fire that burned down all their facilities, including a coal shed that had been added. The farmers in the area rallied again and raised $25,000 in 1920 to rebuild the facilities and to also buy another elevator in Yocemento for $7,500 from Hays City Flour Milling.
In about 1930 a bulk gasoline and oil distributing business was set up as farmers began switching from horse power to tractor power.
The depression of the 1930s was at its peak in 1933 and the co-op nearly went into bankruptcy. They survived this time of financial trouble, poor crops and dust storms with the help of the Wichita Bank for Cooperatives and the commitment of their members.
3
SYMP2006\CaseStudies\MMC-Hays-KS 4 Copyright David G Barton 12/30/2005
In 1935 a feed grinding and mixing business was added. Shortly after this, a service station and cream station were added.
On January 1, 1939 the association changed it business form to be strictly a membership organization that was 100 percent cooperative to take advantage of the Capper-Volstead Act of 1922. At that time the membership fee was set at $10 and they began operating on a traditional cooperative basis, including the use of the revolving fund system of equity management.
The growth of the business accelerated during and after World War Two. Membership had expanded from 81 charter members to 176 to over 1,000. Storage capacity for wheat had become a problem and capacity was expanded numerous times in the 1940s and 1950s by leasing facilities in Hays and Toulon in 1941 and by constructing the first concrete elevator in 1947 in Hays with 200,000 bushel capacity. Additional storage was built in 1950 and 1954, raising capacity to 865,000 bushels in Hays.
The first merger took place in 1957 when the Plainville Oil cooperative was absorbed. Numerous grain elevators were built in the late 1950s including branch elevators at Yocemento, Plainville and Toulon. By 1960, the four elevator locations had storage capacity of about 3.6 million bushels.
MMC absorbed three other co-ops in mergers with Zurich in 1966, Natoma Cooperative Association in 1982 and Farmers Union Cooperative of LaCrosse in 1992. Today there are grain elevators in all eleven locations with a total storage capacity of 8.6 million bushels.
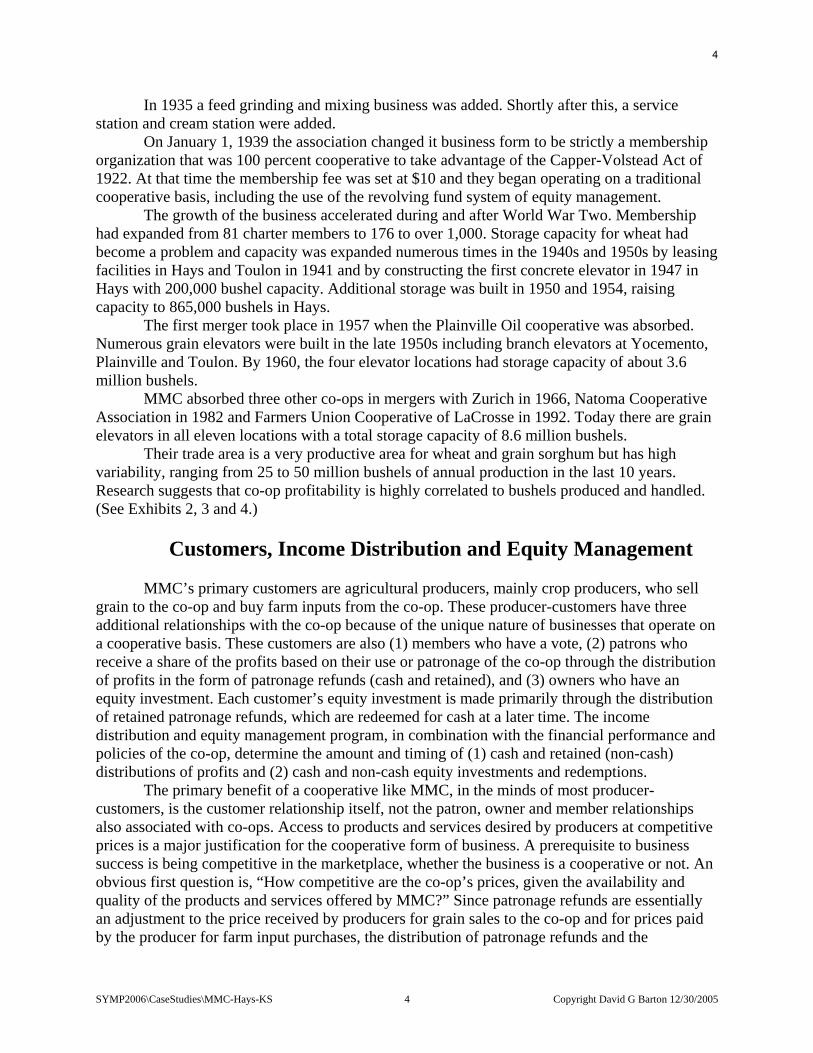
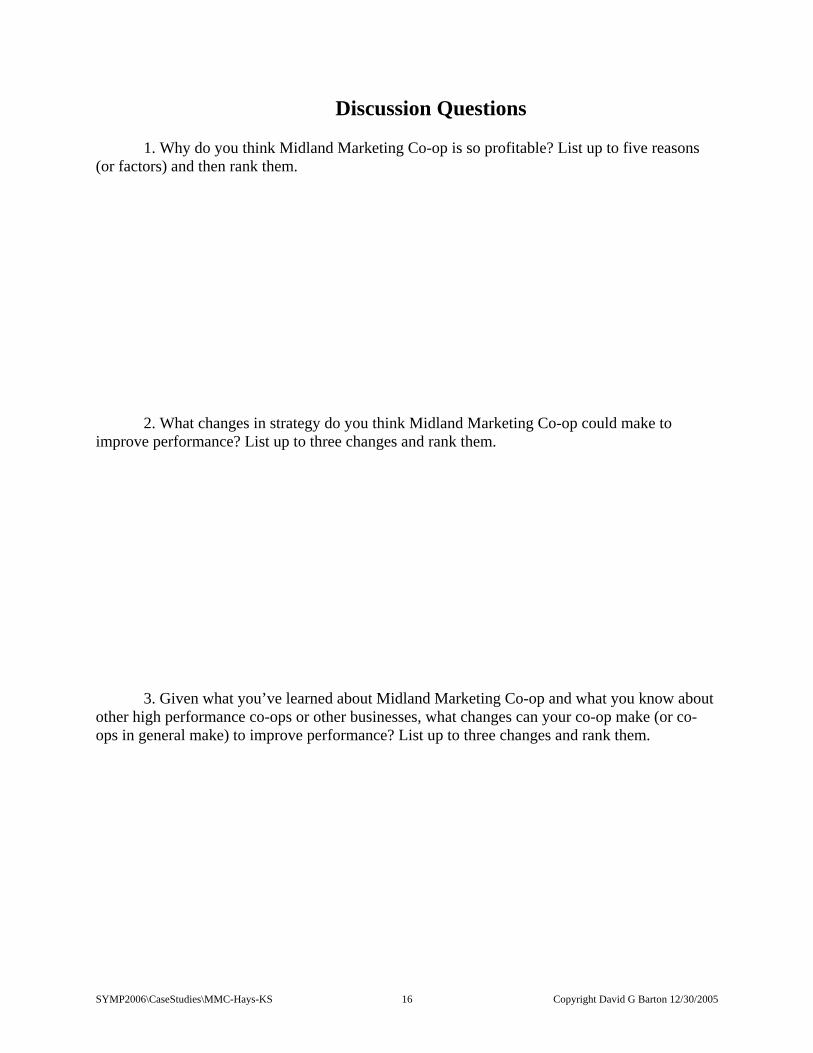
Their trade area is a very productive area for wheat and grain sorghum but has high variability, ranging from 25 to 50 million bushels of annual production in the last 10 years. Research suggests that co-op profitability is highly correlated to bushels produced and handled. (See Exhibits 2, 3 and 4.)
Customers, Income Distribution and Equity Management
MMC’s primary customers are agricultural producers, mainly crop producers, who sell
grain to the co-op and buy farm inputs from the co-op. These producer-customers have three additional relationships with the co-op because of the unique nature of businesses that operate on a cooperative basis. These customers are also (1) members who have a vote, (2) patrons who receive a share of the profits based on their use or patronage of the co-op through the distribution of profits in the form of patronage refunds (cash and retained), and (3) owners who have an equity investment. Each customer’s equity investment is made primarily through the distribution of retained patronage refunds, which are redeemed for cash at a later time. The income distribution and equity management program, in combination with the financial performance and policies of the co-op, determine the amount and timing of (1) cash and retained (non-cash) distributions of profits and (2) cash and non-cash equity investments and redemptions.
The primary benefit of a cooperative like MMC, in the minds of most producer-customers, is the customer relationship itself, not the patron, owner and member relationships also associated with co-ops. Access to products and services desired by producers at competitive prices is a major justification for the cooperative form of business. A prerequisite to business success is being competitive in the marketplace, whether the business is a cooperative or not. An obvious first question is, “How competitive are the co-op’s prices, given the availability and quality of the products and services offered by MMC?” Since patronage refunds are essentially an adjustment to the price received by producers for grain sales to the co-op and for prices paid by the producer for farm input purchases, the distribution of patronage refunds and the
4
SYMP2006\CaseStudies\MMC-Hays-KS 5 Copyright David G Barton 12/30/2005
management of the retained portion, including the redemption of the retained portion are factors of interest. An obvious second question is, “How are those prices viewed, given the distribution of profits and the redemption of equity by MMC?” We will address the second question in this section and the first question, to the extent possible, in the next section on competitors and the marketplace.
MMC has 1,067 producer-customers who are also voting members, patrons and owners. It also allows other customers to be patrons and owners and has 1,384 of these non-voting patron-owners for a total of 2,451 voting and non-voting patrons. The non-member customers who are treated on a patronage basis are called participating patrons. Both members and participating patrons are expected to have an equity investment in the co-op. Each voting member has two classes of equity investment. MMC is a non-stock company, so instead of having common stock to convey membership as done in stock companies, they have an equivalent class of equity called a “Membership Certificate.” First, each member is expected to hold one unit of membership equity (ME) with a par value of $500. No cash investment is required, so this first $500 is earned through the distribution of retained patronage refunds. Second, all accumulated retained patronage refunds, exceeding $500, are held in a book credit class of equity called “Revolving Fund” on the balance sheet, but also sometimes referred to as “Deferred Patronage Dividends” by management.
Each participating patron is not currently expected to have an initial $500 investment, with a corresponding “Participating Certificate.” All of their retained patronage refunds are distributed into the equity class, Revolving Fund. MMC is considering whether to apply the $500 requirement to participating or non-voting patrons just as they do for member or voting patrons.
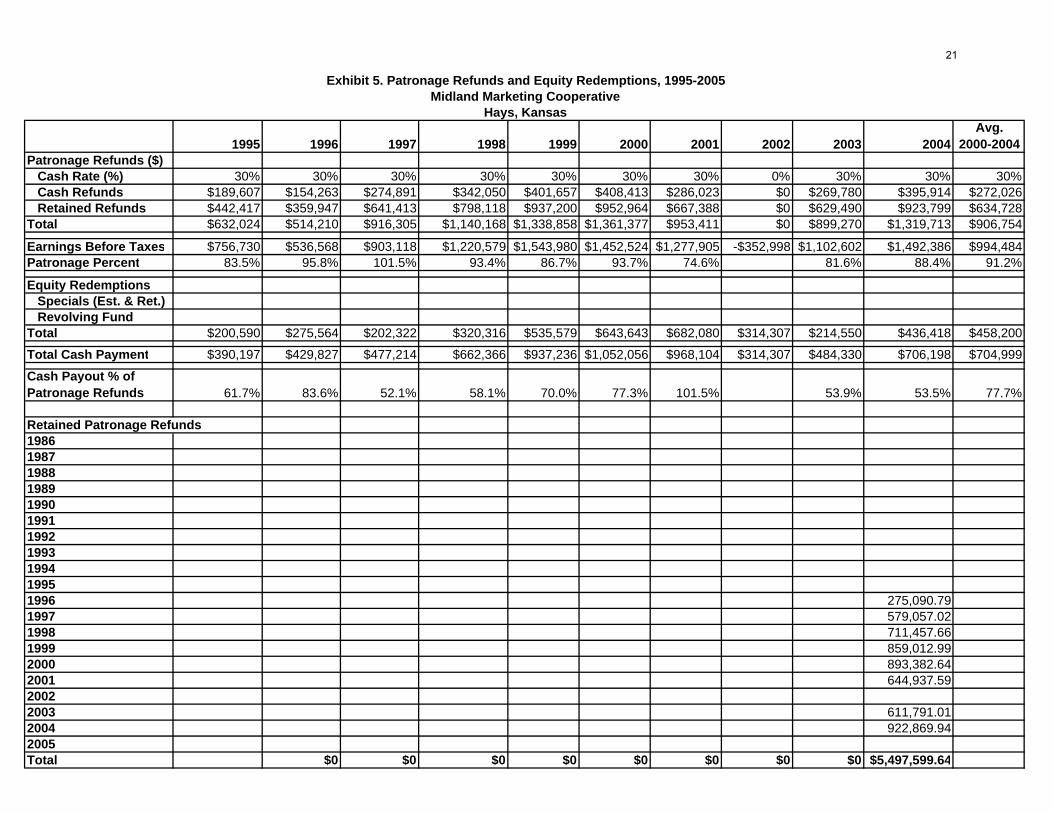
Income distribution. Income distribution decisions are made following the end of the fiscal year, which is December 31. Patronage refunds, including the cash patronage refund is paid at the annual meeting in March, less than three months after the end of the fiscal year. MMC’s patronage business is typically around 90 percent of total business as measured by the percentage of total earnings before income taxes distributed as patronage refunds (often called patronage dividends). In 2004 patronage refunds were 88.4 percent of total earnings. During the last 10 years, 1995-2004, they have varied from a low of 74.6 percent in 2001 to a high of 101.5 percent in 1997.
All their patronage earnings are distributed as qualified patronage refunds, thereby creating a deduction from the taxable income of the cooperative and simultaneously passing on the income tax obligation to the producer-patron. Cash patronage refunds have been 30 percent for distributions on the fiscal years, 1995-2004. Therefore, for at least 10 years MMC has paid a little less than enough cash to cover the income and Social Security (FICA) tax obligations of their producer-patrons in the year of distribution, estimated to be in the range of 35 to 45 percent. This moderate cash patronage rate is not viewed by MMC as a major competitive disadvantage in their trade territory. (See Exhibit 5 for information on patronage distributions.)
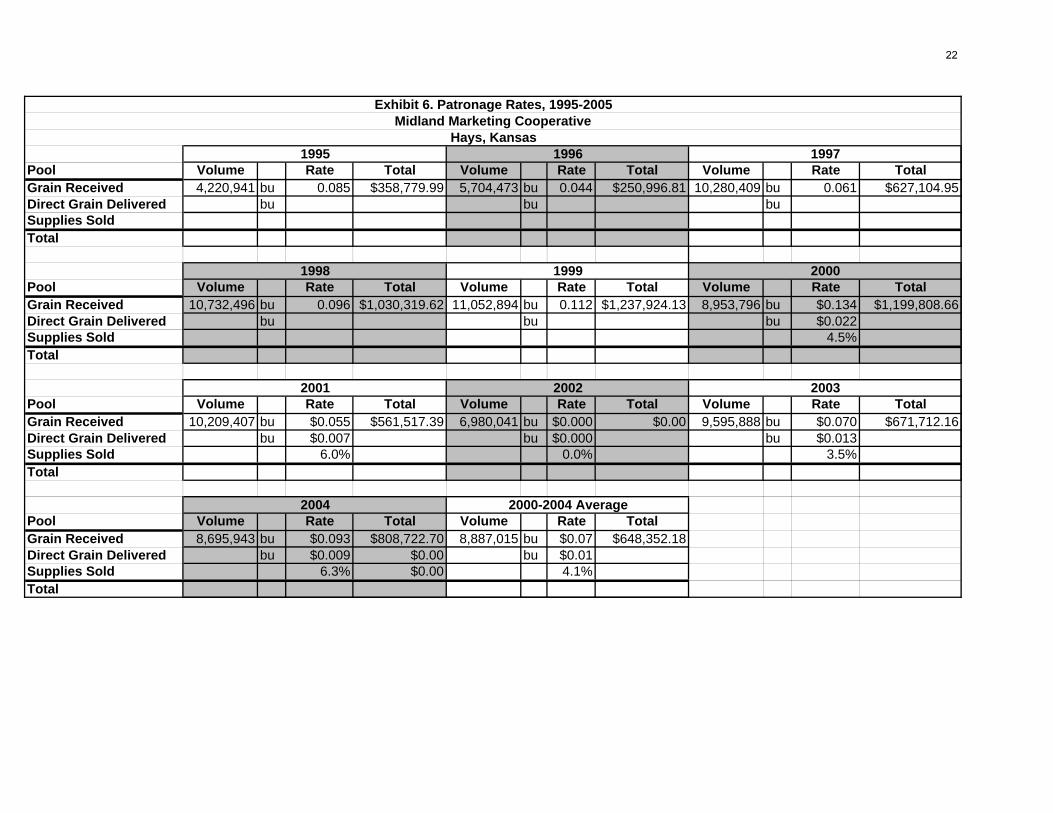
MMC has three patronage pools and their patronage rates per unit of business are relatively high. The overall return on sales in 2004 was 3.9 percent, compared to the typical co-op’s rate of 1.7 percent. MMC has three patronage pools and this resulted in the following 2004 patronage rates by pool: (1) grain receipts, 9.3 cents per bushel, (2) direct grain delivered, 0.9 cents per bushel, and (3) farm supply, 6.3 percent. Since there is no grain storage patronage pool storage income is included in the grain receipts pool. Also, it is deliveries of grain by patrons for sale or storage that is measured, not just sales of grain by the producer to the co-op. Over the five year period, 2000-2004, these rates have averaged (1) 7.0 cents per bushel on grain, (2) 1.0 cents
5
SYMP2006\CaseStudies\MMC-Hays-KS 6 Copyright David G Barton 12/30/2005
per bushel on direct grain, and (3) 4.1 percent on farm supplies, and this included the 2002 year when rates were zero due to the Farmland Industries investment write-down. (See Exhibit 6 for patronage rate information.)
These high per unit rates are also considered a major competitive advantage in their trade area because they can be viewed as an adjustment to the original transaction price. Grain sales to the co-op by producers returned more and farm input purchases from the co-op by producers cost less.
Non-patronage earnings are taxable to the cooperative and are distributed to “Retained Earnings”, net of taxes. They are unallocated equity or undivided earnings and constitute another class of member equity.
Equity management. The two classes of allocated equity, Membership Certificates (MC) and Revolving Fund (RF), are managed using specific investment and redemption policies. Equity investment by producer-owners is obtained entirely from retained patronage refunds. In other words, producer-members are not required to make any cash investment to obtain the profit distribution benefits of doing business with a cooperative.
As noted previously, the first $500 of retained patronage refunds is distributed to MC. MC is only redeemed (re-purchased) by a cash payment to a producer-owner if one of several special circumstances occur, triggering a special redemption, if approved by the board of directors. Special redemptions of MC are made for the following two reasons: (1) estate settlements and (2) special requests. MMC has an unusual provision in their policy that allows any member, regardless of circumstances, to request forfeiture of their voting member status. If approved only their $500 membership investment is redeemed. A non-cash redemption of member equity may be made as a setoff against bad debt, and only as a last resort, such as in the case of the bankruptcy of the member with a court ordered setoff. Bad debt is incurred when an account receivable is not paid by the member. MMC always sues for a judgment before considering a setoff. Therefore, MC is a semi-permanent form of equity investment, redeemable only at the end of the business or member relationship between the member and the co-op.
All retained patronage refunds that are distributed after satisfying the $500 MC requirement for members are distributed to the second class of allocated equity, named “Revolving Fund” (RF). In the case of participating patrons all refunds go to RF. RF may be redeemed under the same special redemption policy as applied to CS. The primary redemption method used is revolving fund. A revolving fund redeems the oldest equity first, based on the year of issue or distribution, or in other words on a first-in, first-out basis.
MMC has a relatively short revolving fund of 8 years or 7 years, depending on how you count years. This relatively short revolving cycle is considered a major competitive advantage in their trade territory with their customers. Following the close of the 2004 year, the RF equity retained from 1996 business. Therefore the unredeemed RF equity was retained from the years, 1997-2004. However, the 2002 year has no equity investment because it was a loss year so there are only 7 years of equity remaining to be redeemed. Special estate settlement redemptions are made on a monthly basis based on approved requests. Cash patronage refunds and revolving fund redemptions are redeemed in March, less than three months following the close of the December 31 (calendar) fiscal year end. (See Exhibit 5 for equity redemption information.)
This combination of income distribution and equity redemption policy means that each patron receives 30 percent of their patronage refunds, their pro rata share of the patronage earnings (profits), as a cash distribution soon after the end of the year and the remaining 70 percent of the patronage refunds as a cash distribution 8 years later. For example, the 2004 grain
6
SYMP2006\CaseStudies\MMC-Hays-KS 7 Copyright David G Barton 12/30/2005
distribution of 9.3 cents is a price adjustment or price increase on grain deliveries by farmer-patrons, distributed in two parts: about a 2.8 cent per bushel cash patronage refund within about two months following the close of the fiscal year and the balance of 9.3 cents or 6.5 cents per bushel 8 years later (or sooner if the revolving cycle shortens in the future).
In any year, the combination of cash patronage refunds and cash equity redemptions will represent a distribution of profits to current and previous patrons. One interesting metric is the percent of a year’s total patronage income that is distributed as cash patronage refunds and cash redemptions of deferred or retained patronage refunds. An ideal might be to average 100 percent since that means patrons are getting all their patronage refunds in cash. Some co-ops try to set an upper limit on payout, such as 50 or 60 percent, but this is not an effective way to manage the balance sheet and cash flow. Most co-ops pay out much less than 100 percent but the most profitable co-ops pay a very high percentage. MMC paid out 53.5 percent in 2004 but averaged 77.7 percent over the five year period, 2000-2004. (See Exhibit 5.)
Competitors and Marketplace
MMC has numerous competitors. Generally speaking, MMC’s biggest competitors are
the six diversified local co-ops whose trade areas are adjacent to MMC’s trade area. They are headquartered in Ellis, Gorham, Osborne, Quinter, Rush Center and Stockton. All have grain, feed, agronomy and petroleum business units. (See Exhibit 1.)
Today MMC has no competitors operating grain or feed facilities in any of the eleven towns where they have facilities. Within their core trade area they have grain competitor locations at Ellis and Paradise. There is very little on-farm grain storage capacity in the trade area so MMC feels they have a competitive advantage because of their eleven country elevators with about 8.6 million bushels of storage. There are four other major grain business competitors outside their trade area: Logan Grain LLC at Logan, the Scoular train loader at Downs, the two Castle Rock Marketing train loaders at Ogallah and Wakeeney, and the U.S. Energy Partners wheat gluten and ethanol plant complex in Russell. MMC is a member-owner in the Castle Rock Marketing LLC joint venture along with Midwest Cooperative of Quinter and Cargill but they view this train loader business as a competitor to their country elevators.
MMC has numerous independent competitors in petroleum-related businesses at all of their locations, especially in Plainville, Hays and LaCrosse.
MMC’s agronomy business has several cooperative and independent competitors throughout its trade area. They include one of Kansas’ largest retailers, Boettcher Enterprises of Beloit, which sells products and provides application services. Other competitors who provide application services include Mid State Farmers Co-op of Rush Center and Pawnee County Cooperative of Larned to the south, Kaiser Ag to the north, and Agriliance to the west. Other major competitors who sell product but don’t provide application services are Sims Fertilizer and Chemical of Osborne and Simpson Farm Enterprises of Ransom. Simpson Farm Enterprises has a location in Hays that sells seed, fertilizer and chemicals following a low margin, high volume strategy. There are also five producers who do significant custom application in the trade area.
MMC has expanded its agronomy application business in the last few years and has become higher service oriented. Major competitors are Boettcher and the co-ops at Gorham (east) and Agriliance (west). However, there are also some solid competitors who follow a high volume, low service, low margin strategy.
7
SYMP2006\CaseStudies\MMC-Hays-KS 8 Copyright David G Barton 12/30/2005
Overall there are at least 18 competing business locations in the counties of Rooks (2), Ellis (4), Rush (5), Ness (3), Osborne (3) and Graham (1). In addition there are the previously mentioned major grain competitors in Trego and Russell counties to the west and east.
Although MMC has many competitors, as described earlier, the CEO has an interesting view of competition. Vance Westhusin said, “My biggest competitor is my own company. I can lose more business with poor service than my competitors can take away from me.”
Leadership: Management and Board
The leadership in the company has been very stable and locally grown for many years at
both the CEO and board level. Vance Westhusin, the current President and General Manager, was hired as the CEO in 1993, almost 13 years ago. Prior to his current position he worked for MMC in his hometown of Plainville as branch manager, in 1990, and as MMC’s operations manager from 1991-1993. Vance is a graduate of Kansas State University with a Bachelor’s degree in Feed Science and Management and a Master’s degree in Grain Science, awarded in 1981 and 1983, respectively. Prior work experience included working for the Wayne Feed division of Continental Grain in both Nebraska and Kentucky from 1983-1989.
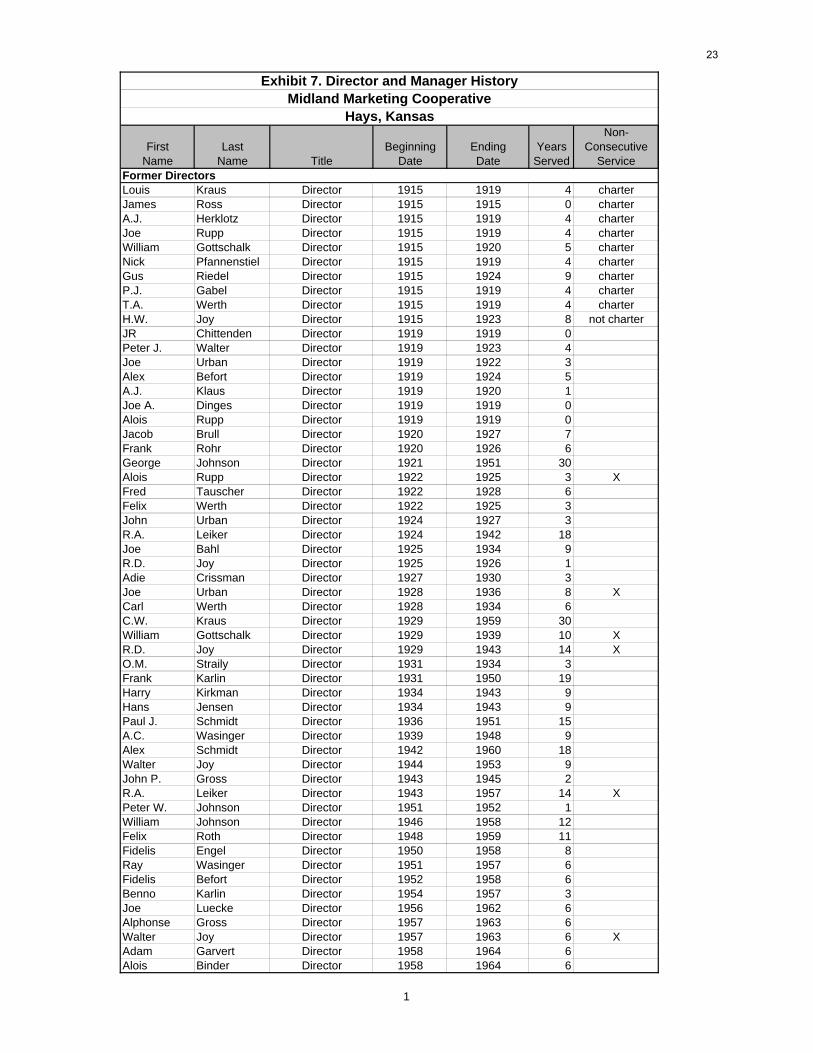
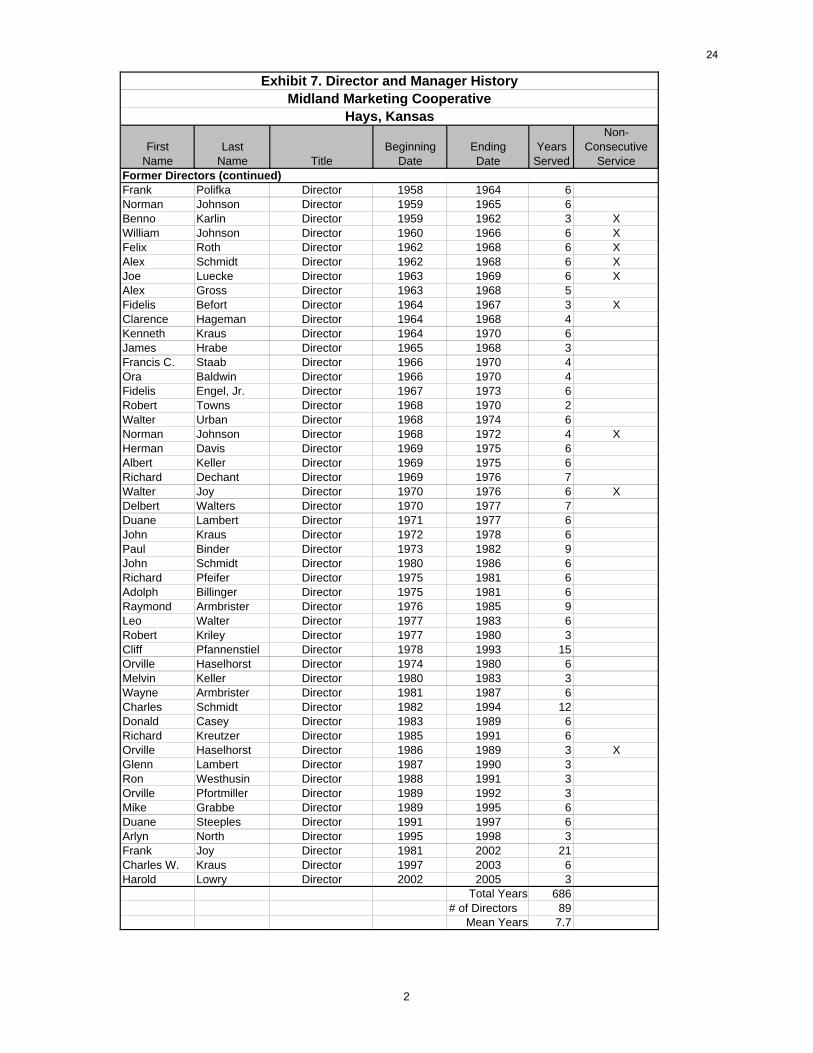
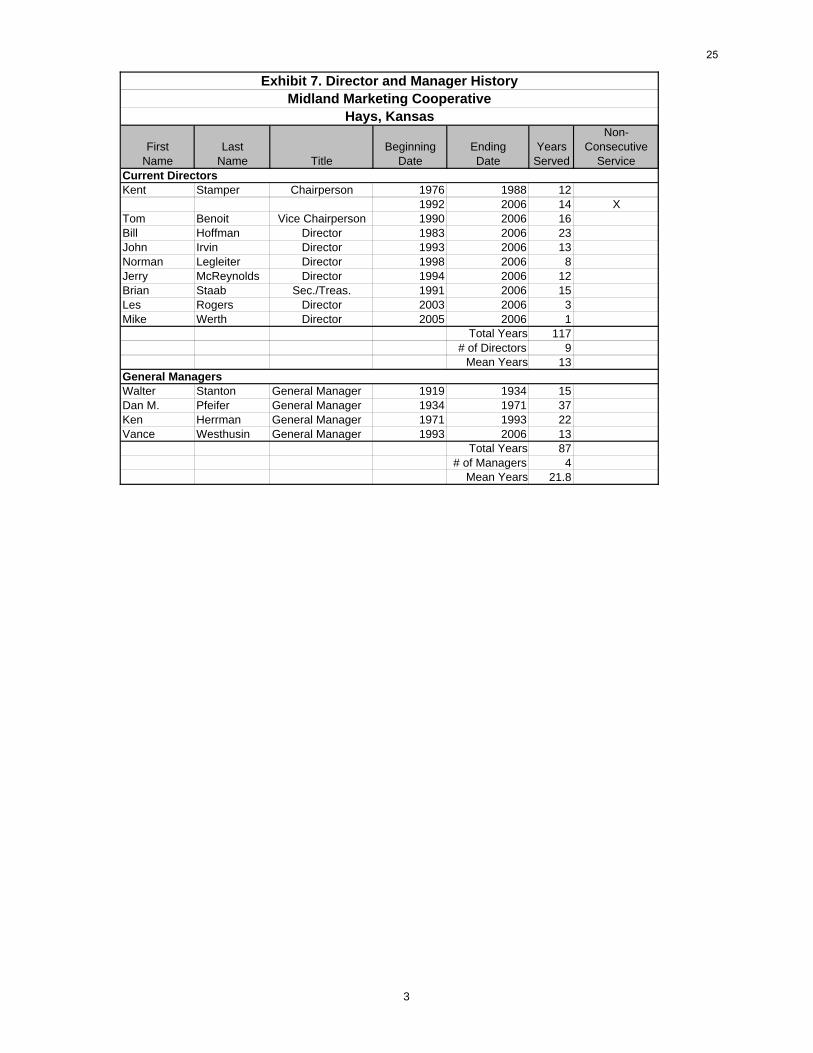
In the 91 year history of the company there have only been four managers. The manager prior to Vance was a well-known cooperative leader, Ken Herrman. He managed MMC for 22 years, from 1971-1993. He also served as a director on the board of Farmland Industries. The two previous managers were Dan Pfeifer (1934-1971, 37 years) and Walter Stanton (1919-1934, 15 years). The average length of service of the three previous managers is 25 years. (See Exhibit 7.)
The first board of directors had nine members, the same size as the current board. The board size has generally remained the same for over 90 years. The board membership has also been stable with relatively low turnover. MMC has director terms of 3 years and does not have limited terms. Incumbents often run unopposed but additional potential candidates are invited to stand for election and do so about 40 percent of the time.
MMC puts a high priority on director training and education and has as high an expectation of performance for directors as they do for employees. They conduct an annual board retreat in which they seriously address strategic issues and get updated on major industry issues by outside experts. Attendance at training sessions, the board retreat and regular board meetings is required. Compensation for directors is $200 per meeting or per day, $100 per day for travel days, and travel expenses. The new associate director program was implemented in 2003.
At least 98 different directors have served on the elected board over 81 years, 1915-2006, so the turnover has been on average, a little more than one director per year. The 89 former directors served an average of 7.7 years with range of service from less than one year (J.R. Chittenden, 1919, and others) to 32 years (R. A. Leiker, 1924-1942 and 1943-1957). The nine current directors have served an average of 13 years with range of service from one year to 26 years. There were 15 directors who went off the board for one or more years and then were elected back on the board, an unusual pattern of service in most co-ops. The current chairperson of the board, Kent Stamper, is one of those directors. He has served a total of 26 years in two segments, 1976-1988 and 1992-2006. MMC recently began an associate director program in which two associate directors are appointed, each with two year terms. This program is expected to be effective in providing successful candidates for open positions in the future. The newest
8
SYMP2006\CaseStudies\MMC-Hays-KS 9 Copyright David G Barton 12/30/2005
member of the current board is the first director to have served as an associate director prior to election.
There has also been stability in the employee positions at both the managerial and front-line level. More information about turnover is provided in the section on talent.
Past Performance: Case Firm and Industry
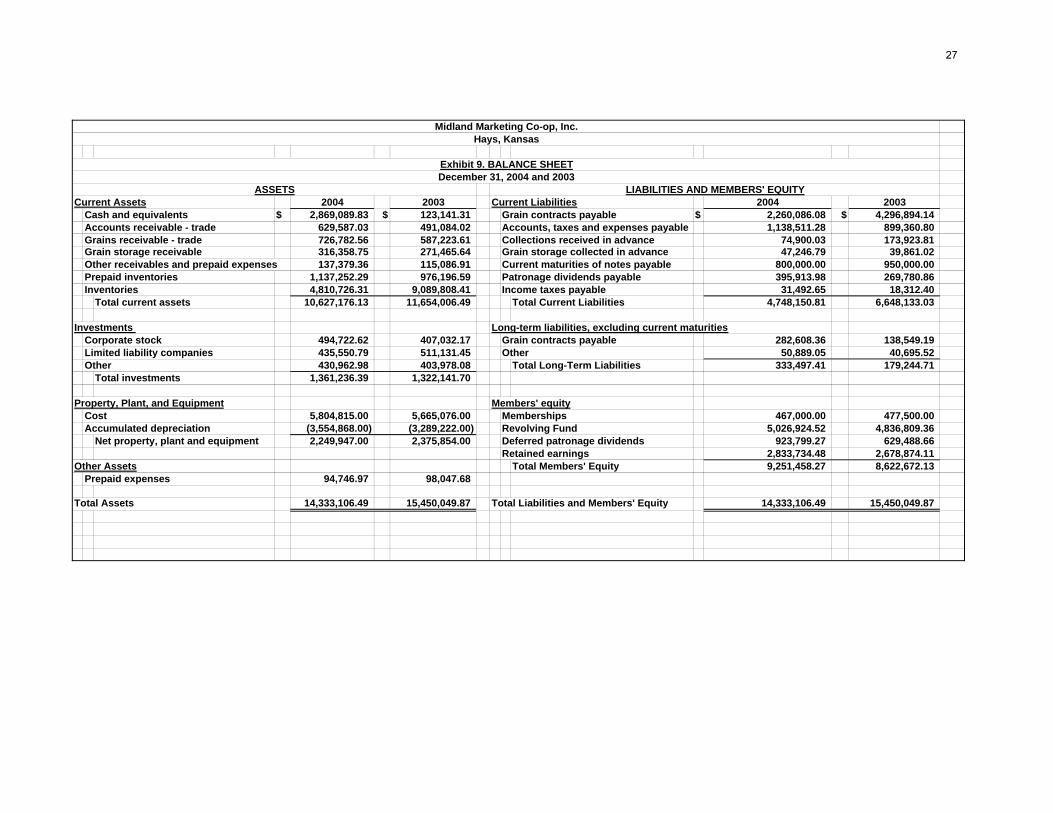
The audited operating statement and balance sheet for fiscal years 2003 and 2004 provide
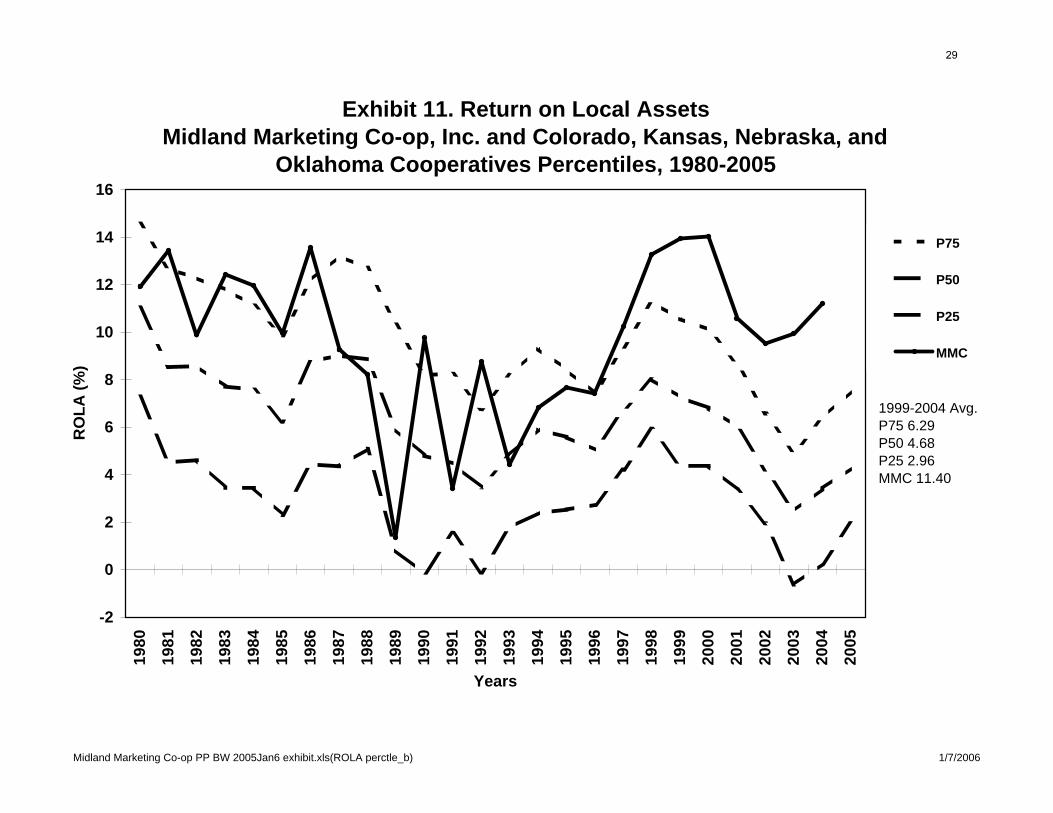
recent performance information. (See Exhibits 8 and 9.) A more comprehensive financial performance profile has been created using this type of information on the case co-op and other peer co-ops over a longer period of time, 1980-2005. (See Exhibits 10-31.) This cooperative performance profile reviews the financial performance of cooperatives in the four states of Nebraska, Kansas, Colorado and Oklahoma for the 26-year time period, 1980-2005, and the performance of the case co-op, Midland Marketing Co-op (MMC), Hays, Kansas. Multiple-year averages are calculated for the multiple-year segments, 1980-85, 1986-88, 1989-92, 1993-95, 1996-1998, and 1999-2005. These multiple year averages are for the “same firms” that appear in all the years in a multiple-year segment. We provide a brief summary of the results and refer to the accompanying Exhibits that document the performance profile. Those interested in more information are invited to contact the author. A description of the data source and analysis is provided at the end of this section. We assume the reader has a basic understanding of financial analysis for cooperative businesses. Performance Profile Overview. The case co-op’s values are reported in a table for each selected measure and on a graph. The tables and graphs compare the performance of the case co-op to itself over time and to the peer co-ops. The percentile information is the most useful way to compare a local's ratios to other cooperatives' ratios and to its own performance in different periods. The percentile results clearly illustrate the ups and downs of the entire industry and the wide variation between the top and bottom performers in the industry. Percentile results will be reported in a short form notation so that performance at the 90th percentile will be reported as P90. If performance is P90 for a profitability measure, like return on equity, it means the case co-op is performing better than 90 percent of the peer co-ops. It is possible for a co-op’s ratio, such as return on equity, to decline from one year to the next but improve its performance relative to the industry. We have selected eleven measures to report. In addition to the standard financial analysis categories of profitability, liquidity, solvency and efficiency a size measure is reported. The primary focus is on the period, 1999-2004. Profitability. Return on local assets, return on equity and return on sales are reported. (See Exhibits 10-15.) MMC’s profitability has recently been at around P95 on these measures. Profitability has improved from a middle of the pack or “good” level in the late 1980s and early 1990s to a top of the pack or “great” level in the mid-1990s and since.
The pricing strategies for the grain and farm supply business units, as reflected in gross margins, are related to profitability. The four-state performance profile suggests that the highest profit co-ops in 1999-2004 tended to have low grain gross margins and moderate to high farm supply gross margins relative to the industry. However, in previous years high profit was associated with higher grain and farm supply gross margins. (See Exhibits 16 and 18). MMC has a grain gross margin of around P40 and a farm supply gross margin of around P60, consistent with the 1999-2004 pattern. (See Exhibits 16-19.)
9
SYMP2006\CaseStudies\MMC-Hays-KS 10 Copyright David G Barton 12/30/2005
Liquidity. The current ratio is reported, since this is the most effective way to compare the liquidity between companies. However, most companies focus more on working capital dollars than ratios when managing liquidity. MMC’s liquidity has been very strong at about P80, a current ratio of about 1.9. There is a very strong desire by the CEO to utilize no significant long-term debt and to see high working capital as the primary source of funds to make cash distributions for fixed asset purchases, cash patronage refund payments and equity redemption payments. (See Exhibits 20-21.) Solvency. The ratio, equity to assets is reported. (See Exhibits 22-23.) MMC’s solvency has been strong at about P70, averaging around 62 percent. It would be much higher when viewed as a debt to equity ratio since MMC has very little long-term debt and has substantial working capital and current assets. Efficiency. Efficiency appears to be the primary driver of profitability in grain marketing and farm supply co-ops. Numerous efficiency measures are important but the ones most important are those related to people productivity and asset utilization. Previous research suggests that the typical local co-op could improve profitability by reducing assets, especially fixed assets, and increasing resources allocated to people in a way that increases overall productivity. This generally means hiring fewer but more talented and productive people, who are more costly per person but provide the most “bang for the buck.” Personnel productivity is measured by the ratio, gross income to personnel costs. This ratio has a very high correlation with profitability. MMC’s ratio has been very high at around 2.80 and P87. In other words, for every dollar spent on personnel they generate $2.80 of gross income. This corresponds to a more common way of expressing the same relationship, the inverse of the ratio as personnel costs to gross income, by saying personnel costs are 36 percent of gross income. This performance is consistent with the CEO’s strategy on people as noted in the section below on strategy. Asset productivity or efficiency is measured by two ratios, gross income to depreciation expense, and sales to net fixed assets, an asset turnover measure. MMC’s gross income to depreciation expense has been around 12.60 and P96, meaning they don’t have high levels of fixed assets generating high depreciation expenses relative to gross income. MMC’s sales to net fixed assets is 15.32 and P96, meaning they generate high levels of sales per dollar tied up in fixed assets. The MMC strategy, which they execute very well, is to work people and assets very hard. Size. It is commonly believed that all businesses improve performance as they increase in size, referred to as economies of size. Our research suggests there isn’t a strong relationship between size and performance over all ranges of sizes for local grain marketing and farm supply co-ops. In fact, the moderate sized co-ops tend to be the most profitable with the smallest the least profitable and the very large, moderately profitable. But there is high variability in profitability for any size group, so many factors other than size influence profitability. Size can be measured in many ways. We used annual sales volume in dollars as the primary measure of size. MMC’s sales were at about $40 million in 2004, putting them at P75. For the last ten years they have been at around P75 even though they have grown from $26 million in 1994 to $30 million in 2004, a 54 percent increase. Their rate of growth appears to be very beneficial, but as the CEO relates in the section on strategy, as the co-op has grown it has been much harder for the CEO to keep track of everything as was common in the past. Data Source and Analysis. Farmland Industries' database of local cooperative financial statements is used as the source of 1980-95 financial performance information and the CoBank
10
SYMP2006\CaseStudies\MMC-Hays-KS 11 Copyright David G Barton 12/30/2005
database is used as the source of 1996-2005 financial performance information. Individual co-ops are not identified from one database to another, so calculations across databases are not possible. All individual firm data is confidential. The identity of each firm in the database is not provided. Individual firm data is extracted or revealed only with a firm's permission. We are grateful to Farmland Industries and CoBank for sharing their databases with K-State for the purpose of conducting research on cooperative finance issues.
A standard financial analysis is utilized. Selected ratios are calculated in four common categories: profitability, liquidity, solvency and efficiency. Ratios are also calculated for a fifth category, product mix, such as grain sales to total sales but are not reported in this report. A sixth category, a measure of size, total sales is also reported. Performance measures for each ratio are reported in three ways for the peer group on a table.
First, the variability from the higher ratios to the lower ratios is reported. Five measures are reported in the "percentile values" section of the tables. They are P95 (95th percentile), P75 (75th percentile or 3rd quartile), P50 or median (middle, 50th percentile or 2nd quartile), P25 (25th percentile or 1st quartile) and P5 (5th percentile). The P25, P50 and P75 values are shown in the accompanying graphs labeled as “Percentiles."
Second, the peer group measures are divided into three groups based on profitability. The profitability groups are high, medium and low. The top 25 percent of cooperatives by profitability is the high group. The middle 50 percent is the medium group and the bottom 25 percent is the low group. An average is calculated for each group. Grouping this way makes it possible to determine which factors are associated with high or low profitability and in what way. The profitability measure used to form profit groups is return on local assets, where returns are local or operational earnings before interest and taxes and local assets are total assets minus investments including regional investments. Third, variability is also reported using a statistical measure, coefficient of variation or CV. CV is a measure of relative dispersion. It is calculated as the standard deviation of the values in a group divided by the mean or average of the values and then multiplied by 100 to convert it to a percentage. The mean and the CV are reported in the profit group portion of the tables. The CV allows us to compare the variability of a measure, such as return on local assets, between different years, such as 1980 and 1990. It also allows us to compare the variability of two or more different measures, such as return on local assets and return on equity.
Performance measures for the case co-op are calculated for the same measures as used in the percentile and profit groups. Both a value and a percentile are provided for the case co-op in the tables. The tables provide profit group and percentile information on financial measures for the years 1980-2005, and multiple year averages noted above.
Multiple-year averages are calculated using only those firms that are in the database for all the years used in the multi-year average. Co-ops are identified only by an identification number in the two separate databases, making it difficult to match the data with specific co-ops. Therefore, we cannot identify each co-op’s financial information over the entire range of years, 1980-2005.
SYMP2006\CaseStudies\MMC-Hays-KS 12 Copyright David G Barton 12/30/2005
Internal Performance Factors A recent Harvard University study identified eight factors that lead to high business
performance. These factors provide a useful framework for categorizing the philosophy and practices of MMC. The study, published in the Harvard Business Review in July 2003, was entitled “What Really Works.” The authors (Nohnia, et al.) evaluated 200 different management practices in 160 different companies over a 10 year period. Their primary conclusions are that business basics matter and that successful businesses generally follow a “4 +2” formula for success. The first four are primary practices that virtually all successful companies excelled at. They are practices related to strategy, execution, culture and structure. The second four are secondary practices and successful companies excelled in at least two of the four. They are practices related to talent, innovation, leadership and external relationships, including mergers and partnerships. A brief description of each practice is provided along with some information about how MMC views their behavior related to the practice.
Strategy. Strategy involves the formation of a vision and mission by the leadership team as well as the creation of additional more specific strategies. The Harvard study found that the most important practice was the communication of a clear and obvious value proposition to the customer.
MMC has expressed the broadest view of their strategy in three types of statements: a vision, a mission and a motto. Their vision is “To be the first choice of our customers and our employees.” Their mission is “To profitably provide quality products and services that help our customers succeed.” Their motto is “Your business is our business.” The primary guiding philosophy of the organization, as stated by the CEO, Vance Westhusin, is “We live the vision. Everything we do connects to our vision.” As farm programs changed and producers shifted to more acres in fall crops and fewer in wheat, including less summer fallow, MMC decided to shift with their customers by shifting the agronomy operations to serve the needs of their customers. They moved to grow the business in both grain and agronomy by investing in a higher service agronomy business that included more assets and people to provide application and other services.
MMC’s operational strategy, as stated by their CEO, is … “to have good people but to work the assets and people hard. For example, instead of covering 20,000 acres per year per RoGator application unit we try to get 40,000 acres. We can afford more machines, I just don’t want more.” In terms of day-to-day supervisory philosophy, their CEO says, “I try to know as much as possible, every day, on all parts of the business. I see all the mail and approve all the bills and payments. All purchases over $50 need my prior approval. All complaints by customers or employees have to be documented within 24 hours of their occurrence. I don’t like surprises. But as we’ve gotten bigger it is harder to keep track of everything.”
MMC’s marketing strategy with respect to pricing is to be competitive. As their CEO observes, “We don’t try to have the best price or the worst price. People tell me we are usually the price leader.”
MMC’s asset investment strategy is to be very frugal. Asset utilization or turnover ratios are expected to be very high. As noted in the section on past performance, the average efficiency ratio, sales to net fixed assets, for 1999-2004 was 15.32 placing MMC in the 96th percentile on net fixed asset utilization or turnover. This compares to the typical or 50th percentile ratio of 7.53. Vance Westhusin expressed his philosophy this way: “I want fewer assets than I really need.”
SYMP2006\CaseStudies\MMC-Hays-KS 13 Copyright David G Barton 12/30/2005
Execution. Execution requires a company to align on its primary strategies and to be disciplined enough to implement those strategies including accomplishing its value proposition to customers and implementing its operating philosophy. The Harvard study found that the most important practice was to delegate to the lowest level possible. In general, the keys to execution are to (1) follow a strategy that aligns on customers, (2) manage people in a way that aligns people with customers and strategy, and (3) manage operations by aligning assets and processes with customers, strategy and people.
MMC aligns its operations on its vision and mission, especially its customers, its employees and its company profitability. As Vance says, “We are disciplined on the follow-through. We execute.”
Culture. Each company has a culture that is influenced by many factors, many of them external and out of the control of the company. The Harvard study found that the most important cultural practice under the control of the company was to create a climate of high expectations.
Vance has high expectations of himself and the employees. He admits, “I expect our employees to do more with less, such as with our agronomy application equipment. And I don’t want to give things away. Also, I push the idea of ‘No mistakes.’ Mistakes really irritate me and our people know that.”
Structure. Structure is related to organizational structure and the relationships and processes of how people work and communicate within the organization. The Harvard study found that simple structures were best in combination with open and sharing communication. The study also found that the best people should be close to the action. This implies a very flat organizational structure in which the CEO and other supervisors tend to have a relatively large number of people reporting to them in combination with the employment of fewer but relatively talented people so that delegation can be made to the lowest level possible, as suggested by the execution factor findings.
MMC is viewed by its CEO as a company with a flexible, changing structure. Today there are 45 employees and the CEO has 7 direct reports. Three are area managers over operations, and the others are department managers including crop production, grain merchandising with significant strategy input from the CEO, office management including accounting and maintenance management. Employees are generally assigned to locations and the various departments are expected to share those employees in a flexible, effective way.
Talent. The talent factor looks at the quantity and quality of people employed by the company but can also include the use of contractual services from outside suppliers of talent. The Harvard study found that the most important practice was to recruit the best people possible and to train and develop people.
MMC’s strategy has been to hire the best people available at the entry level, to retain them by helping them grow and develop and to reward performance, according to their CEO. It is getting harder to recruit and retain employees, especially at the more rural locations. Overall, turnover is expected to be about 20 percent annually or around 10 employees each year from all levels combined. In 2005 MMC hired nine new employees and has hired 25 new people in the last five years. There is good stability at the department manager level. The years of tenure of the seven direct reports are: Three area managers, 1, 5 and 27; crop production, 14; grain merchandising, 2; office manager, 7; and maintenance manager, 20. This is an average of about 11 years.
Innovation. Innovation includes developing new products and services as well as creating new and better ways of doing things. The Harvard study found that the most important
SYMP2006\CaseStudies\MMC-Hays-KS 14 Copyright David G Barton 12/30/2005
practices were to develop new products and new methods as well as to anticipate and prepare for disruptive events. Most local co-ops do not focus on developing new products and services although they do focus on adding new products and services that are desired by customers.
MMC focuses on trying to anticipate employee turnover and having people trained to take over when needed. Cross-training is used as much as possible to minimize hiring of extra people that may not be fully utilized.
Leadership. The leadership factor focuses on the selection and development of directors as individuals and the functioning of the board as a policy making unit and the selection of the CEO as well as the relationship between the board and CEO. The Harvard study found that the most important practices were to select a great CEO, to link pay and performance and to choose directors who have a stake in the company. For a cooperative, the challenge in director selection is to be successful in getting the most talented and capable members to stand for election and get elected.
The current board chairperson, Kent Stamper, has served on the board for a total of 26 years, longer that any other sitting director. His service has been broken into two segments, 1976-88, and 1992-2006. He has also served as a director on two different regional cooperative boards, Union Equity and Farmland Industries. During his 26 years of service he has been elected by the board to serve as the chief board officer (president, chairman or chairperson) for a total of 20 years, not all of them contiguous.
Kent believes the foundation for MMC’s success has been an outstanding board and their ability to hire and retain a high performing CEO. The board has established a compensation system that links CEO pay with performance. And they have maintained a very close working relationship with the CEO that focuses primarily on strategic issues. As Kent notes, “We believe in the strategic planning part of our responsibilities. We look at issues in a 3 to 5 year time frame and try to understand what will impact the membership and the co-op in the future. We do not spend a lot of time discussing past history and past numbers. And we believe our CEO executes our business plan very well.”
A major strategic focus by the board has been on building a strong board with very capable directors. Kent describes their strategy as having four components: recruitment, retention, education and expected participation and support. In terms of recruitment, MMC uses a nominating committee that aggressively looks for good candidates and describes the high expectations they have for directors. As was noted in the previous section on leadership by management and the board, MMC started an associate director program in 2003 and now has its first elected director as a previous participant in that program. In terms of retention, the co-op does not have term limits. Education and development of directors is strongly encouraged. Their policy is that new directors must attend the complete the Kansas Cooperative Council’s four course Director Development Program and all directors are encouraged to attend other important industry meetings as a way of improving themselves.
Perhaps the biggest on-going focus for the board is to stress participation in board activities and stress supporting the co-op with not only their time but their business. Kent said, “We have annual board retreats for 2-3 days and we have monthly board meetings. Attendance at these meetings is required.” And they stress that directors should do as much business as possible with the co-op. According to Kent, “We have only had one director in my 26 years on the board that I remember we ever had to visit with about supporting the co-op with their farm business.”
The board is careful to build strong support for major strategic decisions before moving ahead. In looking back, Kent said they have developed a working philosophy on decision
SYMP2006\CaseStudies\MMC-Hays-KS 15 Copyright David G Barton 12/30/2005
making. “We have found if there is not a strong majority supporting a strategy we just don’t do it. We generally get a unanimous vote on key issues but if we don’t get strong support we wait and rethink the strategy.”
The board is very aware of MMC’s past success but they are always looking at new possibilities to improve. They value their customers as reflected in their vision statement and they pay attention to customer requests, according to their board chairperson. The board and CEO believe in retaining good employees.
The CEO reports that pay is linked to performance for the CEO and for the employees, a policy supported by the board for all employees and a policy directly implemented by the board in the case of the CEO’s compensation. However, Vance Westhusin sees pay to the CEO as broader than financial compensation. He stated, “I don’t see my financial pay as a major issue. The biggest factor for me is board support and dedication.”
With respect to employee pay, the CEO says MMC tries to be competitive on wages but expects high performance. Bonuses are paid to employees. But performance is also measured in terms of the personnel costs as a percent of gross income with a target of being below 40 percent (or a gross income to personnel cost ratio of 2.5 or higher). As noted in the previous section on past performance, the gross income to personnel cost ratio averaged 2.81 for the years 1999-2004, putting MMC at the 87th percentile. A strong effort is made to keep personnel costs low. Wages of frontline people are based on the local market. Department manager compensation is based more on the broader agribusiness market for comparable skills. According to the CEO, MMC is about in the middle of the pack to the top one-fourth for compensation for the department manager people, given the company’s size, based on the CHS/LOL Member Services compensation survey information.
External relationships. External relationships range from ownership in other businesses such as regional co-ops and joint ventures that are suppliers and buyers, to contractual or open market, buy-sell business with producer-customers, suppliers like Agriliance and CHS-Cenex, and buyers like DeBruce Grain or Scoular Company, to communication with neighboring competitors, including other similar cooperative and independent (“investor-oriented”) retail businesses. The Harvard study found that two important practices, when considering mergers or other partnerships, was the ability to leverage existing customer relationships with business partners, and to build on the strengths of the partners when forming any kind of formal business relationship.
MMC is an investor in and customer of several regional co-ops including CHS, Land O’Lakes, Midwest Energy and FCStone (Farmers Commodity Corporation), as are most local co-ops in the Midwestern States. MMC is also an investor in other joint venture companies, formed as LLCs. The primary one is their 30 percent ownership of Westland Terminal LLC, a joint venture company that owns the grain train loader at Ogallah. In turn, Westland is part of the Castle Rock Marketing joint venture with Cargill that operates the Ogallah and Wakeeney train loaders.
MMC has been very active in participating in various joint ventures in their area that are related to their primary business lines of grain, agronomy and petroleum. As is the case with many local co-op investments in joint ventures, the results have been mixed. Also, the CEO has focused a lot of time in developing relationships with other stakeholders in the industry.
SYMP2006\CaseStudies\MMC-Hays-KS 16 Copyright David G Barton 12/30/2005
Discussion Questions 1. Why do you think Midland Marketing Co-op is so profitable? List up to five reasons
(or factors) and then rank them. 2. What changes in strategy do you think Midland Marketing Co-op could make to improve performance? List up to three changes and rank them. 3. Given what you’ve learned about Midland Marketing Co-op and what you know about other high performance co-ops or other businesses, what changes can your co-op make (or co-ops in general make) to improve performance? List up to three changes and rank them.
Copyright © 1988-2004 Microsoft Corp. and/or its suppliers. All rights reserved. http://www.microsoft.com/streets/© Copyright 2003 by Geographic Data Technology, Inc. All rights reserved. © 2004 NAVTEQ. All rights reserved. This data includes information taken with permission from Canadian authorities © Her Majesty the Queen in Right of Canada.
Exhibit 1. Midland Marketing Co-op, Trade area, Locations and Competitors
0 mi 10 20 30 40 50
PushpinsMidland Marketing Co-op, Inc. (Hays)
Midland Marketing Co-op BranchesGolden Belt Co-op Assn., Inc. (Ellis)Simpson Farm Enterprises (Ransom)
Pawnee County Coop. (Larned)Logan Grain, LLCThe Scoular Company (Downs)
Midway Co-op Assn. (Osborne)Castle Rock Marketing, LLC (Wakeeney)Star Seed Inc. (Osborne)
Mid State Farmers Co-op (Rush Center)Farmers Union Merc. & Shpg. Assn. (Stockton)United Ag Service, Inc. (Gorham)Paradise Grain Company
17
, Exhibit 2. Average County Crop Production 1999-2004 (million bushels)
Republic
1.2164
1.52684
1.76055
1.52259
3.70277
0.499675
3.98591
2.2023
0.395258
0.124826 2.21411
2.07887
0.839833
2.64597
2.81777
1.37259
0.8367551.92243
1.58456
2.04234
2.95907
3.70384
1.06889
4.26051
0.262639
1.53009
1.59133
6.14462
4.73784
1.21696
0.533025
2.5108
1.90812
3.98734
6.35999
2.23085
0.453017
2.13672
2.63212
3.44257
6.67657
1.64606
1.0414
1.33333
2.93484
0.545261
3.32565
2.586122.17007
1.49062
1.6653
0.736887
1.7862
0.712667
1.88738
1.126122.94294
3.79492
4.55129
4.93991
0.778183
3.26797
1.12062
0.906354
2.08252
2.82879
1.1836
2.00857
2.03328
1.26843
2.12874
1.91929
3.24503
1.74088
1.30185
4.69848
2.51037
4.66475
3.99417
3.71806
0.9971671.56862
1.80814
1.55678
2.18341
3.72559
4.11625
3.6288
1.33048
4.655494.1745
2.50622
4.26574
4.9342
6.174355.49008
5.73258
1.702860.740663
2.50261
3.33046
3.16653
1.48056
0.811171
0.11226
Allen
Anderson
Atchison
Barber
Barton
Bourbon
Brown
Butler
Chase
Chautauqua Cherokee
Cheyenne
Clark
Clay
Cloud
Coffey
ComancheCowley
Crawford
Decatur
Dickinson
Doniphan
Douglas
Edwards
Elk
Ellis
Ellsworth
Finney
Ford
Franklin
Geary
Gove
Graham
Grant
Gray
Greeley
Greenwood
Hamilton
Harper
Harvey
Haskell
Hodgeman
Jackson
Jefferson
Jewell
Johnson
Kearny
KingmanKiowa
Labette
Lane
Leavenworth
Lincoln
Linn
Logan
LyonMcPherson
Marion
Marshall
Meade
Miami
Mitchell
Montgomery
Morris
Morton
Nemaha
Neosho
Ness
Norton
Osage
Osborne
Ottawa
Pawnee
Phillips
Pottawatomie
Pratt
Rawlins
Reno
Rice
RileyRooks
Rush
Russell
Saline
Scott
Sedgwick
Seward
Shawnee
SheridanSherman
Smith
Stafford
Stanton
StevensSumner
Thomas
TregoWabaunsee
Wallace
Washington
Wichita
Wilson
Woodson
Wyandotte
18
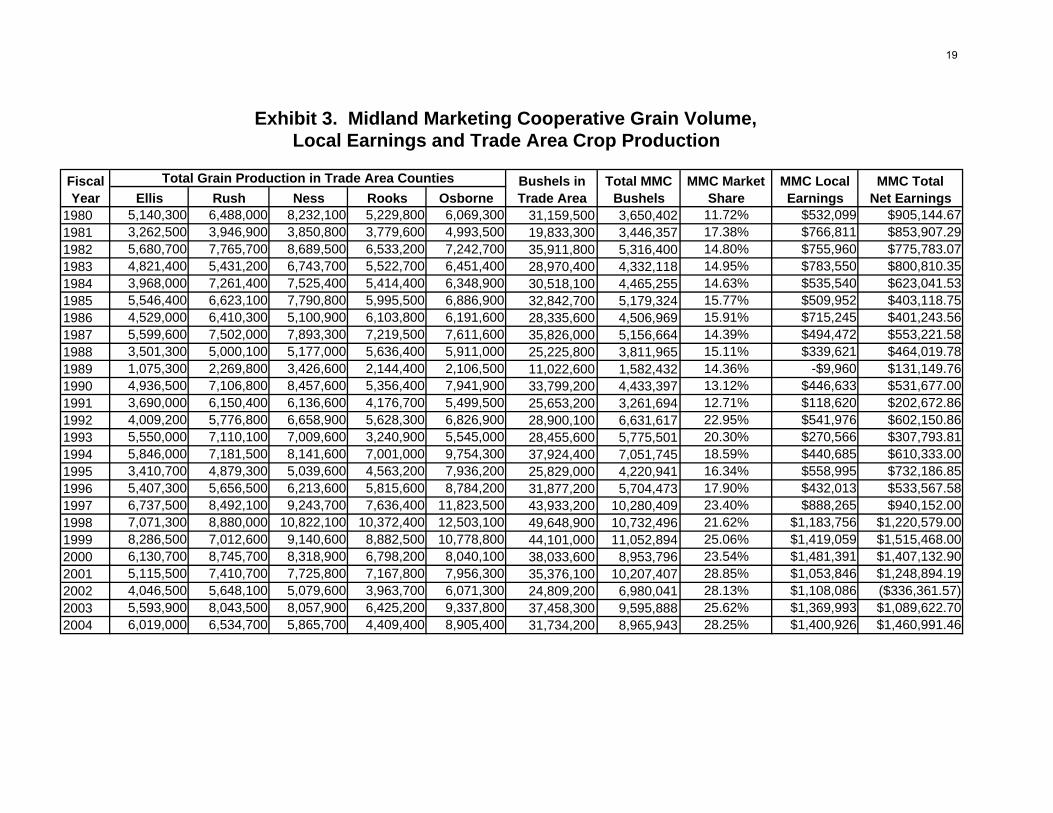
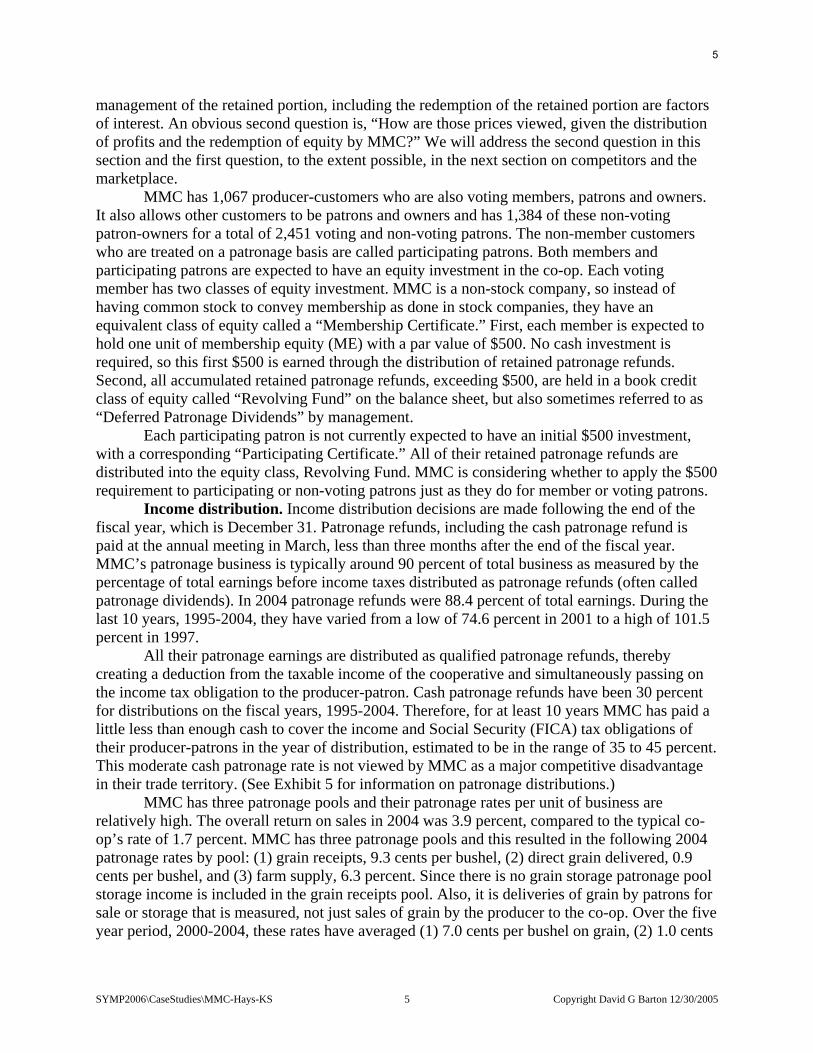
Ellis Rush Ness Rooks Osborne1980 5,140,300 6,488,000 8,232,100 5,229,800 6,069,300 31,159,500 3,650,402 11.72% $532,099 $905,144.671981 3,262,500 3,946,900 3,850,800 3,779,600 4,993,500 19,833,300 3,446,357 17.38% $766,811 $853,907.291982 5,680,700 7,765,700 8,689,500 6,533,200 7,242,700 35,911,800 5,316,400 14.80% $755,960 $775,783.071983 4,821,400 5,431,200 6,743,700 5,522,700 6,451,400 28,970,400 4,332,118 14.95% $783,550 $800,810.351984 3,968,000 7,261,400 7,525,400 5,414,400 6,348,900 30,518,100 4,465,255 14.63% $535,540 $623,041.531985 5,546,400 6,623,100 7,790,800 5,995,500 6,886,900 32,842,700 5,179,324 15.77% $509,952 $403,118.751986 4,529,000 6,410,300 5,100,900 6,103,800 6,191,600 28,335,600 4,506,969 15.91% $715,245 $401,243.561987 5,599,600 7,502,000 7,893,300 7,219,500 7,611,600 35,826,000 5,156,664 14.39% $494,472 $553,221.581988 3,501,300 5,000,100 5,177,000 5,636,400 5,911,000 25,225,800 3,811,965 15.11% $339,621 $464,019.781989 1,075,300 2,269,800 3,426,600 2,144,400 2,106,500 11,022,600 1,582,432 14.36% -$9,960 $131,149.761990 4,936,500 7,106,800 8,457,600 5,356,400 7,941,900 33,799,200 4,433,397 13.12% $446,633 $531,677.001991 3,690,000 6,150,400 6,136,600 4,176,700 5,499,500 25,653,200 3,261,694 12.71% $118,620 $202,672.861992 4,009,200 5,776,800 6,658,900 5,628,300 6,826,900 28,900,100 6,631,617 22.95% $541,976 $602,150.861993 5,550,000 7,110,100 7,009,600 3,240,900 5,545,000 28,455,600 5,775,501 20.30% $270,566 $307,793.811994 5,846,000 7,181,500 8,141,600 7,001,000 9,754,300 37,924,400 7,051,745 18.59% $440,685 $610,333.001995 3,410,700 4,879,300 5,039,600 4,563,200 7,936,200 25,829,000 4,220,941 16.34% $558,995 $732,186.851996 5,407,300 5,656,500 6,213,600 5,815,600 8,784,200 31,877,200 5,704,473 17.90% $432,013 $533,567.581997 6,737,500 8,492,100 9,243,700 7,636,400 11,823,500 43,933,200 10,280,409 23.40% $888,265 $940,152.001998 7,071,300 8,880,000 10,822,100 10,372,400 12,503,100 49,648,900 10,732,496 21.62% $1,183,756 $1,220,579.001999 8,286,500 7,012,600 9,140,600 8,882,500 10,778,800 44,101,000 11,052,894 25.06% $1,419,059 $1,515,468.002000 6,130,700 8,745,700 8,318,900 6,798,200 8,040,100 38,033,600 8,953,796 23.54% $1,481,391 $1,407,132.902001 5,115,500 7,410,700 7,725,800 7,167,800 7,956,300 35,376,100 10,207,407 28.85% $1,053,846 $1,248,894.192002 4,046,500 5,648,100 5,079,600 3,963,700 6,071,300 24,809,200 6,980,041 28.13% $1,108,086 ($336,361.57)2003 5,593,900 8,043,500 8,057,900 6,425,200 9,337,800 37,458,300 9,595,888 25.62% $1,369,993 $1,089,622.702004 6,019,000 6,534,700 5,865,700 4,409,400 8,905,400 31,734,200 8,965,943 28.25% $1,400,926 $1,460,991.46
MMC Total Net Earnings
Fiscal Year
Total Grain Production in Trade Area Counties
Exhibit 3. Midland Marketing Cooperative Grain Volume, Local Earnings and Trade Area Crop Production
Bushels in Trade Area
Total MMC Bushels
MMC MarketShare
MMC Local Earnings
19
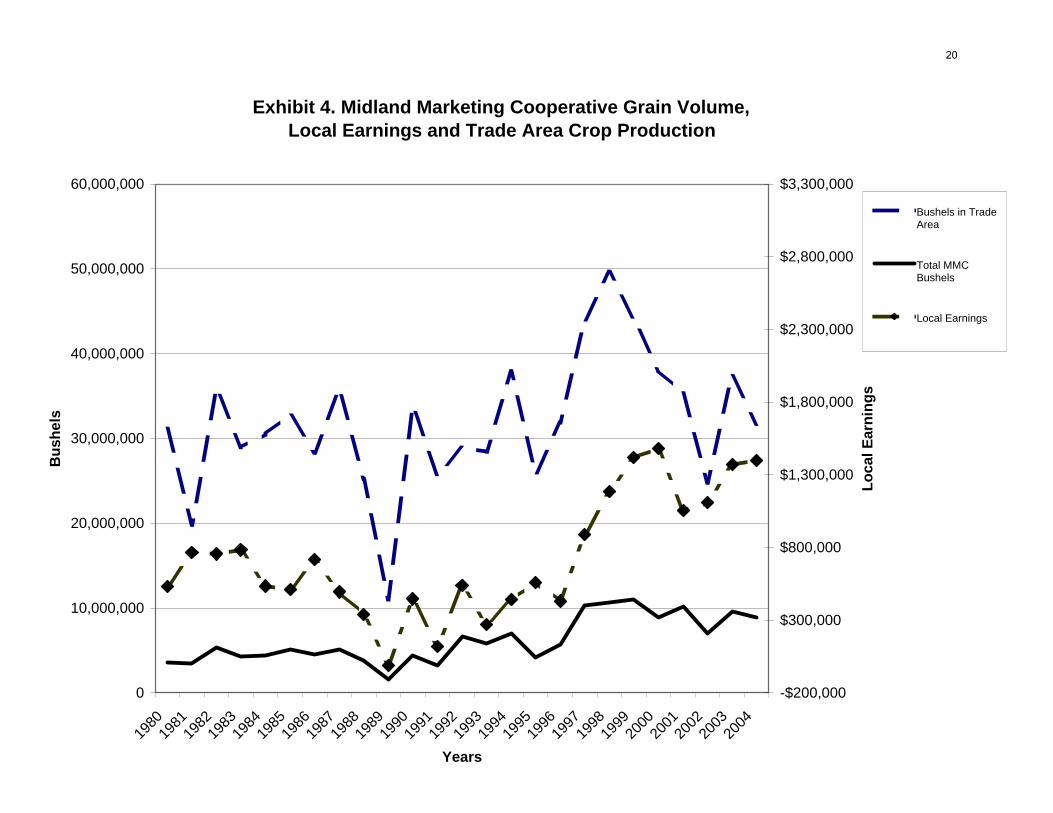
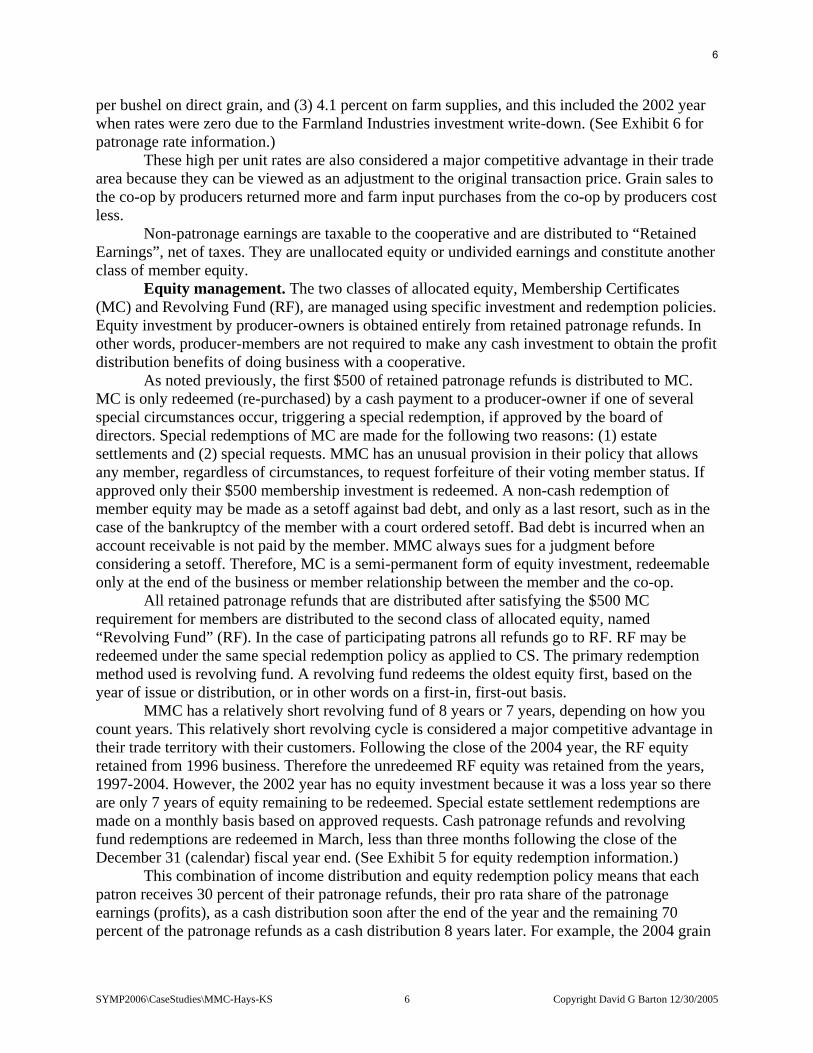
Exhibit 4. Midland Marketing Cooperative Grain Volume, Local Earnings and Trade Area Crop Production
0
10,000,000
20,000,000
30,000,000
40,000,000
50,000,000
60,000,000
1980
1981
1982
1983
1984
1985
1986
1987
1988
1989
1990
1991
1992
1993
1994
1995
1996
1997
1998
1999
2000
2001
2002
2003
2004
Years
Bus
hels
-$200,000
$300,000
$800,000
$1,300,000
$1,800,000
$2,300,000
$2,800,000
$3,300,000
Loca
l Ear
ning
s
Bushels in TradeArea
Total MMC Bushels
Local Earnings
20
1995 1996 1997 1998 1999 2000 2001 2002 2003 2004Avg.
2000-2004Patronage Refunds ($)
Cash Rate (%) 30% 30% 30% 30% 30% 30% 30% 0% 30% 30% 30%Cash Refunds $189,607 $154,263 $274,891 $342,050 $401,657 $408,413 $286,023 $0 $269,780 $395,914 $272,026Retained Refunds $442,417 $359,947 $641,413 $798,118 $937,200 $952,964 $667,388 $0 $629,490 $923,799 $634,728
Total $632,024 $514,210 $916,305 $1,140,168 $1,338,858 $1,361,377 $953,411 $0 $899,270 $1,319,713 $906,754
Earnings Before Taxes $756,730 $536,568 $903,118 $1,220,579 $1,543,980 $1,452,524 $1,277,905 -$352,998 $1,102,602 $1,492,386 $994,484Patronage Percent 83.5% 95.8% 101.5% 93.4% 86.7% 93.7% 74.6% 81.6% 88.4% 91.2%
Equity RedemptionsSpecials (Est. & Ret.)Revolving Fund
Total $200,590 $275,564 $202,322 $320,316 $535,579 $643,643 $682,080 $314,307 $214,550 $436,418 $458,200
Total Cash Payment $390,197 $429,827 $477,214 $662,366 $937,236 $1,052,056 $968,104 $314,307 $484,330 $706,198 $704,999
Cash Payout % of Patronage Refunds 61.7% 83.6% 52.1% 58.1% 70.0% 77.3% 101.5% 53.9% 53.5% 77.7%
Retained Patronage Refunds19861987198819891990199119921993199419951996 275,090.791997 579,057.021998 711,457.661999 859,012.992000 893,382.642001 644,937.5920022003 611,791.012004 922,869.942005Total $0 $0 $0 $0 $0 $0 $0 $0 $5,497,599.64
Exhibit 5. Patronage Refunds and Equity Redemptions, 1995-2005Midland Marketing Cooperative
Hays, Kansas
21
Pool Volume Rate Total Volume Rate Total Volume Rate TotalGrain Received 4,220,941 bu 0.085 $358,779.99 5,704,473 bu 0.044 $250,996.81 10,280,409 bu 0.061 $627,104.95Direct Grain Delivered bu bu buSupplies SoldTotal
Pool Volume Rate Total Volume Rate Total Volume Rate TotalGrain Received 10,732,496 bu 0.096 $1,030,319.62 11,052,894 bu 0.112 $1,237,924.13 8,953,796 bu $0.134 $1,199,808.66Direct Grain Delivered bu bu bu $0.022Supplies Sold 4.5%Total
Pool Volume Rate Total Volume Rate Total Volume Rate TotalGrain Received 10,209,407 bu $0.055 $561,517.39 6,980,041 bu $0.000 $0.00 9,595,888 bu $0.070 $671,712.16Direct Grain Delivered bu $0.007 bu $0.000 bu $0.013Supplies Sold 6.0% 0.0% 3.5%Total
Pool Volume Rate Total Volume Rate TotalGrain Received 8,695,943 bu $0.093 $808,722.70 8,887,015 bu $0.07 $648,352.18Direct Grain Delivered bu $0.009 $0.00 bu $0.01Supplies Sold 6.3% $0.00 4.1%Total
Exhibit 6. Patronage Rates, 1995-2005Midland Marketing Cooperative
1998 1999
1995 1996Hays, Kansas
2004 2000-2004 Average
1997
2000
20032001 2002
22
First Name
Last Name Title
Beginning Date
Ending Date
Years Served
Non-Consecutive
Service
Louis Kraus Director 1915 1919 4 charterJames Ross Director 1915 1915 0 charterA.J. Herklotz Director 1915 1919 4 charterJoe Rupp Director 1915 1919 4 charterWilliam Gottschalk Director 1915 1920 5 charterNick Pfannenstiel Director 1915 1919 4 charterGus Riedel Director 1915 1924 9 charterP.J. Gabel Director 1915 1919 4 charterT.A. Werth Director 1915 1919 4 charterH.W. Joy Director 1915 1923 8 not charterJR Chittenden Director 1919 1919 0Peter J. Walter Director 1919 1923 4Joe Urban Director 1919 1922 3Alex Befort Director 1919 1924 5A.J. Klaus Director 1919 1920 1Joe A. Dinges Director 1919 1919 0Alois Rupp Director 1919 1919 0Jacob Brull Director 1920 1927 7Frank Rohr Director 1920 1926 6George Johnson Director 1921 1951 30Alois Rupp Director 1922 1925 3 XFred Tauscher Director 1922 1928 6Felix Werth Director 1922 1925 3John Urban Director 1924 1927 3R.A. Leiker Director 1924 1942 18Joe Bahl Director 1925 1934 9R.D. Joy Director 1925 1926 1Adie Crissman Director 1927 1930 3Joe Urban Director 1928 1936 8 XCarl Werth Director 1928 1934 6C.W. Kraus Director 1929 1959 30William Gottschalk Director 1929 1939 10 XR.D. Joy Director 1929 1943 14 XO.M. Straily Director 1931 1934 3Frank Karlin Director 1931 1950 19Harry Kirkman Director 1934 1943 9Hans Jensen Director 1934 1943 9Paul J. Schmidt Director 1936 1951 15A.C. Wasinger Director 1939 1948 9Alex Schmidt Director 1942 1960 18Walter Joy Director 1944 1953 9John P. Gross Director 1943 1945 2R.A. Leiker Director 1943 1957 14 XPeter W. Johnson Director 1951 1952 1William Johnson Director 1946 1958 12Felix Roth Director 1948 1959 11Fidelis Engel Director 1950 1958 8Ray Wasinger Director 1951 1957 6Fidelis Befort Director 1952 1958 6Benno Karlin Director 1954 1957 3Joe Luecke Director 1956 1962 6Alphonse Gross Director 1957 1963 6Walter Joy Director 1957 1963 6 XAdam Garvert Director 1958 1964 6Alois Binder Director 1958 1964 6
Midland Marketing CooperativeExhibit 7. Director and Manager History
Hays, Kansas
Former Directors
1
23
First Name
Last Name Title
Beginning Date
Ending Date
Years Served
Non-Consecutive
Service
Midland Marketing CooperativeExhibit 7. Director and Manager History
Hays, Kansas
Frank Polifka Director 1958 1964 6Norman Johnson Director 1959 1965 6Benno Karlin Director 1959 1962 3 XWilliam Johnson Director 1960 1966 6 XFelix Roth Director 1962 1968 6 XAlex Schmidt Director 1962 1968 6 XJoe Luecke Director 1963 1969 6 XAlex Gross Director 1963 1968 5Fidelis Befort Director 1964 1967 3 XClarence Hageman Director 1964 1968 4Kenneth Kraus Director 1964 1970 6James Hrabe Director 1965 1968 3Francis C. Staab Director 1966 1970 4Ora Baldwin Director 1966 1970 4Fidelis Engel, Jr. Director 1967 1973 6Robert Towns Director 1968 1970 2Walter Urban Director 1968 1974 6Norman Johnson Director 1968 1972 4 XHerman Davis Director 1969 1975 6Albert Keller Director 1969 1975 6Richard Dechant Director 1969 1976 7Walter Joy Director 1970 1976 6 XDelbert Walters Director 1970 1977 7Duane Lambert Director 1971 1977 6John Kraus Director 1972 1978 6Paul Binder Director 1973 1982 9John Schmidt Director 1980 1986 6Richard Pfeifer Director 1975 1981 6Adolph Billinger Director 1975 1981 6Raymond Armbrister Director 1976 1985 9Leo Walter Director 1977 1983 6Robert Kriley Director 1977 1980 3Cliff Pfannenstiel Director 1978 1993 15Orville Haselhorst Director 1974 1980 6Melvin Keller Director 1980 1983 3Wayne Armbrister Director 1981 1987 6Charles Schmidt Director 1982 1994 12Donald Casey Director 1983 1989 6Richard Kreutzer Director 1985 1991 6Orville Haselhorst Director 1986 1989 3 XGlenn Lambert Director 1987 1990 3Ron Westhusin Director 1988 1991 3Orville Pfortmiller Director 1989 1992 3Mike Grabbe Director 1989 1995 6Duane Steeples Director 1991 1997 6Arlyn North Director 1995 1998 3Frank Joy Director 1981 2002 21Charles W. Kraus Director 1997 2003 6Harold Lowry Director 2002 2005 3
Total Years 686# of Directors 89
Mean Years 7.7
Former Directors (continued)
2
24
First Name
Last Name Title
Beginning Date
Ending Date
Years Served
Non-Consecutive
Service
Midland Marketing CooperativeExhibit 7. Director and Manager History
Hays, Kansas
Kent Stamper Chairperson 1976 1988 121992 2006 14 X
Tom Benoit Vice Chairperson 1990 2006 16Bill Hoffman Director 1983 2006 23John Irvin Director 1993 2006 13Norman Legleiter Director 1998 2006 8Jerry McReynolds Director 1994 2006 12Brian Staab Sec./Treas. 1991 2006 15Les Rogers Director 2003 2006 3Mike Werth Director 2005 2006 1
Total Years 117# of Directors 9
Mean Years 13
Walter Stanton General Manager 1919 1934 15Dan M. Pfeifer General Manager 1934 1971 37Ken Herrman General Manager 1971 1993 22Vance Westhusin General Manager 1993 2006 13
Total Years 87# of Managers 4
Mean Years 21.8
Current Directors
General Managers
3
25
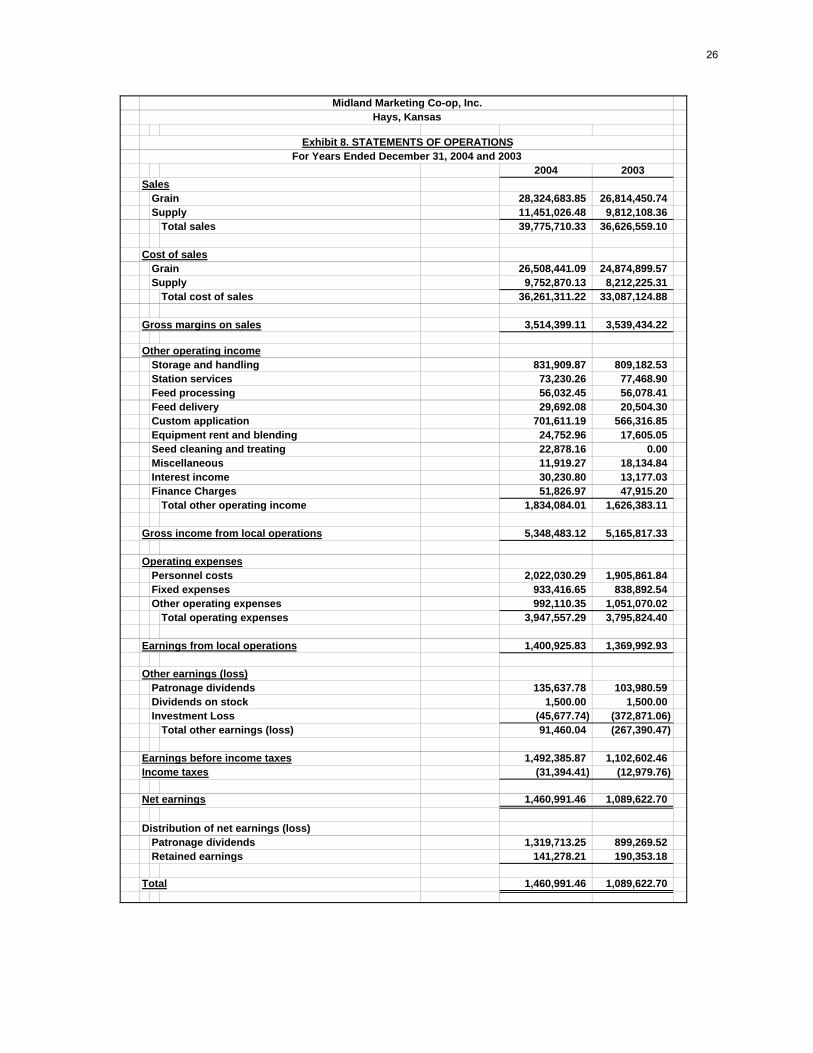
2004 2003Sales
Grain 28,324,683.85 26,814,450.74Supply 11,451,026.48 9,812,108.36
Total sales 39,775,710.33 36,626,559.10
Cost of salesGrain 26,508,441.09 24,874,899.57Supply 9,752,870.13 8,212,225.31
Total cost of sales 36,261,311.22 33,087,124.88
Gross margins on sales 3,514,399.11 3,539,434.22
Other operating incomeStorage and handling 831,909.87 809,182.53Station services 73,230.26 77,468.90Feed processing 56,032.45 56,078.41Feed delivery 29,692.08 20,504.30Custom application 701,611.19 566,316.85Equipment rent and blending 24,752.96 17,605.05Seed cleaning and treating 22,878.16 0.00Miscellaneous 11,919.27 18,134.84Interest income 30,230.80 13,177.03Finance Charges 51,826.97 47,915.20
Total other operating income 1,834,084.01 1,626,383.11
Gross income from local operations 5,348,483.12 5,165,817.33
Operating expensesPersonnel costs 2,022,030.29 1,905,861.84Fixed expenses 933,416.65 838,892.54Other operating expenses 992,110.35 1,051,070.02
Total operating expenses 3,947,557.29 3,795,824.40
Earnings from local operations 1,400,925.83 1,369,992.93
Other earnings (loss)Patronage dividends 135,637.78 103,980.59Dividends on stock 1,500.00 1,500.00Investment Loss (45,677.74) (372,871.06)
Total other earnings (loss) 91,460.04 (267,390.47)
Earnings before income taxes 1,492,385.87 1,102,602.46Income taxes (31,394.41) (12,979.76)
Net earnings 1,460,991.46 1,089,622.70
Distribution of net earnings (loss)Patronage dividends 1,319,713.25 899,269.52Retained earnings 141,278.21 190,353.18
Total 1,460,991.46 1,089,622.70
Midland Marketing Co-op, Inc.Hays, Kansas
Exhibit 8. STATEMENTS OF OPERATIONSFor Years Ended December 31, 2004 and 2003
26
Hays, Kansas
Exhibit 9. BALANCE SHEETDecember 31, 2004 and 2003
ASSETS LIABILITIES AND MEMBERS' EQUITYCurrent Assets 2004 2003 Current Liabilities 2004 2003
Cash and equivalents $ 2,869,089.83 $ 123,141.31 Grain contracts payable $ 2,260,086.08 $ 4,296,894.14Accounts receivable - trade 629,587.03 491,084.02 Accounts, taxes and expenses payable 1,138,511.28 899,360.80Grains receivable - trade 726,782.56 587,223.61 Collections received in advance 74,900.03 173,923.81Grain storage receivable 316,358.75 271,465.64 Grain storage collected in advance 47,246.79 39,861.02Other receivables and prepaid expenses 137,379.36 115,086.91 Current maturities of notes payable 800,000.00 950,000.00Prepaid inventories 1,137,252.29 976,196.59 Patronage dividends payable 395,913.98 269,780.86Inventories 4,810,726.31 9,089,808.41 Income taxes payable 31,492.65 18,312.40 Total current assets 10,627,176.13 11,654,006.49 Total Current Liabilities 4,748,150.81 6,648,133.03
Investments Long-term liabilities, excluding current maturitiesCorporate stock 494,722.62 407,032.17 Grain contracts payable 282,608.36 138,549.19Limited liability companies 435,550.79 511,131.45 Other 50,889.05 40,695.52Other 430,962.98 403,978.08 Total Long-Term Liabilities 333,497.41 179,244.71
Total investments 1,361,236.39 1,322,141.70
Property, Plant, and Equipment Members' equityCost 5,804,815.00 5,665,076.00 Memberships 467,000.00 477,500.00Accumulated depreciation (3,554,868.00) (3,289,222.00) Revolving Fund 5,026,924.52 4,836,809.36
Net property, plant and equipment 2,249,947.00 2,375,854.00 Deferred patronage dividends 923,799.27 629,488.66Retained earnings 2,833,734.48 2,678,874.11
Other Assets Total Members' Equity 9,251,458.27 8,622,672.13Prepaid expenses 94,746.97 98,047.68
Total Assets 14,333,106.49 15,450,049.87 Total Liabilities and Members' Equity 14,333,106.49 15,450,049.87
Midland Marketing Co-op, Inc.
27
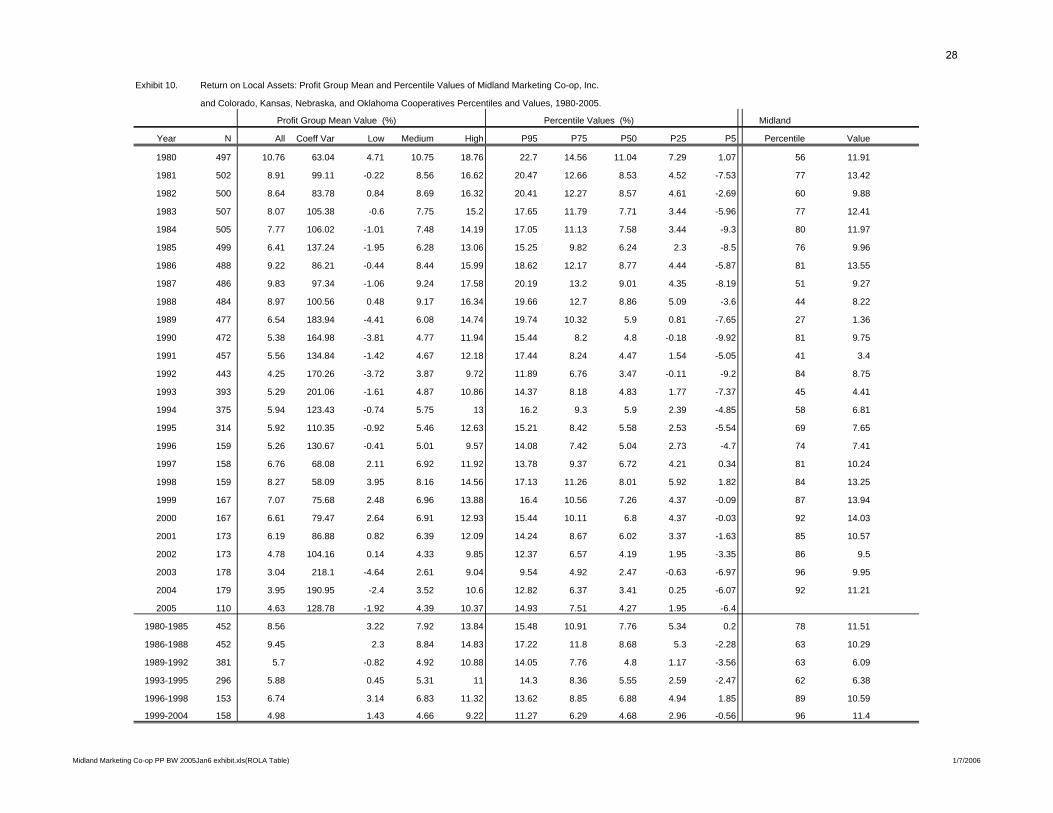
Exhibit 10. Return on Local Assets: Profit Group Mean and Percentile Values of Midland Marketing Co-op, Inc.
and Colorado, Kansas, Nebraska, and Oklahoma Cooperatives Percentiles and Values, 1980-2005.
Profit Group Mean Value (%) Percentile Values (%) Midland
Year N All Coeff Var Low Medium High P95 P75 P50 P25 P5 Percentile Value
1980 497 10.76 63.04 4.71 10.75 18.76 22.7 14.56 11.04 7.29 1.07 56 11.91
1981 502 8.91 99.11 -0.22 8.56 16.62 20.47 12.66 8.53 4.52 -7.53 77 13.42
1982 500 8.64 83.78 0.84 8.69 16.32 20.41 12.27 8.57 4.61 -2.69 60 9.88
1983 507 8.07 105.38 -0.6 7.75 15.2 17.65 11.79 7.71 3.44 -5.96 77 12.41
1984 505 7.77 106.02 -1.01 7.48 14.19 17.05 11.13 7.58 3.44 -9.3 80 11.97
1985 499 6.41 137.24 -1.95 6.28 13.06 15.25 9.82 6.24 2.3 -8.5 76 9.96
1986 488 9.22 86.21 -0.44 8.44 15.99 18.62 12.17 8.77 4.44 -5.87 81 13.55
1987 486 9.83 97.34 -1.06 9.24 17.58 20.19 13.2 9.01 4.35 -8.19 51 9.27
1988 484 8.97 100.56 0.48 9.17 16.34 19.66 12.7 8.86 5.09 -3.6 44 8.22
1989 477 6.54 183.94 -4.41 6.08 14.74 19.74 10.32 5.9 0.81 -7.65 27 1.36
1990 472 5.38 164.98 -3.81 4.77 11.94 15.44 8.2 4.8 -0.18 -9.92 81 9.75
1991 457 5.56 134.84 -1.42 4.67 12.18 17.44 8.24 4.47 1.54 -5.05 41 3.4
1992 443 4.25 170.26 -3.72 3.87 9.72 11.89 6.76 3.47 -0.11 -9.2 84 8.75
1993 393 5.29 201.06 -1.61 4.87 10.86 14.37 8.18 4.83 1.77 -7.37 45 4.41
1994 375 5.94 123.43 -0.74 5.75 13 16.2 9.3 5.9 2.39 -4.85 58 6.81
1995 314 5.92 110.35 -0.92 5.46 12.63 15.21 8.42 5.58 2.53 -5.54 69 7.65
1996 159 5.26 130.67 -0.41 5.01 9.57 14.08 7.42 5.04 2.73 -4.7 74 7.41
1997 158 6.76 68.08 2.11 6.92 11.92 13.78 9.37 6.72 4.21 0.34 81 10.24
1998 159 8.27 58.09 3.95 8.16 14.56 17.13 11.26 8.01 5.92 1.82 84 13.25
1999 167 7.07 75.68 2.48 6.96 13.88 16.4 10.56 7.26 4.37 -0.09 87 13.94
2000 167 6.61 79.47 2.64 6.91 12.93 15.44 10.11 6.8 4.37 -0.03 92 14.03
2001 173 6.19 86.88 0.82 6.39 12.09 14.24 8.67 6.02 3.37 -1.63 85 10.57
2002 173 4.78 104.16 0.14 4.33 9.85 12.37 6.57 4.19 1.95 -3.35 86 9.5
2003 178 3.04 218.1 -4.64 2.61 9.04 9.54 4.92 2.47 -0.63 -6.97 96 9.95
2004 179 3.95 190.95 -2.4 3.52 10.6 12.82 6.37 3.41 0.25 -6.07 92 11.21
2005 110 4.63 128.78 -1.92 4.39 10.37 14.93 7.51 4.27 1.95 -6.4
1980-1985 452 8.56 3.22 7.92 13.84 15.48 10.91 7.76 5.34 0.2 78 11.51
1986-1988 452 9.45 2.3 8.84 14.83 17.22 11.8 8.68 5.3 -2.28 63 10.29
1989-1992 381 5.7 -0.82 4.92 10.88 14.05 7.76 4.8 1.17 -3.56 63 6.09
1993-1995 296 5.88 0.45 5.31 11 14.3 8.36 5.55 2.59 -2.47 62 6.38
1996-1998 153 6.74 3.14 6.83 11.32 13.62 8.85 6.88 4.94 1.85 89 10.59
1999-2004 158 4.98 1.43 4.66 9.22 11.27 6.29 4.68 2.96 -0.56 96 11.4
Midland Marketing Co-op PP BW 2005Jan6 exhibit.xls(ROLA Table) 1/7/2006
28
Midland Marketing Co-op PP BW 2005Jan6 exhibit.xls(ROLA perctle_b) 1/7/2006
Exhibit 11. Return on Local AssetsMidland Marketing Co-op, Inc. and Colorado, Kansas, Nebraska, and
Oklahoma Cooperatives Percentiles, 1980-2005
-2
0
2
4
6
8
10
12
14
16
1980
1981
1982
1983
1984
1985
1986
1987
1988
1989
1990
1991
1992
1993
1994
1995
1996
1997
1998
1999
2000
2001
2002
2003
2004
2005
Years
RO
LA (%
)
P75
P50
P25
MMC
1999-2004 Avg.P75 6.29P50 4.68P25 2.96MMC 11.40
29

Exhibit 12. Return on Equity: Profit Group Mean and Percentile Values of Midland Marketing Co-op, Inc.
and Colorado, Kansas, Nebraska, and Oklahoma Cooperatives Percentiles and Values, 1980-2005.
Profit Group Mean Value (%) Percentile Values (%) Midland
Year N All Coeff Var Low Medium High P95 P75 P50 P25 P5 Percentile Value
1980 497 17.97 59.77 10.3 17.58 25.6 37.13 22.28 17.38 12.41 3.06 83 24.95
1981 501 14.88 112.44 3.49 14.14 23.05 31.92 19.97 14.19 7.21 -3.44 79 21.41
1982 500 9.97 98.72 1.24 9.39 17.94 24.81 14.21 9.12 3.55 -8.04 83 16.89
1983 507 7.98 158.27 -2.3 7.1 15.58 20.48 12.14 6.92 1.57 -10.11 89 16.65
1984 505 6.5 350.6 -5.8 6.04 13.99 19.46 10.99 6.05 0.16 -15.07 82 12.92
1985 499 4.1 312.01 -7.12 4.27 10.84 16.93 8.53 3.86 -0.8 -14.24 75 8.51
1986 488 3.85 397.57 -8.03 3.4 11.13 17.51 9.21 3.41 -4.83 -23.1 72 8.51
1987 486 7.5 199.85 -6.11 7.63 15.11 20.74 11.94 6.37 0.3 -14.98 73 11.51
1988 483 10.56 99.62 -0.72 11.12 17.87 22.4 13.96 9.31 4.87 -5.11 53 9.71
1989 477 8.07 142.44 -5.72 7.42 17.68 23.2 11.87 6.6 0.74 -11.53 31 2.76
1990 471 7.54 146.16 -4.97 6.91 15.5 21.1 11.15 5.94 0.2 -11.6 74 10.65
1991 457 7.47 162.25 -2.17 6.26 15.46 22.52 10.66 5.86 1.15 -8.16 40 4.21
1992 442 5.85 176.75 -3.95 5.33 12.35 16.09 8.76 4.68 0.27 -9.63 84 11
1993 418 7.35 165.5 -1.17 6.75 13.29 16.77 10.49 6.04 2.48 -7.17 46 5.44
1994 402 8.75 155.85 1.91 8.13 14.91 19.1 11.96 7.79 3.56 -5.79 65 10.07
1995 338 10.15 120.47 2.48 8.96 18.12 21.69 13.35 8.85 5.08 -5.06 67 11.44
1996 159 8.11 133.17 0.37 8.1 13.37 19.95 10.93 7.64 4.02 -3.76 54 8.2
1997 158 10.54 285.98 3.98 10.91 16.49 20.55 13.56 9.58 6.09 1.23 74 13.49
1998 159 12.66 110.15 7.17 12.77 17.88 21.48 15.7 12.13 8.56 3.93 80 16.27
1999 167 10.6 85.95 2.56 11.48 17.11 20.4 14.73 9.5 5.78 -1.28 92 18.74
2000 167 8.72 111.45 3.79 8.1 15.25 20.32 12.52 7.86 3.77 -0.72 88 16.67
2001 173 6.76 220.05 0.04 7.02 13.81 16.81 9.63 6.29 2.89 -5.12 91 14.4
2002 173 0.72 5404.78 -14.74 1.96 10.66 16.24 7.71 2.47 -13.12 -45.78 35 -4.2
2003 178 -5.27 -847.46 -27.24 -4.36 6.72 15.02 5.51 -3.75 -19.41 -48.36 92 12.64
2004 179 5.75 667.17 -4.54 5.48 14.93 19.63 11.4 5.47 0.32 -11.61 91 15.79
2005 110 9.67 470.95 -3.21 9 19.82 24.93 13.9 8.14 3.35 -11.17
1980-1985 453 10.04 3.74 8.91 15.67 0.18 14.54 5.63 9.1 0.93 89 16.41
1986-1988 451 7.43 -1.43 6.79 13.79 5.23 11.32 8.52 2.12 -8.05 72 9.92
1989-1992 381 7.59 -0.87 6.55 13.94 13.56 4.52 8.16 3.32 -6.28 61 7.33
1993-1995 325 8.94 1.27 8.24 14.48 13.76 12.29 5.82 5.36 -5.03 61 9.11
1996-1998 153 10.53 5.46 10.64 15.41 14.35 3.03 10.55 9.31 0.58 73 12.84
1999-2004 158 3.9 -2.11 3.99 8.81 12.8 6.71 4.76 3.17 -7.44 95 12.5
Midland Marketing Co-op PP BW 2005Jan6 exhibit.xls(ROE Table) 1/7/2006
30
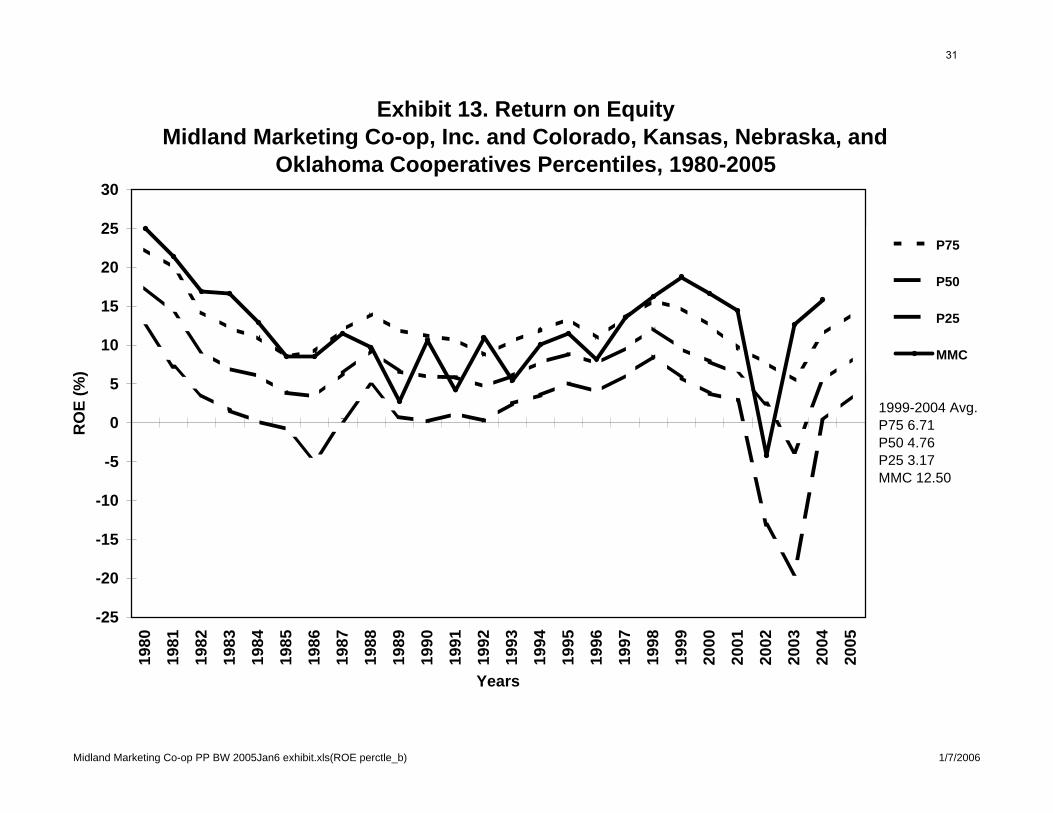
Midland Marketing Co-op PP BW 2005Jan6 exhibit.xls(ROE perctle_b) 1/7/2006
Exhibit 13. Return on EquityMidland Marketing Co-op, Inc. and Colorado, Kansas, Nebraska, and
Oklahoma Cooperatives Percentiles, 1980-2005
-25
-20
-15
-10
-5
0
5
10
15
20
25
30
1980
1981
1982
1983
1984
1985
1986
1987
1988
1989
1990
1991
1992
1993
1994
1995
1996
1997
1998
1999
2000
2001
2002
2003
2004
2005
Years
RO
E (%
)
P75
P50
P25
MMC
1999-2004 Avg.P75 6.71P50 4.76P25 3.17MMC 12.50
31
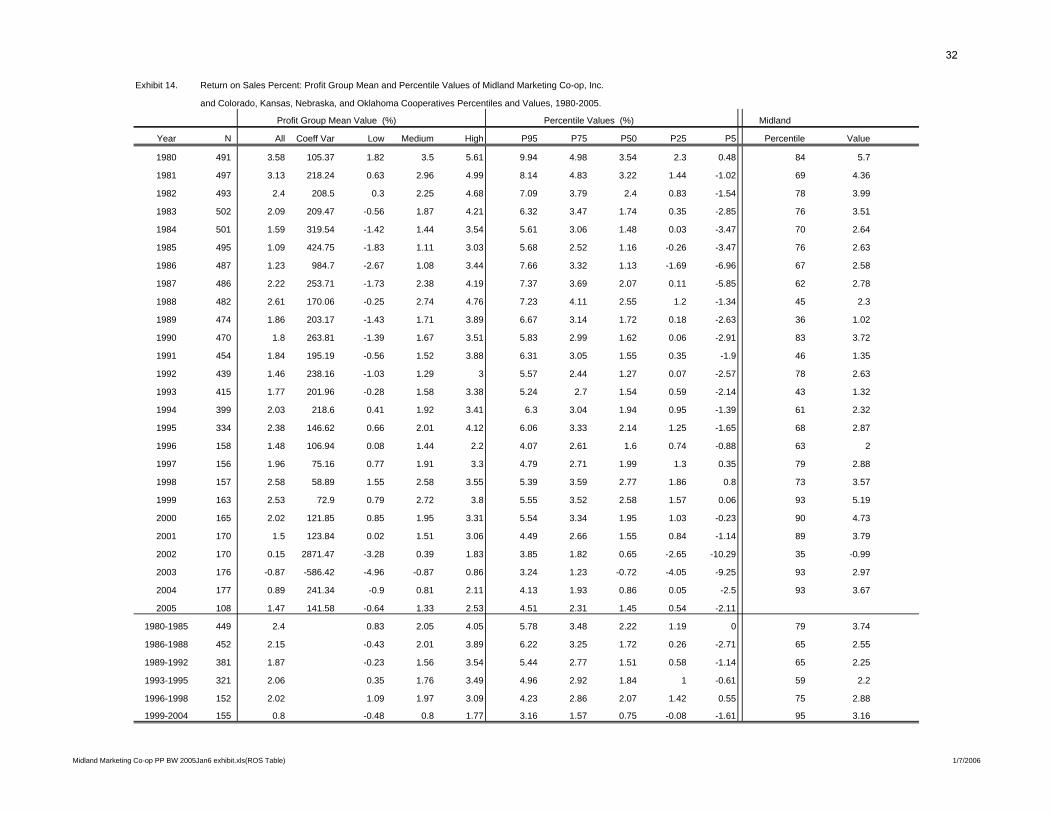
Exhibit 14. Return on Sales Percent: Profit Group Mean and Percentile Values of Midland Marketing Co-op, Inc.
and Colorado, Kansas, Nebraska, and Oklahoma Cooperatives Percentiles and Values, 1980-2005.
Profit Group Mean Value (%) Percentile Values (%) Midland
Year N All Coeff Var Low Medium High P95 P75 P50 P25 P5 Percentile Value
1980 491 3.58 105.37 1.82 3.5 5.61 9.94 4.98 3.54 2.3 0.48 84 5.7
1981 497 3.13 218.24 0.63 2.96 4.99 8.14 4.83 3.22 1.44 -1.02 69 4.36
1982 493 2.4 208.5 0.3 2.25 4.68 7.09 3.79 2.4 0.83 -1.54 78 3.99
1983 502 2.09 209.47 -0.56 1.87 4.21 6.32 3.47 1.74 0.35 -2.85 76 3.51
1984 501 1.59 319.54 -1.42 1.44 3.54 5.61 3.06 1.48 0.03 -3.47 70 2.64
1985 495 1.09 424.75 -1.83 1.11 3.03 5.68 2.52 1.16 -0.26 -3.47 76 2.63
1986 487 1.23 984.7 -2.67 1.08 3.44 7.66 3.32 1.13 -1.69 -6.96 67 2.58
1987 486 2.22 253.71 -1.73 2.38 4.19 7.37 3.69 2.07 0.11 -5.85 62 2.78
1988 482 2.61 170.06 -0.25 2.74 4.76 7.23 4.11 2.55 1.2 -1.34 45 2.3
1989 474 1.86 203.17 -1.43 1.71 3.89 6.67 3.14 1.72 0.18 -2.63 36 1.02
1990 470 1.8 263.81 -1.39 1.67 3.51 5.83 2.99 1.62 0.06 -2.91 83 3.72
1991 454 1.84 195.19 -0.56 1.52 3.88 6.31 3.05 1.55 0.35 -1.9 46 1.35
1992 439 1.46 238.16 -1.03 1.29 3 5.57 2.44 1.27 0.07 -2.57 78 2.63
1993 415 1.77 201.96 -0.28 1.58 3.38 5.24 2.7 1.54 0.59 -2.14 43 1.32
1994 399 2.03 218.6 0.41 1.92 3.41 6.3 3.04 1.94 0.95 -1.39 61 2.32
1995 334 2.38 146.62 0.66 2.01 4.12 6.06 3.33 2.14 1.25 -1.65 68 2.87
1996 158 1.48 106.94 0.08 1.44 2.2 4.07 2.61 1.6 0.74 -0.88 63 2
1997 156 1.96 75.16 0.77 1.91 3.3 4.79 2.71 1.99 1.3 0.35 79 2.88
1998 157 2.58 58.89 1.55 2.58 3.55 5.39 3.59 2.77 1.86 0.8 73 3.57
1999 163 2.53 72.9 0.79 2.72 3.8 5.55 3.52 2.58 1.57 0.06 93 5.19
2000 165 2.02 121.85 0.85 1.95 3.31 5.54 3.34 1.95 1.03 -0.23 90 4.73
2001 170 1.5 123.84 0.02 1.51 3.06 4.49 2.66 1.55 0.84 -1.14 89 3.79
2002 170 0.15 2871.47 -3.28 0.39 1.83 3.85 1.82 0.65 -2.65 -10.29 35 -0.99
2003 176 -0.87 -586.42 -4.96 -0.87 0.86 3.24 1.23 -0.72 -4.05 -9.25 93 2.97
2004 177 0.89 241.34 -0.9 0.81 2.11 4.13 1.93 0.86 0.05 -2.5 93 3.67
2005 108 1.47 141.58 -0.64 1.33 2.53 4.51 2.31 1.45 0.54 -2.11
1980-1985 449 2.4 0.83 2.05 4.05 5.78 3.48 2.22 1.19 0 79 3.74
1986-1988 452 2.15 -0.43 2.01 3.89 6.22 3.25 1.72 0.26 -2.71 65 2.55
1989-1992 381 1.87 -0.23 1.56 3.54 5.44 2.77 1.51 0.58 -1.14 65 2.25
1993-1995 321 2.06 0.35 1.76 3.49 4.96 2.92 1.84 1 -0.61 59 2.2
1996-1998 152 2.02 1.09 1.97 3.09 4.23 2.86 2.07 1.42 0.55 75 2.88
1999-2004 155 0.8 -0.48 0.8 1.77 3.16 1.57 0.75 -0.08 -1.61 95 3.16
Midland Marketing Co-op PP BW 2005Jan6 exhibit.xls(ROS Table) 1/7/2006
32
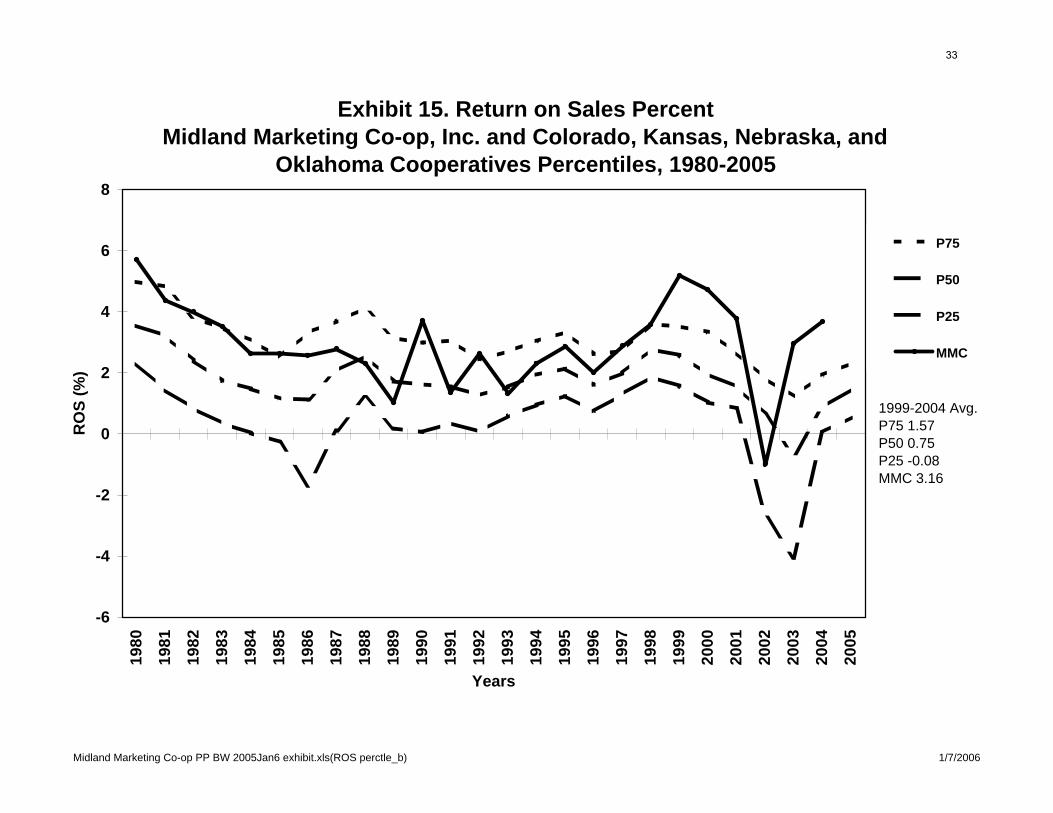
Midland Marketing Co-op PP BW 2005Jan6 exhibit.xls(ROS perctle_b) 1/7/2006
Exhibit 15. Return on Sales PercentMidland Marketing Co-op, Inc. and Colorado, Kansas, Nebraska, and
Oklahoma Cooperatives Percentiles, 1980-2005
-6
-4
-2
0
2
4
6
8
1980
1981
1982
1983
1984
1985
1986
1987
1988
1989
1990
1991
1992
1993
1994
1995
1996
1997
1998
1999
2000
2001
2002
2003
2004
2005
Years
RO
S (%
)
P75
P50
P25
MMC
1999-2004 Avg.P75 1.57P50 0.75P25 -0.08MMC 3.16
33

Exhibit 16. Grain Gross Margin: Profit Group Mean and Percentile Values of Midland Marketing Co-op, Inc.
and Colorado, Kansas, Nebraska, and Oklahoma Cooperatives Percentiles and Values, 1980-2005.
Profit Group Mean Value (%) Percentile Values (%) Midland
Year N All Coeff Var Low Medium High P95 P75 P50 P25 P5 Percentile Value
1980 332 4.06 79.08 3.14 4.3 4.38 6.43 4.81 3.98 3.18 1.9 87 5.44
1981 330 3.99 37.75 2.79 3.97 4.7 6.34 4.96 4.09 3.13 1.41 92 5.96
1982 305 4.38 35.06 3.89 4.28 4.94 6.8 5.35 4.39 3.52 2.28 95 6.86
1983 310 4.31 558.43 4.11 4.29 4.5 6.92 5.36 4.6 3.75 1.77 53 4.7
1984 322 3.65 456.91 3.44 3.59 3.9 6.98 4.94 3.96 3.02 1.62 55 4.2
1985 312 4.04 53.54 3.39 4.02 4.5 7.95 5.43 4.51 3.36 1.81 63 4.92
1986 307 4.82 123.22 4.39 4.76 5.22 8.8 6.27 4.91 3.78 1.93 28 3.96
1987 310 4.76 108.47 3.9 5.2 4.67 8.88 6.14 4.98 3.98 1.72 27 4.11
1988 293 4.19 87.15 3.58 4.24 4.62 7.62 5.53 4.51 3.43 1.79 42 4.23
1989 273 3.57 51.56 3.03 3.62 3.74 6.61 4.63 3.74 2.73 1.04 77 4.72
1990 297 3.68 54.71 3.17 3.87 3.64 6.32 4.73 3.84 2.94 1.33 88 5.54
1991 303 4.44 53 4.13 4.34 4.79 8.48 6.38 4.99 3.77 2.09 67 5.94
1992 284 4.61 53.83 4.32 4.56 4.85 8.54 6.22 5.14 3.92 2.35 67 5.89
1993 272 4.95 96.84 4.74 4.73 5.7 9.16 6.81 5.28 4.12 2.45 20 3.85
1994 259 4.66 107.59 4.55 4.43 5.32 9.64 6.62 5.02 3.98 2.52 25 4.02
1995 214 4.56 75.68 4.27 4.49 4.82 8.74 6.16 4.96 3.94 2.05 63 5.49
1996 149 4.19 268.78 4.81 3.99 4.3 7.97 5.66 4.5 3.36 1.8 48 4.37
1997 147 3.92 199.69 3.57 3.88 4.35 7.47 5.32 4.33 3.5 2.11 29 3.57
1998 147 5.05 218.21 4.65 5.05 5.43 8.91 6.67 5.43 4.29 2.51 49 5.39
1999 152 8.31 158.79 5.88 9.3 7.77 12.28 8.91 7.12 5.26 2.93 62 8.07
2000 152 9.56 137.73 13.76 8.08 8.23 14.72 10.33 8.31 6.25 3.8 46 8.21
2001 154 7.73 139.12 6.76 7.89 8 15.05 10.49 8.27 6.12 3.29 16 5.11
2002 154 7.13 152.64 7.2 6.19 9.4 13.12 8.52 6.81 5.63 3.93 49 6.81
2003 159 6.81 212.22 6.79 7.38 6.11 10.62 7.28 5.71 4.31 2.29 74 7.23
2004 160 5.68 225.38 5.01 6.01 5.26 10.71 7.49 6 4.38 1.83 54 6.41
2005 97 6.18 163.91 7.76 6.44 5.33 10.55 7.51 6.23 4.78 2.28
1980-1985 215 4 3.5 4.02 4.29 5.82 4.85 4.19 3.36 2.62 89 5.29
1986-1988 252 4.58 4.3 4.73 4.55 7.82 5.69 4.78 3.91 2.32 30 4.11
1989-1992 193 4.06 4 4.1 4.02 6.25 5.16 4.4 3.45 2.16 84 5.61
1993-1995 192 4.74 4.74 4.61 5.06 7.76 6.33 5.3 4.22 2.4 33 4.46
1996-1998 143 4.39 4.15 4.4 4.65 7.54 5.76 4.75 3.76 2.19 41 4.47
1999-2004 141 6.93 6.75 7.16 6.56 11.8 8.45 7.37 5.47 3.96 42 6.93
Midland Marketing Co-op PP BW 2005Jan6 exhibit.xls(GGMP Table) 1/7/2006
34
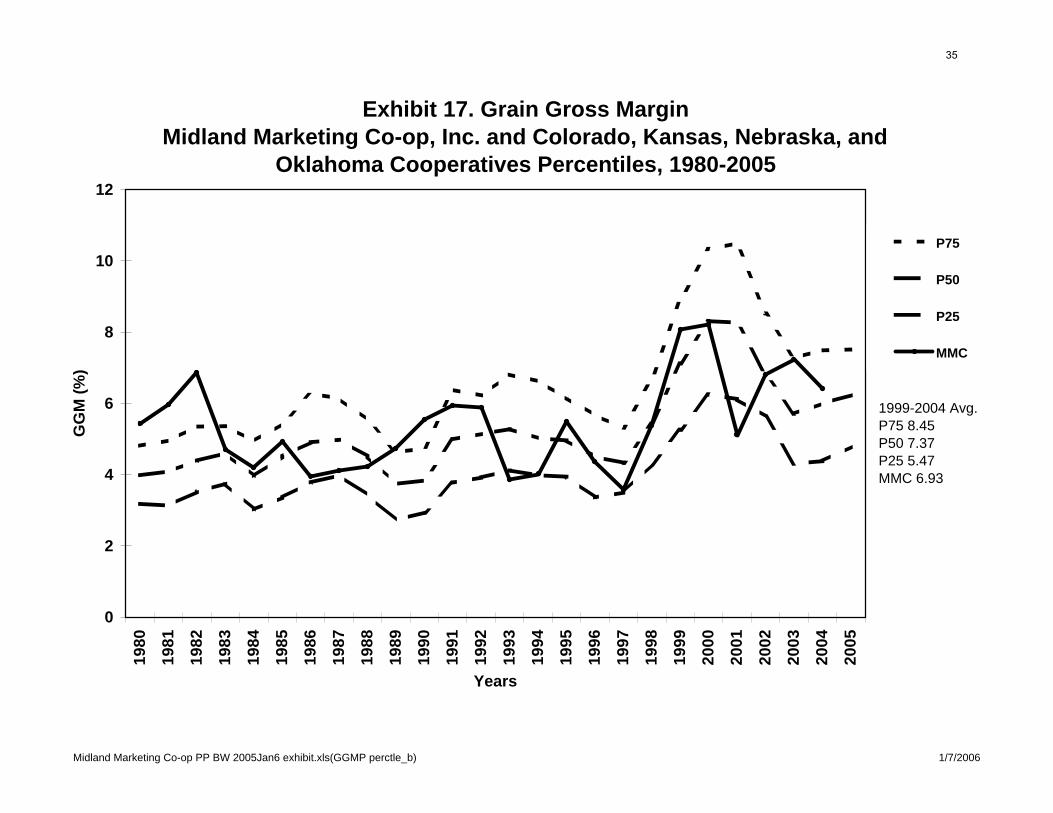
Midland Marketing Co-op PP BW 2005Jan6 exhibit.xls(GGMP perctle_b) 1/7/2006
Exhibit 17. Grain Gross MarginMidland Marketing Co-op, Inc. and Colorado, Kansas, Nebraska, and
Oklahoma Cooperatives Percentiles, 1980-2005
0
2
4
6
8
10
12
1980
1981
1982
1983
1984
1985
1986
1987
1988
1989
1990
1991
1992
1993
1994
1995
1996
1997
1998
1999
2000
2001
2002
2003
2004
2005
Years
GG
M (%
)
P75
P50
P25
MMC
1999-2004 Avg.P75 8.45P50 7.37P25 5.47MMC 6.93
35

Exhibit 18. Farm Supply Gross Margin Percent: Profit Group Mean and Percentile Values of Midland Marketing Co-op, Inc.
and Colorado, Kansas, Nebraska, and Oklahoma Cooperatives Percentiles and Values, 1980-2005.
Profit Group Mean Value (%) Percentile Values (%) Midland
Year N All Coeff Var Low Medium High P95 P75 P50 P25 P5 Percentile Value
1980 404 14.04 32.66 13.23 14.14 14.55 19.54 15.48 13.64 11.65 6.96 66 14.76
1981 397 13.35 29.21 12.14 13.34 14.22 17.32 14.55 13.08 10.99 6.1
1982 369 13.42 38.09 12.31 13.65 13.81 17.92 14.67 12.91 11.32 6.99
1983 369 13.54 48.94 12.19 13.94 13.71 18.04 14.66 12.92 11.21 6.42
1984 373 14.43 37.66 14 14.57 14.51 18.41 15.32 13.72 11.96 8.83
1985 349 14.66 24.21 13.9 14.67 15.19 18.71 15.63 14.11 12.13 9.2
1986 322 15.33 28.82 15.31 15.14 15.69 20.07 16.97 14.73 12.57 7.6
1987 293 16.77 27.07 15.83 16.53 17.81 23.33 18.24 16.23 14.23 9.17
1988 207 16.42 24.99 15.15 16.18 17.96 20.79 17.96 15.86 13.54 8.25 0 0
1989 193 16.46 32.04 15.83 15.94 17.36 21.94 17.76 15.82 13.55 7.58
1990 191 16.38 25.26 15.25 15.85 17.51 20.06 17.56 15.3 13.14 7.08
1991 173 15.71 30.9 14.62 15.91 15.93 19.62 16.74 14.83 12.82 0
1992 179 16.07 68.14 15.34 15.6 16.92 20.4 17.12 15.2 13.22 3.53
1993 172 16.17 33.71 15.98 15.93 16.67 20.66 17.52 15.46 13.45 0
1994 170 16.28 27.64 15.17 16.14 17.17 20.65 17.5 15.42 13.49 7.67
1995 148 15.64 27.84 14.7 16.08 15.34 20.49 17.17 15.49 13.66 4.99 74 17.17
1996 154 19.08 39.47 14.63 22.76 13.56 20.2 16.39 14.6 13.31 10.43 71 15.99
1997 152 17.15 32.51 14.77 18.21 15.69 20.16 16.12 14.23 13.14 9.61 74 16.05
1998 152 14.93 23.25 15.57 14.46 15.69 21.32 17.01 15.29 13.93 10.44 66 16.54
1999 155 15.97 21.04 16.93 15.42 16.4 21.26 18.12 16.31 14.8 12.19 69 17.59
2000 156 14.77 21.89 12.67 15.6 15.04 20.01 16.99 15.52 13.41 10.79 53 15.62
2001 160 14.21 25.75 12.13 15.37 13.72 19.34 16.56 14.39 12.58 10.6 56 15.05
2002 160 14.44 27.79 13 15.49 13.55 20.15 16.88 14.8 12.88 10.06 67 16.34
2003 161 17.37 83.17 15.64 17.43 18.24 22 17.24 15.21 13.32 10.96 63 16.31
2004 162 14.53 57.73 13.51 14.64 14.99 20.36 16.16 13.67 12.19 10.28 61 14.83
2005 99 12.61 26.89 11.81 12.54 13.14 17.14 14.83 12.95 11.07 7.89
1980-1985 222 14.12 13.69 14.15 14.41 17.44 14.82 13.59 12.33 10.1
1986-1988 153 16.34 15.12 16.07 17.31 20.65 17.3 15.65 13.92 10.72
1989-1992 69 16.64 15.66 16.65 17.02 20.02 17.85 16.13 13.93 11.3
1993-1995 92 16.41 15.42 15.76 18 21.48 17.61 15.79 14.14 10.57
1996-1998 148 17 14.54 19.06 13.97 20.25 16.2 14.71 13.52 11.34 74 16.2
1999-2004 147 14.91 12.64 15.88 15.03 21.11 16.83 14.87 13.32 11.69 59 15.86
Midland Marketing Co-op PP BW 2005Jan6 exhibit.xls(FSGMP Table) 1/7/2006
36
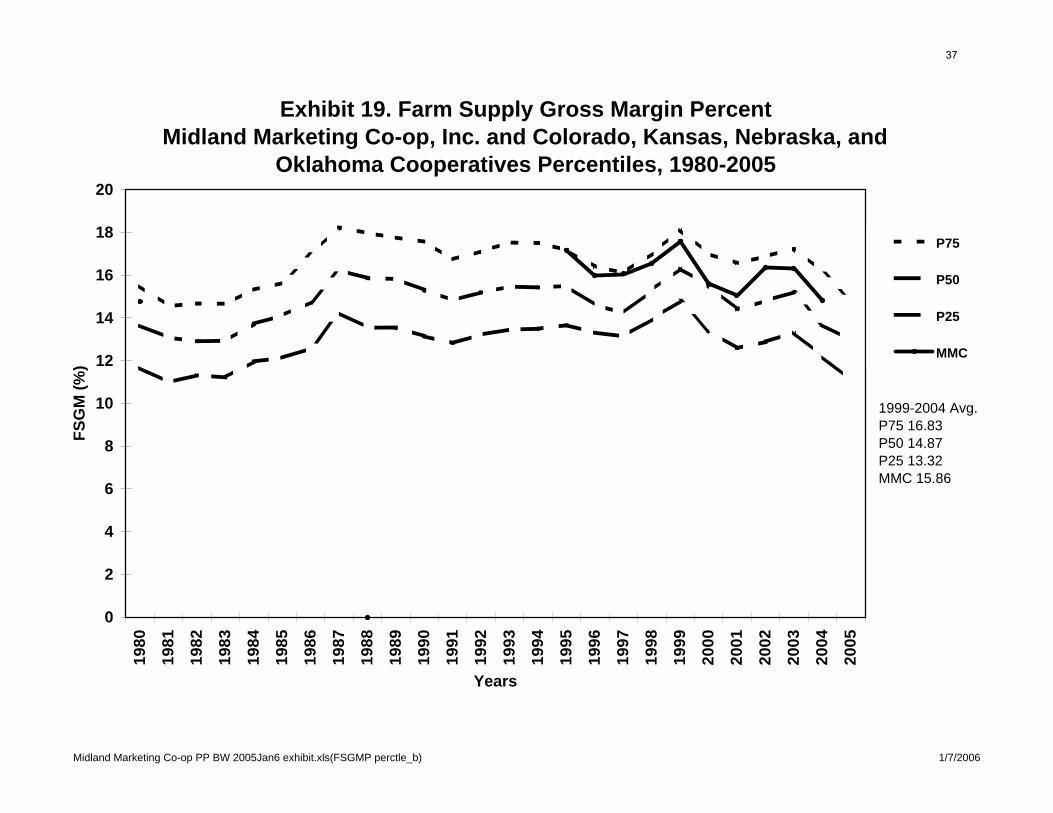
Midland Marketing Co-op PP BW 2005Jan6 exhibit.xls(FSGMP perctle_b) 1/7/2006
Exhibit 19. Farm Supply Gross Margin PercentMidland Marketing Co-op, Inc. and Colorado, Kansas, Nebraska, and
Oklahoma Cooperatives Percentiles, 1980-2005
0
2
4
6
8
10
12
14
16
18
20
1980
1981
1982
1983
1984
1985
1986
1987
1988
1989
1990
1991
1992
1993
1994
1995
1996
1997
1998
1999
2000
2001
2002
2003
2004
2005
Years
FSG
M (%
)
P75
P50
P25
MMC
1999-2004 Avg.P75 16.83P50 14.87P25 13.32MMC 15.86
37

Exhibit 20. Current Ratio: Profit Group Mean and Percentile Values of Midland Marketing Co-op, Inc.
and Colorado, Kansas, Nebraska, and Oklahoma Cooperatives Percentiles and Values, 1980-2005.
Profit Group Mean Value (ratio) Percentile Values (ratio) Midland
Year N All Coeff Var Low Medium High P95 P75 P50 P25 P5 Percentile Value
1980 496 1.47 116.29 1.29 1.45 1.94 4.19 2.16 1.64 1.31 1.05 4 1.04
1981 501 1.55 447.8 1.33 1.5 1.92 5.02 2.27 1.67 1.35 1.02 33 1.42
1982 497 1.59 167.78 1.39 1.53 2.12 6.65 2.47 1.7 1.33 0.98 13 1.14
1983 506 1.59 299.29 1.39 1.53 1.97 7.37 2.54 1.72 1.3 0.93 8 1.01
1984 505 1.53 542.09 1.3 1.48 1.95 7.72 2.64 1.67 1.27 0.98 3 0.93
1985 499 1.64 391.55 1.41 1.58 2.05 9.5 3.04 1.82 1.31 0.91 10 1.01
1986 488 1.72 408.97 1.56 1.75 1.75 9.48 3.16 1.95 1.36 0.95 15 1.2
1987 486 1.69 601.98 1.52 1.7 1.78 8.89 3.08 1.84 1.35 1.02 18 1.22
1988 484 1.56 576.44 1.42 1.51 1.97 7.56 2.89 1.72 1.29 1.04 29 1.35
1989 477 1.61 623.86 1.45 1.56 1.88 8.71 3.13 1.86 1.28 1.01 69 2.69
1990 472 1.57 1412.45 1.36 1.54 1.77 8.57 2.88 1.76 1.26 0.99 75 2.95
1991 457 1.53 314.25 1.28 1.51 1.81 8.95 2.74 1.66 1.26 0.98 54 1.72
1992 443 1.53 438.99 1.47 1.47 1.71 8.99 3.07 1.75 1.29 1.06 41 1.52
1993 418 1.46 382.71 1.38 1.39 1.73 9.26 2.74 1.68 1.29 1.08 43 1.56
1994 402 1.45 263.95 1.37 1.39 1.83 8.98 2.76 1.65 1.31 1.05 45 1.58
1995 338 1.38 231.8 1.44 1.3 1.69 6.78 2.54 1.61 1.28 1.09 49 1.61
1996 159 1.36 79.63 1.29 1.37 1.36 3.38 2.03 1.5 1.25 1.07 73 1.95
1997 158 1.42 55.13 1.4 1.39 1.58 3.61 2.07 1.51 1.28 1.1 62 1.77
1998 159 1.4 82.04 1.3 1.39 1.64 3.43 2.14 1.53 1.27 1.09 66 1.89
1999 167 1.33 93.94 1.42 1.27 1.56 4.06 2.04 1.53 1.22 1.1 68 1.88
2000 167 1.27 64.21 1.18 1.3 1.37 3.13 1.93 1.42 1.19 1.06 71 1.79
2001 173 1.29 57.23 1.27 1.26 1.46 2.97 1.85 1.38 1.2 1.04 78 1.91
2002 173 1.26 61.94 1.27 1.24 1.29 3.03 1.73 1.35 1.19 1.02 78 1.85
2003 178 1.24 56.08 1.18 1.23 1.33 2.95 1.69 1.34 1.18 1.01 75 1.75
2004 179 1.28 87.13 1.27 1.24 1.43 3.02 1.67 1.35 1.18 1.03 89 2.33
2005 110 1.24 191.3 1.17 1.25 1.27 2.64 1.5 1.27 1.18 1.01
1980-1985 452 1.57 1.34 1.5 2.03 4.89 2.28 1.65 1.32 1.06 7 1.08
1986-1988 452 1.66 1.63 1.63 1.75 7.76 3 1.78 1.35 1.05 19 1.26
1989-1992 381 1.58 1.48 1.51 1.82 7.29 2.78 1.8 1.34 1.08 54 1.9
1993-1995 325 1.46 1.51 1.37 1.72 6.82 2.65 1.69 1.33 1.11 45 1.59
1996-1998 153 1.4 1.33 1.38 1.59 3.14 1.97 1.54 1.28 1.12 71 1.86
1999-2004 158 1.29 1.3 1.26 1.38 2.71 1.74 1.38 1.22 1.12 82 1.91
Midland Marketing Co-op PP BW 2005Jan6 exhibit.xls(CR Table) 1/7/2006
38
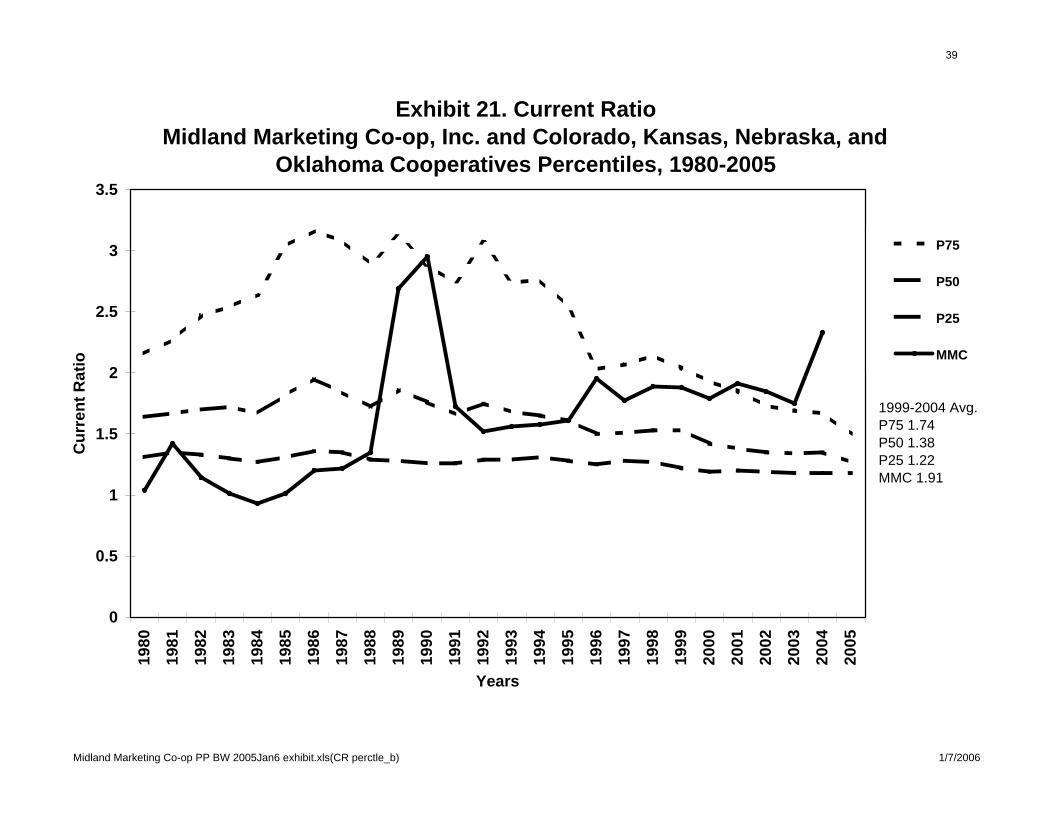
Midland Marketing Co-op PP BW 2005Jan6 exhibit.xls(CR perctle_b) 1/7/2006
Exhibit 21. Current RatioMidland Marketing Co-op, Inc. and Colorado, Kansas, Nebraska, and
Oklahoma Cooperatives Percentiles, 1980-2005
0
0.5
1
1.5
2
2.5
3
3.5
1980
1981
1982
1983
1984
1985
1986
1987
1988
1989
1990
1991
1992
1993
1994
1995
1996
1997
1998
1999
2000
2001
2002
2003
2004
2005
Years
Cur
rent
Rat
io
P75
P50
P25
MMC
1999-2004 Avg.P75 1.74P50 1.38P25 1.22MMC 1.91
39
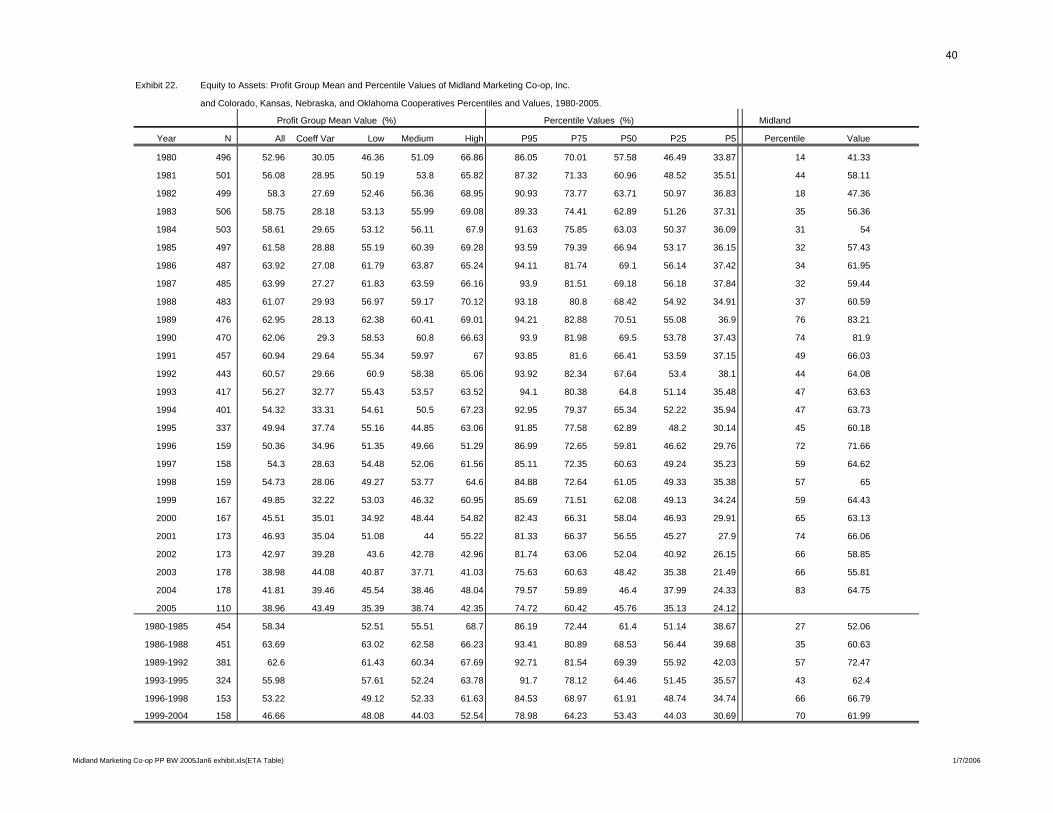
Exhibit 22. Equity to Assets: Profit Group Mean and Percentile Values of Midland Marketing Co-op, Inc.
and Colorado, Kansas, Nebraska, and Oklahoma Cooperatives Percentiles and Values, 1980-2005.
Profit Group Mean Value (%) Percentile Values (%) Midland
Year N All Coeff Var Low Medium High P95 P75 P50 P25 P5 Percentile Value
1980 496 52.96 30.05 46.36 51.09 66.86 86.05 70.01 57.58 46.49 33.87 14 41.33
1981 501 56.08 28.95 50.19 53.8 65.82 87.32 71.33 60.96 48.52 35.51 44 58.11
1982 499 58.3 27.69 52.46 56.36 68.95 90.93 73.77 63.71 50.97 36.83 18 47.36
1983 506 58.75 28.18 53.13 55.99 69.08 89.33 74.41 62.89 51.26 37.31 35 56.36
1984 503 58.61 29.65 53.12 56.11 67.9 91.63 75.85 63.03 50.37 36.09 31 54
1985 497 61.58 28.88 55.19 60.39 69.28 93.59 79.39 66.94 53.17 36.15 32 57.43
1986 487 63.92 27.08 61.79 63.87 65.24 94.11 81.74 69.1 56.14 37.42 34 61.95
1987 485 63.99 27.27 61.83 63.59 66.16 93.9 81.51 69.18 56.18 37.84 32 59.44
1988 483 61.07 29.93 56.97 59.17 70.12 93.18 80.8 68.42 54.92 34.91 37 60.59
1989 476 62.95 28.13 62.38 60.41 69.01 94.21 82.88 70.51 55.08 36.9 76 83.21
1990 470 62.06 29.3 58.53 60.8 66.63 93.9 81.98 69.5 53.78 37.43 74 81.9
1991 457 60.94 29.64 55.34 59.97 67 93.85 81.6 66.41 53.59 37.15 49 66.03
1992 443 60.57 29.66 60.9 58.38 65.06 93.92 82.34 67.64 53.4 38.1 44 64.08
1993 417 56.27 32.77 55.43 53.57 63.52 94.1 80.38 64.8 51.14 35.48 47 63.63
1994 401 54.32 33.31 54.61 50.5 67.23 92.95 79.37 65.34 52.22 35.94 47 63.73
1995 337 49.94 37.74 55.16 44.85 63.06 91.85 77.58 62.89 48.2 30.14 45 60.18
1996 159 50.36 34.96 51.35 49.66 51.29 86.99 72.65 59.81 46.62 29.76 72 71.66
1997 158 54.3 28.63 54.48 52.06 61.56 85.11 72.35 60.63 49.24 35.23 59 64.62
1998 159 54.73 28.06 49.27 53.77 64.6 84.88 72.64 61.05 49.33 35.38 57 65
1999 167 49.85 32.22 53.03 46.32 60.95 85.69 71.51 62.08 49.13 34.24 59 64.43
2000 167 45.51 35.01 34.92 48.44 54.82 82.43 66.31 58.04 46.93 29.91 65 63.13
2001 173 46.93 35.04 51.08 44 55.22 81.33 66.37 56.55 45.27 27.9 74 66.06
2002 173 42.97 39.28 43.6 42.78 42.96 81.74 63.06 52.04 40.92 26.15 66 58.85
2003 178 38.98 44.08 40.87 37.71 41.03 75.63 60.63 48.42 35.38 21.49 66 55.81
2004 178 41.81 39.46 45.54 38.46 48.04 79.57 59.89 46.4 37.99 24.33 83 64.75
2005 110 38.96 43.49 35.39 38.74 42.35 74.72 60.42 45.76 35.13 24.12
1980-1985 454 58.34 52.51 55.51 68.7 86.19 72.44 61.4 51.14 38.67 27 52.06
1986-1988 451 63.69 63.02 62.58 66.23 93.41 80.89 68.53 56.44 39.68 35 60.63
1989-1992 381 62.6 61.43 60.34 67.69 92.71 81.54 69.39 55.92 42.03 57 72.47
1993-1995 324 55.98 57.61 52.24 63.78 91.7 78.12 64.46 51.45 35.57 43 62.4
1996-1998 153 53.22 49.12 52.33 61.63 84.53 68.97 61.91 48.74 34.74 66 66.79
1999-2004 158 46.66 48.08 44.03 52.54 78.98 64.23 53.43 44.03 30.69 70 61.99
Midland Marketing Co-op PP BW 2005Jan6 exhibit.xls(ETA Table) 1/7/2006
40
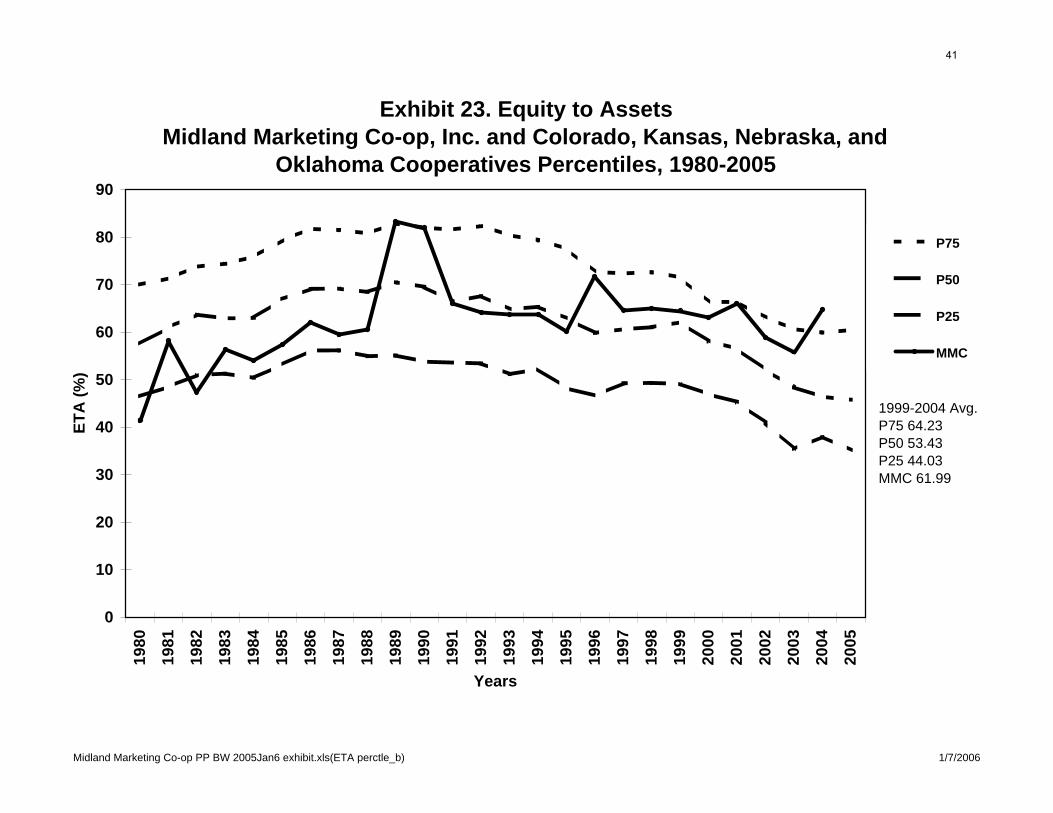
Midland Marketing Co-op PP BW 2005Jan6 exhibit.xls(ETA perctle_b) 1/7/2006
Exhibit 23. Equity to AssetsMidland Marketing Co-op, Inc. and Colorado, Kansas, Nebraska, and
Oklahoma Cooperatives Percentiles, 1980-2005
0
10
20
30
40
50
60
70
80
90
1980
1981
1982
1983
1984
1985
1986
1987
1988
1989
1990
1991
1992
1993
1994
1995
1996
1997
1998
1999
2000
2001
2002
2003
2004
2005
Years
ETA
(%)
P75
P50
P25
MMC
1999-2004 Avg.P75 64.23P50 53.43P25 44.03MMC 61.99
41
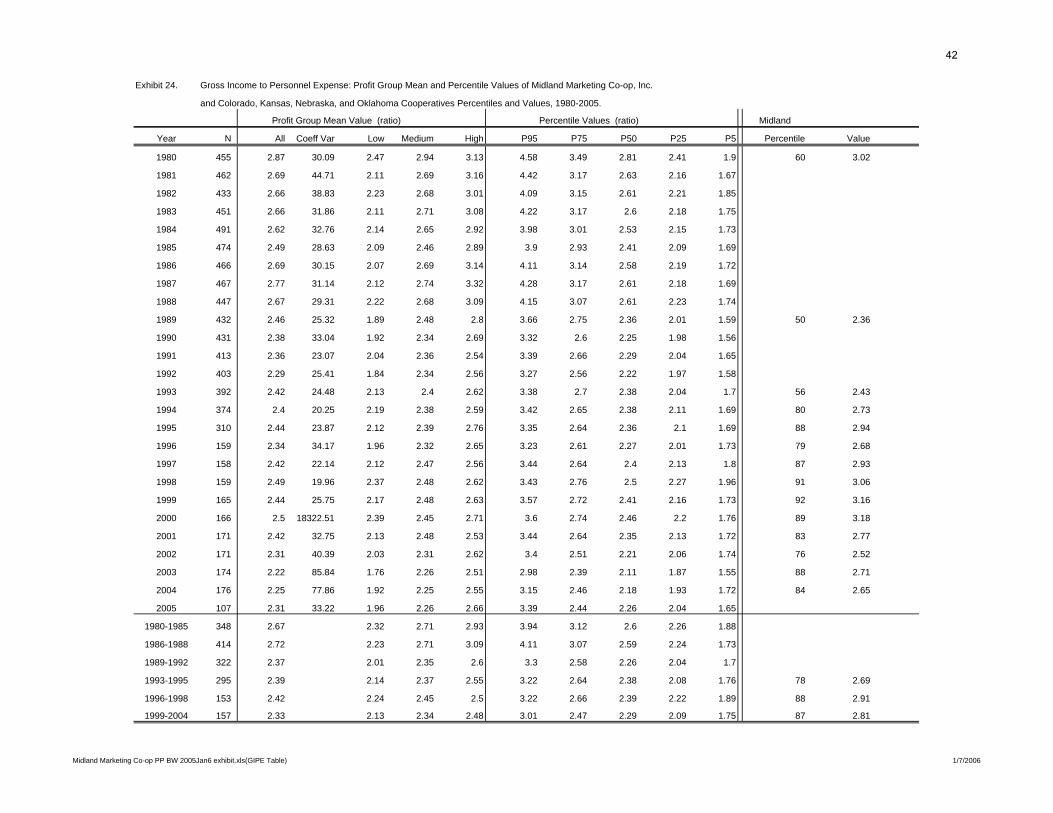
Exhibit 24. Gross Income to Personnel Expense: Profit Group Mean and Percentile Values of Midland Marketing Co-op, Inc.
and Colorado, Kansas, Nebraska, and Oklahoma Cooperatives Percentiles and Values, 1980-2005.
Profit Group Mean Value (ratio) Percentile Values (ratio) Midland
Year N All Coeff Var Low Medium High P95 P75 P50 P25 P5 Percentile Value
1980 455 2.87 30.09 2.47 2.94 3.13 4.58 3.49 2.81 2.41 1.9 60 3.02
1981 462 2.69 44.71 2.11 2.69 3.16 4.42 3.17 2.63 2.16 1.67
1982 433 2.66 38.83 2.23 2.68 3.01 4.09 3.15 2.61 2.21 1.85
1983 451 2.66 31.86 2.11 2.71 3.08 4.22 3.17 2.6 2.18 1.75
1984 491 2.62 32.76 2.14 2.65 2.92 3.98 3.01 2.53 2.15 1.73
1985 474 2.49 28.63 2.09 2.46 2.89 3.9 2.93 2.41 2.09 1.69
1986 466 2.69 30.15 2.07 2.69 3.14 4.11 3.14 2.58 2.19 1.72
1987 467 2.77 31.14 2.12 2.74 3.32 4.28 3.17 2.61 2.18 1.69
1988 447 2.67 29.31 2.22 2.68 3.09 4.15 3.07 2.61 2.23 1.74
1989 432 2.46 25.32 1.89 2.48 2.8 3.66 2.75 2.36 2.01 1.59 50 2.36
1990 431 2.38 33.04 1.92 2.34 2.69 3.32 2.6 2.25 1.98 1.56
1991 413 2.36 23.07 2.04 2.36 2.54 3.39 2.66 2.29 2.04 1.65
1992 403 2.29 25.41 1.84 2.34 2.56 3.27 2.56 2.22 1.97 1.58
1993 392 2.42 24.48 2.13 2.4 2.62 3.38 2.7 2.38 2.04 1.7 56 2.43
1994 374 2.4 20.25 2.19 2.38 2.59 3.42 2.65 2.38 2.11 1.69 80 2.73
1995 310 2.44 23.87 2.12 2.39 2.76 3.35 2.64 2.36 2.1 1.69 88 2.94
1996 159 2.34 34.17 1.96 2.32 2.65 3.23 2.61 2.27 2.01 1.73 79 2.68
1997 158 2.42 22.14 2.12 2.47 2.56 3.44 2.64 2.4 2.13 1.8 87 2.93
1998 159 2.49 19.96 2.37 2.48 2.62 3.43 2.76 2.5 2.27 1.96 91 3.06
1999 165 2.44 25.75 2.17 2.48 2.63 3.57 2.72 2.41 2.16 1.73 92 3.16
2000 166 2.5 18322.51 2.39 2.45 2.71 3.6 2.74 2.46 2.2 1.76 89 3.18
2001 171 2.42 32.75 2.13 2.48 2.53 3.44 2.64 2.35 2.13 1.72 83 2.77
2002 171 2.31 40.39 2.03 2.31 2.62 3.4 2.51 2.21 2.06 1.74 76 2.52
2003 174 2.22 85.84 1.76 2.26 2.51 2.98 2.39 2.11 1.87 1.55 88 2.71
2004 176 2.25 77.86 1.92 2.25 2.55 3.15 2.46 2.18 1.93 1.72 84 2.65
2005 107 2.31 33.22 1.96 2.26 2.66 3.39 2.44 2.26 2.04 1.65
1980-1985 348 2.67 2.32 2.71 2.93 3.94 3.12 2.6 2.26 1.88
1986-1988 414 2.72 2.23 2.71 3.09 4.11 3.07 2.59 2.24 1.73
1989-1992 322 2.37 2.01 2.35 2.6 3.3 2.58 2.26 2.04 1.7
1993-1995 295 2.39 2.14 2.37 2.55 3.22 2.64 2.38 2.08 1.76 78 2.69
1996-1998 153 2.42 2.24 2.45 2.5 3.22 2.66 2.39 2.22 1.89 88 2.91
1999-2004 157 2.33 2.13 2.34 2.48 3.01 2.47 2.29 2.09 1.75 87 2.81
Midland Marketing Co-op PP BW 2005Jan6 exhibit.xls(GIPE Table) 1/7/2006
42
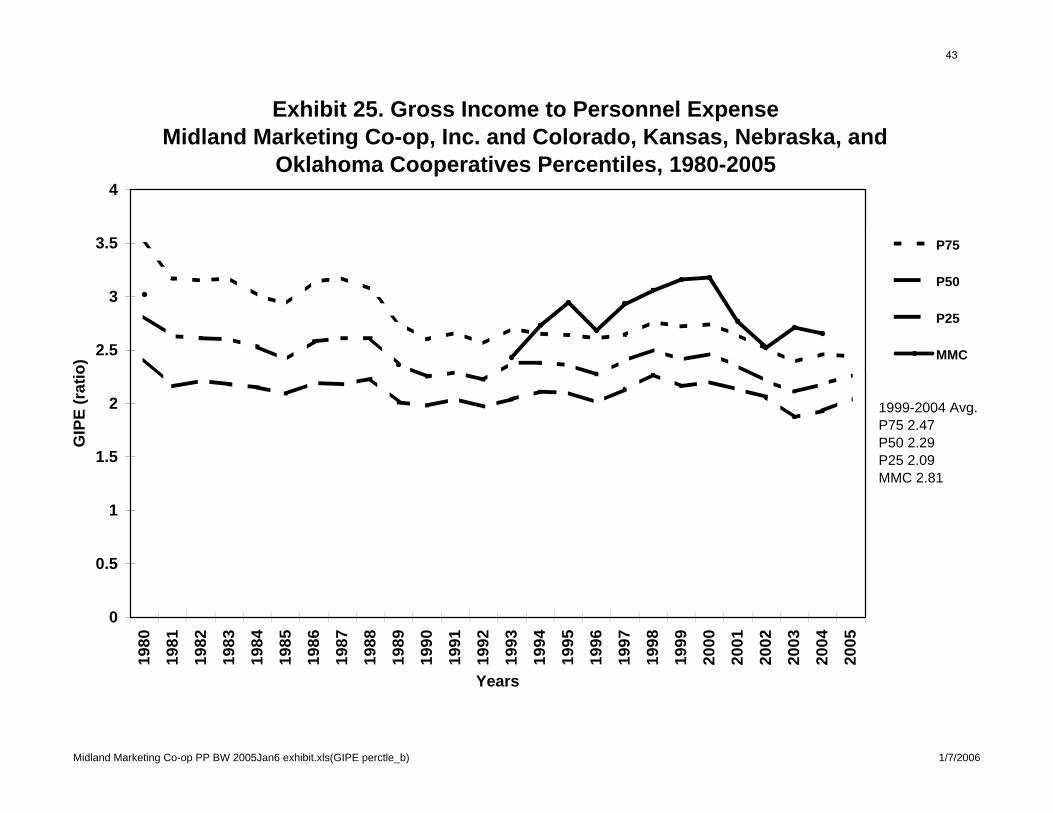
Midland Marketing Co-op PP BW 2005Jan6 exhibit.xls(GIPE perctle_b) 1/7/2006
Exhibit 25. Gross Income to Personnel ExpenseMidland Marketing Co-op, Inc. and Colorado, Kansas, Nebraska, and
Oklahoma Cooperatives Percentiles, 1980-2005
0
0.5
1
1.5
2
2.5
3
3.5
4
1980
1981
1982
1983
1984
1985
1986
1987
1988
1989
1990
1991
1992
1993
1994
1995
1996
1997
1998
1999
2000
2001
2002
2003
2004
2005
Years
GIP
E (r
atio
)
P75
P50
P25
MMC
1999-2004 Avg.P75 2.47P50 2.29P25 2.09MMC 2.81
43
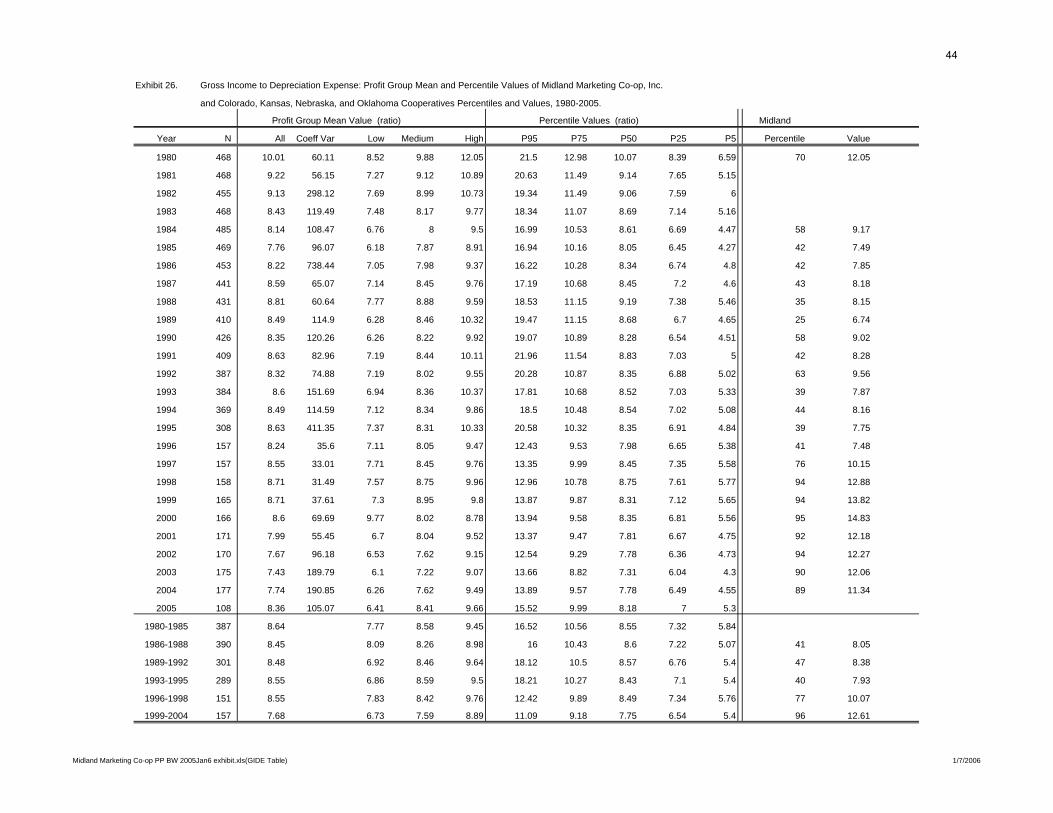
Exhibit 26. Gross Income to Depreciation Expense: Profit Group Mean and Percentile Values of Midland Marketing Co-op, Inc.
and Colorado, Kansas, Nebraska, and Oklahoma Cooperatives Percentiles and Values, 1980-2005.
Profit Group Mean Value (ratio) Percentile Values (ratio) Midland
Year N All Coeff Var Low Medium High P95 P75 P50 P25 P5 Percentile Value
1980 468 10.01 60.11 8.52 9.88 12.05 21.5 12.98 10.07 8.39 6.59 70 12.05
1981 468 9.22 56.15 7.27 9.12 10.89 20.63 11.49 9.14 7.65 5.15
1982 455 9.13 298.12 7.69 8.99 10.73 19.34 11.49 9.06 7.59 6
1983 468 8.43 119.49 7.48 8.17 9.77 18.34 11.07 8.69 7.14 5.16
1984 485 8.14 108.47 6.76 8 9.5 16.99 10.53 8.61 6.69 4.47 58 9.17
1985 469 7.76 96.07 6.18 7.87 8.91 16.94 10.16 8.05 6.45 4.27 42 7.49
1986 453 8.22 738.44 7.05 7.98 9.37 16.22 10.28 8.34 6.74 4.8 42 7.85
1987 441 8.59 65.07 7.14 8.45 9.76 17.19 10.68 8.45 7.2 4.6 43 8.18
1988 431 8.81 60.64 7.77 8.88 9.59 18.53 11.15 9.19 7.38 5.46 35 8.15
1989 410 8.49 114.9 6.28 8.46 10.32 19.47 11.15 8.68 6.7 4.65 25 6.74
1990 426 8.35 120.26 6.26 8.22 9.92 19.07 10.89 8.28 6.54 4.51 58 9.02
1991 409 8.63 82.96 7.19 8.44 10.11 21.96 11.54 8.83 7.03 5 42 8.28
1992 387 8.32 74.88 7.19 8.02 9.55 20.28 10.87 8.35 6.88 5.02 63 9.56
1993 384 8.6 151.69 6.94 8.36 10.37 17.81 10.68 8.52 7.03 5.33 39 7.87
1994 369 8.49 114.59 7.12 8.34 9.86 18.5 10.48 8.54 7.02 5.08 44 8.16
1995 308 8.63 411.35 7.37 8.31 10.33 20.58 10.32 8.35 6.91 4.84 39 7.75
1996 157 8.24 35.6 7.11 8.05 9.47 12.43 9.53 7.98 6.65 5.38 41 7.48
1997 157 8.55 33.01 7.71 8.45 9.76 13.35 9.99 8.45 7.35 5.58 76 10.15
1998 158 8.71 31.49 7.57 8.75 9.96 12.96 10.78 8.75 7.61 5.77 94 12.88
1999 165 8.71 37.61 7.3 8.95 9.8 13.87 9.87 8.31 7.12 5.65 94 13.82
2000 166 8.6 69.69 9.77 8.02 8.78 13.94 9.58 8.35 6.81 5.56 95 14.83
2001 171 7.99 55.45 6.7 8.04 9.52 13.37 9.47 7.81 6.67 4.75 92 12.18
2002 170 7.67 96.18 6.53 7.62 9.15 12.54 9.29 7.78 6.36 4.73 94 12.27
2003 175 7.43 189.79 6.1 7.22 9.07 13.66 8.82 7.31 6.04 4.3 90 12.06
2004 177 7.74 190.85 6.26 7.62 9.49 13.89 9.57 7.78 6.49 4.55 89 11.34
2005 108 8.36 105.07 6.41 8.41 9.66 15.52 9.99 8.18 7 5.3
1980-1985 387 8.64 7.77 8.58 9.45 16.52 10.56 8.55 7.32 5.84
1986-1988 390 8.45 8.09 8.26 8.98 16 10.43 8.6 7.22 5.07 41 8.05
1989-1992 301 8.48 6.92 8.46 9.64 18.12 10.5 8.57 6.76 5.4 47 8.38
1993-1995 289 8.55 6.86 8.59 9.5 18.21 10.27 8.43 7.1 5.4 40 7.93
1996-1998 151 8.55 7.83 8.42 9.76 12.42 9.89 8.49 7.34 5.76 77 10.07
1999-2004 157 7.68 6.73 7.59 8.89 11.09 9.18 7.75 6.54 5.4 96 12.61
Midland Marketing Co-op PP BW 2005Jan6 exhibit.xls(GIDE Table) 1/7/2006
44
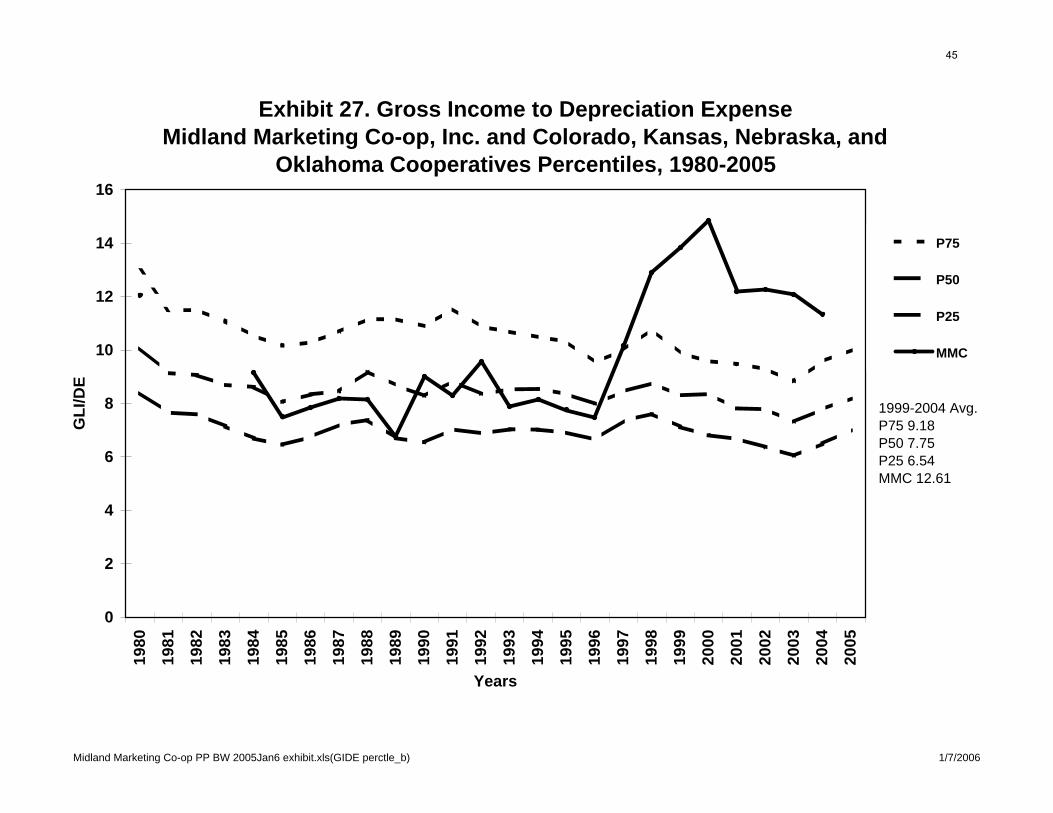
Midland Marketing Co-op PP BW 2005Jan6 exhibit.xls(GIDE perctle_b) 1/7/2006
Exhibit 27. Gross Income to Depreciation ExpenseMidland Marketing Co-op, Inc. and Colorado, Kansas, Nebraska, and
Oklahoma Cooperatives Percentiles, 1980-2005
0
2
4
6
8
10
12
14
16
1980
1981
1982
1983
1984
1985
1986
1987
1988
1989
1990
1991
1992
1993
1994
1995
1996
1997
1998
1999
2000
2001
2002
2003
2004
2005
Years
GLI
/DE
P75
P50
P25
MMC
1999-2004 Avg.P75 9.18P50 7.75P25 6.54MMC 12.61
45
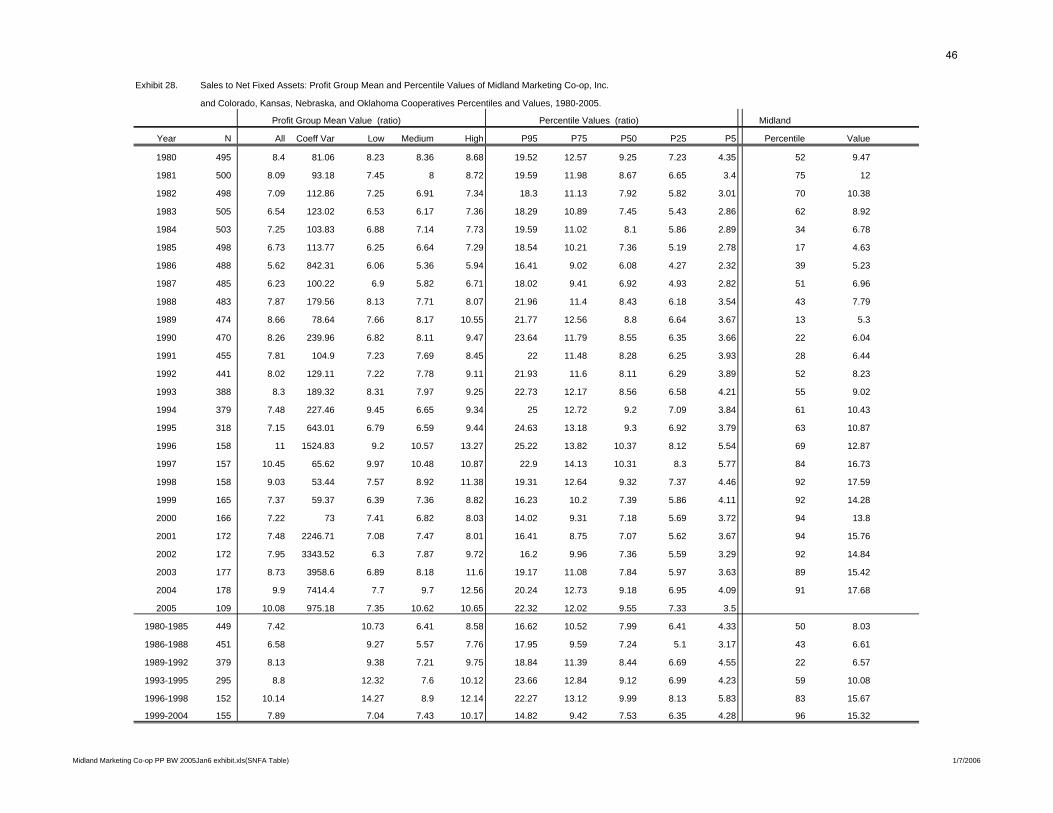
Exhibit 28. Sales to Net Fixed Assets: Profit Group Mean and Percentile Values of Midland Marketing Co-op, Inc.
and Colorado, Kansas, Nebraska, and Oklahoma Cooperatives Percentiles and Values, 1980-2005.
Profit Group Mean Value (ratio) Percentile Values (ratio) Midland
Year N All Coeff Var Low Medium High P95 P75 P50 P25 P5 Percentile Value
1980 495 8.4 81.06 8.23 8.36 8.68 19.52 12.57 9.25 7.23 4.35 52 9.47
1981 500 8.09 93.18 7.45 8 8.72 19.59 11.98 8.67 6.65 3.4 75 12
1982 498 7.09 112.86 7.25 6.91 7.34 18.3 11.13 7.92 5.82 3.01 70 10.38
1983 505 6.54 123.02 6.53 6.17 7.36 18.29 10.89 7.45 5.43 2.86 62 8.92
1984 503 7.25 103.83 6.88 7.14 7.73 19.59 11.02 8.1 5.86 2.89 34 6.78
1985 498 6.73 113.77 6.25 6.64 7.29 18.54 10.21 7.36 5.19 2.78 17 4.63
1986 488 5.62 842.31 6.06 5.36 5.94 16.41 9.02 6.08 4.27 2.32 39 5.23
1987 485 6.23 100.22 6.9 5.82 6.71 18.02 9.41 6.92 4.93 2.82 51 6.96
1988 483 7.87 179.56 8.13 7.71 8.07 21.96 11.4 8.43 6.18 3.54 43 7.79
1989 474 8.66 78.64 7.66 8.17 10.55 21.77 12.56 8.8 6.64 3.67 13 5.3
1990 470 8.26 239.96 6.82 8.11 9.47 23.64 11.79 8.55 6.35 3.66 22 6.04
1991 455 7.81 104.9 7.23 7.69 8.45 22 11.48 8.28 6.25 3.93 28 6.44
1992 441 8.02 129.11 7.22 7.78 9.11 21.93 11.6 8.11 6.29 3.89 52 8.23
1993 388 8.3 189.32 8.31 7.97 9.25 22.73 12.17 8.56 6.58 4.21 55 9.02
1994 379 7.48 227.46 9.45 6.65 9.34 25 12.72 9.2 7.09 3.84 61 10.43
1995 318 7.15 643.01 6.79 6.59 9.44 24.63 13.18 9.3 6.92 3.79 63 10.87
1996 158 11 1524.83 9.2 10.57 13.27 25.22 13.82 10.37 8.12 5.54 69 12.87
1997 157 10.45 65.62 9.97 10.48 10.87 22.9 14.13 10.31 8.3 5.77 84 16.73
1998 158 9.03 53.44 7.57 8.92 11.38 19.31 12.64 9.32 7.37 4.46 92 17.59
1999 165 7.37 59.37 6.39 7.36 8.82 16.23 10.2 7.39 5.86 4.11 92 14.28
2000 166 7.22 73 7.41 6.82 8.03 14.02 9.31 7.18 5.69 3.72 94 13.8
2001 172 7.48 2246.71 7.08 7.47 8.01 16.41 8.75 7.07 5.62 3.67 94 15.76
2002 172 7.95 3343.52 6.3 7.87 9.72 16.2 9.96 7.36 5.59 3.29 92 14.84
2003 177 8.73 3958.6 6.89 8.18 11.6 19.17 11.08 7.84 5.97 3.63 89 15.42
2004 178 9.9 7414.4 7.7 9.7 12.56 20.24 12.73 9.18 6.95 4.09 91 17.68
2005 109 10.08 975.18 7.35 10.62 10.65 22.32 12.02 9.55 7.33 3.5
1980-1985 449 7.42 10.73 6.41 8.58 16.62 10.52 7.99 6.41 4.33 50 8.03
1986-1988 451 6.58 9.27 5.57 7.76 17.95 9.59 7.24 5.1 3.17 43 6.61
1989-1992 379 8.13 9.38 7.21 9.75 18.84 11.39 8.44 6.69 4.55 22 6.57
1993-1995 295 8.8 12.32 7.6 10.12 23.66 12.84 9.12 6.99 4.23 59 10.08
1996-1998 152 10.14 14.27 8.9 12.14 22.27 13.12 9.99 8.13 5.83 83 15.67
1999-2004 155 7.89 7.04 7.43 10.17 14.82 9.42 7.53 6.35 4.28 96 15.32
Midland Marketing Co-op PP BW 2005Jan6 exhibit.xls(SNFA Table) 1/7/2006
46
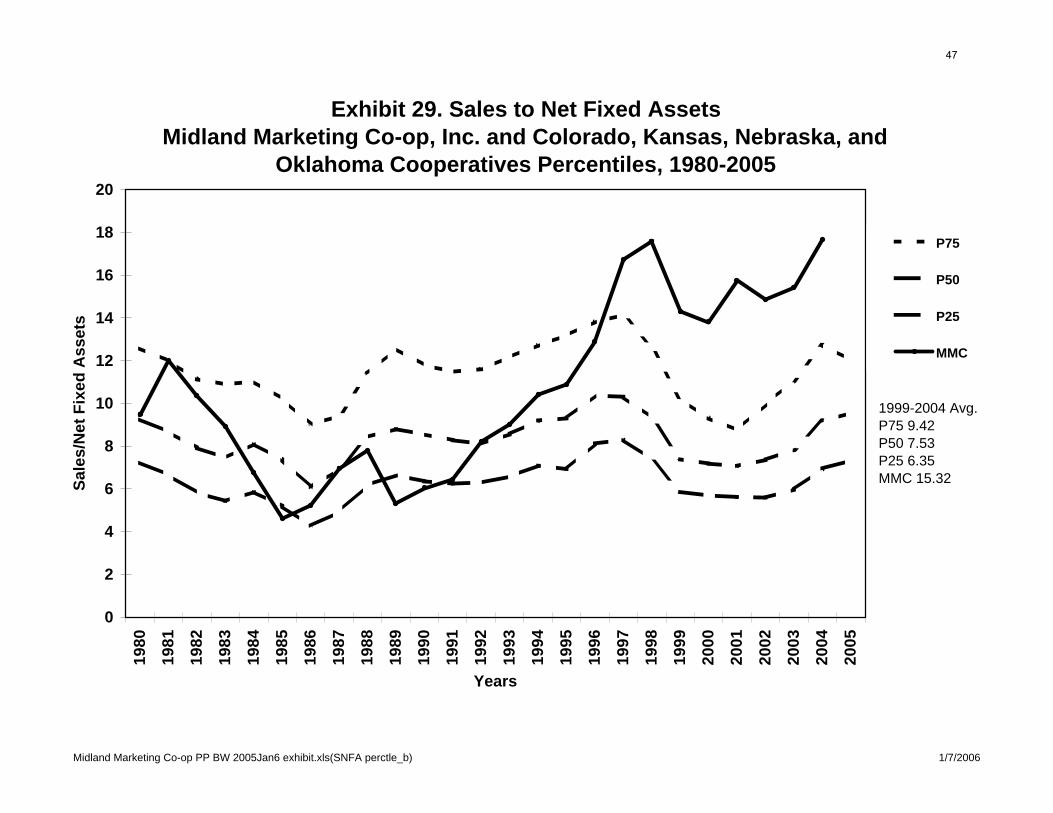
Midland Marketing Co-op PP BW 2005Jan6 exhibit.xls(SNFA perctle_b) 1/7/2006
Exhibit 29. Sales to Net Fixed AssetsMidland Marketing Co-op, Inc. and Colorado, Kansas, Nebraska, and
Oklahoma Cooperatives Percentiles, 1980-2005
0
2
4
6
8
10
12
14
16
18
20
1980
1981
1982
1983
1984
1985
1986
1987
1988
1989
1990
1991
1992
1993
1994
1995
1996
1997
1998
1999
2000
2001
2002
2003
2004
2005
Years
Sale
s/N
et F
ixed
Ass
ets
P75
P50
P25
MMC
1999-2004 Avg.P75 9.42P50 7.53P25 6.35MMC 15.32
47
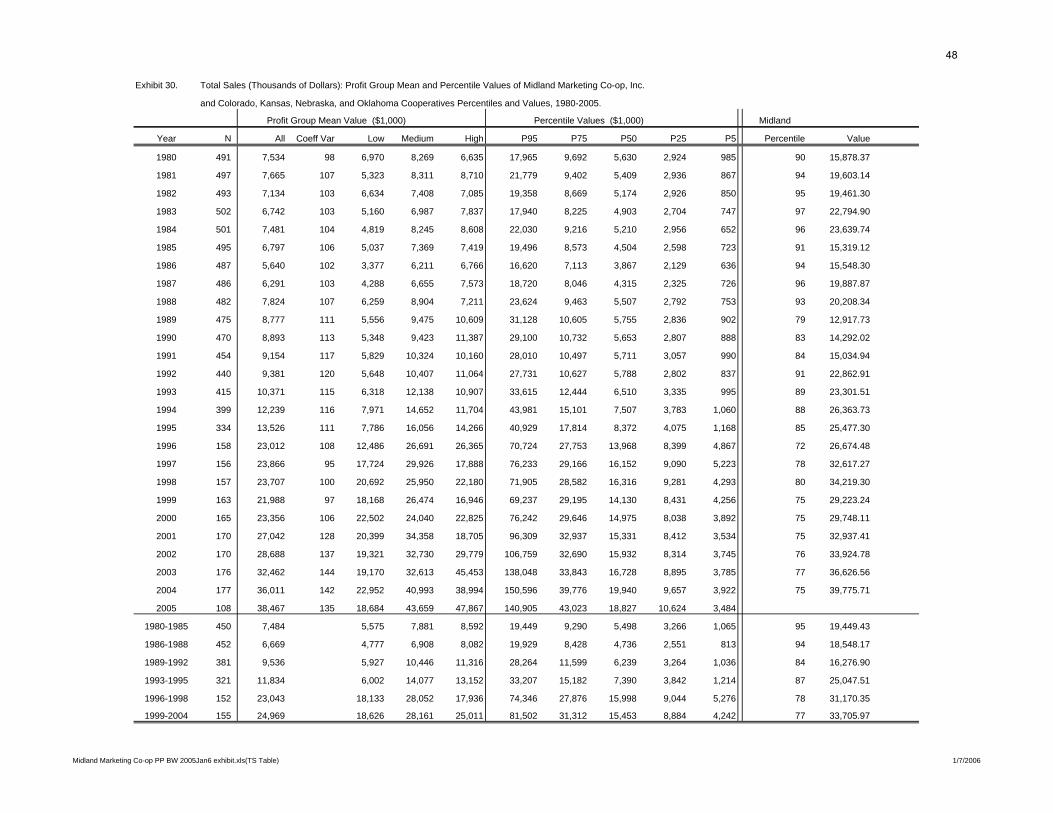
Exhibit 30. Total Sales (Thousands of Dollars): Profit Group Mean and Percentile Values of Midland Marketing Co-op, Inc.
and Colorado, Kansas, Nebraska, and Oklahoma Cooperatives Percentiles and Values, 1980-2005.
Profit Group Mean Value ($1,000) Percentile Values ($1,000) Midland
Year N All Coeff Var Low Medium High P95 P75 P50 P25 P5 Percentile Value
1980 491 7,534 98 6,970 8,269 6,635 17,965 9,692 5,630 2,924 985 90 15,878.37
1981 497 7,665 107 5,323 8,311 8,710 21,779 9,402 5,409 2,936 867 94 19,603.14
1982 493 7,134 103 6,634 7,408 7,085 19,358 8,669 5,174 2,926 850 95 19,461.30
1983 502 6,742 103 5,160 6,987 7,837 17,940 8,225 4,903 2,704 747 97 22,794.90
1984 501 7,481 104 4,819 8,245 8,608 22,030 9,216 5,210 2,956 652 96 23,639.74
1985 495 6,797 106 5,037 7,369 7,419 19,496 8,573 4,504 2,598 723 91 15,319.12
1986 487 5,640 102 3,377 6,211 6,766 16,620 7,113 3,867 2,129 636 94 15,548.30
1987 486 6,291 103 4,288 6,655 7,573 18,720 8,046 4,315 2,325 726 96 19,887.87
1988 482 7,824 107 6,259 8,904 7,211 23,624 9,463 5,507 2,792 753 93 20,208.34
1989 475 8,777 111 5,556 9,475 10,609 31,128 10,605 5,755 2,836 902 79 12,917.73
1990 470 8,893 113 5,348 9,423 11,387 29,100 10,732 5,653 2,807 888 83 14,292.02
1991 454 9,154 117 5,829 10,324 10,160 28,010 10,497 5,711 3,057 990 84 15,034.94
1992 440 9,381 120 5,648 10,407 11,064 27,731 10,627 5,788 2,802 837 91 22,862.91
1993 415 10,371 115 6,318 12,138 10,907 33,615 12,444 6,510 3,335 995 89 23,301.51
1994 399 12,239 116 7,971 14,652 11,704 43,981 15,101 7,507 3,783 1,060 88 26,363.73
1995 334 13,526 111 7,786 16,056 14,266 40,929 17,814 8,372 4,075 1,168 85 25,477.30
1996 158 23,012 108 12,486 26,691 26,365 70,724 27,753 13,968 8,399 4,867 72 26,674.48
1997 156 23,866 95 17,724 29,926 17,888 76,233 29,166 16,152 9,090 5,223 78 32,617.27
1998 157 23,707 100 20,692 25,950 22,180 71,905 28,582 16,316 9,281 4,293 80 34,219.30
1999 163 21,988 97 18,168 26,474 16,946 69,237 29,195 14,130 8,431 4,256 75 29,223.24
2000 165 23,356 106 22,502 24,040 22,825 76,242 29,646 14,975 8,038 3,892 75 29,748.11
2001 170 27,042 128 20,399 34,358 18,705 96,309 32,937 15,331 8,412 3,534 75 32,937.41
2002 170 28,688 137 19,321 32,730 29,779 106,759 32,690 15,932 8,314 3,745 76 33,924.78
2003 176 32,462 144 19,170 32,613 45,453 138,048 33,843 16,728 8,895 3,785 77 36,626.56
2004 177 36,011 142 22,952 40,993 38,994 150,596 39,776 19,940 9,657 3,922 75 39,775.71
2005 108 38,467 135 18,684 43,659 47,867 140,905 43,023 18,827 10,624 3,484
1980-1985 450 7,484 5,575 7,881 8,592 19,449 9,290 5,498 3,266 1,065 95 19,449.43
1986-1988 452 6,669 4,777 6,908 8,082 19,929 8,428 4,736 2,551 813 94 18,548.17
1989-1992 381 9,536 5,927 10,446 11,316 28,264 11,599 6,239 3,264 1,036 84 16,276.90
1993-1995 321 11,834 6,002 14,077 13,152 33,207 15,182 7,390 3,842 1,214 87 25,047.51
1996-1998 152 23,043 18,133 28,052 17,936 74,346 27,876 15,998 9,044 5,276 78 31,170.35
1999-2004 155 24,969 18,626 28,161 25,011 81,502 31,312 15,453 8,884 4,242 77 33,705.97
Midland Marketing Co-op PP BW 2005Jan6 exhibit.xls(TS Table) 1/7/2006
48
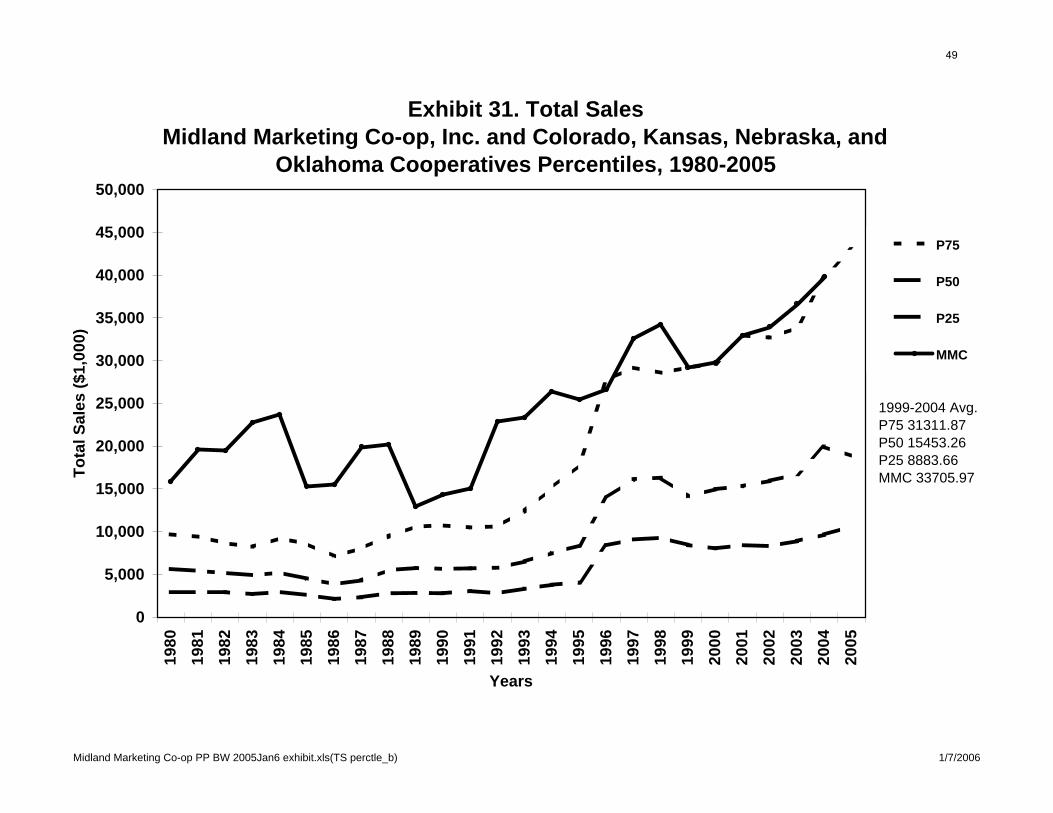
Midland Marketing Co-op PP BW 2005Jan6 exhibit.xls(TS perctle_b) 1/7/2006
Exhibit 31. Total SalesMidland Marketing Co-op, Inc. and Colorado, Kansas, Nebraska, and
Oklahoma Cooperatives Percentiles, 1980-2005
0
5,000
10,000
15,000
20,000
25,000
30,000
35,000
40,000
45,000
50,00019
8019
8119
8219
8319
8419
8519
8619
8719
8819
8919
9019
9119
9219
9319
9419
9519
9619
9719
9819
9920
0020
0120
0220
0320
0420
05
Years
Tota
l Sal
es ($
1,00
0)
P75
P50
P25
MMC
1999-2004 Avg.P75 31311.87P50 15453.26P25 8883.66MMC 33705.97
49