Embed Size (px)
Citation preview
GOOD PRACTICES IN CITY ENERGY EFFICIENCY
Campinas, Brazil –Energy Management in the Provision of Water Services
Energy Sector Management Assistance Program (ESMAP) reports are published to communicate the results of ESMAP’s work to the development community with the least possible delay. This document has not been
prepared in accordance with the procedures appropriate to formal documents. Some sources cited in this paper may be informal documents that are not readily available. The findings, interpretations, and conclusions expressed in this report are entirely those of the author(s) and should not be attributed in any manner to the World Bank, or its affiliated organizations, or to members of its board of executive directors for the countries they represent, or to ESMAP.
Campinas Case Study February 2011
ESMAP EECI Good Practices in Cities Page 1
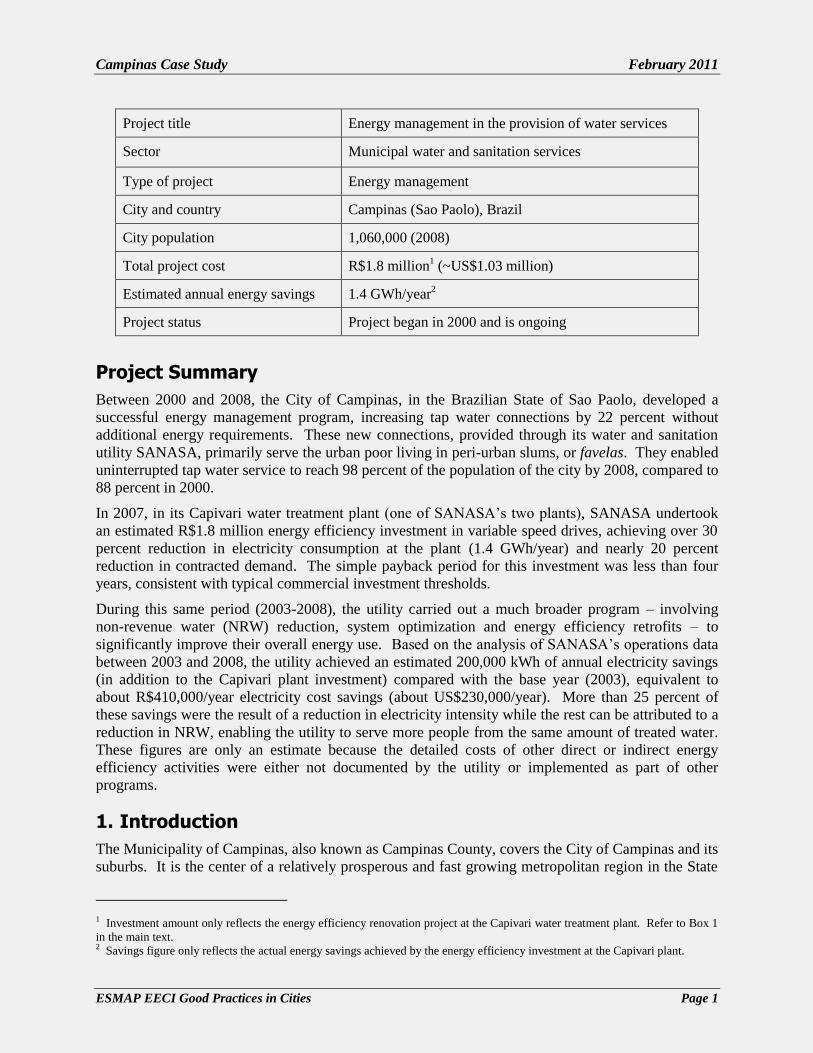
Project title Energy management in the provision of water services
Sector Municipal water and sanitation services
Type of project Energy management
City and country Campinas (Sao Paolo), Brazil
City population 1,060,000 (2008)
Total project cost R$1.8 million1 (~US$1.03 million)
Estimated annual energy savings 1.4 GWh/year2
Project status Project began in 2000 and is ongoing
Project Summary
Between 2000 and 2008, the City of Campinas, in the Brazilian State of Sao Paolo, developed a
successful energy management program, increasing tap water connections by 22 percent without
additional energy requirements. These new connections, provided through its water and sanitation
utility SANASA, primarily serve the urban poor living in peri-urban slums, or favelas. They enabled
uninterrupted tap water service to reach 98 percent of the population of the city by 2008, compared to
88 percent in 2000.
In 2007, in its Capivari water treatment plant (one of SANASA’s two plants), SANASA undertook
an estimated R$1.8 million energy efficiency investment in variable speed drives, achieving over 30
percent reduction in electricity consumption at the plant (1.4 GWh/year) and nearly 20 percent
reduction in contracted demand. The simple payback period for this investment was less than four
years, consistent with typical commercial investment thresholds.
During this same period (2003-2008), the utility carried out a much broader program – involving
non-revenue water (NRW) reduction, system optimization and energy efficiency retrofits – to
significantly improve their overall energy use. Based on the analysis of SANASA’s operations data
between 2003 and 2008, the utility achieved an estimated 200,000 kWh of annual electricity savings
(in addition to the Capivari plant investment) compared with the base year (2003), equivalent to
about R$410,000/year electricity cost savings (about US$230,000/year). More than 25 percent of
these savings were the result of a reduction in electricity intensity while the rest can be attributed to a
reduction in NRW, enabling the utility to serve more people from the same amount of treated water.
These figures are only an estimate because the detailed costs of other direct or indirect energy
efficiency activities were either not documented by the utility or implemented as part of other
programs.
1. Introduction
The Municipality of Campinas, also known as Campinas County, covers the City of Campinas and its
suburbs. It is the center of a relatively prosperous and fast growing metropolitan region in the State
1 Investment amount only reflects the energy efficiency renovation project at the Capivari water treatment plant. Refer to Box 1
in the main text. 2 Savings figure only reflects the actual energy savings achieved by the energy efficiency investment at the Capivari plant.
Campinas Case Study March 2011
ESMAP EECI Good Practices in Cities Page 2
of São Paulo, Brazil. The municipal population is over 98 percent urban and grew from 970,000 in
2000 to 1,060,000 in 2008. The surface area of the municipality is about 790 km2. The City of
Campinas is the richest city in the metropolitan region of Campinas and the 10th richest city in Brazil,
with a gross domestic product (GDP) of 27.1 billion reais3 (2007), about 0.96% of Brazil’s total GDP.
Currently, one-third of industrial production of the State of São Paulo is concentrated in the city of
Campinas. With high tech industries and a metallurgical park, it is considered the capital of Silicon
Valley Sterling.
SANASA (Sociedade de Abastecimento de Água e Saneamento S.A.), established in 1974 and owned
by the municipal government, provides water and sewage collection and treatment services in the
Municipality of Campinas. Raw water is provided from two surface water sources. About 95
percent of the treated water is produced at the Atibaia plant and the remaining 5 percent at the
Capivari plant. The topography of the service area is gently undulating. In 2000, the utility served
some 205,000 customers with about an 88 percent access rate for treated water. While they had
undertaken some measures to reduce NRW, the utility still reported 26.5 percent NRW in 2000.
Electricity costs as a percent of the total operation and maintenance (O&M) costs were relatively low,
at about 6.4 percent, but were rising. The prevailing water tariff was about R$1.19/m3 in 2000 and
had been rising steadily.
SANASA was concerned with the rising costs of electricity, which was a key motivation for
undertaking the activities associated with energy optimization. Electricity prices increased
significantly until 2006 due, in part, to an acute nationwide power crisis. The utility saw the
importance of energy efficiency since it could have a potentially large impact on its financial
performance and service quality vis-à-vis tariff levels and was concerned about its public image.
Also, as water nominal tariffs continued to rise, there was increasing pressure on the utility to reduce
operation costs (either through NRW reductions or energy efficiency) in order to help limit the tariff
increases.
2. Project Description and Design
This case study examines major activities which (directly or indirectly) contributed to the energy
efficiency improvements at SANASA between 2000 and 2008. As it does not represent a specific
project or investment program, the case study provides a broader perspective on how a water and
sanitation utility can be organized and can mobilize resources to address a range of issues affecting
its operational efficiency, and energy efficiency in particular.
Water production and access. Over the eight year period, SANASA increased the number of treated
water connections from 205,000 to 252,000 (2008), much faster than the population growth during
the same period (22 versus 9 percent, respectively). The major reason behind this trend was the
increased connections to the urban poor in the slum areas, or favelas. By 2008, the utility served 98
percent of the municipal population with treated water and 88 percent with sewage collection, with
all connections metered. Between 2000 and 2008, the length of the water supply network grew by
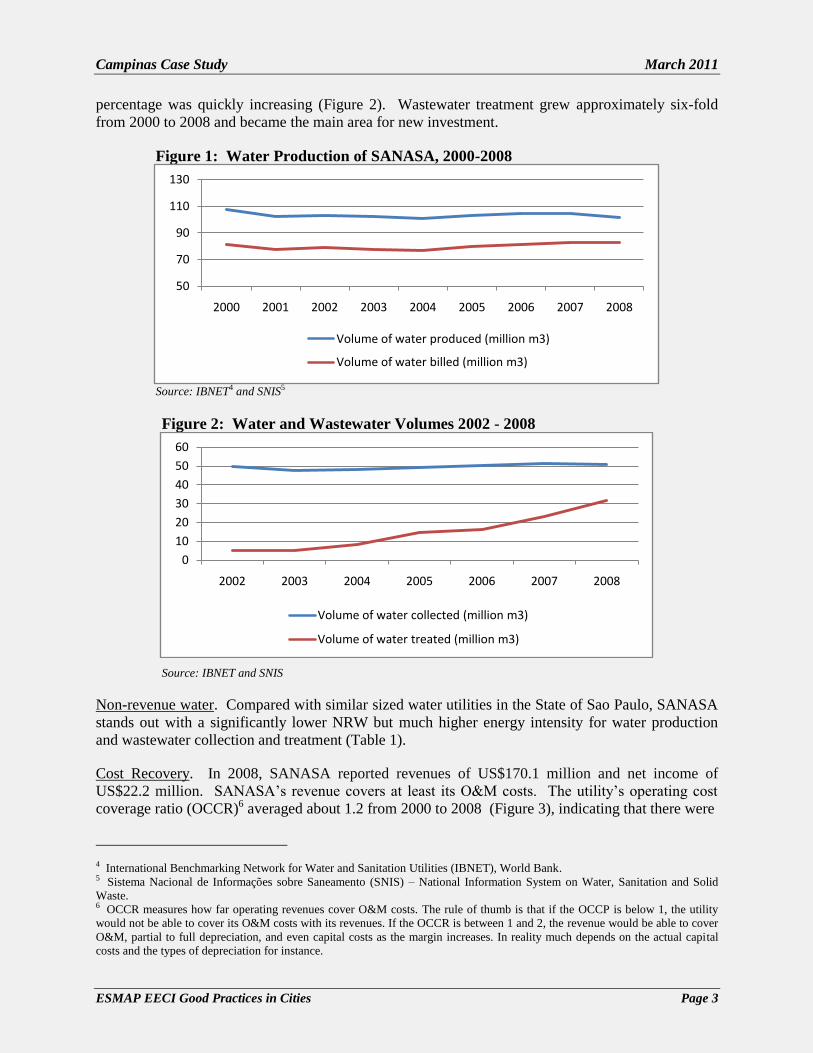
almost 16 percent while total water production was moderately reduced (Figure 1).
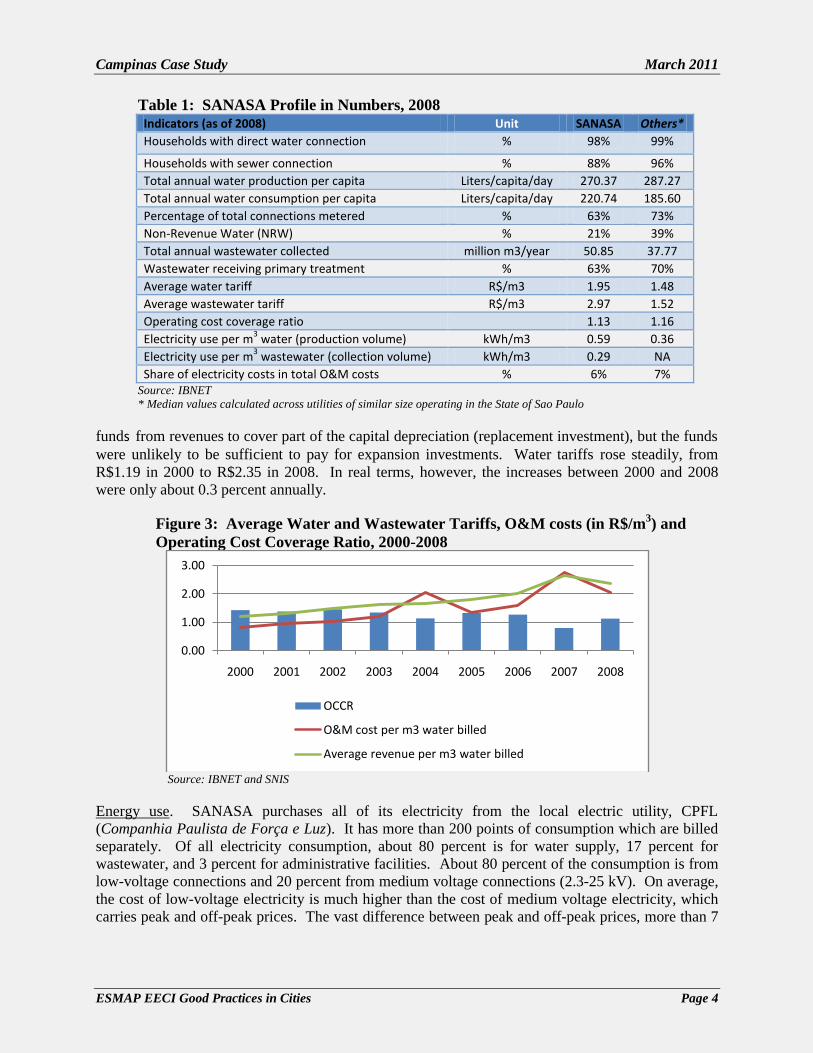
The expansion of the collection and treatment of wastewater has lagged far behind the supply of
treated water since SANASA only started to treat wastewater in 2001/2002 (although wastewater
collection started earlier). In 2008, only 60 percent of the billed water consumption was collected.
At that time, only about 60 percent of the collected wastewater was actually treated but the
3 In 2008, one Brazilian reais (R$1) was equivalent to about US$0.57 (annual average).
Campinas Case Study March 2011
ESMAP EECI Good Practices in Cities Page 3
percentage was quickly increasing (Figure 2). Wastewater treatment grew approximately six-fold
from 2000 to 2008 and became the main area for new investment.
Figure 1: Water Production of SANASA, 2000-2008
Source: IBNET4 and SNIS5
Figure 2: Water and Wastewater Volumes 2002 - 2008
Source: IBNET and SNIS
Non-revenue water. Compared with similar sized water utilities in the State of Sao Paulo, SANASA
stands out with a significantly lower NRW but much higher energy intensity for water production
and wastewater collection and treatment (Table 1).
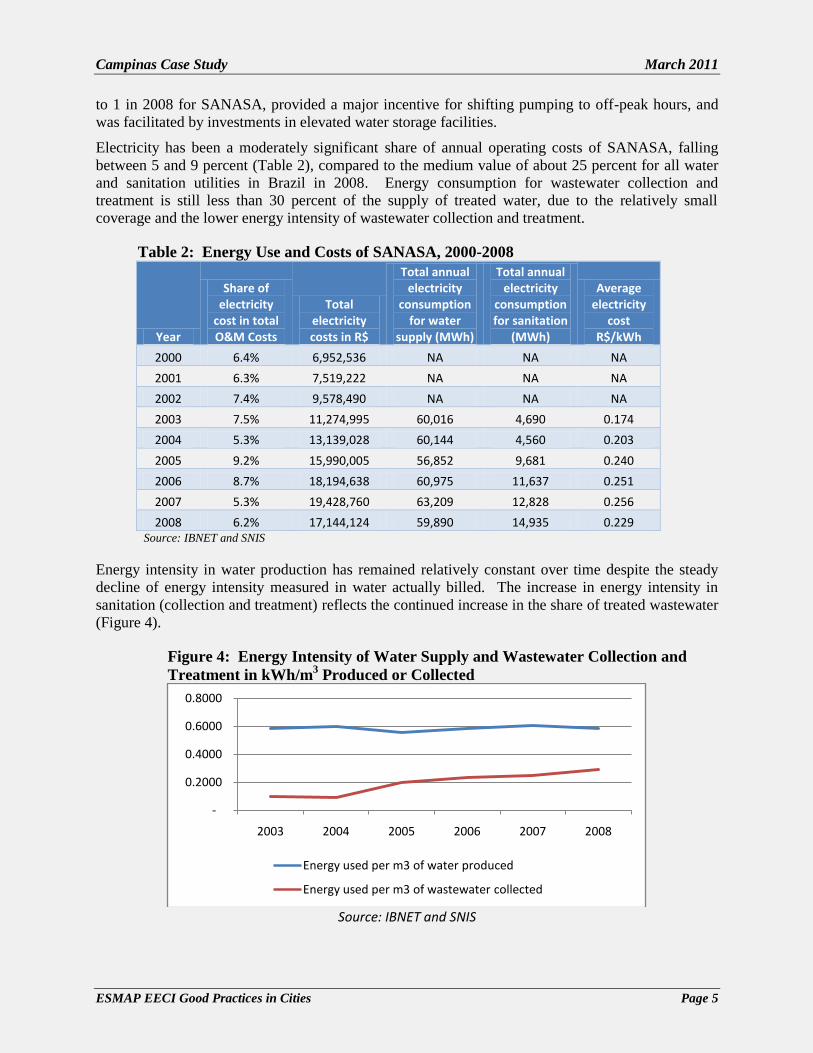
Cost Recovery. In 2008, SANASA reported revenues of US$170.1 million and net income of
US$22.2 million. SANASA’s revenue covers at least its O&M costs. The utility’s operating cost
coverage ratio (OCCR)6 averaged about 1.2 from 2000 to 2008 (Figure 3), indicating that there were
4 International Benchmarking Network for Water and Sanitation Utilities (IBNET), World Bank. 5 Sistema Nacional de Informações sobre Saneamento (SNIS) – National Information System on Water, Sanitation and Solid
Waste. 6 OCCR measures how far operating revenues cover O&M costs. The rule of thumb is that if the OCCP is below 1, the utility
would not be able to cover its O&M costs with its revenues. If the OCCR is between 1 and 2, the revenue would be able to cover
O&M, partial to full depreciation, and even capital costs as the margin increases. In reality much depends on the actual capital
costs and the types of depreciation for instance.
50
70
90
110
130
2000 2001 2002 2003 2004 2005 2006 2007 2008
Volume of water produced (million m3)
Volume of water billed (million m3)
0
10
20
30
40
50
60
2002 2003 2004 2005 2006 2007 2008
Volume of water collected (million m3)
Volume of water treated (million m3)
Campinas Case Study March 2011
ESMAP EECI Good Practices in Cities Page 4
Table 1: SANASA Profile in Numbers, 2008 Indicators (as of 2008) Unit SANASA Others*
Households with direct water connection % 98% 99%
Households with sewer connection % 88% 96%
Total annual water production per capita Liters/capita/day 270.37 287.27
Total annual water consumption per capita Liters/capita/day 220.74 185.60
Percentage of total connections metered % 63% 73%
Non-Revenue Water (NRW) % 21% 39%
Total annual wastewater collected million m3/year 50.85 37.77
Wastewater receiving primary treatment % 63% 70%
Average water tariff R$/m3 1.95 1.48
Average wastewater tariff R$/m3 2.97 1.52
Operating cost coverage ratio 1.13 1.16
Electricity use per m3 water (production volume) kWh/m3 0.59 0.36
Electricity use per m3 wastewater (collection volume) kWh/m3 0.29 NA
Share of electricity costs in total O&M costs % 6% 7% Source: IBNET
* Median values calculated across utilities of similar size operating in the State of Sao Paulo
funds from revenues to cover part of the capital depreciation (replacement investment), but the funds
were unlikely to be sufficient to pay for expansion investments. Water tariffs rose steadily, from
R$1.19 in 2000 to R$2.35 in 2008. In real terms, however, the increases between 2000 and 2008
were only about 0.3 percent annually.
Figure 3: Average Water and Wastewater Tariffs, O&M costs (in R$/m3) and
Operating Cost Coverage Ratio, 2000-2008
Source: IBNET and SNIS
Energy use. SANASA purchases all of its electricity from the local electric utility, CPFL
(Companhia Paulista de Força e Luz). It has more than 200 points of consumption which are billed
separately. Of all electricity consumption, about 80 percent is for water supply, 17 percent for
wastewater, and 3 percent for administrative facilities. About 80 percent of the consumption is from
low-voltage connections and 20 percent from medium voltage connections (2.3-25 kV). On average,
the cost of low-voltage electricity is much higher than the cost of medium voltage electricity, which
carries peak and off-peak prices. The vast difference between peak and off-peak prices, more than 7
0.00
1.00
2.00
3.00
2000 2001 2002 2003 2004 2005 2006 2007 2008
OCCR
O&M cost per m3 water billed
Average revenue per m3 water billed
Campinas Case Study March 2011
ESMAP EECI Good Practices in Cities Page 5
to 1 in 2008 for SANASA, provided a major incentive for shifting pumping to off-peak hours, and
was facilitated by investments in elevated water storage facilities.
Electricity has been a moderately significant share of annual operating costs of SANASA, falling
between 5 and 9 percent (Table 2), compared to the medium value of about 25 percent for all water
and sanitation utilities in Brazil in 2008. Energy consumption for wastewater collection and
treatment is still less than 30 percent of the supply of treated water, due to the relatively small
coverage and the lower energy intensity of wastewater collection and treatment.
Table 2: Energy Use and Costs of SANASA, 2000-2008
Year
Share of electricity
cost in total O&M Costs
Total electricity costs in R$
Total annual electricity
consumption for water
supply (MWh)
Total annual electricity
consumption for sanitation
(MWh)
Average electricity
cost R$/kWh
2000 6.4% 6,952,536 NA NA NA
2001 6.3% 7,519,222 NA NA NA
2002 7.4% 9,578,490 NA NA NA
2003 7.5% 11,274,995 60,016 4,690 0.174
2004 5.3% 13,139,028 60,144 4,560 0.203
2005 9.2% 15,990,005 56,852 9,681 0.240
2006 8.7% 18,194,638 60,975 11,637 0.251
2007 5.3% 19,428,760 63,209 12,828 0.256
2008 6.2% 17,144,124 59,890 14,935 0.229 Source: IBNET and SNIS
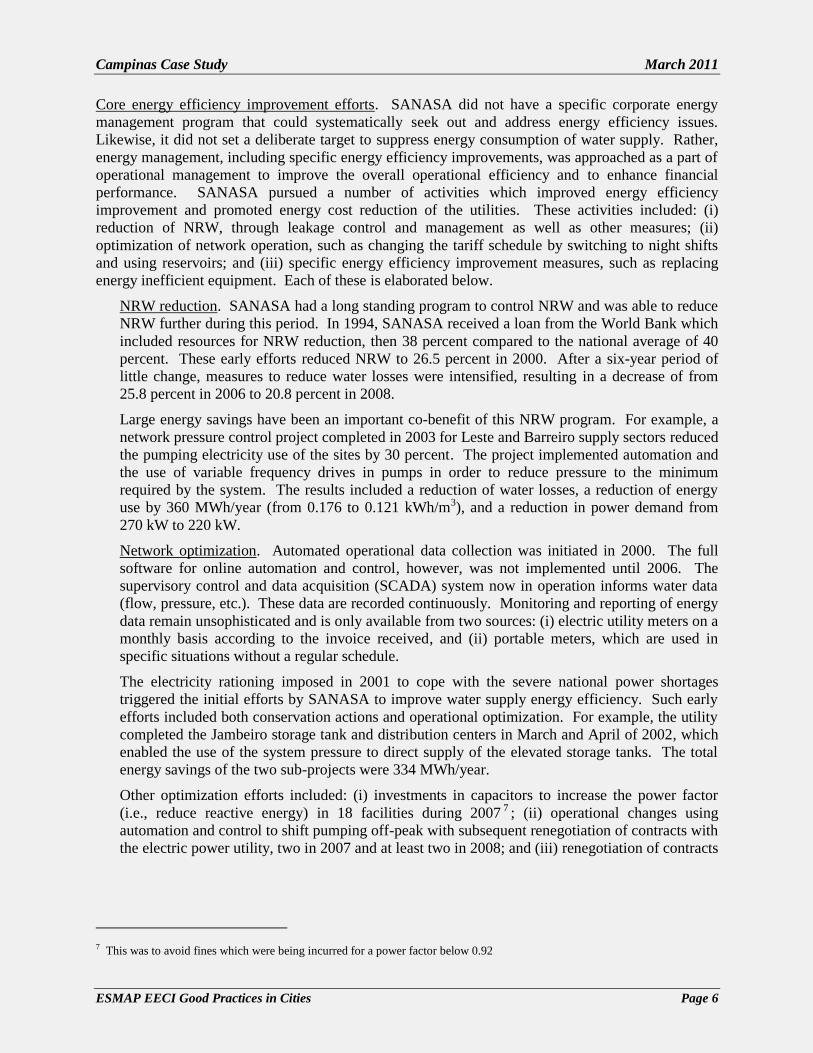
Energy intensity in water production has remained relatively constant over time despite the steady
decline of energy intensity measured in water actually billed. The increase in energy intensity in
sanitation (collection and treatment) reflects the continued increase in the share of treated wastewater
(Figure 4).
Figure 4: Energy Intensity of Water Supply and Wastewater Collection and
Treatment in kWh/m3 Produced or Collected
Source: IBNET and SNIS
-
0.2000
0.4000
0.6000
0.8000
2003 2004 2005 2006 2007 2008
Energy used per m3 of water produced
Energy used per m3 of wastewater collected
Campinas Case Study March 2011
ESMAP EECI Good Practices in Cities Page 6
Core energy efficiency improvement efforts. SANASA did not have a specific corporate energy
management program that could systematically seek out and address energy efficiency issues.
Likewise, it did not set a deliberate target to suppress energy consumption of water supply. Rather,
energy management, including specific energy efficiency improvements, was approached as a part of
operational management to improve the overall operational efficiency and to enhance financial
performance. SANASA pursued a number of activities which improved energy efficiency
improvement and promoted energy cost reduction of the utilities. These activities included: (i)
reduction of NRW, through leakage control and management as well as other measures; (ii)
optimization of network operation, such as changing the tariff schedule by switching to night shifts
and using reservoirs; and (iii) specific energy efficiency improvement measures, such as replacing
energy inefficient equipment. Each of these is elaborated below.
NRW reduction. SANASA had a long standing program to control NRW and was able to reduce
NRW further during this period. In 1994, SANASA received a loan from the World Bank which
included resources for NRW reduction, then 38 percent compared to the national average of 40
percent. These early efforts reduced NRW to 26.5 percent in 2000. After a six-year period of
little change, measures to reduce water losses were intensified, resulting in a decrease of from
25.8 percent in 2006 to 20.8 percent in 2008.
Large energy savings have been an important co-benefit of this NRW program. For example, a
network pressure control project completed in 2003 for Leste and Barreiro supply sectors reduced
the pumping electricity use of the sites by 30 percent. The project implemented automation and
the use of variable frequency drives in pumps in order to reduce pressure to the minimum
required by the system. The results included a reduction of water losses, a reduction of energy
use by 360 MWh/year (from 0.176 to 0.121 kWh/m3), and a reduction in power demand from
270 kW to 220 kW.
Network optimization. Automated operational data collection was initiated in 2000. The full
software for online automation and control, however, was not implemented until 2006. The
supervisory control and data acquisition (SCADA) system now in operation informs water data
(flow, pressure, etc.). These data are recorded continuously. Monitoring and reporting of energy
data remain unsophisticated and is only available from two sources: (i) electric utility meters on a
monthly basis according to the invoice received, and (ii) portable meters, which are used in
specific situations without a regular schedule.
The electricity rationing imposed in 2001 to cope with the severe national power shortages
triggered the initial efforts by SANASA to improve water supply energy efficiency. Such early
efforts included both conservation actions and operational optimization. For example, the utility
completed the Jambeiro storage tank and distribution centers in March and April of 2002, which
enabled the use of the system pressure to direct supply of the elevated storage tanks. The total
energy savings of the two sub-projects were 334 MWh/year.
Other optimization efforts included: (i) investments in capacitors to increase the power factor
(i.e., reduce reactive energy) in 18 facilities during 2007 7 ; (ii) operational changes using
automation and control to shift pumping off-peak with subsequent renegotiation of contracts with
the electric power utility, two in 2007 and at least two in 2008; and (iii) renegotiation of contracts
7 This was to avoid fines which were being incurred for a power factor below 0.92
Campinas Case Study March 2011
ESMAP EECI Good Practices in Cities Page 7
with the power utility to shift from the “Blue” tariff schedule to the “Green” tariff schedule in 17
facilities in 2007, one in 2008.8
Energy efficiency measures. Distinct programs to improve energy efficiency were also initiated,
gradually building upon the monitoring and control systems used for water loss management
operations. Since 2007, the main energy efficiency measures have been:
A significant investment in energy efficiency was made at the Capivari water catchment
and treatment plant (Box 1). The investment of R$1.8 million was made with resources
provided by the local power utility CPFL under the EEP program mandated by ANEEL -
the power sector regulator.9
The Maintenance Department planned to invest R$600,000 in 2010 to replace standard
motors with high efficiency motors and R$90,000 for electricity meters for energy
management. The investment in meters represents an important deepening of energy
monitoring capability.
Box 1. The Capivari Water Treatment Plant Energy Efficiency Project
Rationale for efficiency improvements. The increasing cost of electricity has been the key motivation
for undertaking the activities associated energy optimization. Electricity prices increased
significantly until 2006. Since then, nominal electricity prices have only increased by about 2
percent. The utility values activities, which have a large impact on its financial performances and
8 There are two variants of the medium voltage tariff: the Blue tariff and the Green tariff. In both of these tariff schedules peak
power is far more expensive than off-peak power. The Blue tariff has two capacity prices - peak and off-peak and four energy
prices distinguished by season (dry and humid). It is the dominant choice for flat users, load profile typical of processes
industries. On the other hand, the Green tariff has a single capacity charge and the same energy price structure of the Blue tariff.
The Green tariff is designed as an alternative to users with an intermediate load or variable load at peak hours. If a consumer can
get its load factor low enough it has an incentive to shift to the Green tariff which, unlike the Blue tariff, does not apply specific
demand charge for the peak usage. 9 The mandatory energy efficiency program (EEP) for power distribution utilities overseen by the power sector regulator
ANEEL. Under the EEP electric distribution utilities must spend 0.5% of their gross revenue on energy efficiency projects with
consumers. A few have been performed with water utilities, including this one at SANASA.
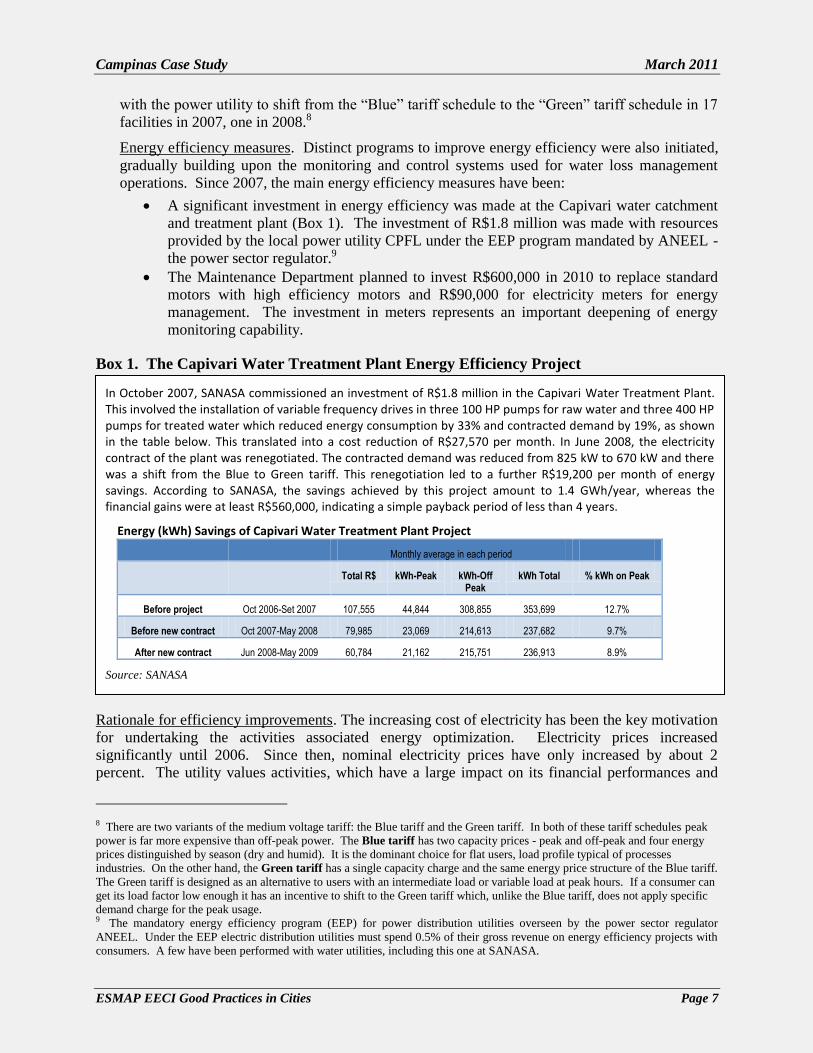
In October 2007, SANASA commissioned an investment of R$1.8 million in the Capivari Water Treatment Plant. This involved the installation of variable frequency drives in three 100 HP pumps for raw water and three 400 HP pumps for treated water which reduced energy consumption by 33% and contracted demand by 19%, as shown in the table below. This translated into a cost reduction of R$27,570 per month. In June 2008, the electricity contract of the plant was renegotiated. The contracted demand was reduced from 825 kW to 670 kW and there was a shift from the Blue to Green tariff. This renegotiation led to a further R$19,200 per month of energy savings. According to SANASA, the savings achieved by this project amount to 1.4 GWh/year, whereas the financial gains were at least R$560,000, indicating a simple payback period of less than 4 years.
Energy (kWh) Savings of Capivari Water Treatment Plant Project
Monthly average in each period
Total R$ kWh-Peak kWh-Off Peak
kWh Total % kWh on Peak
Before project Oct 2006-Set 2007 107,555 44,844 308,855 353,699 12.7%
Before new contract Oct 2007-May 2008 79,985 23,069 214,613 237,682 9.7%
After new contract Jun 2008-May 2009 60,784 21,162 215,751 236,913 8.9%
Source: SANASA
Campinas Case Study March 2011
ESMAP EECI Good Practices in Cities Page 8
service quality vis-à-vis tariff levels, and is concerned about its public image (Table 3). As water
nominal tariffs have doubled since 2000, there is more pressure on the utility to reduce operation
costs (either through NRW reductions or energy efficiency) to keep the tariff increases limited.
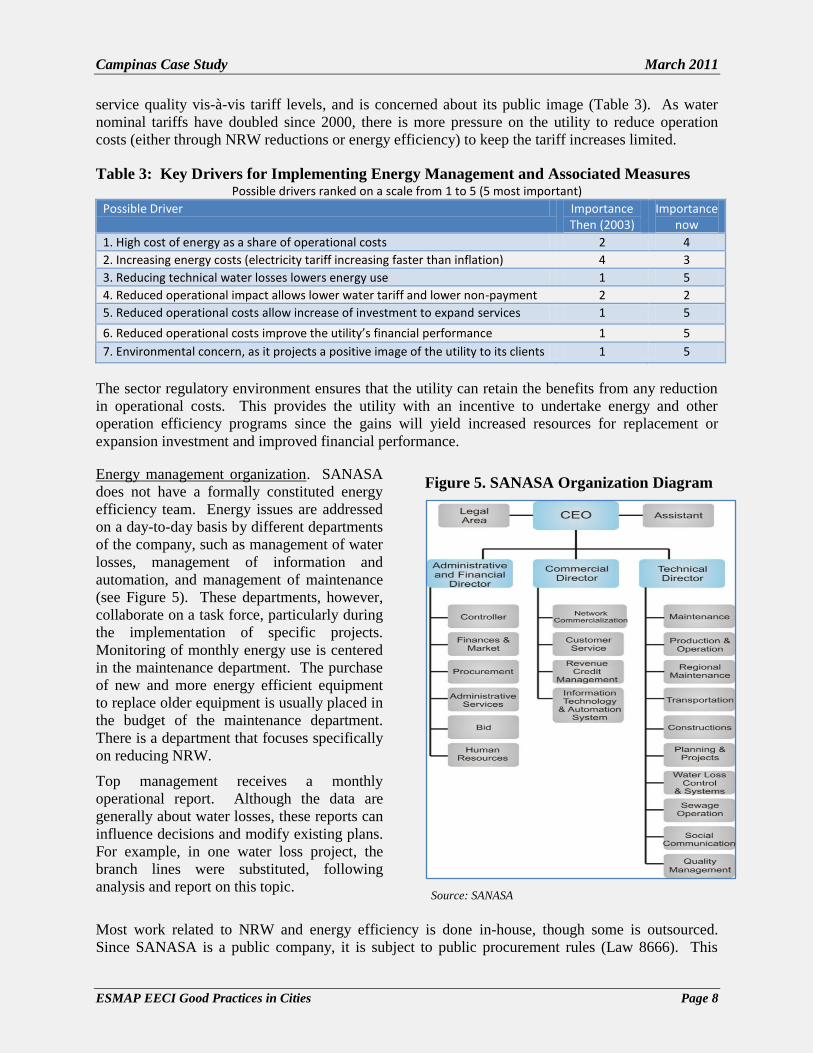
Table 3: Key Drivers for Implementing Energy Management and Associated Measures Possible drivers ranked on a scale from 1 to 5 (5 most important)
Possible Driver Importance Then (2003)
Importance now
1. High cost of energy as a share of operational costs 2 4
2. Increasing energy costs (electricity tariff increasing faster than inflation) 4 3
3. Reducing technical water losses lowers energy use 1 5
4. Reduced operational impact allows lower water tariff and lower non-payment 2 2
5. Reduced operational costs allow increase of investment to expand services 1 5
6. Reduced operational costs improve the utility’s financial performance 1 5
7. Environmental concern, as it projects a positive image of the utility to its clients 1 5
The sector regulatory environment ensures that the utility can retain the benefits from any reduction
in operational costs. This provides the utility with an incentive to undertake energy and other
operation efficiency programs since the gains will yield increased resources for replacement or
expansion investment and improved financial performance.
Energy management organization. SANASA
does not have a formally constituted energy
efficiency team. Energy issues are addressed
on a day-to-day basis by different departments
of the company, such as management of water
losses, management of information and
automation, and management of maintenance
(see Figure 5). These departments, however,
collaborate on a task force, particularly during
the implementation of specific projects.
Monitoring of monthly energy use is centered
in the maintenance department. The purchase
of new and more energy efficient equipment
to replace older equipment is usually placed in
the budget of the maintenance department.
There is a department that focuses specifically
on reducing NRW.
Top management receives a monthly
operational report. Although the data are
generally about water losses, these reports can
influence decisions and modify existing plans.
For example, in one water loss project, the
branch lines were substituted, following
analysis and report on this topic.
Figure 5. SANASA Organization Diagram
Source: SANASA
Most work related to NRW and energy efficiency is done in-house, though some is outsourced.
Since SANASA is a public company, it is subject to public procurement rules (Law 8666). This
Campinas Case Study March 2011
ESMAP EECI Good Practices in Cities Page 10
makes obtaining the best value for goods and services difficult. Life cycle costing is still not feasible
in public bids. The government accounting monitors regard almost any minimum technical standard
as an unwarranted restraint on competition.
3. Cost, Financing, Benefits, and Effects
Information regarding the share of investment from SANASA’s internal cash flow and other external
sources was not available. Therefore, this case study relied on the figures for the Capivari project as
a proxy to analyze the cost-effectiveness of energy efficiency investments in SANASA.
Because the utility is only able to cover its operating costs and part of its depreciation costs, it has
limited funds to initiate all the necessary upgrades. As a result, it has invested far more of its funds
in water loss reduction than in energy efficiency. The utility has limited capacity to borrow and, in
general, its primary source of credit is Caixa Econômica Federal, a government-owned financial
institution. Both energy efficiency and water loss reduction projects were financed by a combination
of internal cash flow and external resources (loans and grants):
The Capivari project was financed by CPFL (the local electric utility) under the mandatory
public benefit wire charge overseen by the power regulator, ANEEL (Agência Nacional de
Energia Elétrica);
Water meters were financed by Banco Nacional de Desenvolvimento Economico e Social
(BNDES, a government-owned development bank) and using its own funds;
Some pipeline replacement was financed by the Inter-America Development Bank (IADB);
and
Other measures have been financed by Caixa Econômica Federal and BNDES, though a
NRW loss program was funded from an earlier World Bank loan10.
Cost-effectiveness. By far the largest energy cost savings resulted from reducing water losses and
renegotiating contracts – especially shifting from the Blue to the Green tariff. In the case of the
Capivari project, the tariff shift represented 40 percent of the overall benefit. In the view of
SANASA, the potential for further cost savings from shifting contracts to the Green schedule has
now been exhausted.
There were insufficient data and information to allow a robust analysis of the costs and benefits of all
activities in NRW reduction and energy efficiency improvement during the 2000-2008 period.
Judging by the type of projects undertaken by SANASA based on broader international experiences
of similar activities, the benefits are likely to be significantly larger than the costs. By SANASA’s
own account, the energy efficiency and NRW projects undertaken to date were reported to have had
simple payback periods of four years or less since they are subject to commercial investment
thresholds.
Impacts on energy consumption. One approach to the evaluation of the impact of NRW and energy
efficiency activities on energy consumption (i.e. avoided energy consumption derived from a
baseline which did not materialize because of the implementation of the activities) is to analyze their
impact on the energy intensity coefficients of the utility for water supply and wastewater treatment.
A first rapid analysis is to determine what happened since 2003, the first year that energy
consumption data are available, making a before and after analysis assuming that the trends of 2003
would have continued.
10 SANASA also manages three Brazilian Government’s Growth Acceleration Plan (called PAC) projects, but these are for
expansion of the system – especially to expand wastewater treatment.
Campinas Case Study March 2011
ESMAP EECI Good Practices in Cities Page 11
Because of decreases in NRW, less water production is necessary. Remarkably, SANASA, which is
still expanding its water supply and wastewater services, saw a decline in NRW allowing it to expand
water supply without increasing water production or energy consumption. Another effect is the
decline in actual energy intensity as measured by energy consumption per cubic meter of water
produced or wastewater treated. Energy intensity declined by 3 percent over the period between
2003 and 2008.
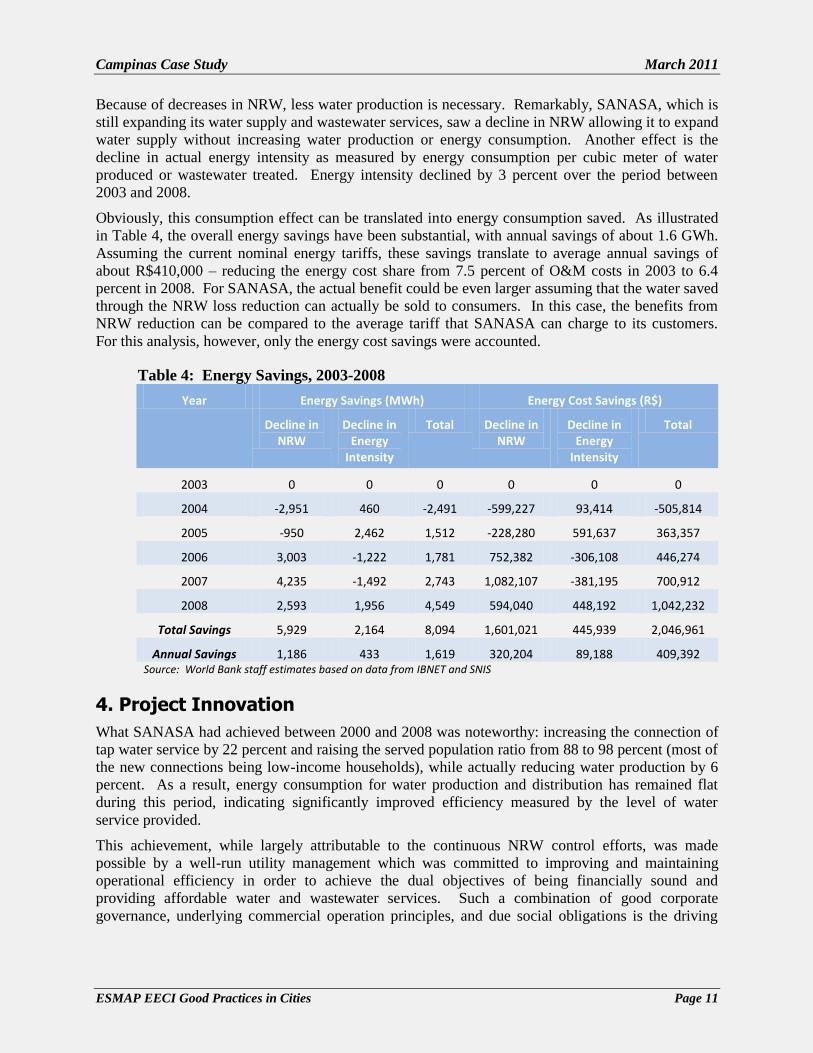
Obviously, this consumption effect can be translated into energy consumption saved. As illustrated
in Table 4, the overall energy savings have been substantial, with annual savings of about 1.6 GWh.
Assuming the current nominal energy tariffs, these savings translate to average annual savings of
about R$410,000 – reducing the energy cost share from 7.5 percent of O&M costs in 2003 to 6.4
percent in 2008. For SANASA, the actual benefit could be even larger assuming that the water saved
through the NRW loss reduction can actually be sold to consumers. In this case, the benefits from
NRW reduction can be compared to the average tariff that SANASA can charge to its customers.
For this analysis, however, only the energy cost savings were accounted.
Table 4: Energy Savings, 2003-2008
Year Energy Savings (MWh) Energy Cost Savings (R$)
Decline in NRW
Decline in Energy
Intensity
Total Decline in NRW
Decline in Energy
Intensity
Total
2003 0 0 0 0 0 0
2004 -2,951 460 -2,491 -599,227 93,414 -505,814
2005 -950 2,462 1,512 -228,280 591,637 363,357
2006 3,003 -1,222 1,781 752,382 -306,108 446,274
2007 4,235 -1,492 2,743 1,082,107 -381,195 700,912
2008 2,593 1,956 4,549 594,040 448,192 1,042,232
Total Savings 5,929 2,164 8,094 1,601,021 445,939 2,046,961
Annual Savings 1,186 433 1,619 320,204 89,188 409,392 Source: World Bank staff estimates based on data from IBNET and SNIS
4. Project Innovation
What SANASA had achieved between 2000 and 2008 was noteworthy: increasing the connection of
tap water service by 22 percent and raising the served population ratio from 88 to 98 percent (most of
the new connections being low-income households), while actually reducing water production by 6
percent. As a result, energy consumption for water production and distribution has remained flat
during this period, indicating significantly improved efficiency measured by the level of water
service provided.
This achievement, while largely attributable to the continuous NRW control efforts, was made
possible by a well-run utility management which was committed to improving and maintaining
operational efficiency in order to achieve the dual objectives of being financially sound and
providing affordable water and wastewater services. Such a combination of good corporate
governance, underlying commercial operation principles, and due social obligations is the driving
Campinas Case Study March 2011
ESMAP EECI Good Practices in Cities Page 12
force for sustained improvement of operational efficiency, of which energy efficiency is an integral
part.
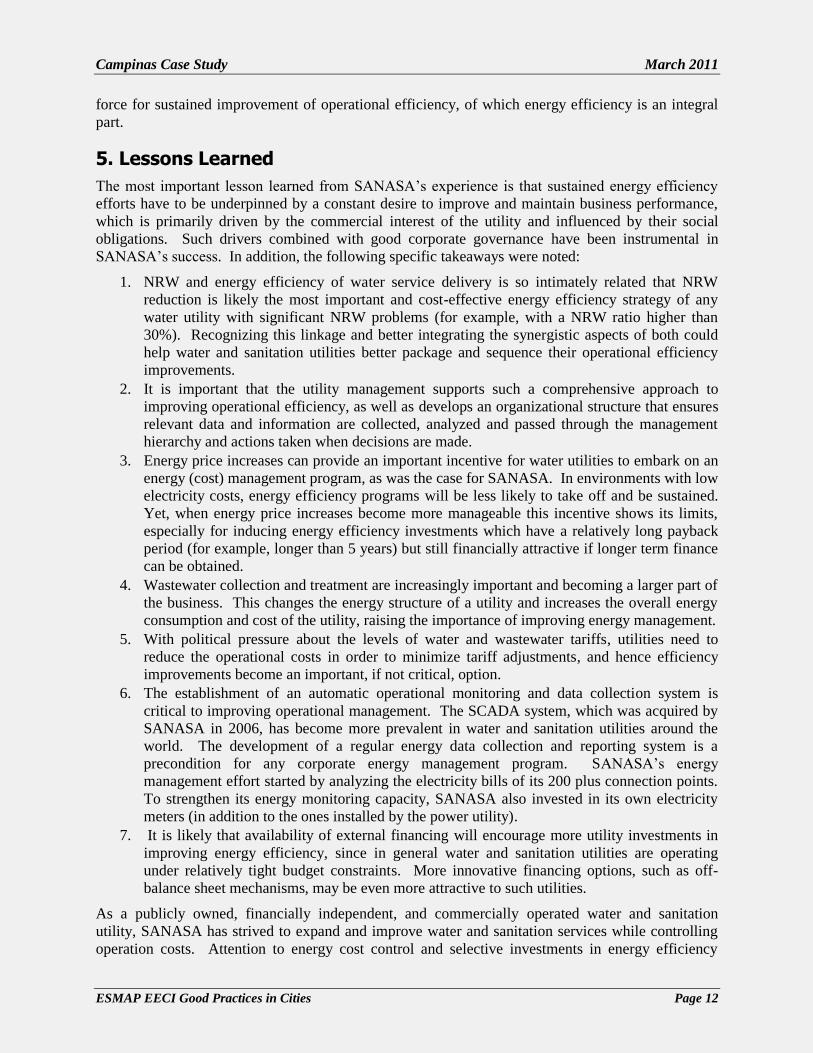
5. Lessons Learned
The most important lesson learned from SANASA’s experience is that sustained energy efficiency
efforts have to be underpinned by a constant desire to improve and maintain business performance,
which is primarily driven by the commercial interest of the utility and influenced by their social
obligations. Such drivers combined with good corporate governance have been instrumental in
SANASA’s success. In addition, the following specific takeaways were noted:
1. NRW and energy efficiency of water service delivery is so intimately related that NRW
reduction is likely the most important and cost-effective energy efficiency strategy of any
water utility with significant NRW problems (for example, with a NRW ratio higher than
30%). Recognizing this linkage and better integrating the synergistic aspects of both could
help water and sanitation utilities better package and sequence their operational efficiency
improvements.
2. It is important that the utility management supports such a comprehensive approach to
improving operational efficiency, as well as develops an organizational structure that ensures
relevant data and information are collected, analyzed and passed through the management
hierarchy and actions taken when decisions are made.
3. Energy price increases can provide an important incentive for water utilities to embark on an
energy (cost) management program, as was the case for SANASA. In environments with low
electricity costs, energy efficiency programs will be less likely to take off and be sustained.
Yet, when energy price increases become more manageable this incentive shows its limits,
especially for inducing energy efficiency investments which have a relatively long payback
period (for example, longer than 5 years) but still financially attractive if longer term finance
can be obtained.
4. Wastewater collection and treatment are increasingly important and becoming a larger part of
the business. This changes the energy structure of a utility and increases the overall energy
consumption and cost of the utility, raising the importance of improving energy management.
5. With political pressure about the levels of water and wastewater tariffs, utilities need to
reduce the operational costs in order to minimize tariff adjustments, and hence efficiency
improvements become an important, if not critical, option.
6. The establishment of an automatic operational monitoring and data collection system is
critical to improving operational management. The SCADA system, which was acquired by
SANASA in 2006, has become more prevalent in water and sanitation utilities around the
world. The development of a regular energy data collection and reporting system is a
precondition for any corporate energy management program. SANASA’s energy
management effort started by analyzing the electricity bills of its 200 plus connection points.
To strengthen its energy monitoring capacity, SANASA also invested in its own electricity
meters (in addition to the ones installed by the power utility).
7. It is likely that availability of external financing will encourage more utility investments in
improving energy efficiency, since in general water and sanitation utilities are operating
under relatively tight budget constraints. More innovative financing options, such as off-
balance sheet mechanisms, may be even more attractive to such utilities.
As a publicly owned, financially independent, and commercially operated water and sanitation
utility, SANASA has strived to expand and improve water and sanitation services while controlling
operation costs. Attention to energy cost control and selective investments in energy efficiency
Campinas Case Study March 2011
ESMAP EECI Good Practices in Cities Page 13
improvements have been an important part of that corporate effort and have made significant
contributions to enhancing services and improving financial performance.
Going forward and building on its past success, SANASA could benefit from a more systematic
approach to energy management, with improved energy performance monitoring and evaluation and
more explicit energy accountabilities assigned to operational and maintenance teams. This will help
the utility continuously identify and assess energy efficiency opportunities and levels of
improvements.
6. Financial Sustainability, Transferability, and Scalability
The activities which helped SANASA deliver water services with increased energy efficiency were
commercially driven. They are primarily for enhancing and maintaining the utility’s financial
performance in response to the changing operating environment of the utility, be it rising electricity
prices or limiting room for increasing water tariff. SANASA is in the process of entering into a
concession contract with the City of Campinas. This is likely to further strengthen the commercial
orientation of the utility’s operation, in principle a good thing for energy efficiency, provided that
there are clear incentives for improving operation efficiency built into the concession contract.
SANASA’s experience is generally transferable to other Brazil water and sanitation utilities because
they operate in the same regulatory environment. But the quality of corporate governance may differ
significantly and will have a major impact on the outcome. In two other Brazilian utilities studied by
the World Bank’s Energy Sector Management Assistance Program (ESMAP), SANEATINS of the
State of Tocantins and Águas do Imperador of the City of Petrópolis in the State of Rio de Janeiro,
similar results have been achieved. For example, between 2003 and 2008, SANEATINS increased
its water production by 18 percent, tap water connections by 30 percent, while electricity use of
water supply only increased by 12 percent.
References
This case study was primarily based on information gathered during a visit to SANASA in April 2010. Most
time series data were obtained from the database of IBNET and SNIS.
Campinas Case Study March 2011
ESMAP EECI Good Practices in Cities Page 14
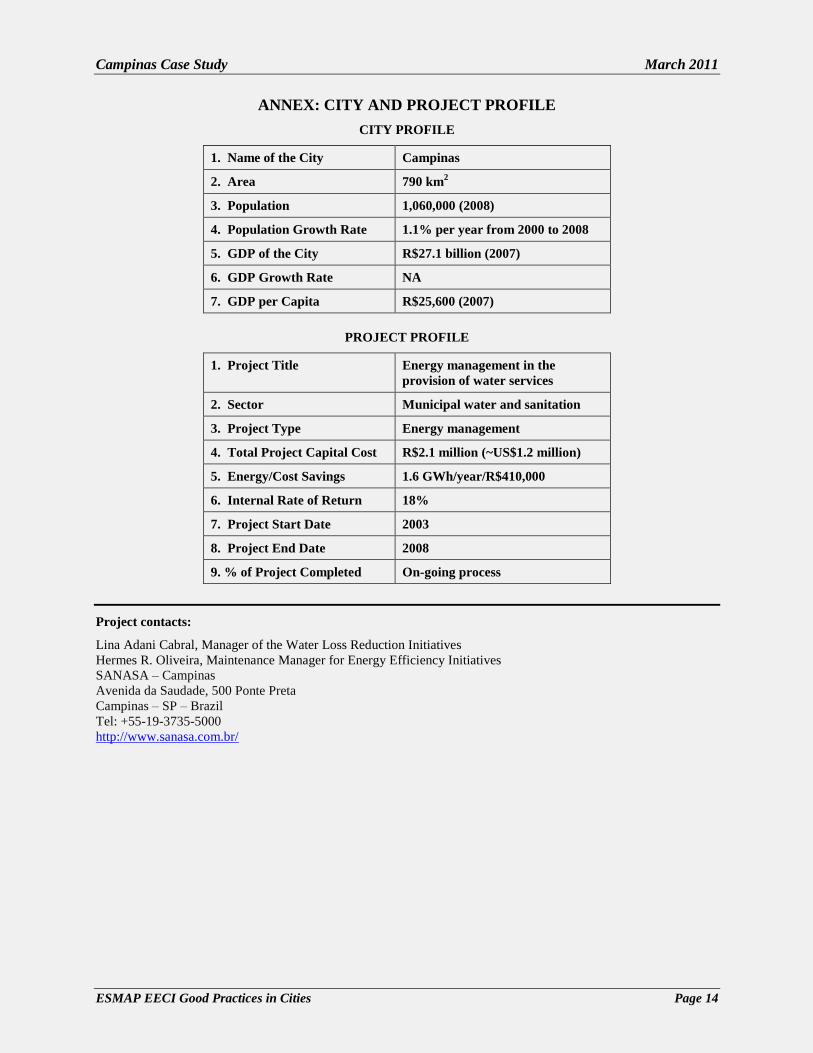
ANNEX: CITY AND PROJECT PROFILE
CITY PROFILE
1. Name of the City Campinas
2. Area 790 km2
3. Population 1,060,000 (2008)
4. Population Growth Rate 1.1% per year from 2000 to 2008
5. GDP of the City R$27.1 billion (2007)
6. GDP Growth Rate NA
7. GDP per Capita R$25,600 (2007)
PROJECT PROFILE
Project contacts:
Lina Adani Cabral, Manager of the Water Loss Reduction Initiatives
Hermes R. Oliveira, Maintenance Manager for Energy Efficiency Initiatives
SANASA – Campinas
Avenida da Saudade, 500 Ponte Preta
Campinas – SP – Brazil
Tel: +55-19-3735-5000
http://www.sanasa.com.br/
1. Project Title Energy management in the
provision of water services
2. Sector Municipal water and sanitation
3. Project Type Energy management
4. Total Project Capital Cost R$2.1 million (~US$1.2 million)
5. Energy/Cost Savings 1.6 GWh/year/R$410,000
6. Internal Rate of Return 18%
7. Project Start Date 2003
8. Project End Date 2008
9. % of Project Completed On-going process


![[BPM Day Campinas - 2014] ISS Brazil](https://img.pdfslide.us/doc/110x75/58ee61551a28ab77648b4609/bpm-day-campinas-2014-iss-brazil.jpg)