Embed Size (px)
DESCRIPTION
Project Management
Citation preview

The impact of project delivery systems, cost minimisation
and project control on construction project success. Evidence from Ghana
by
GISELA GABA
SEPTEMBER 2013
A dissertation submitted in part fulfilment of the Degree of Master of Science, Built Environment: Facility and Environment Management
University College London

Gisela Gaba September 2013
1
ACKNOWLEDGEMENT First of all, I give thanks to the Almighty God for granting me the grace, wisdom, courage and perseverance to pursue my master’s degree. Secondly I thank my parents Florence and Paul, my sister Pauline and brother Paul for giving me support and encouragement throughout my studies. Thirdly I would like to thank Dr. Nathaniel Boso for the giving me guidance and supports during this dissertation process, and for believing in me. Mr. Peter McLennan –program director for always proving sound advice and direction in my academic work. Finally, my greatest appreciation goes to my lecturers for imparting invaluable knowledge to me during my Masters degree and to all those who played a part in making stay in the United Kingdom a memorable one.
2
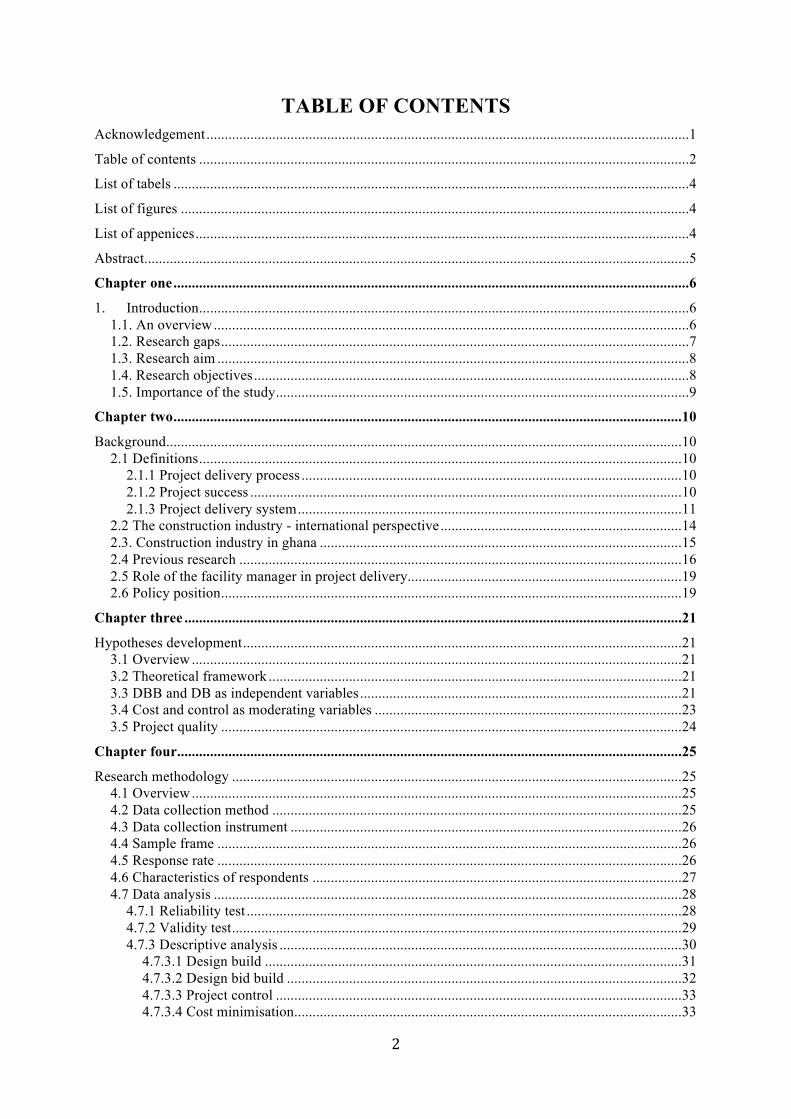
TABLE OF CONTENTS Acknowledgement .................................................................................................................................... 1
Table of contents ...................................................................................................................................... 2
List of tabels ............................................................................................................................................. 4
List of figures ........................................................................................................................................... 4
List of appenices ....................................................................................................................................... 4
Abstract ..................................................................................................................................................... 5
Chapter one ............................................................................................................................................. 6
1. Introduction ...................................................................................................................................... 6 1.1. An overview .................................................................................................................................. 6 1.2. Research gaps ................................................................................................................................ 7 1.3. Research aim ................................................................................................................................. 8 1.4. Research objectives ....................................................................................................................... 8 1.5. Importance of the study ................................................................................................................. 9
Chapter two ........................................................................................................................................... 10
Background ............................................................................................................................................. 10 2.1 Definitions .................................................................................................................................... 10
2.1.1 Project delivery process ........................................................................................................ 10 2.1.2 Project success ...................................................................................................................... 10 2.1.3 Project delivery system ......................................................................................................... 11
2.2 The construction industry - international perspective .................................................................. 14 2.3. Construction industry in ghana ................................................................................................... 15 2.4 Previous research ......................................................................................................................... 16 2.5 Role of the facility manager in project delivery ........................................................................... 19 2.6 Policy position .............................................................................................................................. 19
Chapter three ........................................................................................................................................ 21
Hypotheses development ........................................................................................................................ 21 3.1 Overview ...................................................................................................................................... 21 3.2 Theoretical framework ................................................................................................................. 21 3.3 DBB and DB as independent variables ........................................................................................ 21 3.4 Cost and control as moderating variables .................................................................................... 23 3.5 Project quality .............................................................................................................................. 24
Chapter four .......................................................................................................................................... 25
Research methodology ........................................................................................................................... 25 4.1 Overview ...................................................................................................................................... 25 4.2 Data collection method ................................................................................................................ 25 4.3 Data collection instrument ........................................................................................................... 26 4.4 Sample frame ............................................................................................................................... 26 4.5 Response rate ............................................................................................................................... 26 4.6 Characteristics of respondents ..................................................................................................... 27 4.7 Data analysis ................................................................................................................................ 28
4.7.1 Reliability test ....................................................................................................................... 28 4.7.2 Validity test ........................................................................................................................... 29 4.7.3 Descriptive analysis .............................................................................................................. 30
4.7.3.1 Design build .................................................................................................................. 31 4.7.3.2 Design bid build ............................................................................................................ 32 4.7.3.3 Project control ............................................................................................................... 33 4.7.3.4 Cost minimisation .......................................................................................................... 33
Gisela Gaba September 2013
3
4.7.3.5 Project effectiveness ...................................................................................................... 34 4.7.3.6 Project quality ................................................................................................................ 35
Chapter five ........................................................................................................................................... 37
Findings .................................................................................................................................................. 37 5.1 Results of regression analysis ...................................................................................................... 37 5.2 Plotting the interactions ............................................................................................................... 39
Chapter six ............................................................................................................................................ 41
Conclusion, implications and limitations ............................................................................................... 41 6.1 Conclusion ................................................................................................................................... 41 6.2 Discussion and implications ......................................................................................................... 41 6.3 Limitations and suggestions for future research .......................................................................... 45
References ............................................................................................................................................. 47
Appenicies ............................................................................................................................................. 54 Appendix i: Cover letter for survey questionnaire ............................................................................. 55 Apendix ii: Survey questionnaire ....................................................................................................... 56 Appendix iii: Coding and factor analysis of variable measures ......................................................... 58
4
LIST OF TABELS Table 2.1: Comparison between DBB and DB delivery systems…………………………….12
Table 2.2: Summry of findings on different dimensions and perspective of projects success.18
Table 2.3: Competing strands of public procurement………………………………………...20
Table 4.1: Factor analysis validating research items...……………………………………….29
Table 4.2: Descriptive statistics, correlations and reliability tests……………………………30
Table 5.1: Results of the hypothesis tests…………………………………………………….38
LIST OF FIGURES Figure 1. Stages of a Construction project delivery process…………………………………10
Figure 2. Construction project success model.……………………………………………….11
Figure 3: Design-bid-build project delivery model.………………………………………….14
Figure 4. Design-build project delivery.……………………………………………………...14
Figure 5. Theoretical framework of research model………………………………………….22
Figure 6. Research process…………………………………………………………………...25
Figure 7: Positions held by respondents……………………………………………………...27
Figure 8: Frequency Distribution of Design Build…………………………………………...31
Figure 9: Frequency Distribution of Design-Bid-Build variable……………………………..32
Figure 10: Frequency Distribution of Emphasis on project control Variable………………...33
Figure 11: Frequency Distribution of Cost Minimisation Variable………………..................34
Figure 12: Frequency Distribution of Project Effectiveness Variable………………..............35
Figure 13: Frequency Distribution of Project Quality Variable……………….......................36
Figure 14: Interacion between DBB and DB systems………………………………………..39
Figure 15: Interaction between DB and cost minimisation………………..............................40
Figure 16: Interaction between DB and project control………………....................................40
LIST OF APPENICES Appendix I: Cover letter for survey questionnaire…………………………………………...55
Appendix II: Survey questionnaire…………………………………………………………...56
Appendix III: Coding and factor analysis of variable measures……………….......................58
Gisela Gaba September 2013
5
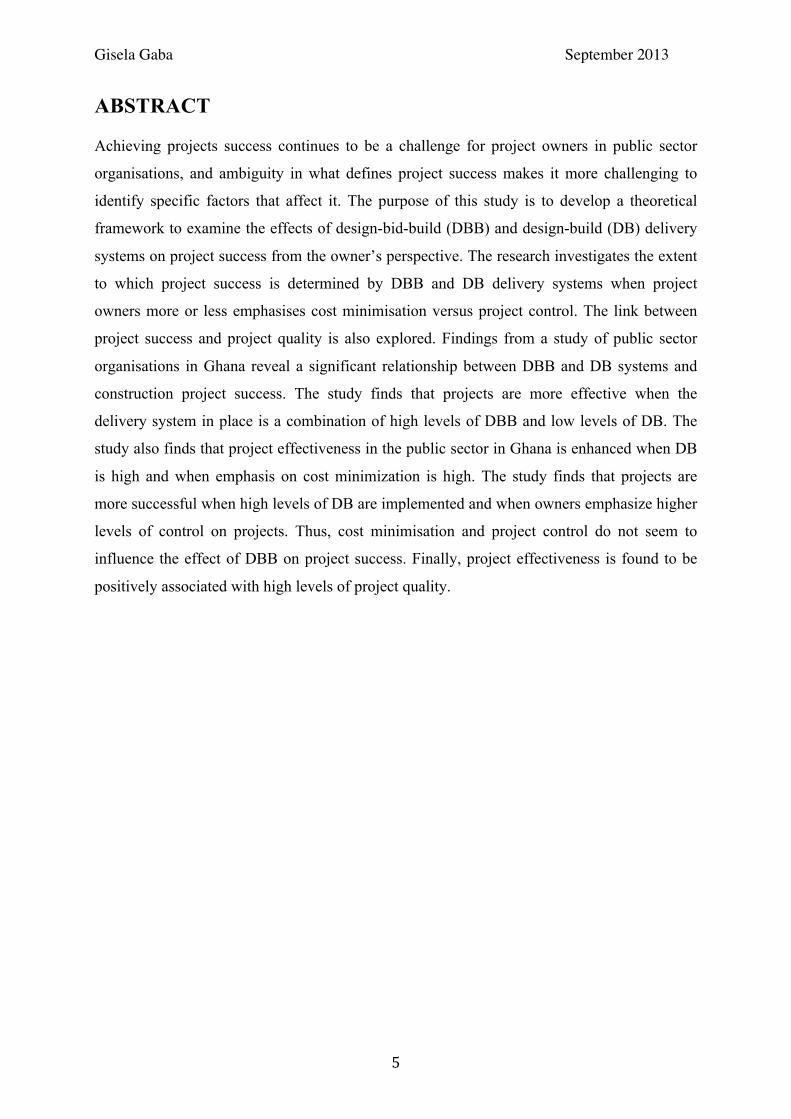
ABSTRACT Achieving projects success continues to be a challenge for project owners in public sector
organisations, and ambiguity in what defines project success makes it more challenging to
identify specific factors that affect it. The purpose of this study is to develop a theoretical
framework to examine the effects of design-bid-build (DBB) and design-build (DB) delivery
systems on project success from the owner’s perspective. The research investigates the extent
to which project success is determined by DBB and DB delivery systems when project
owners more or less emphasises cost minimisation versus project control. The link between
project success and project quality is also explored. Findings from a study of public sector
organisations in Ghana reveal a significant relationship between DBB and DB systems and
construction project success. The study finds that projects are more effective when the
delivery system in place is a combination of high levels of DBB and low levels of DB. The
study also finds that project effectiveness in the public sector in Ghana is enhanced when DB
is high and when emphasis on cost minimization is high. The study finds that projects are
more successful when high levels of DB are implemented and when owners emphasize higher
levels of control on projects. Thus, cost minimisation and project control do not seem to
influence the effect of DBB on project success. Finally, project effectiveness is found to be
positively associated with high levels of project quality.
6
CHAPTER ONE
1. INTRODUCTION
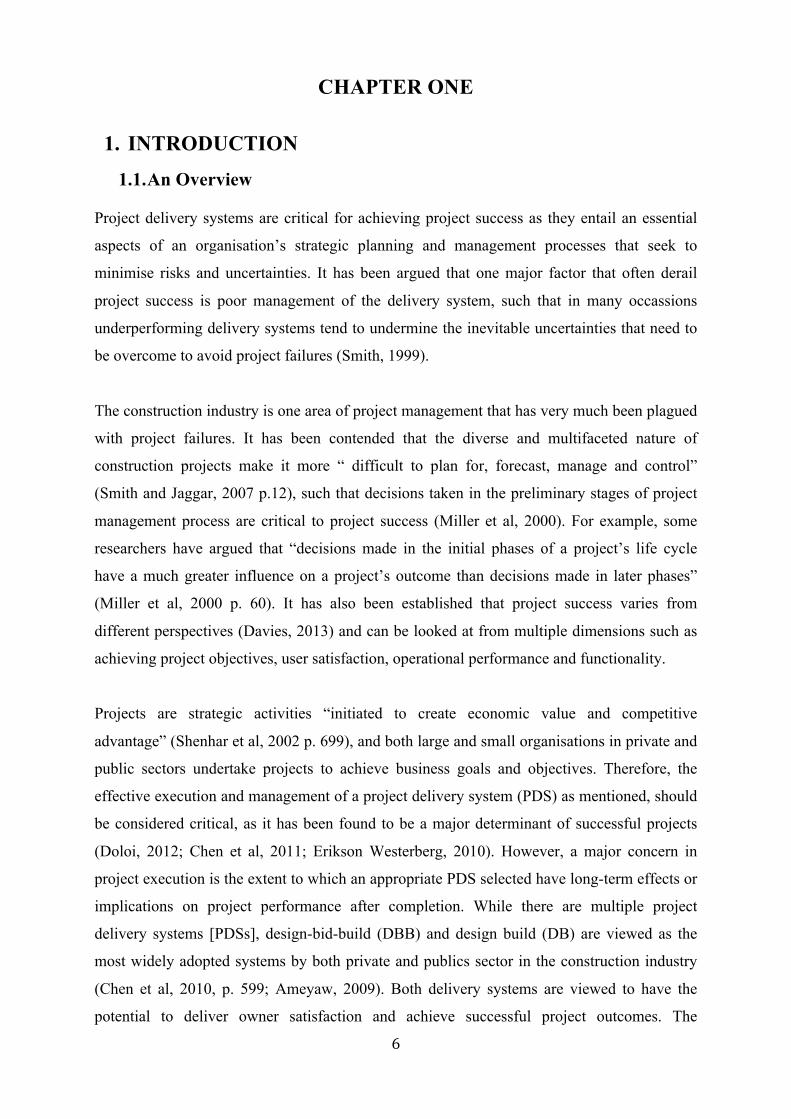
1.1. An Overview Project delivery systems are critical for achieving project success as they entail an essential
aspects of an organisation’s strategic planning and management processes that seek to
minimise risks and uncertainties. It has been argued that one major factor that often derail
project success is poor management of the delivery system, such that in many occassions
underperforming delivery systems tend to undermine the inevitable uncertainties that need to
be overcome to avoid project failures (Smith, 1999).
The construction industry is one area of project management that has very much been plagued
with project failures. It has been contended that the diverse and multifaceted nature of
construction projects make it more “ difficult to plan for, forecast, manage and control”
(Smith and Jaggar, 2007 p.12), such that decisions taken in the preliminary stages of project
management process are critical to project success (Miller et al, 2000). For example, some
researchers have argued that “decisions made in the initial phases of a project’s life cycle
have a much greater influence on a project’s outcome than decisions made in later phases”
(Miller et al, 2000 p. 60). It has also been established that project success varies from
different perspectives (Davies, 2013) and can be looked at from multiple dimensions such as
achieving project objectives, user satisfaction, operational performance and functionality.
Projects are strategic activities “initiated to create economic value and competitive
advantage” (Shenhar et al, 2002 p. 699), and both large and small organisations in private and
public sectors undertake projects to achieve business goals and objectives. Therefore, the
effective execution and management of a project delivery system (PDS) as mentioned, should
be considered critical, as it has been found to be a major determinant of successful projects
(Doloi, 2012; Chen et al, 2011; Erikson Westerberg, 2010). However, a major concern in
project execution is the extent to which an appropriate PDS selected have long-term effects or
implications on project performance after completion. While there are multiple project
delivery systems [PDSs], design-bid-build (DBB) and design build (DB) are viewed as the
most widely adopted systems by both private and publics sector in the construction industry
(Chen et al, 2010, p. 599; Ameyaw, 2009). Both delivery systems are viewed to have the
potential to deliver owner satisfaction and achieve successful project outcomes. The
Gisela Gaba September 2013
7
characteristic strengths and weaknesses of both system’s effects on project success may
present an opportunity to project owners to adopt a combination or hybrid of both systems:
that is the impact of one system may reduce the negative effect of the other and inclusion of
other elements like construction management or facility management can improve the success
rate of projects realised though DB and DBB project delivery systems (Miller et al, 2000).
However, high levels of project success can be achieved if the effects of the project delivery
systems on project success are clearly established, and measures are taken by the owner to
eliminate or retain these effects to the benefit of stakeholders (Wang and Huang, 2005).
Studies indicate that the delivery method and the institutional context within which projects
are delivered has important implications for achieving project objectives and project owners
play a significant role in determining project success (Wang and Huang, 2005). These
authors also contend that the institutional context, developed versus developing, with its
related institutional supports and challenges can impinge on the capacity of organisations,
private or public, to attain project success (Ameyaw, Mensah and Osei-Tutu, 2012).
1.2. Research Gaps While some studies have looked at the several project delivery systems and their individual
impacts on project success, what is missing in the literature is the extent to which
combinations of these delivery systems could help aid project effectiveness (or success). Chen
et al. (2010), for example, suggest that there is a crucial need to combine PDSs systems for
superior project delivery success. This call is based on the assumption that both types of
delivery system has strengthens and weaknesses, such that, if well managed and leveraged,
they can compensate each other’s weaknesses for greater project success. Interestingly, the
existing literature is silent on the potential influence of the joint implementation of DBB and
DB delivery sysems on project effectiveness, and as such, this study seeks to address this gap
in the literature by looking at the extent to which DBB and DB, individually and jointly,
influence project effectiveness.
Furthermore, Chen et al. (2011) claim that “If the owner wants to control the project, it is
better to select DBB; if the owner wants to minimize the risk, DB would be a better choice”.
This later argument could be taken to imply that owner expectations and emphasis on cost
minimisation versus control of projects may act to facilitate or inhibit the extent to which any
one delivery system is perceived to affect project success. Interestingly, the mechamism that
explains this process, and empirical evidence supporting suggestions by Chen and colleagues’
8
scanty. Therefore, this study aims to examine the extent to which effect of DBB and DB
delivery systems on project success are moderated by owner emphasis on control projects and
owners’ emphasis on minimizing cost.
Several scholars have also raised concerns regarding the validity of transfering knowledge of
project management from Western developed contexts to non-Western developing economy
contexts (e.g. Hoskinsson et al., 2000). The theoretical basis for this concern is that the
institutional context in developed nations and strikingly different from the institutional setting
in developing nations (Arnold and Quelch, 1998). For example, conditions in developed
nations, where the vast majority of empirical studies have been conducted on project delivery
system have been conducted, are advanced with modern sophisticated project delivery and
tracking systems. Yet, in developing nations, especially those in African nations such as
Ghana, institutions supportive of efficient project delivery (e.g. auditing system, modern
technology, and courts) are weak and complicated with poor enforcement of rules of business
transactions. In this respect, this study argues that it would be erroneous to simply transpose
know of project delivery systems in developed nations to developing nations with undertaking
thorough empirical assessment. Accordingly, the third purpose of the current study is to
investigate the project delivery systems and the contingency factors considered in the context
of public sector organisation in Ghana, a developing nation south of the Sahara.
1.3. Research Aim In sum, the study’s aim is to explore the effects of DBB and DB systems on construction
project effectiveness under differing levels of owner’s emphasis on cost minimisation and
project control. The study also looks at how project effectiveness influence project quality
under the assumption that project quality activities such as turnover quality, system quality
and equipment quality levels are of ultimate importance to project owners. The study’s
theoretical framework, is therefore, investigated in public sector organisations in Ghana,
providing opportunity to look at the relationships from developing economy perspectives.
1.4. Research objectives Thus, the specific objectives of the current study are threefold:
a. Examine the extent to which DBB and DB project delivery systems influence project
success, looking at success from an effectiveness and quality perspective;
b. Investigate the extent to which owner emphasis on cost minimisation and control
hinder or increase the effects of both systems on project success; and
Gisela Gaba September 2013
9
c. Look at how this phenomenon unfolds in a developing country like Ghana
1.5. Importance of the Study The theory of project delivery is a universal phenomenon that plays a major role in a nation’s
development and growth. The amount of financial and non-financial resource lost to failed
projects continues to increase annually in both developed and developing worlds. Since the
1980’s till present, attempts have been made by academics and industry professionals to
define and redefine project success (DeWit, 1988) identify critical success factors (Atkins,
1999) and key performance indicators (KPIs) of success (Chan and Chan, 2004; Toor and
Ogunlana, 2010) to achieve project success, develop quantitative models for selecting the
right PDS (Chen et al, 2010) and suggest management system for project success (Erridge and
McIlroy, 2002). Various dimensions have been explored, but it is an established fact that the
ambiguity of project success (Chan and Chan, 2004) poses a challenge to various stakeholders
including project/facility managers.
However, very little evidence exists on the impact a PDS has on project success with respect
to overall project quality. This study aims at developing a framework, which investigates the
relationship between PDSs like DBB and DB systems have on project success, when owner’s
(i.e. project managers) emphasizes on minimising cost and maximising control of the delivery
process. This present an opportunity for project/facility managers in developing economies
like Ghana and other parts of the world to make informed decision when selecting PDSs
based on its potential outcome of interaction with management function like control and
efficiency.
The remainder of the study is organised as follows. In Chapter two, a the existing literature is
assessed to determine the extent to further explain the gaps in the literature regarding the
project success outcomes of DBB and DB delivery systems. Chapter three focuses on
explaining the specific relationships studied by presenting specific arguments in support of
the study’s hypotheses. Chapter four provides details of the methodological approaches and
data collection activities undertaken. Chapter five presents analyses undertaken whereas
Chapter six discusses the implications and limitations of the findings from the study.
10
Operation
CHAPTER TWO BACKGROUND
2.1 Definitions
2.1.1 Project delivery process A project process is defined as the key sequential steps followed in project executions, and
the level of detail is dependent of the “development methodology used” (Griffins Enterprise).
Smith (1999) suggests processes involved in undertaking a project rage between six to twelve
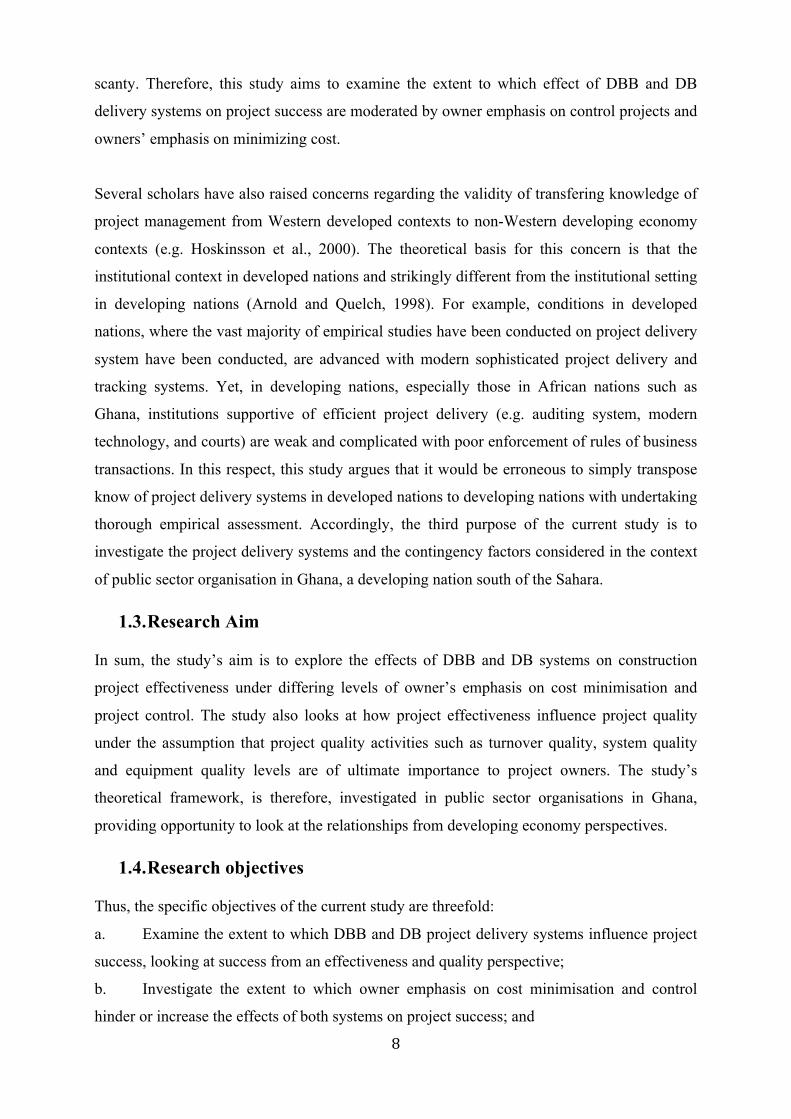
steps depending on the type of project. According to a book of knowledge (BoK) in the
construction industry, delivering a construction project involves eight processes as shown in
Figure 1 below. Thus, both DBB and DB systems constitute these processes, but the
difference in level of involvement of the project owners in the various stages, distribution of
tasks and project management responsibility. This is discussed further in chapter 3.
Figure 1. Stages of a Construction project delivery process
DESIGN (Owner) BID BUILD (Contractor) DESIGN (Contractor) BUILD (Contractor)
Adapted from Smith, N. J (1999)
2.1.2 Project success The basic criteria for determining construction project (CP) success has mainly been centred
on quantitative variables such as- cost, time and quality of specification (Atkinson, 1999;
Schenlar et at, 2002; Hwang and Lim, 2013; Ameyaw, Mensah and Aurthur, 2012; Toor and
Ogunlana, 2011; Meredith and Mantel, 2010; Yu et al, 2005) as mention earlier, commonly
referred to as the “iron triangle” by Roger Atkinson (Atkinson, 1999 p.337). But others
criticise the scope as narrow and inadequate since it fails capture non-quantitative and
subjective criteria based on stakeholder perception (Shenlar et al, 2002) and macro economic
benefits such as – operability, functionality, reliability and long-term gains (Mollaoglu-
Pre-‐feasibility Feasibility Design Contrant/ Pocurement implementation Commissioning Hand Over Operation
Gisela Gaba September 2013
11
Korkmaz, Swarup and Reily, 2011; Toor and Ogunlana, 2009b; Shcenlar et al, 2002). Various
studies reveal various critical success factors that influence CP success (Abraham, 2002;
Chen et al, 2010; Hwang and Lim, 2013; Meredith and Mantel, 2010; Yu et al, 2005), which
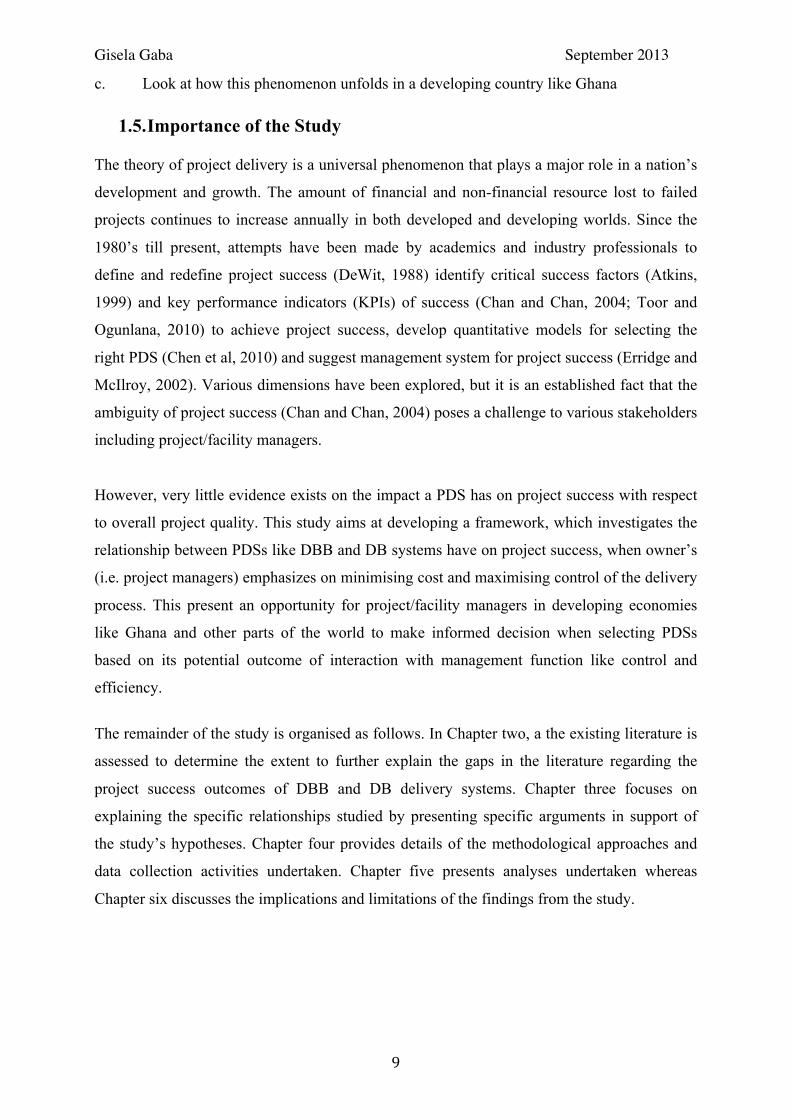
centre on factors shown in Chau’s (1999) model in Figure 2. The model illustrates the
interconnection between critical success factors in CP.
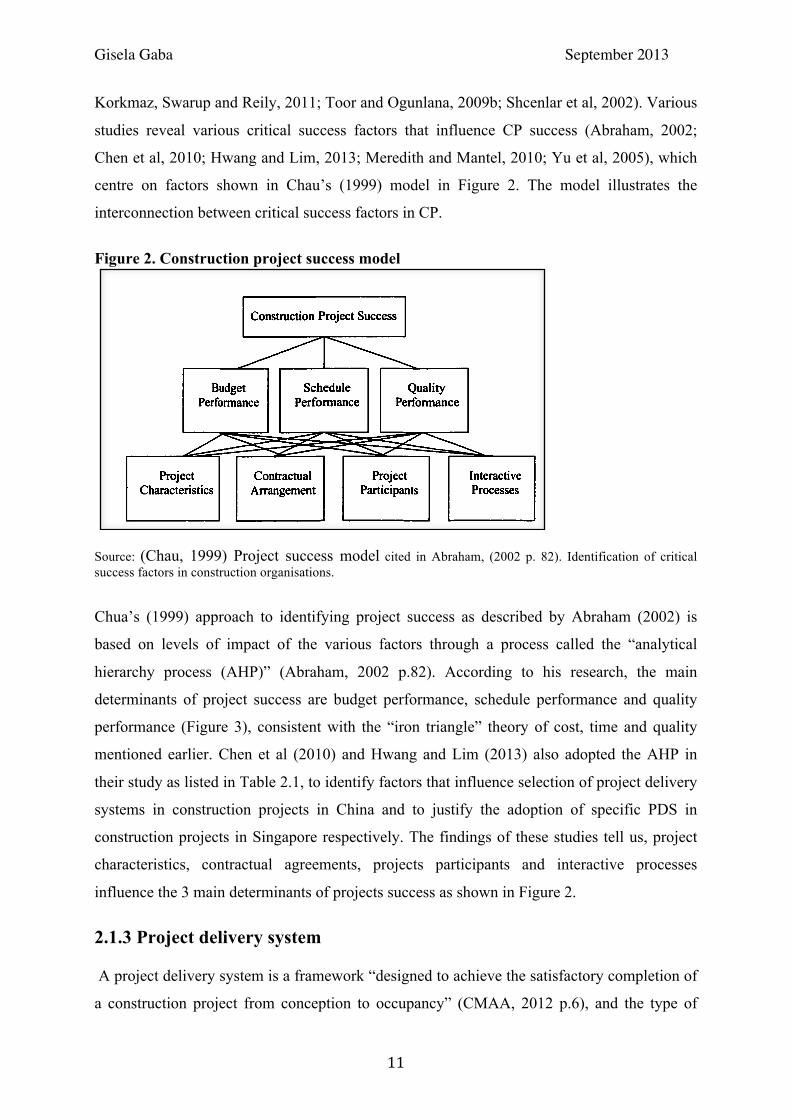
Figure 2. Construction project success model
Source: (Chau, 1999) Project success model cited in Abraham, (2002 p. 82). Identification of critical success factors in construction organisations.
Chua’s (1999) approach to identifying project success as described by Abraham (2002) is
based on levels of impact of the various factors through a process called the “analytical
hierarchy process (AHP)” (Abraham, 2002 p.82). According to his research, the main
determinants of project success are budget performance, schedule performance and quality
performance (Figure 3), consistent with the “iron triangle” theory of cost, time and quality
mentioned earlier. Chen et al (2010) and Hwang and Lim (2013) also adopted the AHP in
their study as listed in Table 2.1, to identify factors that influence selection of project delivery
systems in construction projects in China and to justify the adoption of specific PDS in
construction projects in Singapore respectively. The findings of these studies tell us, project
characteristics, contractual agreements, projects participants and interactive processes
influence the 3 main determinants of projects success as shown in Figure 2.
2.1.3 Project delivery system A project delivery system is a framework “designed to achieve the satisfactory completion of
a construction project from conception to occupancy” (CMAA, 2012 p.6), and the type of
$ONSTRUCTION�1ROJECT�4UCCESS
4CHEDULE1ERFORMANCE
#UDGET1ERFORMANCE
2UALITY1ERFORMANCE
1ROJECT$HARACTERISTICS
1ROJECT1ARTICIPANTS
*NTERACTIVE1ROCESSES
$ONTRACTUAL"RRANGEMENT
%FDROB�� ��"ER>eP�������,LABI�LC�/OLGB@Q�2R@@BPP
$HUAkS�RESEARCH�EFFORT�IDENTIFIED�AN�APPROACH�TO�PROJECT�SUCCESS�THAT�IS�BASED�UPON�
LEVELS� OF�INFLUENCES� AND� A� PROCESS� CALLED� THE� ANALYTICAL� HIERARCHY� PROCESS� ")1�� *N�
$HUAkS� RESEARCH� EFFORT � PROJECT� SUCCESS� IS� DEFINED� BY� THREE� CRITICAL� SUCCESS� FACTORS �
SUCCESSFUL�PERFORMANCE�IN�THE�AREAS�OF�BUDGET � SCHEDULE�AND�QUALITY�$HUA � ������5HESE�
ARE� IDENTIFIED� AS� $RITICAL� 1ROJECT� 4UCCESS� 'ACTORS� $14'S� THAT� DIRECTLY� CONTRIBUTE� TO�
PROJECT� SUCCESS�� 5HE� UNDERLYING� LAYER�OF�FACTORS� DIRECTLY� INFLUENCE� THESE� THREE� CRITICAL�
PROJECT� SUCCESS� FACTORS � AND� SO� ON� THROUGH�MULTIPLE� LEVELS� AND� LAYERS� IN� THE� HIERARCHY��
4HOWN� MORE� CLEARLY� WITH� THE� DIAGRAM� BELOW � THIS� LAYERING� OR� HIERARCHICAL� PROCESS�
ESTABLISHED�A�GENERIC�FRAMEWORK�EMPHASIZING�PROJECT�SUCCESS�IN�CONSTRUCTION�
��
���������������� ��� ������� ���������������������� ��������������������� ���������������������� �������
12
system adopted is dependent on the objective and type of the project in question. Therefore
based on this definition a PDS can be described as various processes required in materialising
the goals and objective of a client into a project through integrated project team efforts (Chen
et al, 2011).
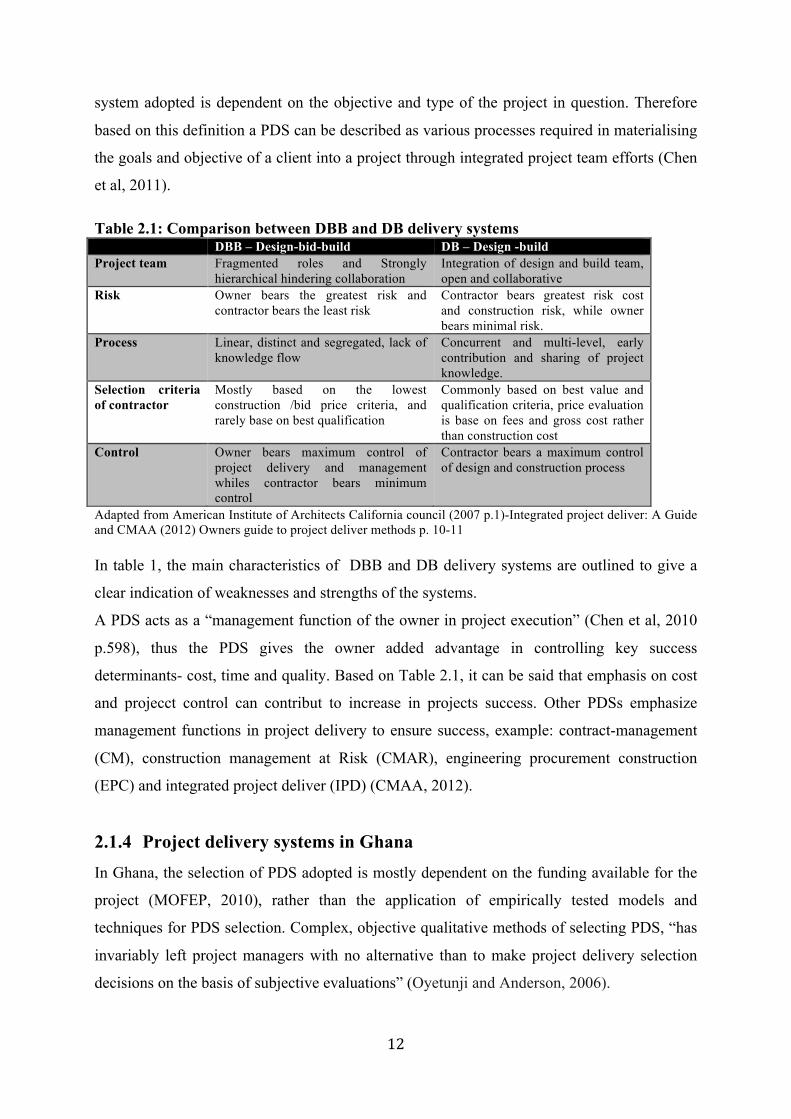
Table 2.1: Comparison between DBB and DB delivery systems DBB – Design-bid-build DB – Design -build Project team Fragmented roles and Strongly
hierarchical hindering collaboration Integration of design and build team, open and collaborative
Risk Owner bears the greatest risk and contractor bears the least risk
Contractor bears greatest risk cost and construction risk, while owner bears minimal risk.
Process Linear, distinct and segregated, lack of knowledge flow
Concurrent and multi-level, early contribution and sharing of project knowledge.
Selection criteria of contractor
Mostly based on the lowest construction /bid price criteria, and rarely base on best qualification
Commonly based on best value and qualification criteria, price evaluation is base on fees and gross cost rather than construction cost
Control Owner bears maximum control of project delivery and management whiles contractor bears minimum control
Contractor bears a maximum control of design and construction process
Adapted from American Institute of Architects California council (2007 p.1)-Integrated project deliver: A Guide and CMAA (2012) Owners guide to project deliver methods p. 10-11 In table 1, the main characteristics of DBB and DB delivery systems are outlined to give a
clear indication of weaknesses and strengths of the systems.
A PDS acts as a “management function of the owner in project execution” (Chen et al, 2010
p.598), thus the PDS gives the owner added advantage in controlling key success
determinants- cost, time and quality. Based on Table 2.1, it can be said that emphasis on cost
and projecct control can contribut to increase in projects success. Other PDSs emphasize
management functions in project delivery to ensure success, example: contract-management
(CM), construction management at Risk (CMAR), engineering procurement construction
(EPC) and integrated project deliver (IPD) (CMAA, 2012).
2.1.4 Project delivery systems in Ghana In Ghana, the selection of PDS adopted is mostly dependent on the funding available for the
project (MOFEP, 2010), rather than the application of empirically tested models and
techniques for PDS selection. Complex, objective qualitative methods of selecting PDS, “has
invariably left project managers with no alternative than to make project delivery selection
decisions on the basis of subjective evaluations” (Oyetunji and Anderson, 2006).
Gisela Gaba September 2013
13
Given the historical background of Ghana’s economy1 coupled with challenges of limited
financial resources as in other countries, majority of projects are funded through “internal and
external borrowing, grants from bilateral and multi lateral sources and public-private-
partnerships” (MOFEP, 2010 p.5). The terms and conditions of financial agreements linked to
these funds have led to an increase in the adoption of DB system as the “better alternative”
(Asomoa-Amono, 2010 p.4), which eliminates benefits of competition and market forces.
The DBB is predominantly used in government funded project delivery in accordance with
Ghana’s Public Procurement Law 2003 guidelines (Act 663), to ensure accountability,
transparency, but studies reveal an increase in cost overruns, delayed completion,
unsatisfactory outcomes and unmet project objectives (Ameyaw, 2008). Thus, the adoption of
DB systems is deemed a solution to the limitation of DBB2 in construction project delivery
(Ameyaw, 2009).
“The decision made in the selection of a project delivery system for a project impacts all
phases of execution of the project and greatly impacts the efficiency of project execution”
(Oyetunji and Anderson, 2006).
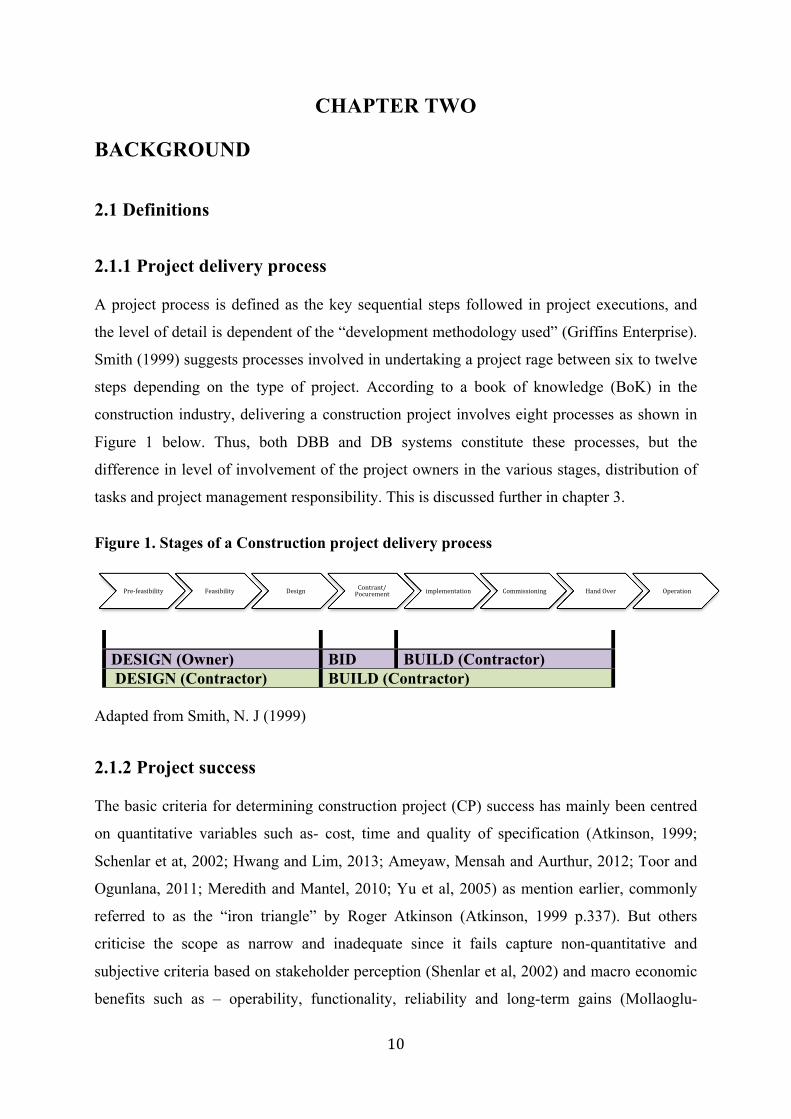
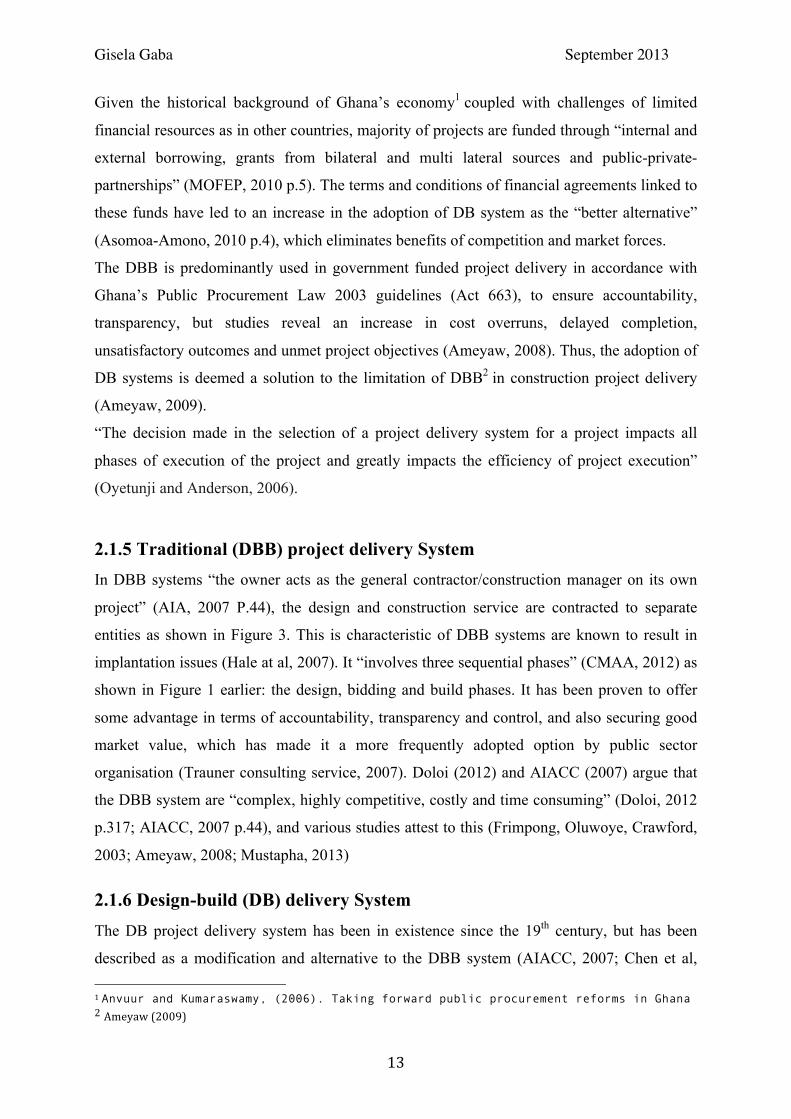
2.1.5 Traditional (DBB) project delivery System In DBB systems “the owner acts as the general contractor/construction manager on its own
project” (AIA, 2007 P.44), the design and construction service are contracted to separate
entities as shown in Figure 3. This is characteristic of DBB systems are known to result in
implantation issues (Hale at al, 2007). It “involves three sequential phases” (CMAA, 2012) as
shown in Figure 1 earlier: the design, bidding and build phases. It has been proven to offer
some advantage in terms of accountability, transparency and control, and also securing good
market value, which has made it a more frequently adopted option by public sector
organisation (Trauner consulting service, 2007). Doloi (2012) and AIACC (2007) argue that
the DBB system are “complex, highly competitive, costly and time consuming” (Doloi, 2012
p.317; AIACC, 2007 p.44), and various studies attest to this (Frimpong, Oluwoye, Crawford,
2003; Ameyaw, 2008; Mustapha, 2013)
2.1.6 Design-build (DB) delivery System The DB project delivery system has been in existence since the 19th century, but has been
described as a modification and alternative to the DBB system (AIACC, 2007; Chen et al, 1 Anvuur and Kumaraswamy, (2006). Taking forward public procurement reforms in Ghana 2 Ameyaw (2009)
14
2010). The adoption of this system by public sector organisation in Ghana has grown over the
past decades in parallel with the increase of private sector involvement in project delivery
(Ameyaw, 2009; Doloi, 2012)). “DB is characterised by a single point of responsibility for
both design and construction activities” (AACC, 2007 p.47) shown in Figure 4, and has been
proven to be more efficient in delivering construction projects compared to DBB systems
(Hale et al, 2009; Asomoa-Amono, 2010). DB allows form minimal control by the owner, but
allows for maximum transfer of “project-based risk” (AIACC, 2007 p.47) to the design-build
team. The outcome of project quality is dependent on the clarity of owner’s design criteria
and the competence of the design-build team. According to Xia (2010), various variations of
the DB system possess different strengths and weaknesses thus having clear project objectives
would help determine the system to adopt (Xia, 2010).
Figure 3. Traditional project delivery model Figure 4. Design-build project delivery model
Source: CMAA Owner’s guide to project delivery methods (2012) p. 12 &21
2.2 The Construction Industry - International perspective
The construction industry is a visible part of a country’s development and cuts across all
sectors of the economy (Smith and Jaggar, 2007) and “ the procurement route chosen
significantly impacts successful project outcomes” (Doloi, 2012 p.317). A number of internal
and external factors have been identified to affect successful project delivery and operations
(NAO, 2005; Ren, Kwao and yang, 2012), public sector projects are more complicated due to
the number of stakeholder’s involved (Hwang and Lim, 2013), and the constraints on
financial resources and unstructured project delivery system processes (Anvuur,
Kumaraswamy, Male, 2006). This elevates the challenge for project project managers.
12
CMAA Owner’s Guide to Project Delivery Methods - August 2012
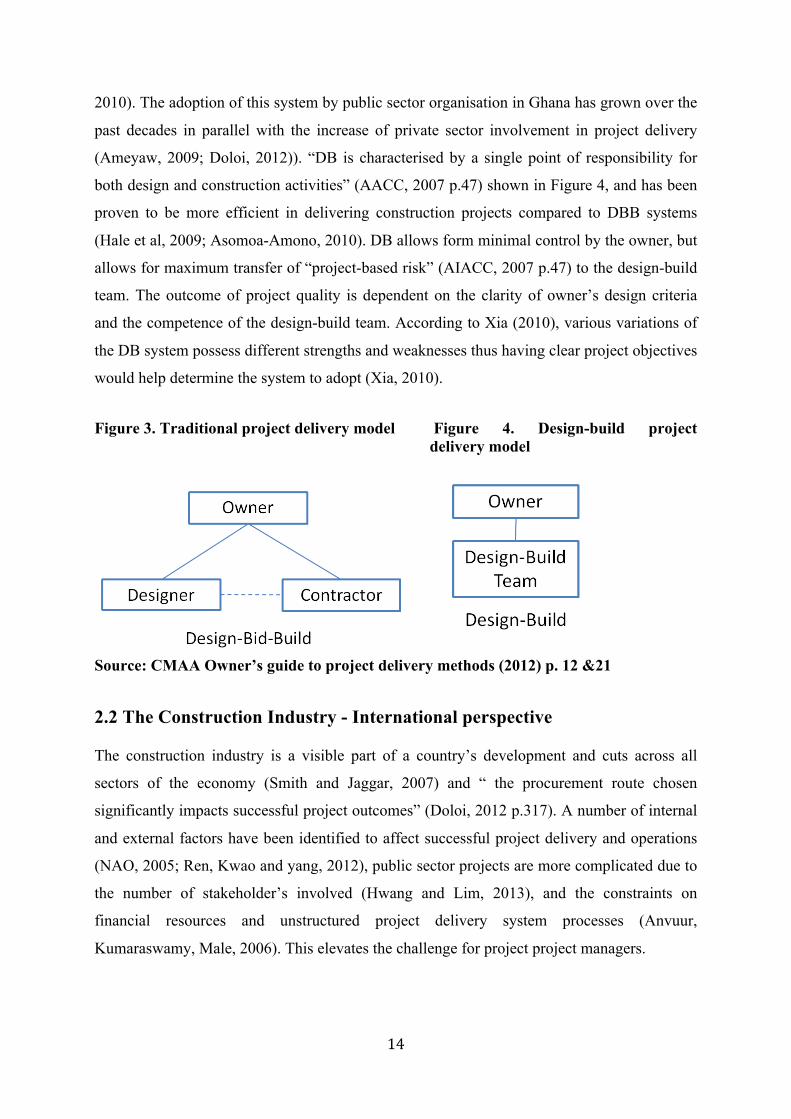
3.0 Project Delivery Methods 3.1 Design-Bid-Build (DBB) Description The Design-Bid-Build system remains the most frequently used delivery method for construction projects. Using this method, the owner engages a designer to prepare the design of the project, including construction drawings, and specifications. The designer may also provide additional services including environmental investigation, permitting, right-of-way purchase documents, hearings for public approval, and submissions for project funding. Once completed, the bid package, including the design and bidder’s information packet, is presented to interested contractors, who prepare and submit their bids for the work. The owner will select a contractor, usually based on the lowest responsive and responsible bid (for most all public work), or some hybrid of price and technical merit. The selected general contractor will then execute contracts with subcontractors to construct various specialty items. The contractor is responsible for constructing the facility in accordance with the contract documents. The designer typically maintains limited oversight of the work and responds to questions about the design on behalf of the owner. If a CM is not involved in the process, the designer may also assist the owner in administering the construction contract, including determination of project progress, for validation of interim payments made to the general contractor.
Risk Analysis
The DBB delivery method has been the standard delivery method for many years. This method gives the owner reliable price information for the project before construction starts. With proper design oversight and budgeting of the total project, costs are somewhat predictable for the owner once the bids are received. In DBB, the owner has more control over the design content, relative to other delivery methods.
However, this method typically involves a longer time period to execute, in that construction may not begin until the design and procurement phases are complete. DBB is prone to creating
21
CMAA Owner’s Guide to Project Delivery Methods - August 2012
3.3 Design-Build (DB)
Description
The design-build (DB) project delivery system has grown in popularity, and is seen by some in the industry as a solution for addressing the limitations of other methods. For an owner, the primary benefit is the simplicity of having one party responsible for the design and construction of the project. While the other delivery systems often give rise to disputes among various project participants, with the owner acting as referee (or party ultimately to blame), in DB many of these disputes become internal DB team issues which may not affect the owner.
Under this system, the owner contracts with a DB team, which can be a joint venture of a contractor and a designer, a contractor with a designer as a subconsultant, a designer-led team with a contractor as a subcontracted entity, or a single firm capable of performing both design and construction. Since contractors are most comfortable in the role of risking corporate capital in performing projects, they usually are the lead members of this sort of team. One variation of the typical DB team structure, known as fee-paid developer, involves the owner engaging a developer, which then selects its own designer and contractor partners. However formulated, the DB team performs the complete design of the facility, usually based on a preliminary scope or design presented by the owner.
At some point early in the process, through a prescribed process, the DB team will establish a fixed price to complete the design and construction of the facility. Once underway, the DB team is then responsible for construction of the project, and for all coordination between design and construction.
Risk Analysis
Since the design-build team is working together from the outset, DB offers the opportunity to save time and money. However, the advantages of the system are offset by a significant loss of control and involvement by the owner and other stakeholders. Accordingly, it is difficult for the owner to verify that it is receiving the best value for its money without having a great deal of transparency in the DB team.
Gisela Gaba September 2013
15
In 2010 the Building and Construction Authority (BCA) in Singapore estimated between $21
billion - $27 billion in construction contracts, and between $18 billion and $25 billion in
2011 and 2012 respectively (Hwang and Lim, 2013 p.204). Similarly in England, the cost of
public sector construction projects completed between 2003 and 2008 is estimated £20
million (NAO, 2009 p.6). Needless to say, this confirms the role of construction projects in
economic growth of a country (Hwang and Lim, 2013), and minimising cost is critical.
Globalization has led to participation of international construction bodies in project delivery
in emerging economies like Ghana, this further complicates project delivery processes like
“negotiations, decision-making and problem solving” (Hwang and Lim, 2013 p.204).
Additionally, externalities such as “politics, economy, society and culture, as well as
“dynamic internal risks” (Kim et al, 2007 p.1961) pose challenges in controlling the execution
of PDSs.
Toor and Ogunlana describe the construction industry in Thailand as vibrant, diversified and
fragmented with various approaches of executing projects (Toor and Ogunlana, 2009), this is
not any different from the situation in Ghana and other parts of the world. “Design
complexity, personnel competence for the job, effective planning and control, commitment to
project goals, effective communication between project participants have been identified by
various studies as key factors leading to realisation of successful construction projects (Doloi,
2012; Toor and Ogunlana, 2007 p. 425; Fringpong, Oluwoye and Crawford; Arts and Finch-
Ell, 2012; Dainty, Cheng and Moor, 2003).
Notwithstanding, the ultimate challenge and responsibility lies with industry professionals
and practitioners implementing projects to ensure optimum completion, functionality and
operations of the project facility whiles delivering maximum satisfaction of all stakeholders
(Wang anf Huang, 2005). There is no empirical evidence that relates the effects of PDSs
adopted to the success or failure of construction projects, but it is pointed out that effects of
unintegrated processes/stages and project team efforts influence “optimal project out-comes”
(Mollaoglu-Korkmaz, Swarup and Riley, 2011p.71). PDSs like the DBB method present a
higher possibility of the latter (AIACC, 2007).
2.3. Construction Industry in Ghana The construction industry in Ghana is expanding rapidly, with majority of projects in
infrastructure development (Mustapha, 2013). In 2008 9.73 per cent of the country’s GDP
16
was invested in the construction industry (Ren, Kwaw and Yang, 2012), from both foreign
and local investors in both private and public sector. Weak public sector institutional support
and ambiguous legislative framework in the construction industry cause project delivery
systems to fail to deliver expected outcomes and stakeholder expectations (Charles, 2006).
The complex nature and uniqueness of construction projects as previously mention amount to
some level of uncertainty and changes during implementation, therefore control of the
delivery process and the owner’s emphasis on critical factors influence the outcome of the
project (Amaeyam, Mensah and Aurthur, 2011).
2.4 Previous Research Studies conducted on determining construction project success reveal that determining project
success varies with every project an perspectives (Davies, 2013), there is no established
framework or specific criterion for judging construction project success which makes it
difficult to measure (Griffin and Page, 1996; Chen et al, 2010; Hughes, Tippet and Thomas,
2003; Schenhar et al, 2003).
Studies confirm that, optimally integrating a PDS and the efforts of project management from
the start, delivers expected project outcomes, particularly the achievement of “sustainability
goals” (Mollaoglu-Korkmaz, Swarup & Riley, 2011p. 71). Way (2005) in his “framework of
soft landings”, introduces a systematic way of ensuring sustainability of projects by
integrating feedback of “continual assessment” of project design into the operation phase
(Way, 2005; BSRIA, 2009 p.8). Therefore in theory, regardless of the PDS adopted, positive
project outcomes should be achieved when projects participants ensure effective project
management practices (De Wit, 1988).
Toor and Ogunlana in their study of problems in large-scale construction projects in Thailand,
reveal that design related problems contribute to project failure (Toor and Ogunlana, 2010).
They go on to suggest that in DBB sytems, where design is executed separately from
construction, “a complete and comprehensive design is critical in the success of implementing
the projec”t (Toor and Ogunlana, 2008 p.426). Abandoned projects, delayed project
completion, high operational and maintenance costs, unsustainable project facilities and
project knowledge gaps are attributed to failed PDSs (Anvuur, Kumaraswamy, Male, 2006;
Ahadzie, Proverbs and Olomolaiye, 2007;Ren, Kwaw and Yang, 2012; Smith and Jaggar,
2007).
Gisela Gaba September 2013
17
Doloi (2012) also identifies key risk attributes that influence cost, time and operational
performance of projects, and they include the “financial structure, government policy and
design complexity” (Doloi, 2012 p.316). He opines that, little emphasis is put on performance
of project facilities after completion due to the focus put on “project evaluation context”
(Doloi, 2012 p.316).
However, De Wit (1988) suggests “it is essential that a distinction is made between project
success and the success of the project management effort” (De Wit, 1988 p.164), where
project success is dependent on the degree to which project objectives are met (i.e. the impact
of the final project outcome), whiles project management success is dependent on meeting
time, cost and quality objectives (De Wit, 1988). Studies on project delivery do reveal
majority of project fail as a result of poor management of PDS (Ren, Kwaw and Yang, 2012),
but studies subsequent to his work integrate both project and project management success to
mean the same due to the evolution of the scope and demand of CP in recent times (Dainty,
Cheng and Moore, 2003). Heravi and Ilbeigi (2012), developed on the DeWits theory by
developing a quantitative model which evaluates project success based on the product success
(effect of the final product) and project management success (meeting cost, time and quality
objectives), and argues that the perspective considered in defining project success play a
critical part (Heravi and Ilbeigi, 2012).
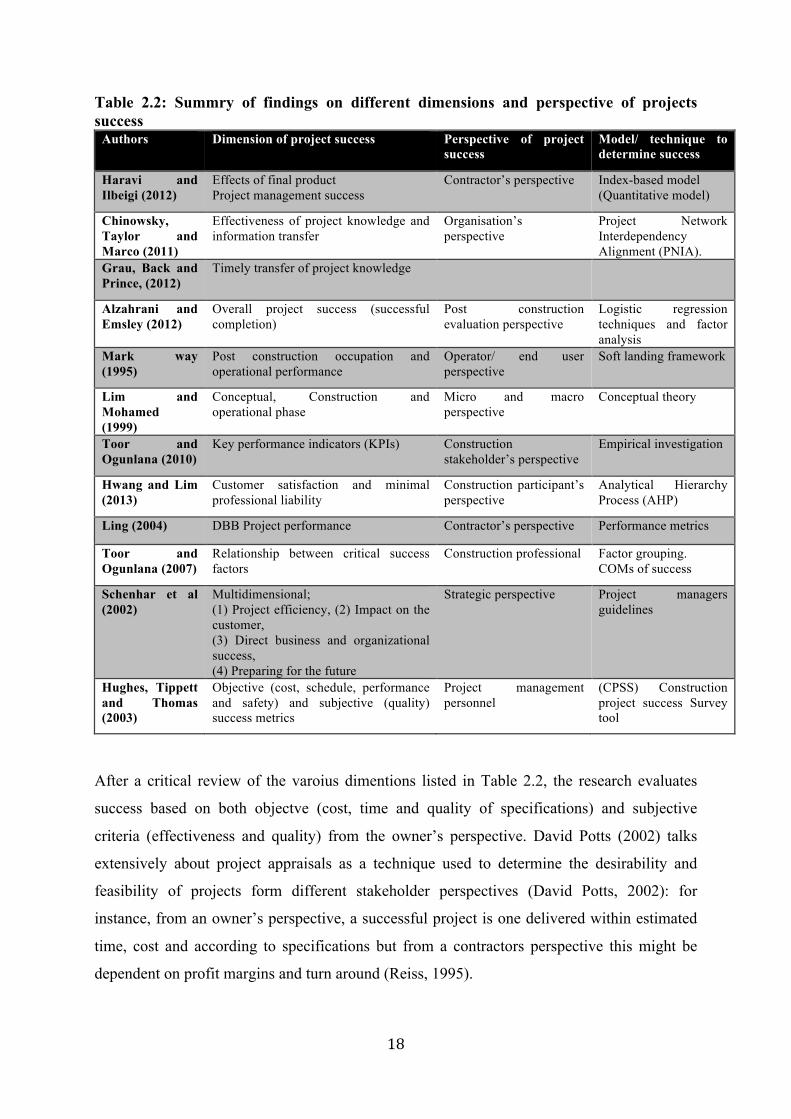
The different dimensions and perspectives of project success identified from existing
literature are listed in Table 2.2. Its concluded that stakeholders perceive success based on
factors considered critical to their area of interest (Diallo and Thuiller, 2004; Griffin and
Page, 1996). For instance, an end users perspective of a successful project is based on
satisfaction derived (Lim and Mohamed, 1999).
18
Table 2.2: Summry of findings on different dimensions and perspective of projects success
Authors Dimension of project success Perspective of project success
Model/ technique to determine success
Haravi and Ilbeigi (2012)
Effects of final product Project management success
Contractor’s perspective Index-based model (Quantitative model)
Chinowsky, Taylor and Marco (2011)
Effectiveness of project knowledge and information transfer
Organisation’s perspective
Project Network Interdependency Alignment (PNIA).
Grau, Back and Prince, (2012)
Timely transfer of project knowledge
Alzahrani and Emsley (2012)
Overall project success (successful completion)
Post construction evaluation perspective
Logistic regression techniques and factor analysis
Mark way (1995)
Post construction occupation and operational performance
Operator/ end user perspective
Soft landing framework
Lim and Mohamed (1999)
Conceptual, Construction and operational phase
Micro and macro perspective
Conceptual theory
Toor and Ogunlana (2010)
Key performance indicators (KPIs) Construction stakeholder’s perspective
Empirical investigation
Hwang and Lim (2013)
Customer satisfaction and minimal professional liability
Construction participant’s perspective
Analytical Hierarchy Process (AHP)
Ling (2004) DBB Project performance Contractor’s perspective Performance metrics
Toor and Ogunlana (2007)
Relationship between critical success factors
Construction professional Factor grouping. COMs of success
Schenhar et al (2002)
Multidimensional; (1) Project efficiency, (2) Impact on the customer, (3) Direct business and organizational success, (4) Preparing for the future
Strategic perspective Project managers guidelines
Hughes, Tippett and Thomas (2003)
Objective (cost, schedule, performance and safety) and subjective (quality) success metrics
Project management personnel
(CPSS) Construction project success Survey tool
After a critical review of the varoius dimentions listed in Table 2.2, the research evaluates
success based on both objectve (cost, time and quality of specifications) and subjective
criteria (effectiveness and quality) from the owner’s perspective. David Potts (2002) talks
extensively about project appraisals as a technique used to determine the desirability and
feasibility of projects form different stakeholder perspectives (David Potts, 2002): for
instance, from an owner’s perspective, a successful project is one delivered within estimated
time, cost and according to specifications but from a contractors perspective this might be
dependent on profit margins and turn around (Reiss, 1995).
Gisela Gaba September 2013
19
2.5 Role of the facility manager in project delivery
The role of the facility manger in any organization is to provide support services that satisfy
the clients business needs and support the core objective of the organization. Statistics of
projects failing and poor project performance implies the failure of both facility and project
manager to meet their client’s business needs (Brown, Hinks and Sneddon, 2001). The current
role of the facility/project manager:“strategic leader” (Schenhar et al. 2002 p.699) extends
beyond managing operations and processes and providing support services, but involves
executing strategic management strategy in executing project delivery systems to ensure
success (Schenhar et al. 2002). Having maximum control through consistent monitoring and
evaluation of project processes, enables “efficient positioning” (Doloi, 2012p.317) within
project management and allows efficient allocation of resources, sustainable project
performance and optimum project quality, while delivering on direct project objectives
(Meredith and Mantel, 2010; Shenhar et al, 2002). Brown, Hinks and Sneddon (2001) do
argue that, conventional practices and established roles of professionals in the construction
industry hinder best practice in project delivery at the management level (Brown, Hinks and
Sneddon, 2001).
Hence, “the core problem lies with the systems and approaches that are applied to the
management of new building projects rather than any technological or methodological issues
that are unique to construction” (Brown, Hinks and Sneddon, 2001 p.119).
The National audit office’s (NAO) (2011) study on 40 major projects in the United Kingdom
stated that quality of project initiation (planning and design) is “highly predictive of project
success” (NAO, 2011 p.4) over the long term. This supports the theory of this research that,
the PDS adopted can have long-term effects on efficient and effective operations after
completion.
2.6 Policy position In the UK, public procurement of works, products and services cover three main strands as
listed out in Table 2.3 (Erridge and McIlroy, 2002). Commercial, regulatory and social
considerations are taken into consideration when taking decisions on the how, what and who
is involved in the procurement process. Most often the commercial and regulatory aspects of
project delivery drives the delivery process, having more focus put on achieving the cost, time
and specification attributes of the project at the peril of the non-quantifiable aspects like
20
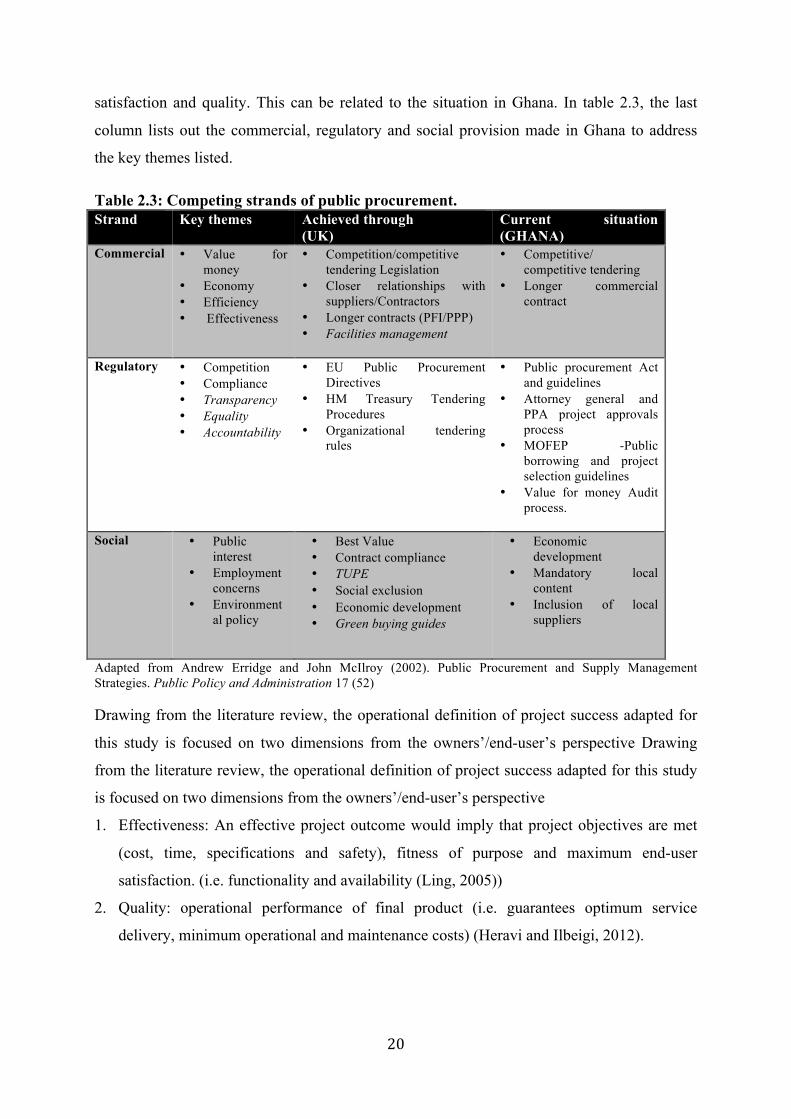
satisfaction and quality. This can be related to the situation in Ghana. In table 2.3, the last
column lists out the commercial, regulatory and social provision made in Ghana to address
the key themes listed. Table 2.3: Competing strands of public procurement. Strand Key themes Achieved through
(UK) Current situation (GHANA)
Commercial • Value for money
• Economy • Efficiency • Effectiveness
• Competition/competitive tendering Legislation
• Closer relationships with suppliers/Contractors
• Longer contracts (PFI/PPP) • Facilities management
• Competitive/ competitive tendering
• Longer commercial contract
Regulatory • Competition • Compliance • Transparency • Equality • Accountability
• EU Public Procurement Directives
• HM Treasury Tendering Procedures
• Organizational tendering rules
• Public procurement Act and guidelines
• Attorney general and PPA project approvals process
• MOFEP -Public borrowing and project selection guidelines
• Value for money Audit process.
Social • Public interest
• Employment concerns
• Environmental policy
• Best Value • Contract compliance • TUPE • Social exclusion • Economic development • Green buying guides
• Economic development
• Mandatory local content
• Inclusion of local suppliers
Adapted from Andrew Erridge and John McIlroy (2002). Public Procurement and Supply Management Strategies. Public Policy and Administration 17 (52) Drawing from the literature review, the operational definition of project success adapted for
this study is focused on two dimensions from the owners’/end-user’s perspective Drawing
from the literature review, the operational definition of project success adapted for this study
is focused on two dimensions from the owners’/end-user’s perspective
1. Effectiveness: An effective project outcome would imply that project objectives are met
(cost, time, specifications and safety), fitness of purpose and maximum end-user
satisfaction. (i.e. functionality and availability (Ling, 2005))
2. Quality: operational performance of final product (i.e. guarantees optimum service
delivery, minimum operational and maintenance costs) (Heravi and Ilbeigi, 2012).
Gisela Gaba September 2013
21
CHAPTER THREE HYPOTHESES DEVELOPMENT 3.1 Overview This chapter develops a theoretical framework based on deductions made the literature
review, to address research objective of the study. The key variable are extracted from
research objectives listed below, to determine how they relate to each other.
a. Examining the extent to which DBB and DB project delivery systems influence
project success, looking at success from an effectiveness and quality perspective.
b. Investigating the extent to which owner emphasis on cost and control hinders or
increases the effects of both systems on project success.
c. Studying the extent to which project effectiveness serves as a mechanism through
which DBB and DB influence project quality and how these phenomenon unfolds in
a developing country like Ghana
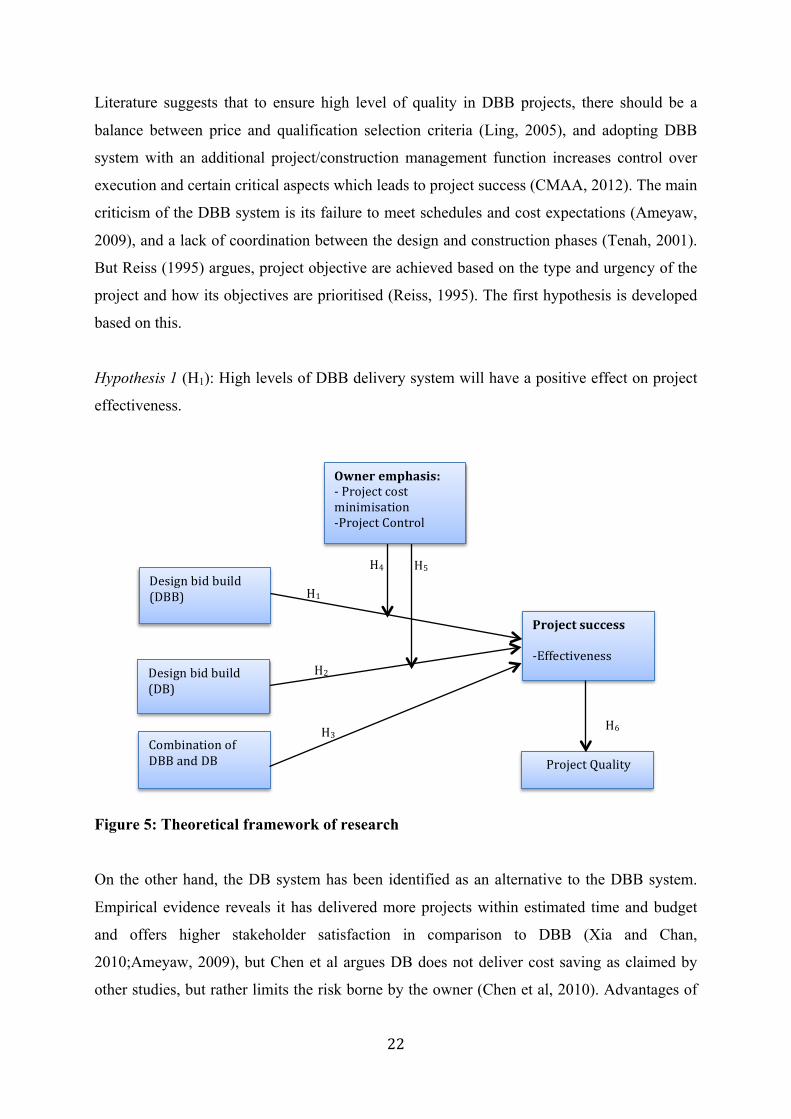
3.2 Theoretical framework To guide the direction of the study and keep focus on research objectives, a theoretical
framework is developed (Cooper and Schindler, 2010) as illustrated in Figure 5. This was
based on the theory that, the adoption of either DBB or DB delivery systems can positively or
negatively affect the level of project success depending on the emphasis owner’s puts on
either cost minimisation or project control as shown in Figure 5.
To form this theoretical framework, seven variables were identified from the objectives of the
research, and further to this six hypotheses were developed for empirical testing. These
variable are discussed in the following subsections.
3.3 DBB and DB as independent variables The objective of the study is to determine the relationship between DBB and DB and project
success, by investigating whether they predict whether a project is successful or not: making
DBB are DB the independent variables. The DBB and the DB system are the most commonly
adopted systems and according to literature both systems have strengths and weaknesses that
could lead to and increase or decrease in he realisation of a successful project (AIACC, 2007).
22
Literature suggests that to ensure high level of quality in DBB projects, there should be a
balance between price and qualification selection criteria (Ling, 2005), and adopting DBB
system with an additional project/construction management function increases control over
execution and certain critical aspects which leads to project success (CMAA, 2012). The main
criticism of the DBB system is its failure to meet schedules and cost expectations (Ameyaw,
2009), and a lack of coordination between the design and construction phases (Tenah, 2001).
But Reiss (1995) argues, project objective are achieved based on the type and urgency of the
project and how its objectives are prioritised (Reiss, 1995). The first hypothesis is developed
based on this.
Hypothesis 1 (H1): High levels of DBB delivery system will have a positive effect on project
effectiveness.
Figure 5: Theoretical framework of research On the other hand, the DB system has been identified as an alternative to the DBB system.
Empirical evidence reveals it has delivered more projects within estimated time and budget
and offers higher stakeholder satisfaction in comparison to DBB (Xia and Chan,
2010;Ameyaw, 2009), but Chen et al argues DB does not deliver cost saving as claimed by
other studies, but rather limits the risk borne by the owner (Chen et al, 2010). Advantages of
Project success -‐Effectiveness
Design bid build (DBB)
Combination of DBB and DB
H1
H2
H3
H4 H5
Design bid build (DB)
Owner emphasis: -‐ Project cost minimisation -‐Project Control
Project Quality
H6
Gisela Gaba September 2013
23
this system include project coordination due to the combined contracting of design and
construction phase, involvement of contractor in the design phase, which results in better
quality of design. (Tenah, 2001; Trauner consulting service, 2007). Criticisms of the system
include minimal involvement of owner in design and construction, little guarantee of client’s
expectations or technical specification due to the lack of checks and monitoring of on-going
works and the owner is allowed very little control of the process (Tenah, 2001). To determine
the effect of DB systems on project success, the second hypothesis is developed:
Hypothesis 2 (H2): High levels of DB delivery system will have a positive effect on project
effectiveness.
Miller et al (2000), in his study suggest the simultaneous adoption of multiple project delivery
methods. They argue that both DBB and DB systems can adopted in coherence, to take
advantage of their strengths for greater project success a third hypothesis is developed.
Hypothesis 3 (H3): The effect of execution of high levels of both DB and DBB delivery
system result in high project effectiveness
3.4 Cost and control as moderating variables The model of the DBB described in the previous chapter contracts separate entities to execute
the design and construction phase of projects, giving the owner maximum control over project
management, cost and final project outcome. Tenah (2001) describes the execution of DBB as
“sequential” (Tenah, 2001 p.33), which increases the potential for time and scheduled delays
that have cost implications (Meredith and Mantel, 2010). Whereas in DB systems, a single
entity is contracted to execute the design and construction of a project based on owner’s
requirements, meaning the final outcome is to a large extent determined to a large extent by
“competence, comprehension, communication and commitment” (Toor and Ogunlana, 2007
p.425) of contractor’s team. The model of the DB system allows for very little participation of
the owner and majority of the risk is transferred to the contractor (Xia and Chan, 2010).
Further to this, “If the owner wants to control the project, it is better to select DBB; if the
owner wants to minimize the risk, DB would be a better choice” (Chen et al claims, 2010).
The later could imply in this case that, owner emphasis on variables like control and cost may
24
act to facilitate or inhibit the extent to which the delivery system is perceived to affect project
success (project effectiveness and quality). Hypotheses 4 and 5 are developed to test this.
Hypothesis 4 (H4): The effect of DBB delivery system on project effectiveness will be higher
when owner emphasis is on cost minimisation and lower when owners’ emphasis is on
control.
Hypothesis 5 (H5): The effect of DB delivery system on project effectiveness will be higher
when owner’s emphasis is on project control and lower when owners’ emphasis is on cost
minimisation.
3.5 Project Quality It is argued there is distinction between achieving project/product success and project
management success (DeWit, 1988 and Heravi and Ilbeigi, 2012), where product success is
related to the attributes of the final outcome and project management success is related to
achieving pre-set objectives on cost, time and quality specification. To determine how DBB
and DB systems influence project success, not only in relation to a subjective criteria -
effectiveness (defined in Chapter 2) but also in relation to post completion success - project
quality. Hypothesis 6 was developed to discover whether project effectiveness was a
mechanism through which DBB and/or DB system can achieve project quality.
Hypothesis 6 (H6): The effect of high levels of project effectiveness (project success) is
related to greater levels of project quality.
In sum, based on literature reviewed six hypotheses were developed to determine the
relationship between independent variable-DBB and DB and dependent variable-project
effectiveness, and the role of moderating variables- cost and control on achieving project
success (effectiveness) in public sector organisation.
Gisela Gaba September 2013
25
CHAPTER FOUR
RESEARCH METHODOLOGY
4.1 Overview The research methodology outlines the systematic approach adopted to achieve the objectives
of the research and provide empirical evidence to support it (Cooper and Schindler, 2010). To
undertake this investigation, a quantitative approach was adopted to provide empirical
evidence to explain the relationship between project delivery systems (DBB or DB)
implemented and key variables identified as critical in achieving project success (i.e. cost
minimization, project control), and how they interact to achieve project effectiveness and high
project (quality success).
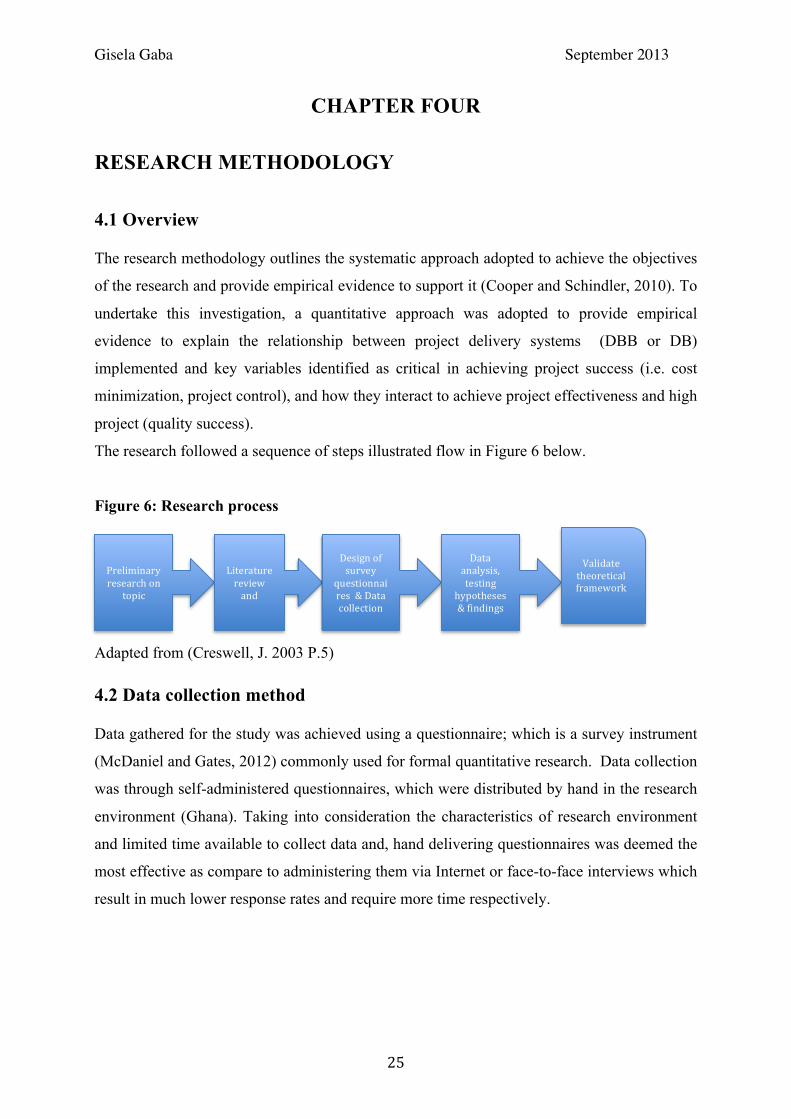
The research followed a sequence of steps illustrated flow in Figure 6 below.
Figure 6: Research process
Adapted from (Creswell, J. 2003 P.5)
4.2 Data collection method Data gathered for the study was achieved using a questionnaire; which is a survey instrument
(McDaniel and Gates, 2012) commonly used for formal quantitative research. Data collection
was through self-administered questionnaires, which were distributed by hand in the research
environment (Ghana). Taking into consideration the characteristics of research environment
and limited time available to collect data and, hand delivering questionnaires was deemed the
most effective as compare to administering them via Internet or face-to-face interviews which
result in much lower response rates and require more time respectively.
Preliminary research on
topic
Literature review and
Design of survey
questionnaires & Data collection
Data analysis, testing
hypotheses & findings
Validate theoretical framework
26
4.3 Data Collection Instrument Designing the questionnaire for collecting relevant data for the study played a critical part in
the data collection process. To enable respondents to easily understand the questions and
make increase the willingness and ability to answer questions, clear and precise scaled-
response questions were used. This helped capture “measure of intensity of a respondent
answers” (McDaniel and Gates, 2012 p.348) defined by a 7 -point rating scale: 1 indicating
least extremity, importance expectation and 7 representing high extremity, importance
expectation of the statements listed in section 1, 2a and 2b respectively. This gave respondent
a balanced scale of measure. A total of 33 items were contained in the questionnaire
(Appendix II), 29 items measured conceived variables identified and four helped determine
the reliability of respondents. A total of 3 sections were created to capture information needed
to measure conceived variables. Section one contained eight questions focused on DBB and
DB delivery systems and processes involved, section two focused on project objectives
considered key and the level of achievement of these objectives and section three captured
information on individual characteristics of the respondent as a measure to ensure reliability
of respondent’s responses, this is attached in Apendix II.
4.4 Sample Frame In selecting the sample for the research, characteristics of respondents (i.e. the population of
interest) was taken into consideration (McDaniel and Gates, 2012). Based on preliminary
investigation and context of the research, a representative sample of public sector
professionals was drawn from public sector organisations, departments and ministries.
Specifically focusing on professionals working on projects or with prior experience and
understanding of project delivery systems to ensure reliability of responses. Due to limitation
of resources, the sample frame was predominantly focused on government departments and
sector ministries in the Greater Accra region for the convenience of their geographical
location (i.e. centrally located in the business district of the capital city). In sum, respondents
were drawn from five government ministries: Ministry of Health, Ministry of Education.
Ministry of Roads and Highways, Ministry of Energy, Ministry of Finance and Economic
Planning; three state owned companies and four public agencies (NHS estate management
unit, MOH project management unit and special projects units)
4.5 Response Rate
Gisela Gaba September 2013
27
A total of 120 questionnaires were distributed, with the target of achieving a response rate of
80 per cent, but on completion of the survey 101 valid responses were received, giving a
response rate of 84.2 per cent higher that the set target. This provided adequate data for
statistical inferences for the research. The response rate of 84 per cent, which is very high,
could be as a result of the following factors:
1. Questionnaire were handed out manually to respondents by the researcher with a cover
letter (Appendix I) explaining the purpose of the study.
2. Familiarity of the researcher in dealing with public sector organisations due to prior
business relationships with various sectorial Ministries.
3. Clarity of questions and type of questions used could have influences the respondents
willingness to complete the questionnaires
4. Familiarity of the researcher with working with various sector ministries prior to the
research facilitated distribution of questionnaire and increased access to respondents.
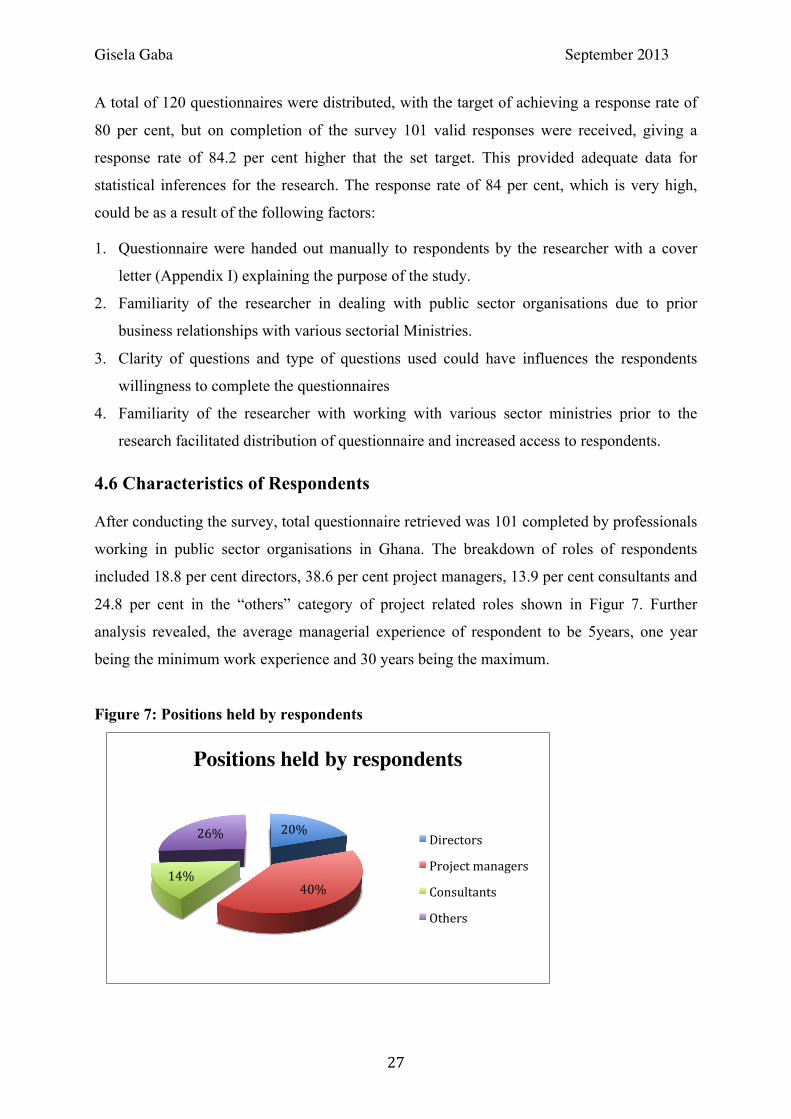
4.6 Characteristics of Respondents After conducting the survey, total questionnaire retrieved was 101 completed by professionals
working in public sector organisations in Ghana. The breakdown of roles of respondents
included 18.8 per cent directors, 38.6 per cent project managers, 13.9 per cent consultants and
24.8 per cent in the “others” category of project related roles shown in Figur 7. Further
analysis revealed, the average managerial experience of respondent to be 5years, one year
being the minimum work experience and 30 years being the maximum.
Figure 7: Positions held by respondents
20%
40% 14%
26%
Positions held by respondents
Directors
Project managers
Consultants
Others
28
4.7 Data Analysis Having cleaned the data collected, including imputation of missing values and recoding of
variables (Tabachnick and Fidell, 2007), a series of statistical analysis was performed using
the Statistical Package for the Social Science (SPSS) data analysis software to enable
further exploration of the characteristics of the variables understudy to validate the research
theory. In following recommended procedures (e.g, Hair et al., 2006), the following sets of
statistical analyses were carried out:
1. Validity and reliability of questions (items)
2. Summation of the items to create new variables for further inference.
3. Calculation of correlation and descriptive statistic values
4. Moderated regression analysis
5. Mediation analysis of variable
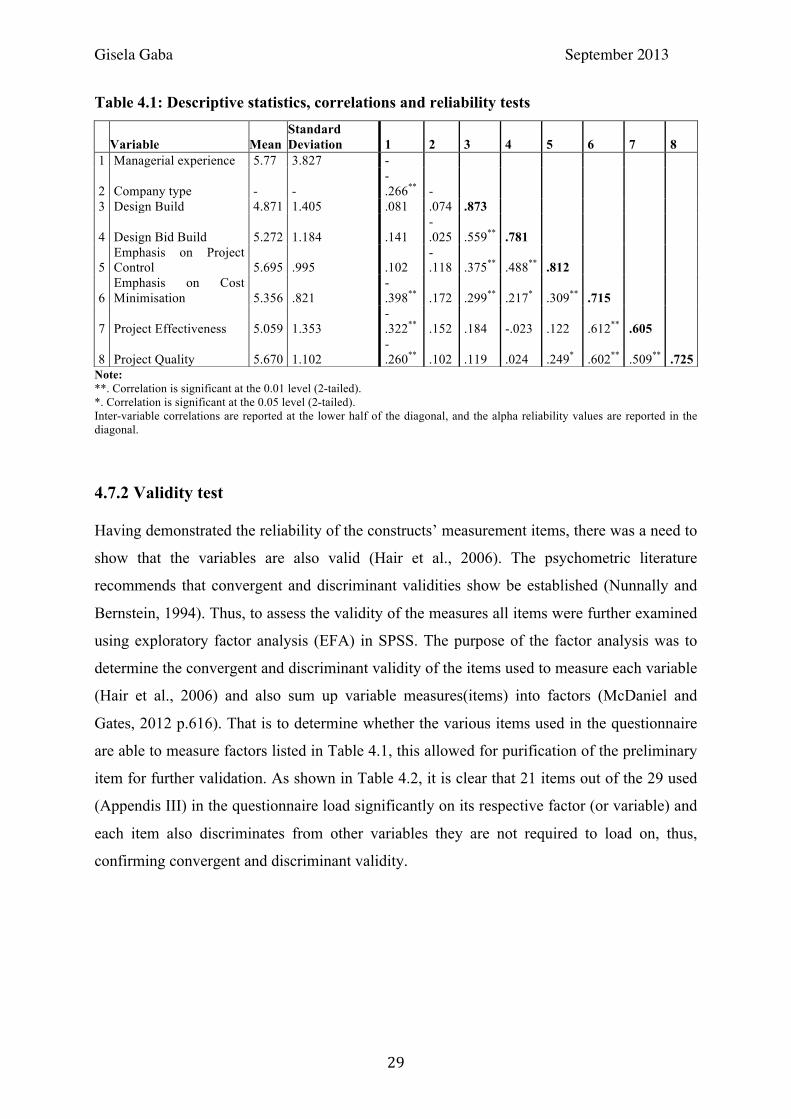
4.7.1 Reliability test First, reliability of all multi-item constructs (that is constructs that were measured with
multiple questions or statements) was undertaken. Hair et al. (2006) and Nunnally and
Berstein’s (1994) recommendation for the use of Cronbach’s Alpha was used to estimate the
reliability of the items. Cronbach’s Alpha analyses the internal consistency of sets of items
that are purported to measure a specific unobservable variable (Nunnally and Berstein, 1994).
High values of Alpha values (α >.60) are recommended. Accordingly, all variables were
tested to ensure that they exhibited high alpha values. Where a specific variable contributed to
poor alpha value, that variable is deleted accordingly. Consequently, Table 4.1 was produced
to show the level of reliability of each multi-item construct. As Table 4.1 shows, all variables
exceed the recommended cut off range for reliability. The lowest alpha value is .605 (project
effectiveness) and the highest is .873 (design build). Furthermore, an inspection of Table 4.1
indicates that where sets of variables are required to correlate highly, this was uncovered (e.g.
design build versus Design Bid Build). Thus, all variables can be viewed as internally
consistent throughout.
Gisela Gaba September 2013
29
Table 4.1: Descriptive statistics, correlations and reliability tests
Note: **. Correlation is significant at the 0.01 level (2-tailed). *. Correlation is significant at the 0.05 level (2-tailed). Inter-variable correlations are reported at the lower half of the diagonal, and the alpha reliability values are reported in the diagonal.
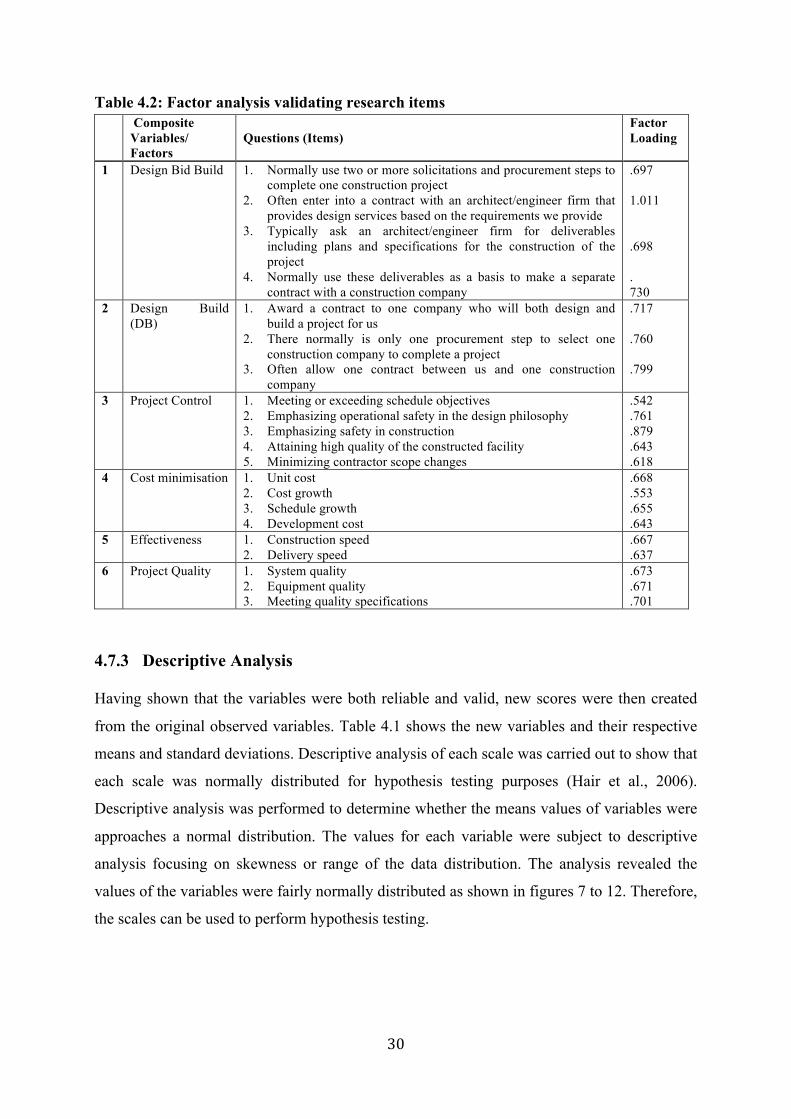
4.7.2 Validity test Having demonstrated the reliability of the constructs’ measurement items, there was a need to
show that the variables are also valid (Hair et al., 2006). The psychometric literature
recommends that convergent and discriminant validities show be established (Nunnally and
Bernstein, 1994). Thus, to assess the validity of the measures all items were further examined
using exploratory factor analysis (EFA) in SPSS. The purpose of the factor analysis was to
determine the convergent and discriminant validity of the items used to measure each variable
(Hair et al., 2006) and also sum up variable measures(items) into factors (McDaniel and
Gates, 2012 p.616). That is to determine whether the various items used in the questionnaire
are able to measure factors listed in Table 4.1, this allowed for purification of the preliminary
item for further validation. As shown in Table 4.2, it is clear that 21 items out of the 29 used
(Appendis III) in the questionnaire load significantly on its respective factor (or variable) and
each item also discriminates from other variables they are not required to load on, thus,
confirming convergent and discriminant validity.
Variable Mean Standard Deviation 1 2 3 4 5 6 7 8
1 Managerial experience 5.77 3.827 -
2 Company type - - -.266** -
3 Design Build 4.871 1.405 .081 .074 .873
4 Design Bid Build 5.272 1.184 .141 -.025 .559** .781
5 Emphasis on Project Control 5.695 .995 .102
-.118 .375** .488** .812
6 Emphasis on Cost Minimisation 5.356 .821
-.398** .172 .299** .217* .309** .715
7 Project Effectiveness 5.059 1.353 -.322** .152 .184 -.023 .122 .612** .605
8 Project Quality 5.670 1.102 -.260** .102 .119 .024 .249* .602** .509** .725
30
Table 4.2: Factor analysis validating research items Composite
Variables/ Factors
Questions (Items)
Factor Loading
1 Design Bid Build 1. Normally use two or more solicitations and procurement steps to complete one construction project
2. Often enter into a contract with an architect/engineer firm that provides design services based on the requirements we provide
3. Typically ask an architect/engineer firm for deliverables including plans and specifications for the construction of the project
4. Normally use these deliverables as a basis to make a separate contract with a construction company
.697 1.011 .698 . 730
2 Design Build (DB)
1. Award a contract to one company who will both design and build a project for us
2. There normally is only one procurement step to select one construction company to complete a project
3. Often allow one contract between us and one construction company
.717 .760 .799
3 Project Control
1. Meeting or exceeding schedule objectives 2. Emphasizing operational safety in the design philosophy 3. Emphasizing safety in construction 4. Attaining high quality of the constructed facility 5. Minimizing contractor scope changes
.542
.761
.879
.643
.618 4 Cost minimisation 1. Unit cost
2. Cost growth 3. Schedule growth 4. Development cost
.668
.553
.655
.643 5 Effectiveness
1. Construction speed 2. Delivery speed
.667
.637 6 Project Quality 1. System quality
2. Equipment quality 3. Meeting quality specifications
.673
.671
.701
4.7.3 Descriptive Analysis
Having shown that the variables were both reliable and valid, new scores were then created
from the original observed variables. Table 4.1 shows the new variables and their respective
means and standard deviations. Descriptive analysis of each scale was carried out to show that
each scale was normally distributed for hypothesis testing purposes (Hair et al., 2006).
Descriptive analysis was performed to determine whether the means values of variables were
approaches a normal distribution. The values for each variable were subject to descriptive
analysis focusing on skewness or range of the data distribution. The analysis revealed the
values of the variables were fairly normally distributed as shown in figures 7 to 12. Therefore,
the scales can be used to perform hypothesis testing.
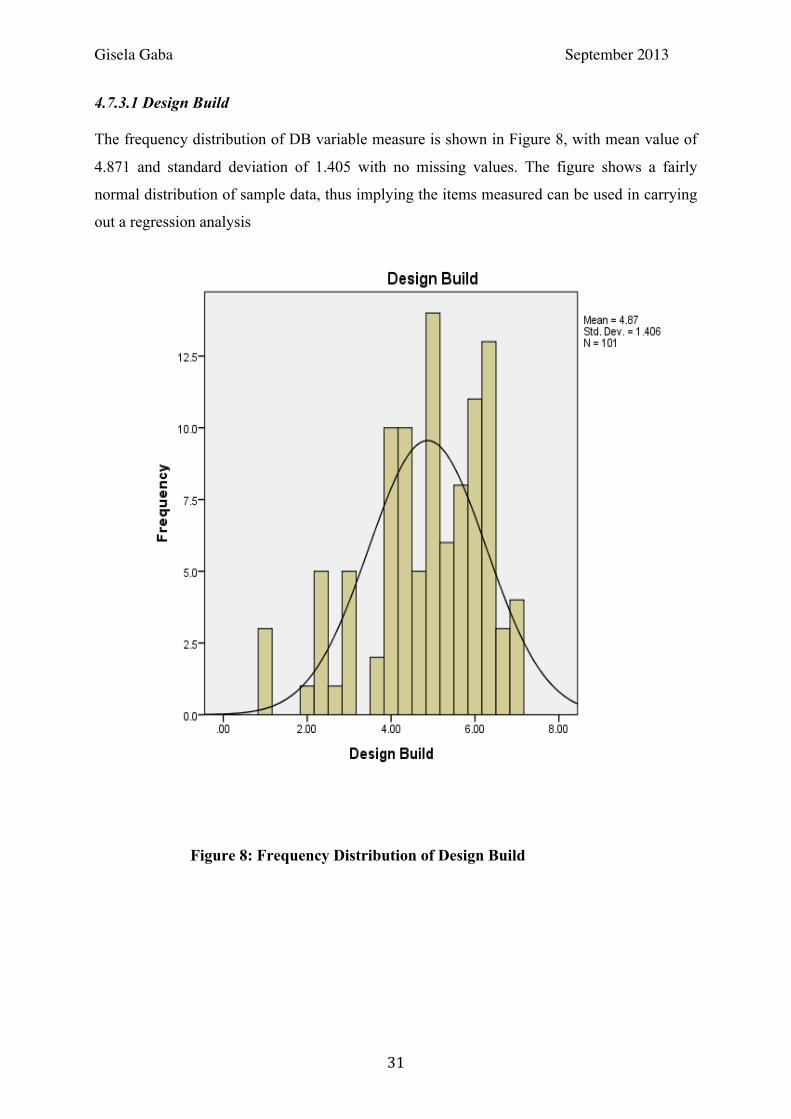
Gisela Gaba September 2013
31
4.7.3.1 Design Build The frequency distribution of DB variable measure is shown in Figure 8, with mean value of
4.871 and standard deviation of 1.405 with no missing values. The figure shows a fairly
normal distribution of sample data, thus implying the items measured can be used in carrying
out a regression analysis
Figure 8: Frequency Distribution of Design Build
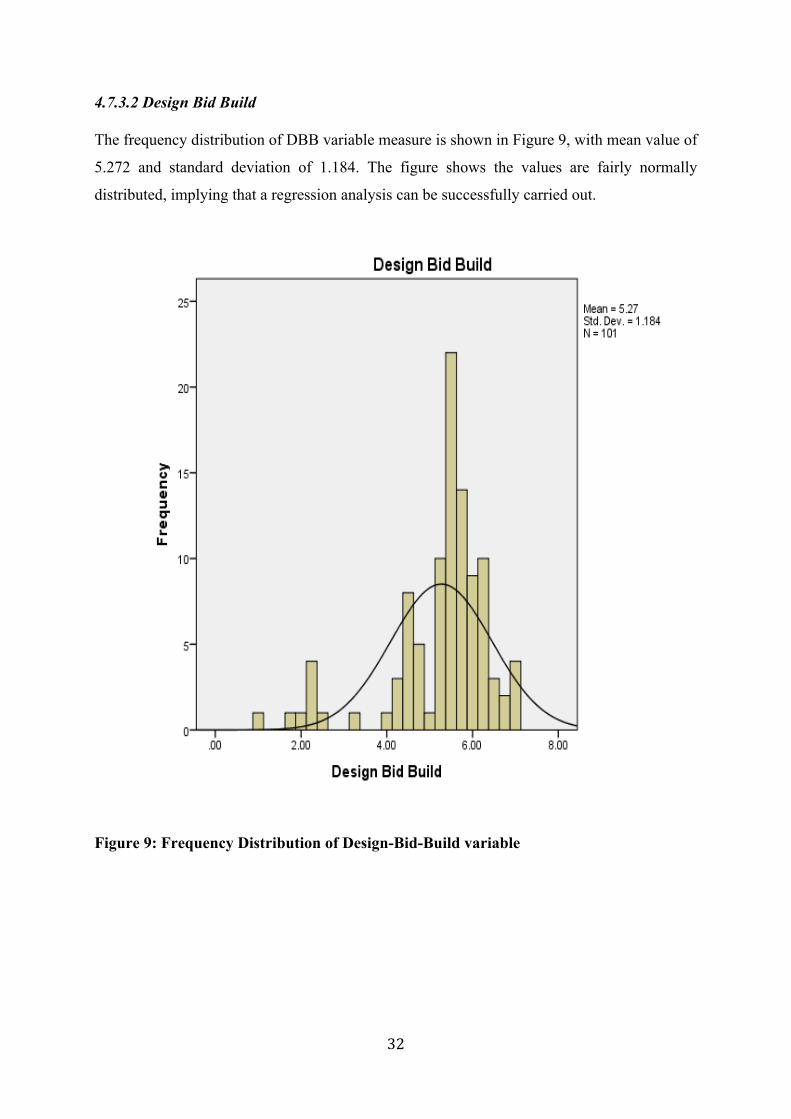
32
4.7.3.2 Design Bid Build The frequency distribution of DBB variable measure is shown in Figure 9, with mean value of
5.272 and standard deviation of 1.184. The figure shows the values are fairly normally
distributed, implying that a regression analysis can be successfully carried out.
Figure 9: Frequency Distribution of Design-Bid-Build variable
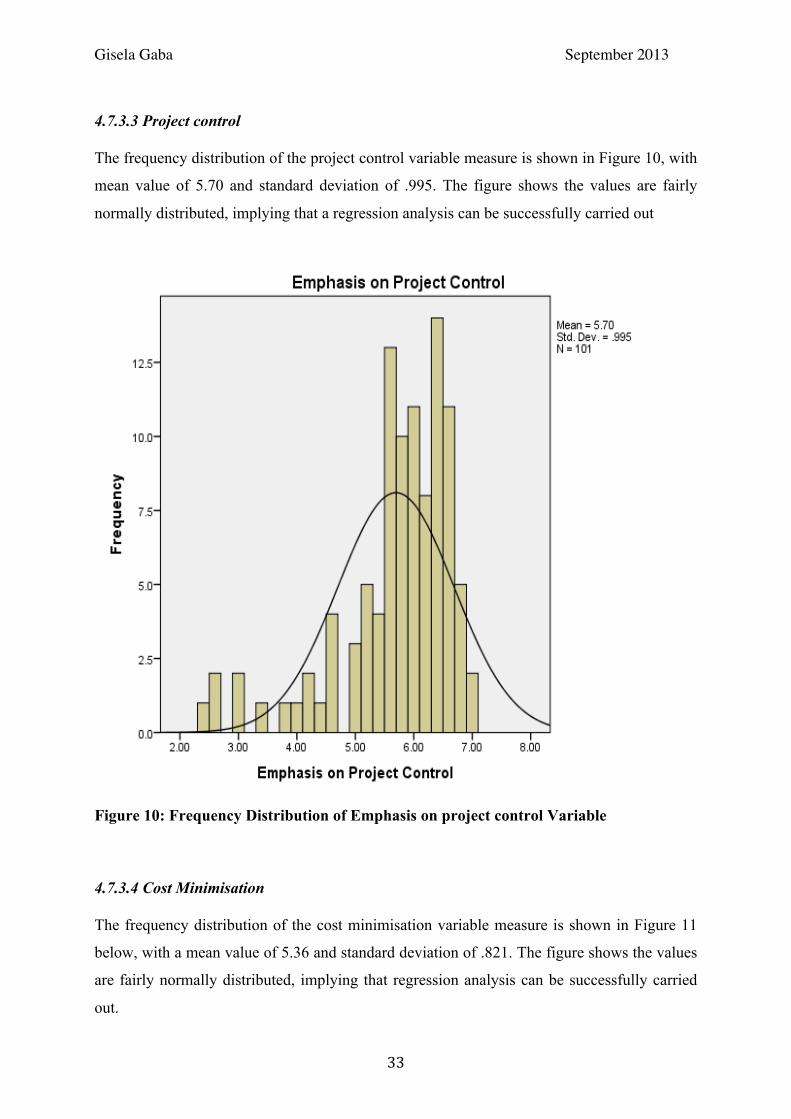
Gisela Gaba September 2013
33
4.7.3.3 Project control The frequency distribution of the project control variable measure is shown in Figure 10, with
mean value of 5.70 and standard deviation of .995. The figure shows the values are fairly
normally distributed, implying that a regression analysis can be successfully carried out
Figure 10: Frequency Distribution of Emphasis on project control Variable
4.7.3.4 Cost Minimisation The frequency distribution of the cost minimisation variable measure is shown in Figure 11
below, with a mean value of 5.36 and standard deviation of .821. The figure shows the values
are fairly normally distributed, implying that regression analysis can be successfully carried
out.
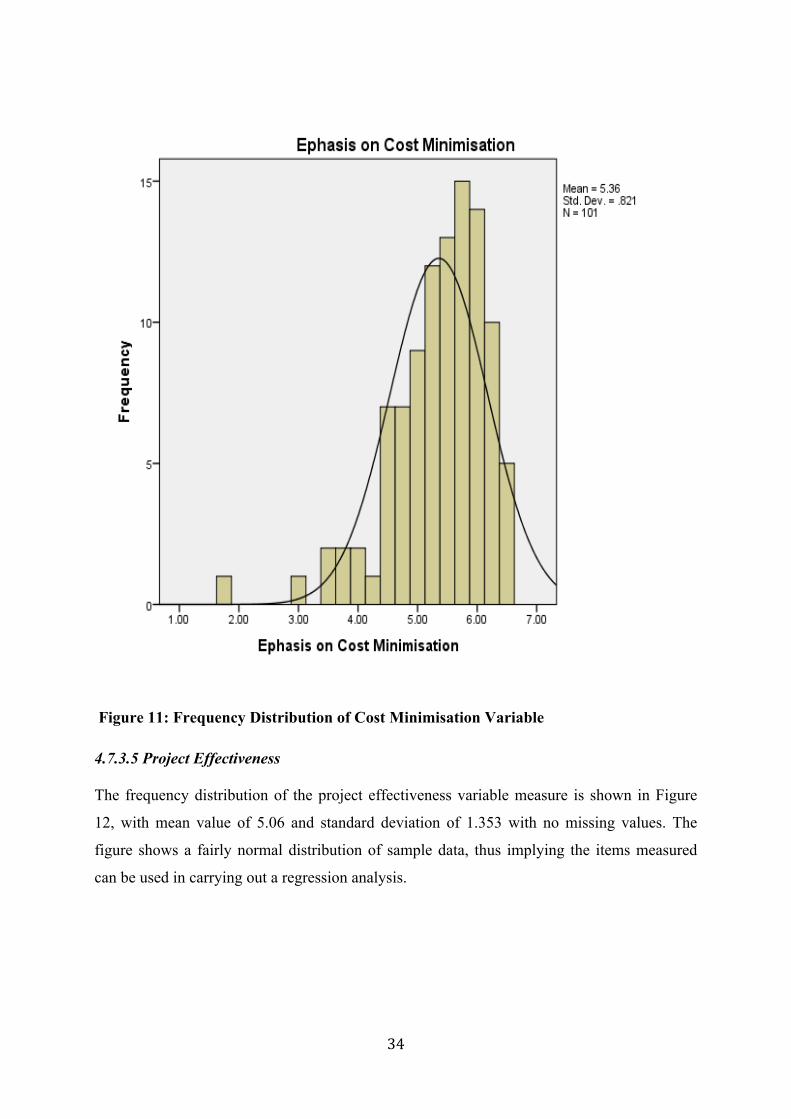
34
Figure 11: Frequency Distribution of Cost Minimisation Variable
4.7.3.5 Project Effectiveness The frequency distribution of the project effectiveness variable measure is shown in Figure
12, with mean value of 5.06 and standard deviation of 1.353 with no missing values. The
figure shows a fairly normal distribution of sample data, thus implying the items measured
can be used in carrying out a regression analysis.
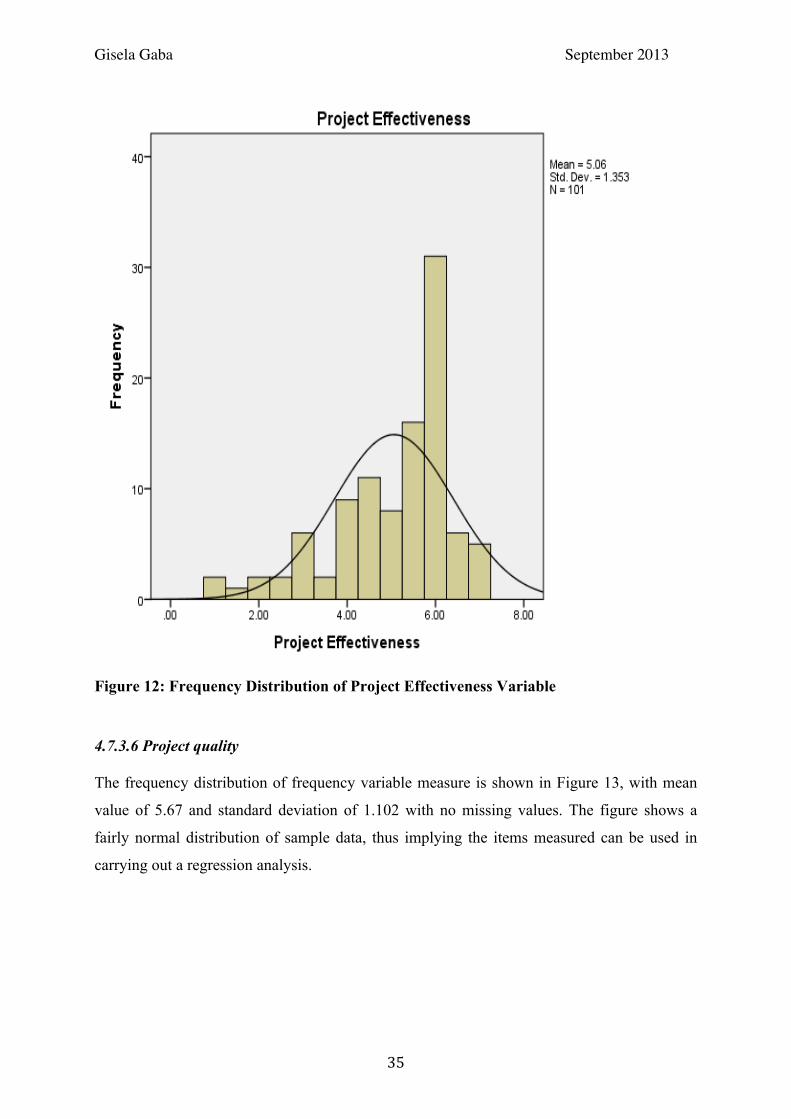
Gisela Gaba September 2013
35
Figure 12: Frequency Distribution of Project Effectiveness Variable
4.7.3.6 Project quality The frequency distribution of frequency variable measure is shown in Figure 13, with mean
value of 5.67 and standard deviation of 1.102 with no missing values. The figure shows a
fairly normal distribution of sample data, thus implying the items measured can be used in
carrying out a regression analysis.
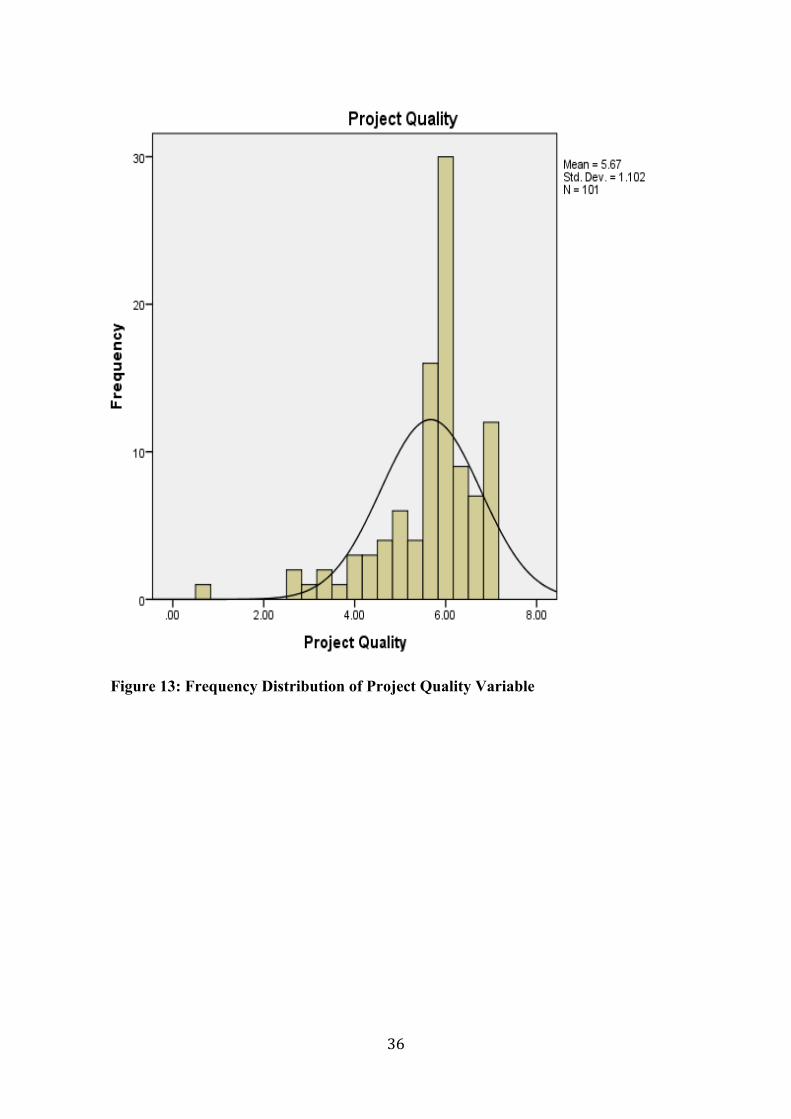
36
Figure 13: Frequency Distribution of Project Quality Variable
Gisela Gaba September 2013
37
CHAPTER FIVE FINDINGS 5.1 Results of Regression Analysis After demonstrating that the items used to measure each construct are reliable, valid and
normally distributed, hierarchical moderated regression analysis was undertaken using
ordinary least square approach, in line with the literature (Hair et al., 2006). First of all, to
analyse the effect of DBB and DB on project effectiveness, multiple regression analyses was
used in Model 1. Then secondly, bivariate regression was used to analyse the effect of project
effectiveness on project quality in Model 3, which is considered the final outcome of project
success. Finally, to examine how DBB and DB interact with each other, and to test the extent
to which owners’ emphasis on project cost minimisation (i.e. efficiency) versus project
control, hierarchical moderated regression was used. The use of multiplicative interactions in
regression analysis has the potential to introduce multicollinearity (i.e. increase correlation
between the independent variables), which makes interpretation difficult. Therefore, before
the moderated regression was undertaken, all the independent variables were mean-centred
(i.e. the means values were subtracted from the originally averaged variables) (Aiken and
West, 1991). As can be seen in Table 5.1, the variance inflation factors (VIF) of all variables
included in the moderating effect analysis remain substantially below the minimum cut-off
point of 10 (Hair et al., 2006).
To examine the hypotheses themselves, three regression models were estimated. The first
model looked at the direct effects of DBB, DB, cost minimisation and control on project
effectiveness. Model 1 produced an R2 value of 41%, which is a sufficient explanation of the
variance in the dependent variable and an additional 8% variance was explained when Model
2 was estimated (Tabachnick and Fidell, 2012). Looking at Table 5.1 further, it can be seen
that DBB has negative relationship with project effectiveness (β = -.225; t-value = -2.223; p <
.05), while DB has a significant positive relationship with project effectiveness (β = .126; t-
value = 1.290; p < .10). Therefore, it could be argued that DBB and DB have opposing effects
on project effectiveness, which is interpreted as, when the effectiveness of one system
increases, the effectiveness of the other system decreases. This could therefore be taken to
mean, when both system are implemented simultaneously, they provide competing
implications for project managers.
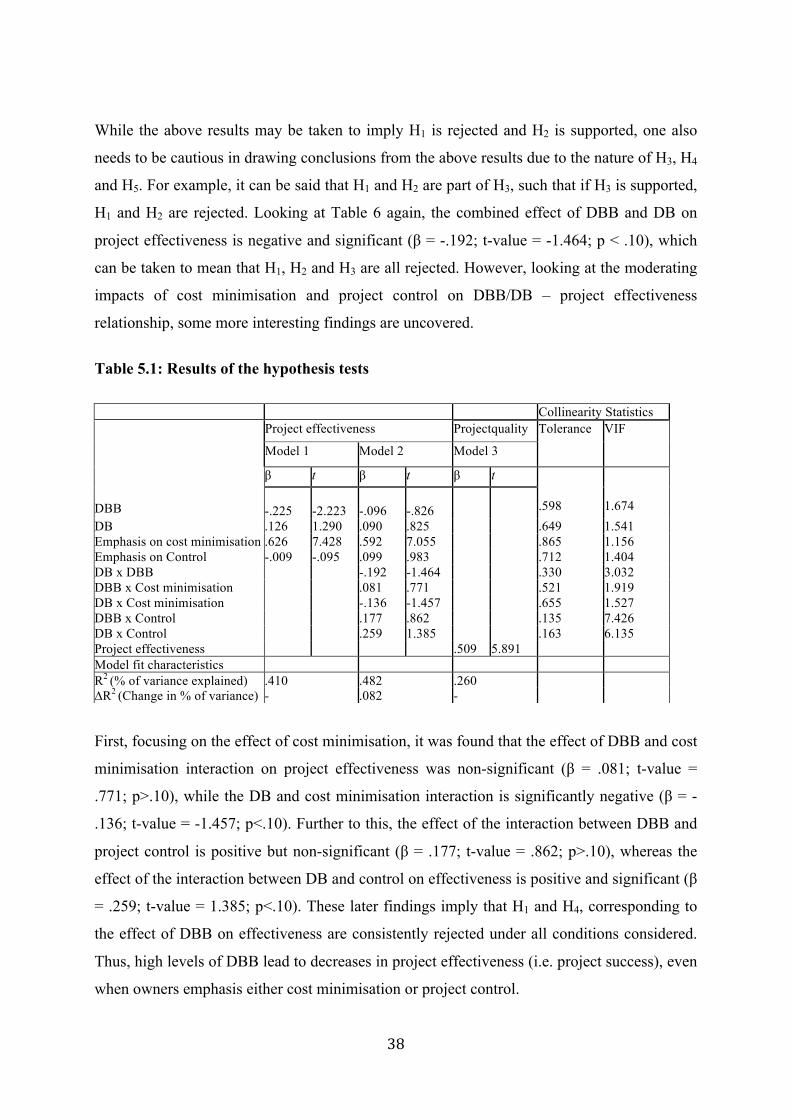
38
While the above results may be taken to imply H1 is rejected and H2 is supported, one also
needs to be cautious in drawing conclusions from the above results due to the nature of H3, H4
and H5. For example, it can be said that H1 and H2 are part of H3, such that if H3 is supported,
H1 and H2 are rejected. Looking at Table 6 again, the combined effect of DBB and DB on
project effectiveness is negative and significant (β = -.192; t-value = -1.464; p < .10), which
can be taken to mean that H1, H2 and H3 are all rejected. However, looking at the moderating
impacts of cost minimisation and project control on DBB/DB – project effectiveness
relationship, some more interesting findings are uncovered.
Table 5.1: Results of the hypothesis tests
First, focusing on the effect of cost minimisation, it was found that the effect of DBB and cost
minimisation interaction on project effectiveness was non-significant (β = .081; t-value =
.771; p>.10), while the DB and cost minimisation interaction is significantly negative (β = -
.136; t-value = -1.457; p<.10). Further to this, the effect of the interaction between DBB and
project control is positive but non-significant (β = .177; t-value = .862; p>.10), whereas the
effect of the interaction between DB and control on effectiveness is positive and significant (β
= .259; t-value = 1.385; p<.10). These later findings imply that H1 and H4, corresponding to
the effect of DBB on effectiveness are consistently rejected under all conditions considered.
Thus, high levels of DBB lead to decreases in project effectiveness (i.e. project success), even
when owners emphasis either cost minimisation or project control.
Collinearity Statistics
Project effectiveness Projectquality Tolerance VIF
Model 1 Model 2 Model 3
DBB
β t β t β t .598
1.674
-.225
-2.223
-.096
-.826
DB .126 1.290 .090 .825 .649 1.541 Emphasis on cost minimisation .626 7.428 .592 7.055 .865 1.156 Emphasis on Control -.009 -.095 .099 .983 .712 1.404 DB x DBB -.192 -1.464 .330 3.032 DBB x Cost minimisation .081 .771 .521 1.919 DB x Cost minimisation -.136 -1.457 .655 1.527 DBB x Control .177 .862 .135 7.426 DB x Control .259 1.385 .163 6.135 Project effectiveness .509 5.891 Model fit characteristics R2 (% of variance explained) .410 .482 .260 ∆R2 (Change in % of variance) - .082 -
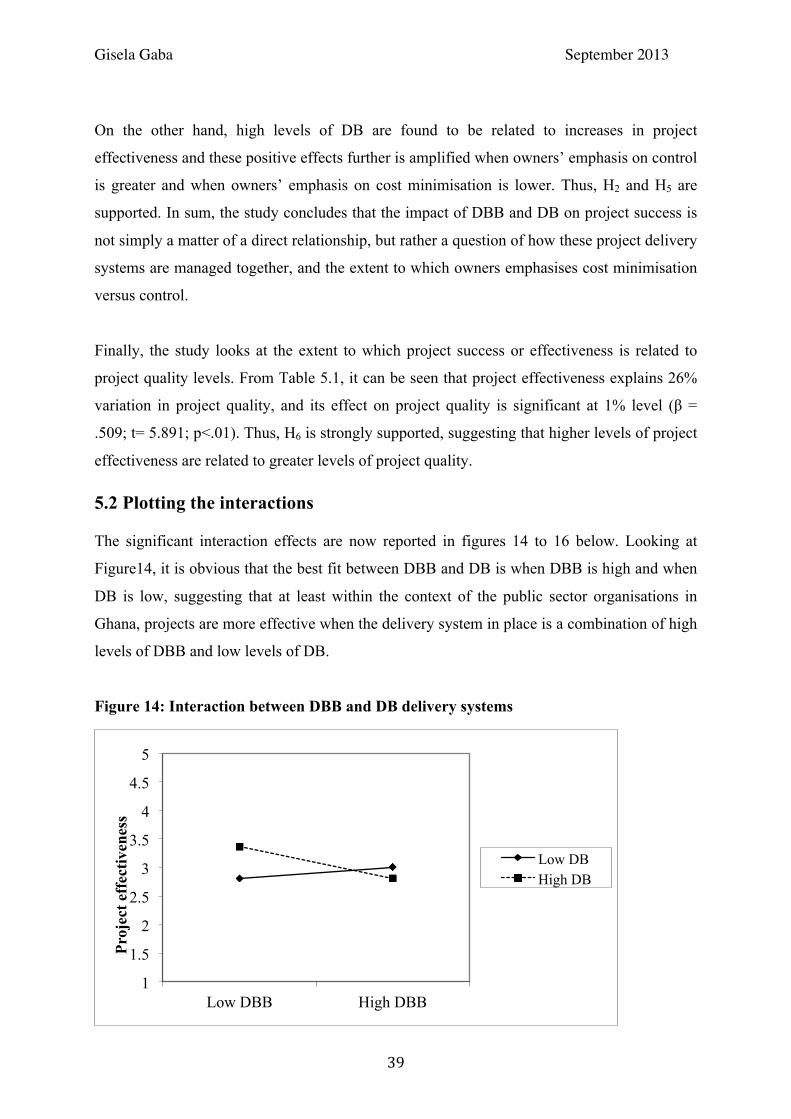
Gisela Gaba September 2013
39
1
1.5
2
2.5
3
3.5
4
4.5
5
Low DBB High DBB
Proj
ect e
ffec
tiven
ess
Low DB High DB
On the other hand, high levels of DB are found to be related to increases in project
effectiveness and these positive effects further is amplified when owners’ emphasis on control
is greater and when owners’ emphasis on cost minimisation is lower. Thus, H2 and H5 are
supported. In sum, the study concludes that the impact of DBB and DB on project success is
not simply a matter of a direct relationship, but rather a question of how these project delivery
systems are managed together, and the extent to which owners emphasises cost minimisation
versus control.
Finally, the study looks at the extent to which project success or effectiveness is related to
project quality levels. From Table 5.1, it can be seen that project effectiveness explains 26%
variation in project quality, and its effect on project quality is significant at 1% level (β =
.509; t= 5.891; p<.01). Thus, H6 is strongly supported, suggesting that higher levels of project
effectiveness are related to greater levels of project quality.
5.2 Plotting the interactions The significant interaction effects are now reported in figures 14 to 16 below. Looking at
Figure14, it is obvious that the best fit between DBB and DB is when DBB is high and when
DB is low, suggesting that at least within the context of the public sector organisations in
Ghana, projects are more effective when the delivery system in place is a combination of high
levels of DBB and low levels of DB.
Figure 14: Interaction between DBB and DB delivery systems
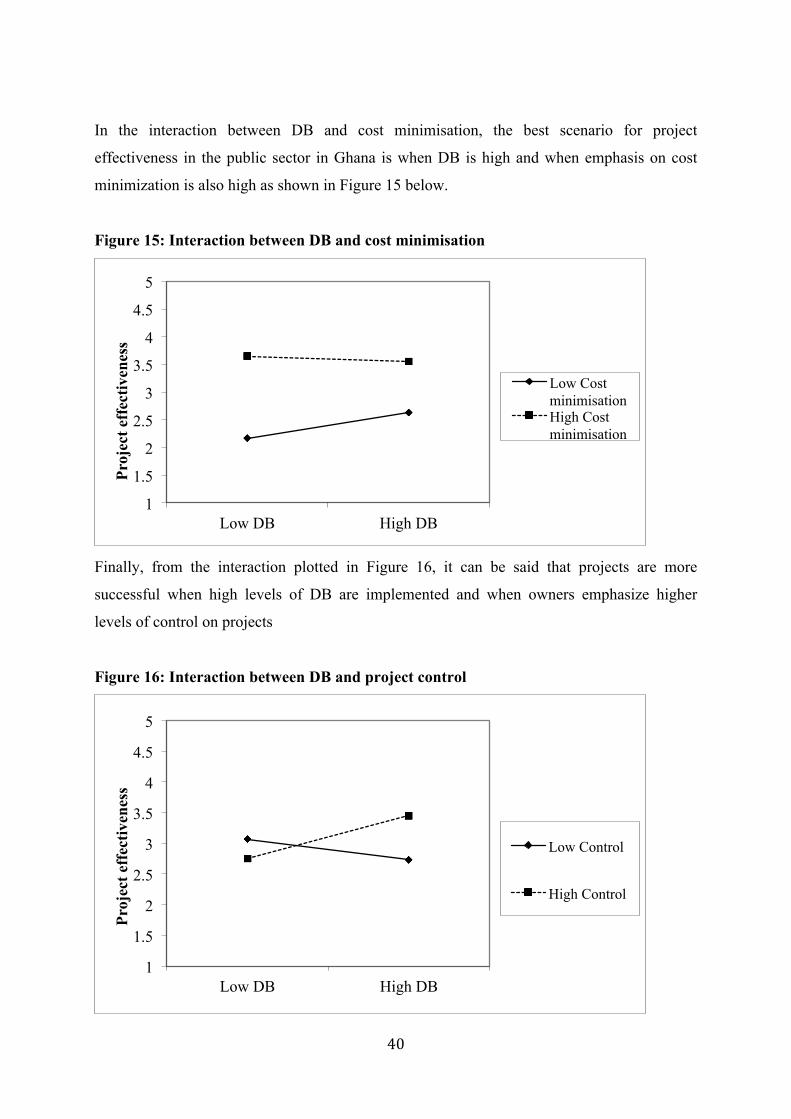
40
In the interaction between DB and cost minimisation, the best scenario for project
effectiveness in the public sector in Ghana is when DB is high and when emphasis on cost
minimization is also high as shown in Figure 15 below.
Figure 15: Interaction between DB and cost minimisation
Finally, from the interaction plotted in Figure 16, it can be said that projects are more
successful when high levels of DB are implemented and when owners emphasize higher
levels of control on projects
Figure 16: Interaction between DB and project control
1
1.5
2
2.5
3
3.5
4
4.5
5
Low DB High DB
Proj
ect e
ffec
tiven
ess
Low Cost minimisation High Cost minimisation
1
1.5
2
2.5
3
3.5
4
4.5
5
Low DB High DB
Proj
ect e
ffec
tiven
ess
Low Control
High Control
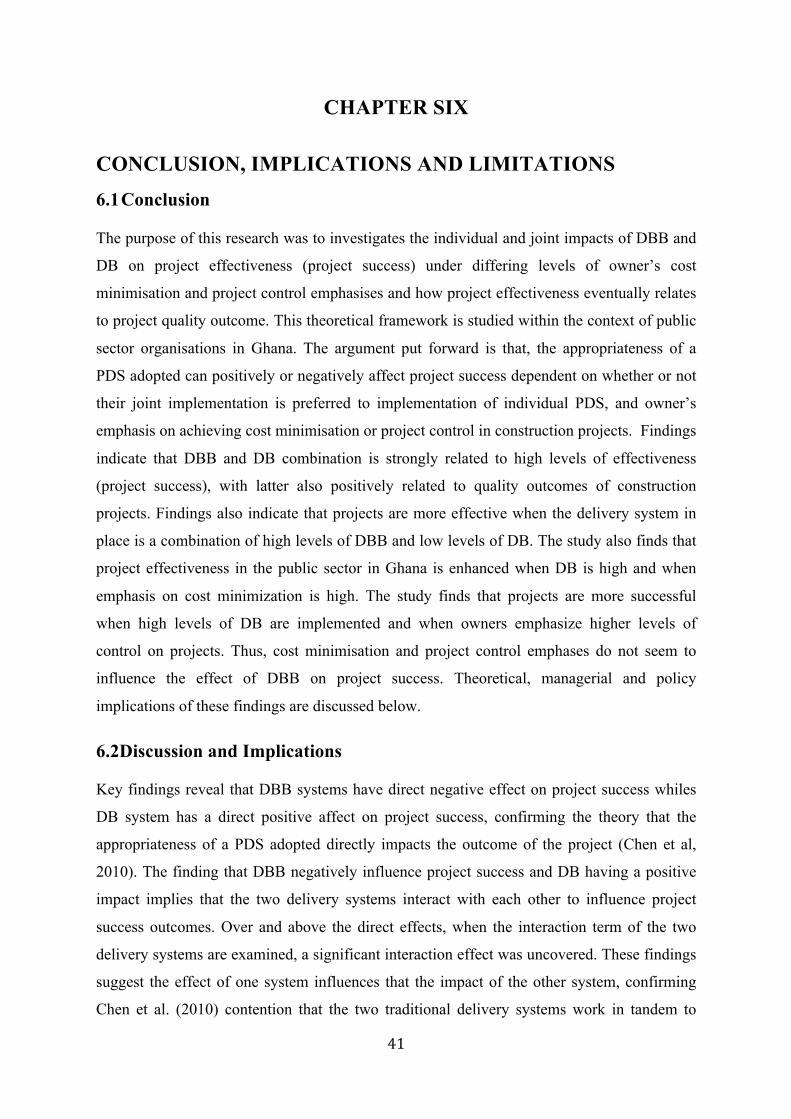
41
CHAPTER SIX
CONCLUSION, IMPLICATIONS AND LIMITATIONS 6.1 Conclusion The purpose of this research was to investigates the individual and joint impacts of DBB and
DB on project effectiveness (project success) under differing levels of owner’s cost
minimisation and project control emphasises and how project effectiveness eventually relates
to project quality outcome. This theoretical framework is studied within the context of public
sector organisations in Ghana. The argument put forward is that, the appropriateness of a
PDS adopted can positively or negatively affect project success dependent on whether or not
their joint implementation is preferred to implementation of individual PDS, and owner’s
emphasis on achieving cost minimisation or project control in construction projects. Findings
indicate that DBB and DB combination is strongly related to high levels of effectiveness
(project success), with latter also positively related to quality outcomes of construction
projects. Findings also indicate that projects are more effective when the delivery system in
place is a combination of high levels of DBB and low levels of DB. The study also finds that
project effectiveness in the public sector in Ghana is enhanced when DB is high and when
emphasis on cost minimization is high. The study finds that projects are more successful
when high levels of DB are implemented and when owners emphasize higher levels of
control on projects. Thus, cost minimisation and project control emphases do not seem to
influence the effect of DBB on project success. Theoretical, managerial and policy
implications of these findings are discussed below.
6.2Discussion and Implications Key findings reveal that DBB systems have direct negative effect on project success whiles
DB system has a direct positive affect on project success, confirming the theory that the
appropriateness of a PDS adopted directly impacts the outcome of the project (Chen et al,
2010). The finding that DBB negatively influence project success and DB having a positive
impact implies that the two delivery systems interact with each other to influence project
success outcomes. Over and above the direct effects, when the interaction term of the two
delivery systems are examined, a significant interaction effect was uncovered. These findings
suggest the effect of one system influences that the impact of the other system, confirming
Chen et al. (2010) contention that the two traditional delivery systems work in tandem to
42
driver project success. Thus, a theoretical implication here is that when the effectiveness of
one system increases, the effectiveness of the other system decreases and the vice versa.
When both systems are adopted simultaneously the outcome is superior relative to when the
systems are adopted in isolation.
A practical implications for project managers is that, adopting high levels of DBB systems
(i.e. contracting design and construction services independent of each other, selecting
contractor solely based on lowest bid criteria according to the norm without
construction/project management functions in place) will have negative effects on project
success. On the contrary high levels of DB systems with emphasis on control relate to
increase in project success. This implies that contracting of a single entity in executing design
and construction phased has positive effect in project delivery, but the project manager must
ensure participation in both design and construction phases to achieve project success.
Focusing on reducing cost in DB systems, can lead to the contractor providing inferior
designs and low quality construction service, which will negatively affect project
effectiveness and overall quality.
Key finding if the study supports the theory that PDSs are directly related to project success
and the final quality outcome of projects (Chen et al, 2010), and further illustrates there could
positive benefits when these systems are implemented together to complement each other
(Miller et al, 2000). Additionally, when factors like cost minimisation and project control are
emphasised by the owner in the implementation process, the effects could be greater. Chen et
al suggests that PDSs provide owners channel to control and manage the execution process
(Chen et al, 2010), and the significant effect of DB on project success when project control is
high proves this as H5 was supported. Drawing from the finding we realise that DB has a
positively significant effects on project success when there is moderated by project control.
The same cannot be said for DBB; its interaction with project success is negative and when
moderated by cost or control does not yield a significant effect: hence the rejection of H1 and
H4. This can be explained the characteristics of the DBB system that appoints separate
entities to execute design and construction phases, which increases the possibility of gaps or
lapses in project execution resulting in undesired project outcomes poor project coordination
and delayed execution of project phases (AIACC, 2007; Tauner consulting service, 2007;
CMAA, 2012). The implication for manager is some delivery systems like the DB offer better
medium for owners to achieve a high level of project success when the owner’s objective is
43
to control aspects of the delivery system. Meredith and Mantel (2010) emphasizes the need
for a project management to ensure efficient allocation of resources and control project
activities (Meredith and Mantel, 2010).
Looking at the effects of combined interaction of DBB and DB systems with project
effectiveness, the best scenario to adopt is when high levels of DBB and low levels of DB are
implemented in a project. From the analysis it was revealed that simultaneously
implementing DBB and DB present competing implications to project managers, therefore
there should be a balance or. This supports Ibbs et al’s (2003) assertion that “no project
delivery system can be deemed appropriate for a specific project” (Ibbs et al, 2003 p.382),
and the adoption of multiple project systems “allows for greater public benefits” (Miller et al,
2000 p.66). Implication here is, both systems possess positive attributes that when managed
can contribute to effective projects, therefore it will be presumptuous of public sector owners
to select one system over the other without considering the benefits of implementing both in
DBB and DB in varying proportions.
Looking at the moderating roles of emphasis on cost minimisation versus project control on
DBB and DB and how this affects project effectiveness, very interesting observation were
made in relation to DB system. Findings from the study reveal that cost minimisation
negatively moderates achieving high levels of project success when high levels of DB are
implemented with high emphasis on cost minimisation. From literature, it’s gathered that DB
systems restrict the involvement of owners (Table 2.1) in the design and construction phases
and in controlling cost, project schedules and technical specification (Tenah, 2001; AIACC,
2007). This supports Hughes, Tippett and Thomas’s claim that the competence and
experience of the design-build team affects quality of DB projects (Hughes, Tippett and
Thomas, 2003). The implication here for the project owner is that, when adopting DB
systems in project delivery there should be checks and balance measures in place to minimise
cost or the adoption on robust price evaluation techniques should be used when allocating
project budgets.
On the other hand the interaction of DBB and cost minimisation was positive but non-
significant, which implies, emphasis on cost in DBB projects has relation to achieving project
success. Implying that, when project owners adopt DBB system to deliver a project focusing
on reducing cost will not necessarily increase or decrease the possibility of achieving a
44
successful project therefore efforts should be made in emphasising other aspects like process
integration (Way, 2005) or system management (DeWit, 1988).
Cost attributes of a project is identified by most studies as a critical factor/ criteria for
determining or measuring success of a project, and this is usually defined by meeting
budgets, avoiding cost overruns and getting value for money (Atkinson, 1999; Dainty, Cheng
and Moore, 2003; Ahsan and Gunawan, 2009). DeWit argues that, cost measure the progress
of a project not success (DeWit, 1988), but based on the afore mentioned, it can be said that
cost is a priority of most project participants, in terms of cost savings for owner and
minimum risk: profit margins and minimal expense for contractors and best value for project
stakeholders in general.
Cost minimisation as a moderating factor for achieving project success as shown earlier, has
a negatively significant effect on project success when emphasized its emphasized. This
could imply two things in relation to project owners: first emphasis on cost minimisation in
DB system can lead to selecting contractors based on lowest construction price at the expense
of high quality service or materials and secondly, setting early budgets which provides little
room for accommodate proposed changes by the contractor to increase project quality or
contingencies that might have cost implications (Ling, 2005).
For policy makers in public sector organisations, the implication here is, other factors should
be considered when selecting DB or DBB systems. Selecting a PDS based solely on financial
objectives can lead to increased possibility of unsuccessful projects especially in DB.
Empirical evidence shows there has been a 5% increase in the adoption of DB systems (Chen
et al, 2010 p.598) as an alternative to DBB systems due to 30% faster delivery time and 13%
cost reduction (Ameyaw, 2009 p.3), even though the impact is negative in this case it might
hold true in other sectors due to the uniqueness and variation of each project.
Having adequate control of a PDS translates into various positive outcomes like meeting
schedule of works, effective communication, effective allocation of resources and achieving
project and project management objectives. As mentioned earlier in chapter 2, making the
distinction between project success and project management success (Haravi and Ilbeigi,
2012) allows for project manager to develop effect strategies in approaching project
execution (Griffin and Page, 1996). Hence, project control as a moderating factor of the
45
effects of DBB and DB on project effectiveness reveals a positive but non-significant
relationship with DBB and a positive and very significant effect of their interaction.
This reveals that when a DBB system is adopted, project success may or may not be achieved
irrespective of emphasis put on project control. Implying that, to achieve successful project
though DBB systems emphasis can be put on other critical factors identified in literature like
process integration (Way, 2005) or effective construction management (CMAA, 2012) aside
control. The significant interaction effect further confirms that projects are more successful
when high levels of DB are implemented and when owners emphasize higher levels of
control on projects.
Effectiveness in the context of this study was identified as the desired outcome of a
successful PDS project, and further to this it was determined how effectiveness related to
project quality. Based on the analysis, there was a significant relationship between the two:
high levels of project effectiveness were related to greater levels of project quality.
When the end product of a project (i.e. the project facility) is realised through either DBB or
DB system, and it’s able to deliver optimum services and function as its expected, it can be
said that project success (effectiveness) is achieved but the operational performance of the
project after completions attests to the level of quality attained. The implication of this to
project/facility mangers is that, project quality is not dependent on whether DBB or DB
system is adopted, but depends on the level of success of the outcome of the project (i.e. in
this context the level of project effectiveness). Bearing in mind project success varies from
project to project Meaning certain factors need to be present to improve project quality,
examples include superior design and equipment quality, competent project participants,
functionality and availability of facility, empirical evidence from research work by Ling
(2005) confirms that adopting DBB or DB does not directly relate the level of project quality
achieved (Ling, 2005).
6.3 Limitations and suggestions for future research
Limitations of this study were in relation to collection and analysis data. First of all, manually
distributing questionnaires was discovered to be the most effective method for the research
environment, due to difference in culture and technological inclination of public sector works
46
in most developing economies like Ghana. Despite the introductory letter attached to the
questionnaire to explain the purpose of the survey, some respondent were apprehensive about
disclosing information willingly.
Another limitation was the possible effect of the sample size of the data set. Perhaps the
statistical power (correlation coefficient) of variables understudy could have influenced,
resulting in high multicollinearity. Subtle interaction between variables that were interpreted
as non-significant below 5% could have been significant in a larger sample size (Kahane,
2008).
Considering the findings of this study, ther is an opportunity for furthe studies to discover
how applicable this theory is to other project delivery systems, and investigate how emphasis
on cost and control affect project success and if possible how other moderating variables like
time interacts with project success. In addition investigating the theory in the context of
private sector organisations and perspective, can determine the generalization of the findings
in the study.
It would be interesting to study a larger sample to find out if there could be a significant
relationship between DBB and project effectiveness when owner’s emphasis is on cost
minimisation or project control , and also discover the resulting effects on project quality.
47
REFERENCES AIACC- American institute of Architects Califonia Council (2007). Intergrated project delivery: A guide.http://info.aia.org/SiteObjects/files/IPD_Guide_2007.pdf Abraham, G.L., (2002). Identification of critical success factors for construction organizations in the architectural/engineering/construction (A/E/C) industry. Thesis (Ph.D) Georgia Institute of Technology. [online] Available at: http://search.proquest.com/docview/276214113/fulltextPDF/1400C804B492E551C7E/1?accountid=14511 [Accessed 14 August 2013] Ahsan, K., Gunawan, I. (2009). Analysis of cost and schedule performance of international development projects, International Journal of Project Management. [online] 28 (1) p. 68-78 Available at: http://www.sciencedirect.com/science/article/pii/S0263786309000337 [Accessed 1 August 2013] Ahadzie, D. K., Proverbs, D. G., & Olomolaiye, P. O. (2008). Critical success criteria for mass house building projects in developing countries. International Journal of Project Management, [online] 26(6) p. 675-687. Available at: http://www.uploadtak.com/images/i9114_1s2.pdf [Accessed 15 June 2013] Aiken, L. S., and West, S. G. (1991). Multiple regression: Testing and interpreting interactions. US: Sage. Alzahrani, J. I., & Emsley, M. W. (2012). The impact of contractors’ attributes on construction project success: A post construction evaluation. International Journal of Project Management. [online] 31(2) p.313-322. Available at: http://www.sciencedirect.com/science/article/pii/S0263786312000804 [Accessed 15 June 2013] Amade, B., (2012). Partnering mechanisms and the procurement of building construction projects delivery. International journal of advanced scientific and technical research. [online] 2(6) p.596-620. Available at: http://rspublication.com/ijst/dec12/57.pdf [Accessed 19 May 2013] Ameyaw, C. 2009. Comparative performance evaluation of the traditional design-bid-build (DBB) and design-build (DB) procurement methods in Ghana. Theses (MSc.). Nkrumah University of Science and Technology Ameyaw, C., Mensah, S. and Arthur, Y. D (2012). Applicability of Bromilow’s time – cost model on building projects in Ghana. 4th West Africa Built Environment Research (WABER) Conference [online] p.881-888. Available at: http://www.academia.edu/2761776/Applicability_of_Bromilows_Time-Cost_Model_on_Building_Projects_in_Ghana [Accessed 6 January 2013]
Anvuur, A., Kumaraswamy, M., & Male, S. (2006). Taking forward public procurement reforms in Ghana. CIB. [online] Available at: http://discovery.ucl.ac.uk/20491/2/CIB1913%5B1%5D.pdf [Accessed 4 June 2013]
48
Arnold, D. J., and J. A. Quelch. 1998. New strategies in emerging markets. Sloan Management Review. [online] 40 (1) p.7-20. Available at: http://sloanreview.mit.edu/article/new-strategies-in-emerging-markets/ [Accessed 15/08/13]
Arts, J. and Faith-Ell, C., (2012). New Governance Approaches For Sustainable Project Delivery, Procardia - Social and Behavioral Sciences. [online] 48, p. 3239-3250. Available at: http://www.sciencedirect.com/science/article/pii/S1877042812030339 [Accessed 5 July 2013]
Asamoa-amono, E. K. (2010). Implementation of Design-build Procurement In Ghana. (BSc.) University College Denmark. [online] Available at: https://www.ucviden.dk/student-portal/files/9463045/peocurement_systems.pdf [Accessed 19 May 2013]
Atkinson, R. (1999). Project managemement: cost, time and quality, two best
guesses and a phenomenon, its time to accept other success criteria. International Journal of Project Management [online] 17(6), p. 337-342. Available at: http://www.sciencedirect.com/science/article/pii/S0263786398000696 [Accessed 15 July 2013] Brown, A. Hinks, J. and Sneddon, J., (2001) "The facilities management role in new building procurement", Facilities. [online] 19 (3/4) p.119 – 130. Available at: http://www.emeraldinsight.com/journals.htm?articleid=844290 [Accessed 17 August 2013] BSIRA, (2009) The soft landing framework for better briefing, design, handover and building performance in-use. [online] Available at: http://www.bsria.co.uk/services/design/soft-landings/free-guidance/ [Accessed 20 July 2013] Chan, A. P.C and Chan, A. P.L., (2004). Key performance indicators for measuring construction project success. Benchmarking. AB.INFORM [online]11(2). p.203-221 Available at: http://www.emeraldinsight.com/journals.htm?issn=1463-5771&volume=11&issue=2&articleid=843109&show=html [Accessed 10 June 2013] Chen, Y.Q., Lu, H., Lu, W. and Zhang, N., (2010). Analysis of project delivery systems in Chinese construction industry with data envelopment analysis (DEA). Engineering, Construction and Architectural Management, [online] 17(6), p. 598-614. Available at: http://search.proquest.com/docview/763663527/13E2DCEE6FA24E2643B/1?accountid=14511 [Accessed 4 June 2013] Chen, Y. Q., Liu, J. Y., Li, B., & Lin, B. (2011). Project delivery system selection of construction projects in China. Expert Systems with Applications, [online] 38(5), p.5456-5462. Available at: http://www.sciencedirect.com/science/article/pii/S0957417410011528# [Accessed 4 June 2013] CMAA-Construction Management Association of America, 2012. Advancing Professional Construction and Program Management Worldwide; Owner’s guide to project delivery methods.
49
[online] Available at: http://cmaanet.org/files/Owners%20Guide%20to%20Project%20Delivery%20Methods%20Final.pdf [26 August 2013] Dainty, A. R., Cheng, M. I., & Moore, D. R. (2003). Redefining performance measures for construction project managers: an empirical evaluation. Construction Management & Economics, [online] 21(2), 209-218. Available at: http://www.tandfonline.com.libproxy.ucl.ac.uk/doi/pdf/10.1080/0144619032000049737 [Accessed 30 July 2013] Davis, K. (2013). Different stakeholder groups and their perceptions of project success. International Journal of Project Management. [online] Available at: http://www.sciencedirect.com/science/article/pii/S0263786313000276 [Accessed 16 June 2013] De Wit, A. (1988). Measurement of project success, International Journal of Project Management. [online] 6(3) p.164-170 Available at; http://www.sciencedirect.com/science/article/pii/0263786388900439# [Accessed 14 August 2013] Diallo, A., & Thuillier, D. (2004). The success dimensions of international development projects: the perceptions of African project coordinators. International Journal of Project Management, [online] 22(1),p.19-31. Available at: http://www.sciencedirect.com/science/article/pii/S0263786303000085 [Accessed 15 June 2013] Doloi, H. (2012). Understanding impacts of time and cost related construction risks on operational performance of PPP projects. International Journal of Strategic Property Management, [online] 16(3), p.316-337. Available at: http://www.tandfonline.com.libproxy.ucl.ac.uk/doi/pdf/10.3846/1648715X.2012.688774 [Accessed 19 May 2013] Eriksson, P. E., & Westerberg, M. (2011). Effects of cooperative procurement procedures on construction project performance: A conceptual framework. International Journal of Project Management. [online] 29(2), p.197-208. Available at: http://www.sciencedirect.com/science/article/pii/S0263786310000050 [Accessed 15 June 2013] Erridge, A., & McIlroy, J. (2002). Public procurement and supply management strategies. Public Policy and Administration, [online] 17(1), p.52-71. Available at: http://slim.ukm.my/tfolio/Assets/whitelotus/Documents/chain%20management.pdf [Accessed 12 January 2013] Frimpong, Y., Oluwoye, J., & Crawford, L. (2003). Causes of delay and cost overruns in construction of groundwater projects in a developing countries; Ghana as a case study. International Journal of project management, [online] 21(5), p.321-326. Available at: http://www.sciencedirect.com/science/article/pii/S0263786302000558# [Accessed 18 July 2013]
50
Griffin, A., & Page, A. L. (1996). PDMA success measurement project: recommended measures for product development success and failure. Journal of product innovation management. [online] 13(6), p.478-496. Available at: http://www.cob.unt.edu/slides/Paswan/MKTG4320/1996.pdf [Accessed 30 July 2013] Griffin Enterprises. Project Management 101– Project management primer: definitions and process. [online] Available at: http://www.griffin-enterprises.com/files/Download/Project%20Management_a%20primer.pdf [Accessed 12 August 2013] Hair, J. F., Black, W. C., Babin, B. J., Anderson, R. E. and Tatham, R. L (2006). Multivariate Data Analysis. NJ: Pearson Prentice Hall. Hale, D. R., Shrestha, P. P., Gibson Jr, G. E., & Migliaccio, G. C. (2009). Empirical comparison of design/build and design/bid/build project delivery methods. Journal of Construction Engineering and Management, [online] 135(7), p.579-587. Available at: http://www.mty.itesm.mx/dia/deptos/cv2/cv99-130/Archivos%20Tareas/ComparandoDCCyDC.pdf [18 August 2013]
Heravi, G., & Ilbeigi, M. (2012). Development of a comprehensive model for construction project success evaluation by contractors. Engineering, Construction and Architectural Management, [online] 19(5), p.526-542. Available at: http://www.emeraldinsight.com/journals.htm?issn=0969-9988&volume=19&issue=5&articleid=17036953&show=html [Accessed 15 June 2013]
Hoskisson, R. E., L. Eden, C. M. Lau, and M. Wright. 2000. Strategy in emerging economies. Academy of Management Journal [online] 43 (3) p.249-267. Available at: http://www.voxprofessori.com/eden/Publications/strategyinemergingeconomies.pdf Hughes, S.W., Tippett, D.D. and Thomas, W.K., (2004). Measuring Project Success in the Construction Industry. Engineering Management Journal, [online] 16(3), p. 31-37. Available at: http://search.proquest.com/docview/208956535/fulltextPDF/13E95BFC3FA7DFB33B6/1?accountid=14511 [Accessed 10 June 2009] Hwang, B. G., & Lim, E. S. J. (2012). Critical success factors for key project players and objectives: case study of Singapore. Journal of Construction Engineering and Management, [online] 139(2), p.204-215. Available at: http://ascelibrary.org/doi/abs/10.1061/%28ASCE%29CO.1943-7862.0000597?journalCode=jcemd4 [Accessed 5 July 2013] Ibbs, C. W., Kwak, Y. H., Ng, T., & Odabasi, A. M. (2003). Project delivery systems and project change: Quantitative analysis. Journal of Construction Engineering and Management, [online] 129(4), p.382-387. Available at: http://home.gwu.edu/~kwak/Project_Delivery_Systems.pdf [Accessed 21 May 2013] Kahane, L. H., (2008). Regression Basics. 2nd Edition. USA: Sage.
51
Kim, D. Y., Han, S. H., Kim, H., & Park, H. (2009). Structuring the prediction model of project performance for international construction projects: A comparative analysis. Expert systems with applications, [online] 36(2), p.1961-1971. Available at: http://www.sciencedirect.com/science/article/pii/S0957417407006264 [Accessed 15 June 2013] Lim, C. S., & Mohamed, M. Z. (1999). Criteria of project success: an exploratory re-examination. International journal of project management, [online] 17(4), p.243-248. Available at: http://www.sciencedirect.com/science/article/pii/S0263786398000404 [Accessed 15 July 2013] Ling, F.Y., (2005). Models for predicting quality of building projects. Engineering, Construction and Architectural Management, [online] 12(1), p.6-20. Available at: http://search.proquest.com/docview/218645972?accountid=14511 [Accessed 15 June 2013] Tabachnick, B. G., & Fidell, L. S. (2012). Using Multivariate Statistics Sixth Edition. USA: Pearson. Oyetunji, A. A., & Anderson, S. D. (2006). Relative effectiveness of project delivery and contract strategies. Journal of Construction Engineering and Management, [online]132(1), p.3-13. Available at: http://ascelibrary.org/doi/abs/10.1061/(ASCE)0733-9364(2006)132:1(3) [Accessed McDaniel and Gates, (2010). Marketing research with SPSS. 8th edition. Asia: Wiely and Sons Meredith, J. R and Mantel, S. J (2010). Project management- A managerial approach. Asia: John Wiely and Son
NAO, (2005). Improving Public services through better construction. London: NAO
NAO- Nation Audit Office, (2011). Initiating successful projects. [online]
Available at: http://www.nao.org.uk/wp-content/uploads/2011/12/NAO_Guide_Initiating_successful_projects.pdf [Accessed 17 July 2013] NAO- Nation Audit Office, (2009a). A review by the private finance practice- PFI construction projects review. [online] Available at: http://www.nao.org.uk/wp-content/uploads/2009/10/2009_performance_pfi_construction.pdf [Accesd 20 July 2013] NAO- Nation Audit Office, (2009b). A paper for the Lords Economic affairs committee. Private Finance Projects. [online] Available at: http://www.nao.org.uk/wp-content/uploads/2009/11/HL_Private_Finance_Projects.pdf [Accessed 20 July 2013] Way, M., (2005). Soft landings: A fresh scope of service that ensures users and clients get the best out of a new building. Journal of Facilities Management, [online] 4(1), p. 23-39. Available at: http://search.proquest.com/docview/218916641/fulltextPDF/13F61EB20DB10F1EF1B/1?accountid=14511 [Accessed 20 July 2013]
52
Miller, J. B., Garvin, M. J., Ibbs, C. W., & Mahoney, S. E. (2000). Toward a new paradigm: Simultaneous use of multiple project delivery methods. Journal of Management in Engineering, [online] 16(3), p.58-67. Available at: http://ascelibrary.org/doi/abs/10.1061/(ASCE)0742-597X(2000)16:3(58) [Accessed 5 July 2013]
Mollaoglu-Korkmaz, S., Swarup, L., & Riley, D. (2011). Delivering Sustainable, High-Performance Buildings: Influence of Project Delivery Methods on Integration and Project Outcomes. Journal of Management in Engineering, [online] 29(1), p.71-78. Available at: http://ascelibrary.org/doi/abs/10.1061/%28ASCE%29ME.1943-5479.0000114?journalCode=jmenea [Accessed 5 July 2013] MOFEP- Ministry of Finanace and Economic Planning Ghana (2010). Public borrowing and project selection guidelines, ForPromotion of Responsible Borrowing and Lending Practices [online] Available at:
http://www.mofep.gov.gh/sites/default/files/docs/dmd/Public_Borrowing_Guidelines.pdf [Accessed 19 July 2013]
Mustapha, Z. (2013).Accelerated Factors of Delays on Project Delivery in Ghana: A Case Study of Cape Coast Metropolis. Journal of Applied Sciences & Environmental Sustainability [online] 1(1) p.54-61. Available at: http://www.jases.org/wp-content/uploads/2013/04/Zakari_Accelerated-Factors-of-Delays-on-Project-Delivery-in-Ghana.pdf [Accessed 18 July 2013]
N.J Smith, (1995). The management of engineering projects. USA: Blackwell
science
N.J. Smith (1999), Managing risk in construction projects. Oxford and Northampton: Blackwell Science Ltd.
Ren, Z., Kwaw, P., & Yang, F. (2012). Ghana's public procurement reform and the continuous use of the traditional procurement system: The way forward. Built Environment Project and Asset Management, [online] 2(1), p.56-69. Available at: http://ascelibrary.org/doi/abs/10.1061/(ASCE)07339364(2006)132:3(230) [Accessed 20 August 2013] Ogunlana, S. O. (2009). Construction professionals' perception of critical success factors for large-scale construction projects. Construction Innovation: Information, Process, Management, [online] 9(2), p.149-167. Available at: http://search.proquest.com/docview/218321299/fulltextPDF/14036C6DF3036695F1B/1?accountid=14511 [Accessed 15 June 2013]
Shenhar, A. J., Dvir, D., Levy, O., & Maltz, A. C. (2001). Project success: a multidimensional strategic concept. Long range planning, [online] 34(6), p.699-725. Available at: http://www.sciencedirect.com/science/article/pii/S0024630101000978 [Accessed 15 June 2010]
53
Smith, J. and Jaggar, D, (2007). Construction cost planning for the design team. Second edition. Butterworth-Heinemann USA: Elsevier Ltd.
Tenah, K.A., (2001). Project delivery systems for construction: An overview. Cost Engineering, [online] 43(1), p. 30-36. Available at: http://search.proquest.com/docview/220437282/fulltextPDF/13E2DCEE6FA24E2643B/3?accountid=14511 [Accessed 21 May 2013]
Trauner consulting services (2007). Construction project delivery and procurement practices : considerations, alternatives, advantages and disadvantages. [online] Available at: http://www.fefpa.org/pdf/summer2007/Pros-Cons-handout.pdf [Accessed 1 June 2013]
Toor, S. U. R., & Ogunlana, S. O. (2008). Critical COMs of success in large-scale construction projects: evidence from Thailand construction industry. International Journal of Project Management, [online] 26(4), p.420-430. Available at: http://www.sciencedirect.com/science/article/pii/S0263786307001275 [Accessed 15 June 2013]
Toor, S. U. R., & Ogunlana, S. O. (2010). Beyond the ‘iron triangle’: Stakeholder perception of key performance indicators (KPIs) for large-scale public sector development projects. International Journal of Project Management, [online] 28(3) p.228-236. Available at: http://www.sciencedirect.com/science/article/pii/S0263786309000623 [Accessed 7/07/2013]
Way, M. (2000). Soft landings [online] Available at: http://emps.exeter.ac.uk/media/universityofexeter/emps/research/cee/lchsmodule1notes/Softlandings.pdf [Accessed 16 July 2013]
Ke, Y., Ling, F., Wang, S., Zou, P., Kumaraswamy, M., and Ning, Y., (2013) Relationships Among Contracting Parties and Their Effects On Outcomes of Public Construction Projects in China. AEI. [online] p. 74-83. Available at: http://ascelibrary.org/doi/abs/10.1061/9780784412909.008 Wang, X. and Huang, J., (2005). The relationships between key stakeholders’ project performance and project success: Perceptions of Chinese construction supervising engineers, International Journal of Project Management. [online] 24 (3) p. 253-260. Available at: http://www.sciencedirect.com/science/article/pii/S0263786305001225 [Accessed 15/05/13] Xia, B. (2010). The Selection of Design-build Operational Variations in the People's Republic of China Using Delphi Method and Fuzzy Set Theory. Thesis (Ph.D.) Hong Kong Polytechnic University. [online] Available at: http://search.proquest.com/docview/860792671/fulltextPDF/1400CA5B2514D523543/6?accountid=14511 [Accesed 22 August 2013] Xia, B. and Albert P.C. Chan, (2010). Key competences of design-build clients in China. Journal of Facilities Management, [online] 8(2), p.114-129. Available at: http://search.proquest.com/docview/807393001/fulltextPDF/140303243D128C43DFF/1?accountid=14511 [Accessed 17 August 2013] Yu, A. G., Flett, P. D., & Bowers, J. A. (2005). Developing a value-centred proposal for assessing project success. International Journal of Project Management, [online] 23(6), p.428-436. Available at:

54
http://www.sciencedirect.com/science/article/pii/S0263786305000219 [Accessed 15 June 2013].

55
APPENICIES
Appendix I: Cover letter for survey questionnaire
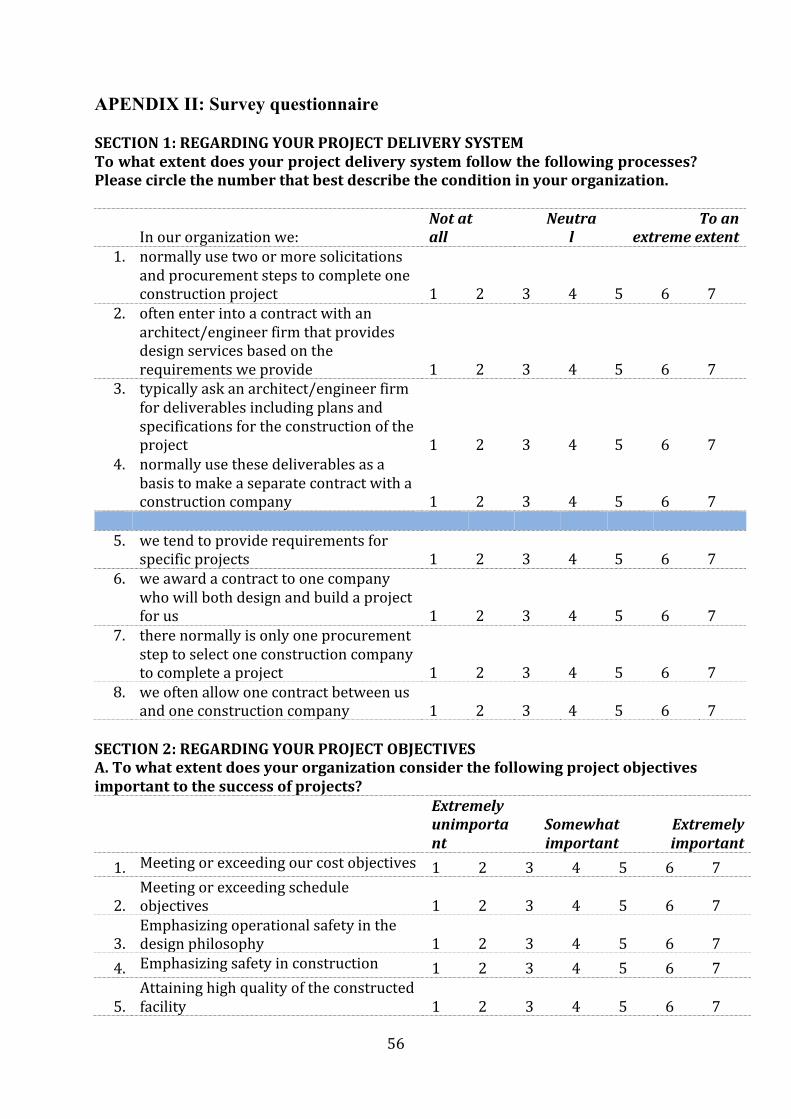
56
APENDIX II: Survey questionnaire SECTION 1: REGARDING YOUR PROJECT DELIVERY SYSTEM To what extent does your project delivery system follow the following processes? Please circle the number that best describe the condition in your organization.
In our organization we:
Not at all
Neutral
To an extreme extent
1. normally use two or more solicitations and procurement steps to complete one construction project 1 2 3 4 5 6 7
2. often enter into a contract with an architect/engineer firm that provides design services based on the requirements we provide 1 2 3 4 5 6 7
3. typically ask an architect/engineer firm for deliverables including plans and specifications for the construction of the project 1 2 3 4 5 6 7
4. normally use these deliverables as a basis to make a separate contract with a construction company 1 2 3 4 5 6 7
5. we tend to provide requirements for
specific projects 1 2 3 4 5 6 7 6. we award a contract to one company
who will both design and build a project for us 1 2 3 4 5 6 7
7. there normally is only one procurement step to select one construction company to complete a project 1 2 3 4 5 6 7
8. we often allow one contract between us and one construction company 1 2 3 4 5 6 7
SECTION 2: REGARDING YOUR PROJECT OBJECTIVES A. To what extent does your organization consider the following project objectives important to the success of projects?
Extremely unimportant
Somewhat important
Extremely important
1. Meeting or exceeding our cost objectives 1 2 3 4 5 6 7
2. Meeting or exceeding schedule objectives 1 2 3 4 5 6 7
3. Emphasizing operational safety in the design philosophy 1 2 3 4 5 6 7
4. Emphasizing safety in construction 1 2 3 4 5 6 7
5. Attaining high quality of the constructed facility 1 2 3 4 5 6 7
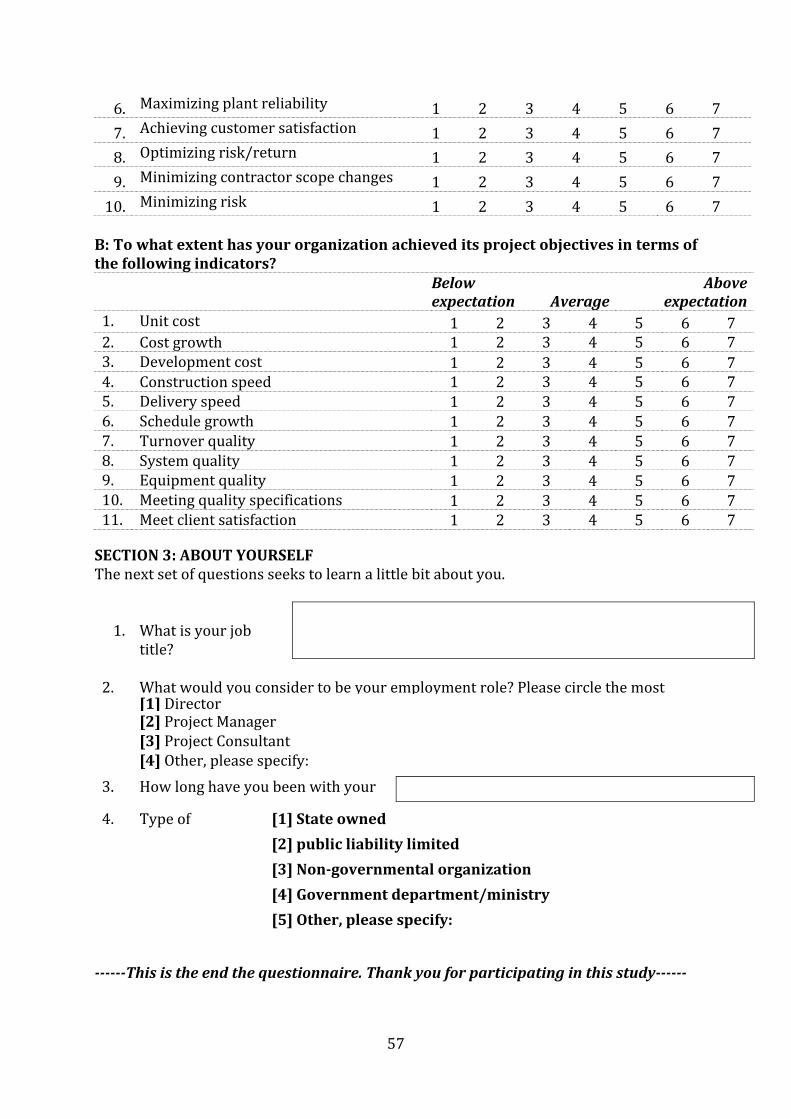
57
6. Maximizing plant reliability 1 2 3 4 5 6 7 7. Achieving customer satisfaction 1 2 3 4 5 6 7 8. Optimizing risk/return 1 2 3 4 5 6 7 9. Minimizing contractor scope changes 1 2 3 4 5 6 7 10. Minimizing risk 1 2 3 4 5 6 7 B: To what extent has your organization achieved its project objectives in terms of the following indicators? Below
expectation
Average Above
expectation 1. Unit cost 1 2 3 4 5 6 7 2. Cost growth 1 2 3 4 5 6 7 3. Development cost 1 2 3 4 5 6 7 4. Construction speed 1 2 3 4 5 6 7 5. Delivery speed 1 2 3 4 5 6 7 6. Schedule growth 1 2 3 4 5 6 7 7. Turnover quality 1 2 3 4 5 6 7 8. System quality 1 2 3 4 5 6 7 9. Equipment quality 1 2 3 4 5 6 7 10. Meeting quality specifications 1 2 3 4 5 6 7 11. Meet client satisfaction 1 2 3 4 5 6 7 SECTION 3: ABOUT YOURSELF The next set of questions seeks to learn a little bit about you. 1.
What is your job title?
2. What would you consider to be your employment role? Please circle the most
appropriate number.
[1] Director [2] Project Manager [3] Project Consultant [4] Other, please specify: 3. How long have you been with your
company?
4. Type of
organization
[1] State owned [2] public liability limited [3] Non-‐governmental organization [4] Government department/ministry [5] Other, please specify:
-‐-‐-‐-‐-‐-‐This is the end the questionnaire. Thank you for participating in this study-‐-‐-‐-‐-‐-‐
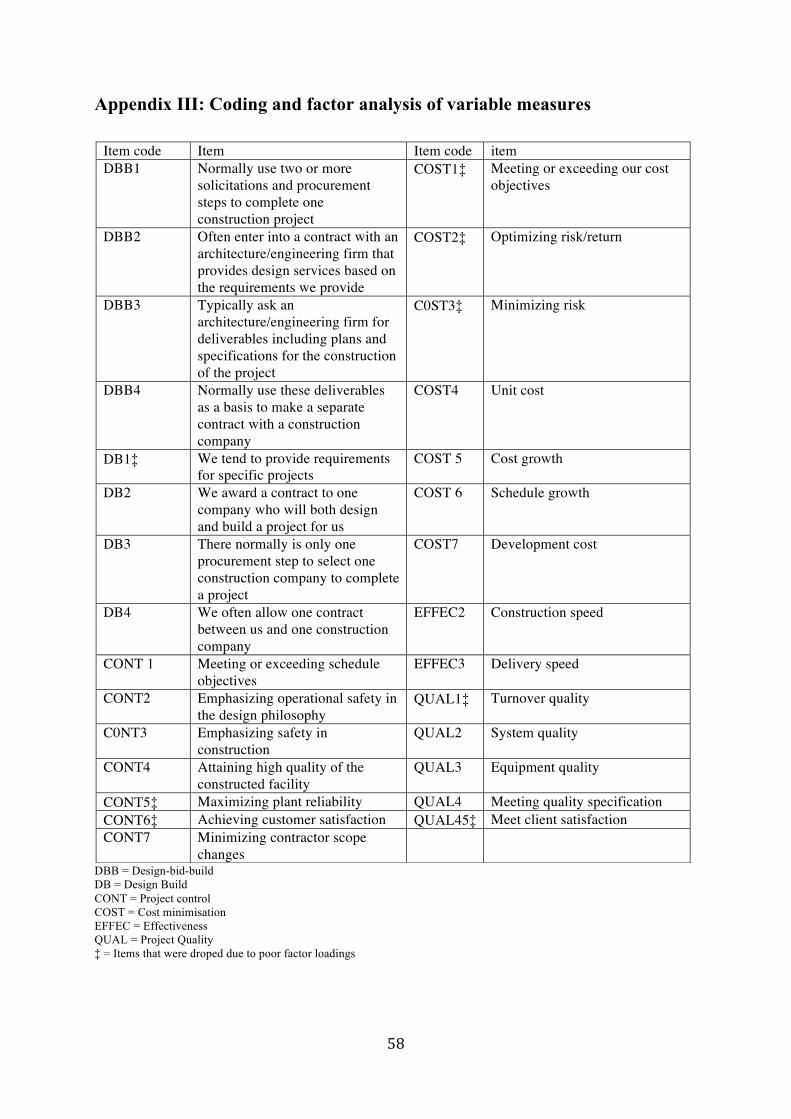
58
Appendix III: Coding and factor analysis of variable measures
DBB = Design-bid-build DB = Design Build CONT = Project control COST = Cost minimisation EFFEC = Effectiveness QUAL = Project Quality ‡ = Items that were droped due to poor factor loadings
Item code Item Item code item DBB1 Normally use two or more
solicitations and procurement steps to complete one construction project
COST1‡ Meeting or exceeding our cost objectives
DBB2 Often enter into a contract with an architecture/engineering firm that provides design services based on the requirements we provide
COST2‡ Optimizing risk/return
DBB3 Typically ask an architecture/engineering firm for deliverables including plans and specifications for the construction of the project
C0ST3‡ Minimizing risk
DBB4 Normally use these deliverables as a basis to make a separate contract with a construction company
COST4 Unit cost
DB1‡ We tend to provide requirements for specific projects
COST 5 Cost growth
DB2 We award a contract to one company who will both design and build a project for us
COST 6 Schedule growth
DB3 There normally is only one procurement step to select one construction company to complete a project
COST7 Development cost
DB4 We often allow one contract between us and one construction company
EFFEC2 Construction speed
CONT 1 Meeting or exceeding schedule objectives
EFFEC3 Delivery speed
CONT2 Emphasizing operational safety in the design philosophy
QUAL1‡ Turnover quality
C0NT3 Emphasizing safety in construction
QUAL2 System quality
CONT4 Attaining high quality of the constructed facility
QUAL3 Equipment quality
CONT5‡ Maximizing plant reliability QUAL4 Meeting quality specification CONT6‡ Achieving customer satisfaction QUAL45‡ Meet client satisfaction CONT7 Minimizing contractor scope
changes