Embed Size (px)
Citation preview

1
Supplementary information to:
"Conversion of a non-‐heme iron dependent sulfoxide synthase into a thiol dioxygenase by
a single point mutation."
Materials. All standard reagents were purchased from Aldrich/Sigma if not otherwise stated.
Synthetic oligonucleotides were purchased from Microsynth, Switzerland.
Recombinant enzyme production. EgtBwt and EgtBY377F were produced and purified following
published protocols.1 The gene for EgtBY377F production was constructed by primer extension
PCR using the following primers: Y377Fs: 5‘-‐TAT AGC CGA TGA TTT TTC AGC GCT ACA -‐3‘ Y377Fa: 5’-‐TAT ATG TAG CGC TGA AAA ATC ATC GGC -‐3’ EgtBs: 5’-‐TAT ACA TAT GGG TGT CGC CGT GC -‐3’ EgtBa: 5’-‐ATA TCT CCG AGC TAA CAA CCA CCC ACC GG -‐3’
The resulting fragment was cloned into a pET28b vector. Purified EgtBY377F contained 0.64 %
equivalents of iron as inferred by a ferrozine-‐based colorimetric assay.1 The extinction coefficient
was calculated based on the primary sequence (ε280,EgtBY377F: 109890 M-‐1 cm-‐1).2 The protein mass
was determined by HRMS-‐ESI (m/zEgtBY377F: calc.: 51326.67, meas.: 51358.226; Delta: 31.6 Da). A
deviation of 32 Da between the calculated and the measured mass has also been observed for the
wild type enzyme and is consistent with dioxygenation of the C-‐terminal cysteine residue.1 At the
present time we have no direct indication as to whether this modification is important for in vitro
activity or the in vivo function of EgtB. Dioxygenation of exposed or activated cysteine residues
has been reported for several protein before.3 It is worth adding that EgtB from Mycobacterium
smegmatis is characterized by similar in vitro catalytic parameters is EgtB from
M. thermoresistibile, but lacks this 32 Da modification.
Michaelis-‐Menten analysis/Enzyme assay. Enzyme activities were assayed in 100 mM sodium
phosphate buffer containing 100 mM NaCl, 2 mM TCEP, 2 mM ascorbate, 4 µM FeSO4, TMH and
enzyme (Figures 2a – h),. Reactions were started by addition of γGC and incubated at 26°C.
Aliquots of the reactions were quenched by addition of 20 μL 1 M phosphoric acid and analyzed
by cation exchange HPLC using 20 mM phosphoric acid at pH 2 as a mobile phase.4 Compounds were eluted in a NaCl gradient. All HPLC chromatograms were recorded at 265 nm. The data
were fitted to the function v = Vmax[s]/(KM + [s]). Michaelis-‐Menten plots are shown below. kcat
and kcat/KM were determined in the presence of the second substrate at a concentration at least
3-‐fold higher than KM of the second substrate. The data displayed in Figures 2a – h corresponds
to averages from three independent enzyme reactions.
γGC dioxygenase activity (Figures 2g – h), was quantified by monitoring consumption of γGC.
Given that sulfoxide synthase activity in EgtBY377F is 100 – 1000 fold less efficient than γGC
dioxygenation we ignored the fact that a tiny fraction of γGC is converted to the sulfoxide
Electronic Supplementary Material (ESI) for ChemComm.This journal is © The Royal Society of Chemistry 2015

2
product. For HPLC based quantification of γGC the 40 μL reaction aliquots were quenched by
addition of 40 μL acetonitrile and 10 μL of 20 mM 4-‐bromomethyl-‐7-‐methoxycoumarin (BMC) in
DMSO. After incubation for 30 min the mixture was diluted with one volume equivalent of
0.1% TFA solution. Coumarin–adducts (Figure S1) were quantified by RP-‐HPLC by absorbance at
330 nm.
Figure S1. Formation of methyl-‐7-‐methoxycoumarin adduct of γGC
Figure S2a – h: Michaelis-‐Menten plots
Figure S2a: phosphate buffer, pH 8.0 EgtB, [γGC] =
1200 µM
Figure S2b: phosphate buffer, pH 6.0 EgtB, [γGC] =
1200 µM
Figure S2c: phosphate buffer, pH 8.0 EgtBY377F,
[γGC] = 1200 µM
Figure S2d: phosphate buffer, pH 6.0 EgtBY377F,
[γGC] = 1200 µM

3
Figure S2e: phosphate buffer, pH 8.0 EgtB, [TMH] =
400 µM
Figure S2f: phosphate buffer, pH 6.0 EgtB, [TMH] =
400 µM
Figure S2g: phosphate buffer, pH 8.0 EgtBY377F,
[TMH] = 400 µM
Figure S2h: phosphate buffer, pH 6.0 EgtBY377F,
[TMH] = 400 µM
Figure S3. Left: Determination of the substrate KIE for EgtBwt and EgtBY377F. C2-‐deuterated N-‐α-‐
trimethyl histidine was prepared as follows: a 5 mM solution of N-‐α-‐trimethyl histidine in D2O
was acidified to pD 5.0 with 20 % DCl. This solution was incubated at 90 °C for 72 h in a sealed
glass vial. Specific and complete deuteration of the imidazol C2 position was confirmed by ESI-‐MS
(m/z calc.: 199.13; meas. :199.1) and 1H NMR (400 MHz, D2O) δ ppm 7.26 (s, 1H), 3.88
4
(dd, J = 12.0, 3.9 Hz, 1H), 3.44 – 3.24 (m, 2H), 3.23 (s, 9H). Catalytic activity assayed in 250 µL
reactions containing 100 mM HEPES buffer pH 8.0, 100 mM NaCl, 2 mM TCEP, 2 mM ascorbate,
4 µM FeSO4, 400 µM TMH or C2-‐deuterted TMH, 1.2 mM γGC and 1.2 µM EgtB or EgtBY377F. The
reactions were incubated at 26°C; product formation was monitored by cation exchange HPLC
using 20 mM phosphoric acid at pH 2 as a mobile phase.4 Compounds were eluted in a NaCl
gradient. All HPLC chromatograms were recorded at 265 nm.
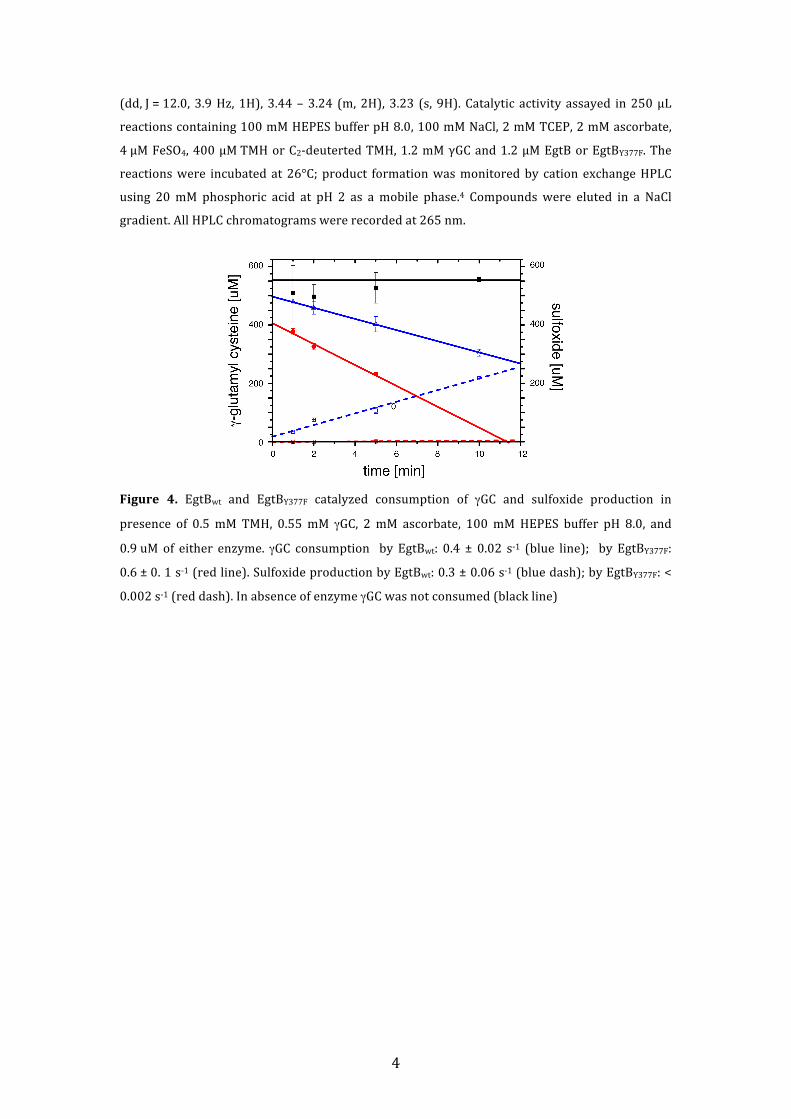
Figure 4. EgtBwt and EgtBY377F catalyzed consumption of γGC and sulfoxide production in
presence of 0.5 mM TMH, 0.55 mM γGC, 2 mM ascorbate, 100 mM HEPES buffer pH 8.0, and
0.9 uM of either enzyme. γGC consumption by EgtBwt: 0.4 ± 0.02 s-‐1 (blue line); by EgtBY377F:
0.6 ± 0. 1 s-‐1 (red line). Sulfoxide production by EgtBwt: 0.3 ± 0.06 s-‐1 (blue dash); by EgtBY377F: <
0.002 s-‐1 (red dash). In absence of enzyme γGC was not consumed (black line)
5
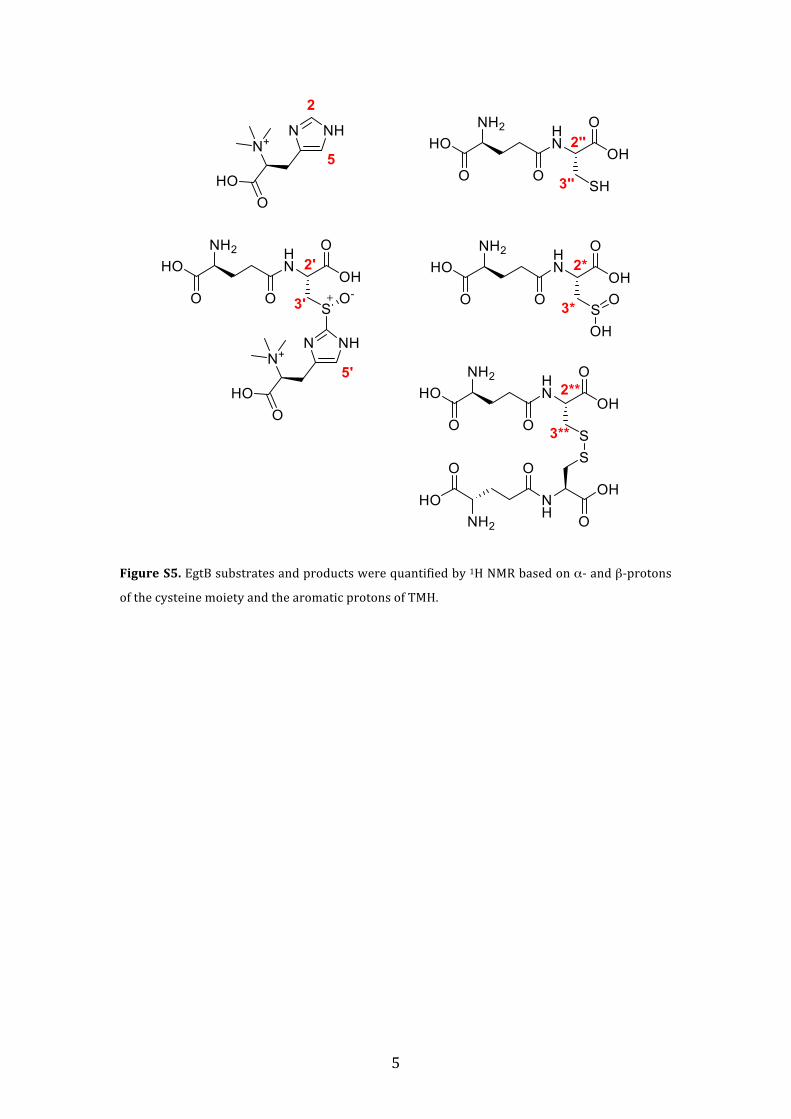
Figure S5. EgtB substrates and products were quantified by 1H NMR based on α-‐ and β-‐protons
of the cysteine moiety and the aromatic protons of TMH.
6
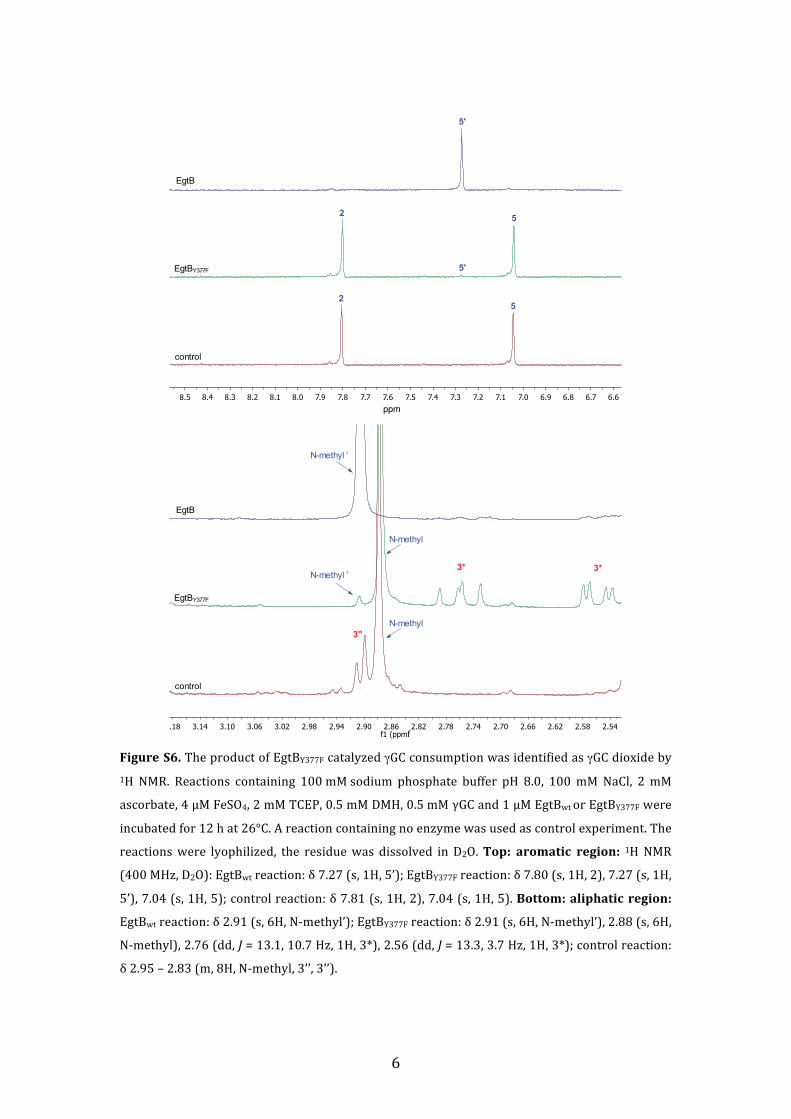
Figure S6. The product of EgtBY377F catalyzed γGC consumption was identified as γGC dioxide by 1H NMR. Reactions containing 100 mM sodium phosphate buffer pH 8.0, 100 mM NaCl, 2 mM
ascorbate, 4 µM FeSO4, 2 mM TCEP, 0.5 mM DMH, 0.5 mM γGC and 1 µM EgtBwt or EgtBY377F were
incubated for 12 h at 26°C. A reaction containing no enzyme was used as control experiment. The
reactions were lyophilized, the residue was dissolved in D2O. Top: aromatic region: 1H NMR
(400 MHz, D2O): EgtBwt reaction: δ 7.27 (s, 1H, 5’); EgtBY377F reaction: δ 7.80 (s, 1H, 2), 7.27 (s, 1H,
5’), 7.04 (s, 1H, 5); control reaction: δ 7.81 (s, 1H, 2), 7.04 (s, 1H, 5). Bottom: aliphatic region:
EgtBwt reaction: δ 2.91 (s, 6H, N-‐methyl’); EgtBY377F reaction: δ 2.91 (s, 6H, N-‐methyl’), 2.88 (s, 6H,
N-‐methyl), 2.76 (dd, J = 13.1, 10.7 Hz, 1H, 3*), 2.56 (dd, J = 13.3, 3.7 Hz, 1H, 3*); control reaction:
δ 2.95 – 2.83 (m, 8H, N-‐methyl, 3’’, 3’’).
ppm
f
‘
‘

7
Figure S7. γGC consumption in absence of TMH. Reactions containing 100 mM HEPES buffer pH
8.0, 100 mM NaCl, 4 µM FeSO4, 2 mM ascorbate, 0.35 mM γGC and 21 µM of either EgtBwt or
EgtBY377F were incubated at 26°C. Residual γGC was quantified a coumarin adduct by RP-‐HPLC.
Figure S8. The product of EgtBwt and EgtBY377F catalyzed TMH-‐independent γGC consumption
was identified as γGC dioxide by 1H NMR. Reactions containing 100 mM sodium phosphate buffer
pH 8.0, 100 mM NaCl, 20 µM FeSO4, 2 mM ascorbate, 2 mM TCEP, 0.5 mM γGC and 5 µM EgtBwt or
EgtBY377F were incubated for 12 h at 26°C. 1H NMR (400 MHz, D2O): EgtBwt reaction: δ 2.96 – 2.83
(m, 2H, 3’’), 2.76 (dd, J = 13.3, 10.9 Hz, 1H, 3*), 2.56 (dd, J = 13.3, 3.7 Hz, 1H, 3*); EgtBY377F
reaction: δ 2.96 – 2.83 (m, 2H, 3’’), 2.76 (dd, J = 13.2, 10.7 Hz, 1H, 3*), 2.56 (dd, J = 13.3, 3.7 Hz,
1H, 3*); control reaction: δ 2.96 – 2.83 (m, 2H, 3’’).
ppm

8
Figure S9. Rate of autoxidation by EgtBwt. In absence of ascorbate EgtBwt loses activity within the
first 1 -‐ 2 min of catalysis owing to reversible autoxidation of EgtB to the inactive iron (III) form.
In presence of ascorbate this inactive species does not accumulate because reduction to the
active iron (II) form is rapid. Reduction by γGC is much slower which limits ascorbate-‐
independent turnover in the steady state (starting after 4 min) to 2 min-‐1. Linear regression of
this slow phase to t = 0 gives an estimate of how many turnovers were completed before EgtB
oxidizes the first time (left). These estimates from experiments with different enzyme
concentrations plotted against enzyme concentrations reveal that each EgtB molecule catalyzes
on average 100 turnovers before autoxiation occurs. In other words, kcat is 100 fold faster than
kautoxidation i.e. kautoxidation = kcat/100 (right). Catalytic rates were determined in reactions containing
100 mM HEPES pH 8.0, 100 mM NaCl, 4 eq. of FeSO4, 2 mM TCEP, 0.4 mM TMH, 1.2 mM γGC, and
0.25-‐3 µM EgtB.
Figure S10. Rate of autoxidation by EgtBY377F. In absence of ascorbate EgtBY377F also loses activity
within the first 1 -‐ 2 min due to reversible autoxidation. Determination of kautoxidation = kcat/9 was
achieved using the same methodology as described above. Catalytic rates were determined in
reactions containing 100 mM sodium phosphate buffer pH 8.0, 100 mM NaCl, 4 eq. of FeSO4,
2 mM TCEP, 0.4 mM TMH, 0.55 mM γGC, 2.5-‐10 µM EgtBY377F.
9
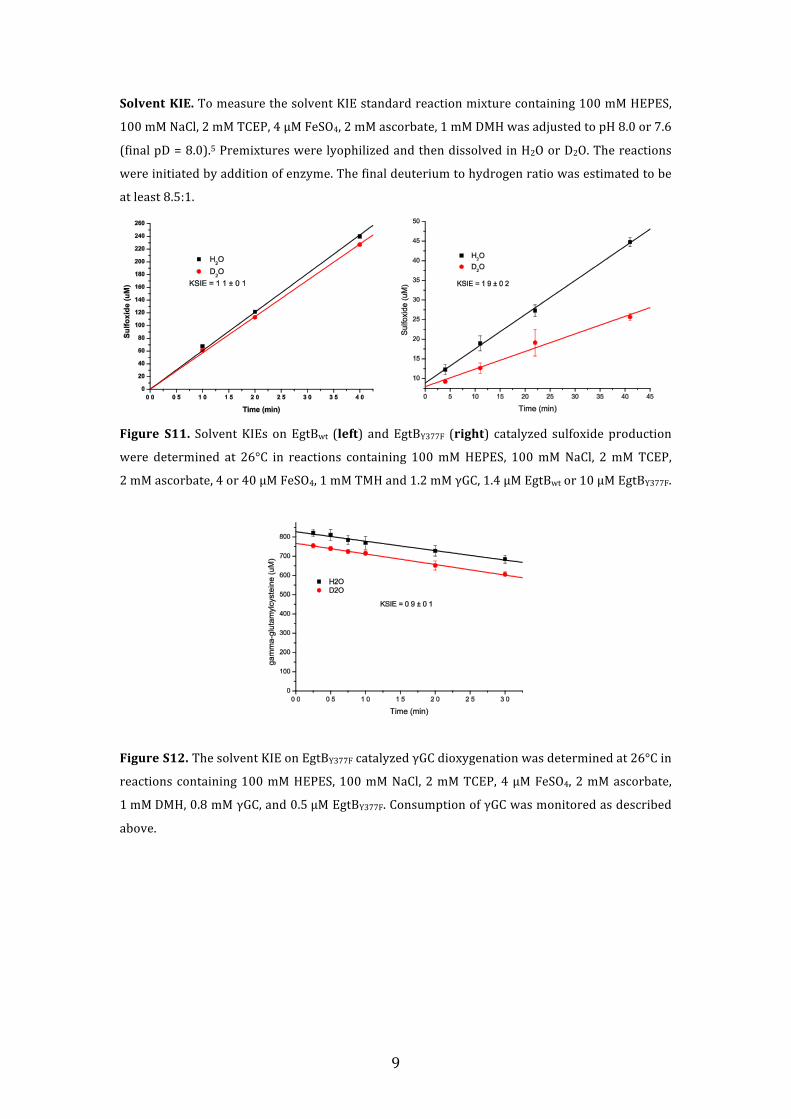
Solvent KIE. To measure the solvent KIE standard reaction mixture containing 100 mM HEPES,
100 mM NaCl, 2 mM TCEP, 4 µM FeSO4, 2 mM ascorbate, 1 mM DMH was adjusted to pH 8.0 or 7.6
(final pD = 8.0).5 Premixtures were lyophilized and then dissolved in H2O or D2O. The reactions
were initiated by addition of enzyme. The final deuterium to hydrogen ratio was estimated to be
at least 8.5:1.
Figure S11. Solvent KIEs on EgtBwt (left) and EgtBY377F (right) catalyzed sulfoxide production
were determined at 26°C in reactions containing 100 mM HEPES, 100 mM NaCl, 2 mM TCEP,
2 mM ascorbate, 4 or 40 µM FeSO4, 1 mM TMH and 1.2 mM γGC, 1.4 µM EgtBwt or 10 µM EgtBY377F.
Figure S12. The solvent KIE on EgtBY377F catalyzed γGC dioxygenation was determined at 26°C in
reactions containing 100 mM HEPES, 100 mM NaCl, 2 mM TCEP, 4 µM FeSO4, 2 mM ascorbate,
1 mM DMH, 0.8 mM γGC, and 0.5 µM EgtBY377F. Consumption of γGC was monitored as described
above.

10
Figure S13. To determine the dependence of EgtBY377F catalyzed sulfoxide production on buffer
pH we determined the ratio between substrate TMH and product sulfoxide in completed
reactions by 1H NMR. The same analysis was repeated in D2O, to probe the pH dependence of the
solvent KIE. The reactions (in H2O or D2O) contained 100 mM sodium phosphate buffer at pH (or
pD) 8.0, 7.0 or 6.0, 100 mM NaCl, 2 mM ascorbate, 4 µM FeSO4, 2 mM TCEP, 0.5 mM TMH,
0.75 mM γGC and 1 µM EgtBY377F. The reactions were incubated at 26°C. After 12 h the solutions
were lyophilized and dissolved D2O for NMR analysis (top). The aromatic signals of TMH (C2-‐H
and C5-‐H) and of sulfoxide (C5'-‐H) were used to compute the percentage of consumed TMH, i.e.
produced sulfoxide. These values (obtained at pH 6.0, 6.5, 7.0, 7.5 and 8.0) were plotted against
proton concentration and fitted with a hyperbolic function of the form:
[sulfoxide] = [sulfoxide]max[H+]/(KM,proton + [H+])
This analysis revealed that a) the solvent KIE remains > 1.5 in the examined pH range; b)
increased proton concentration stimulates sulfoxide production by EgtBY377F; c) pH dependent
acceleration saturates with a pH below 7 (bottom).
ppm
11
References
1. K. V. Goncharenko, A. Vit, W. Blankenfeldt and F. P. Seebeck, Angew. Chem. Int. Ed. Engl., 2015, 54, 2821 -‐ 2824.
2. C. N. Pace, F. Vajdos, L. Fee, G. Grimsley and T. Gray, Prot. Sci., 1995, 4, 2411-‐2423. 3. C. E. Paulsen and K. S. Carroll, Chem. Rev., 2013, 113, 4633 -‐ 4679. 4. A. Braunshausen and F. P. Seebeck, J. Am. Chem. Soc., 2011, 133, 1757-‐1759. 5. A. Krezel and W. Bal, J. Inorg. Biochem., 2004, 98, 161 -‐ 166.


![Catalase: A tightly NADPH4344 Biochemistry: Kirkmanand Gaetani tories movedessentially as asingle bandonelectrophoresis in NaDodSO4/7.5% acrylamide gels. LabeledNADandNADP.Nicotinamide[U-_4C]adenine](https://img.pdfslide.us/doc/110x75/6109e073af7b8153ce4d4353/catalase-a-tightly-nadph-4344-biochemistry-kirkmanand-gaetani-tories-movedessentially.jpg)