Embed Size (px)
Citation preview
Hammerfest,18-19 September 2015
GoliatFieldTrip
Agenda
introduction
our approach to development
focus on Zohr
Goliat field
2
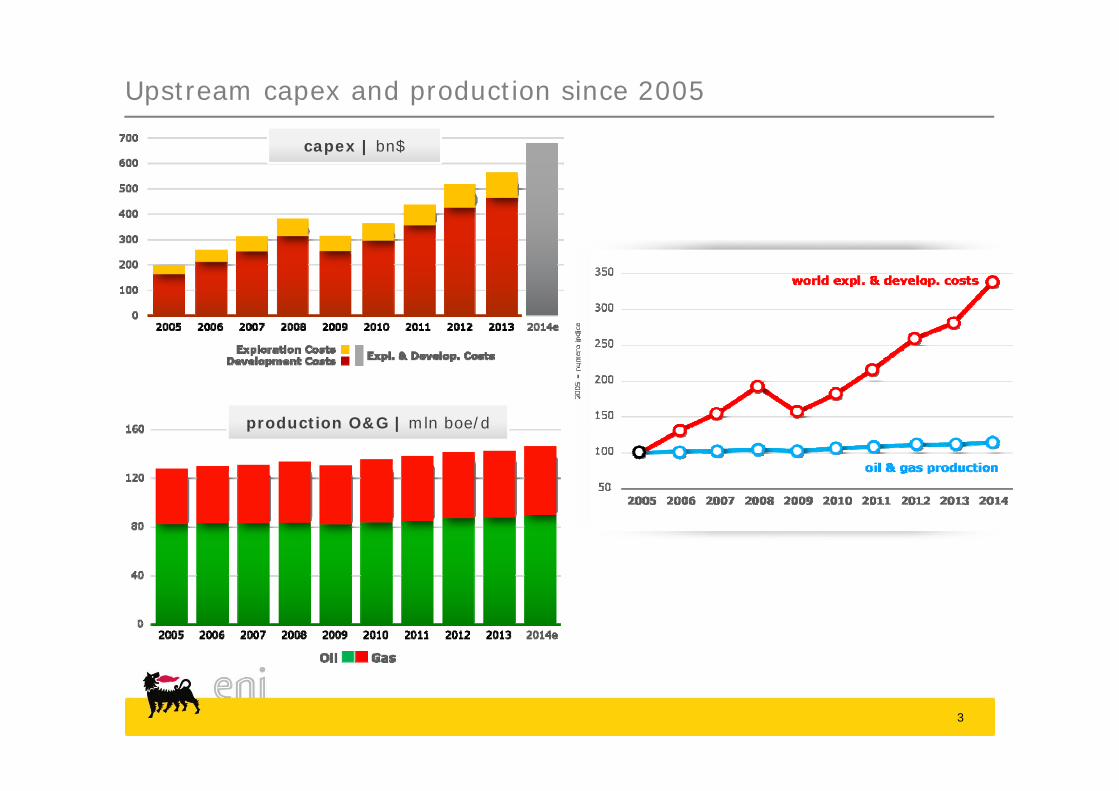
Upstream capex and production since 2005
capex | bn$
production O&G | mln boe/d
3
1999
2000
2001
20022003
2004
2005 2006
2007
2008
2009
2010
2011
2012
2013
2014
16,5
17,0
17,5
18,0
18,5
19,0
19,5
20,0
20 40 60 80 100 120 140 160 180
Pro
du
ctio
n O
il&G
as
Upstream CAPEX
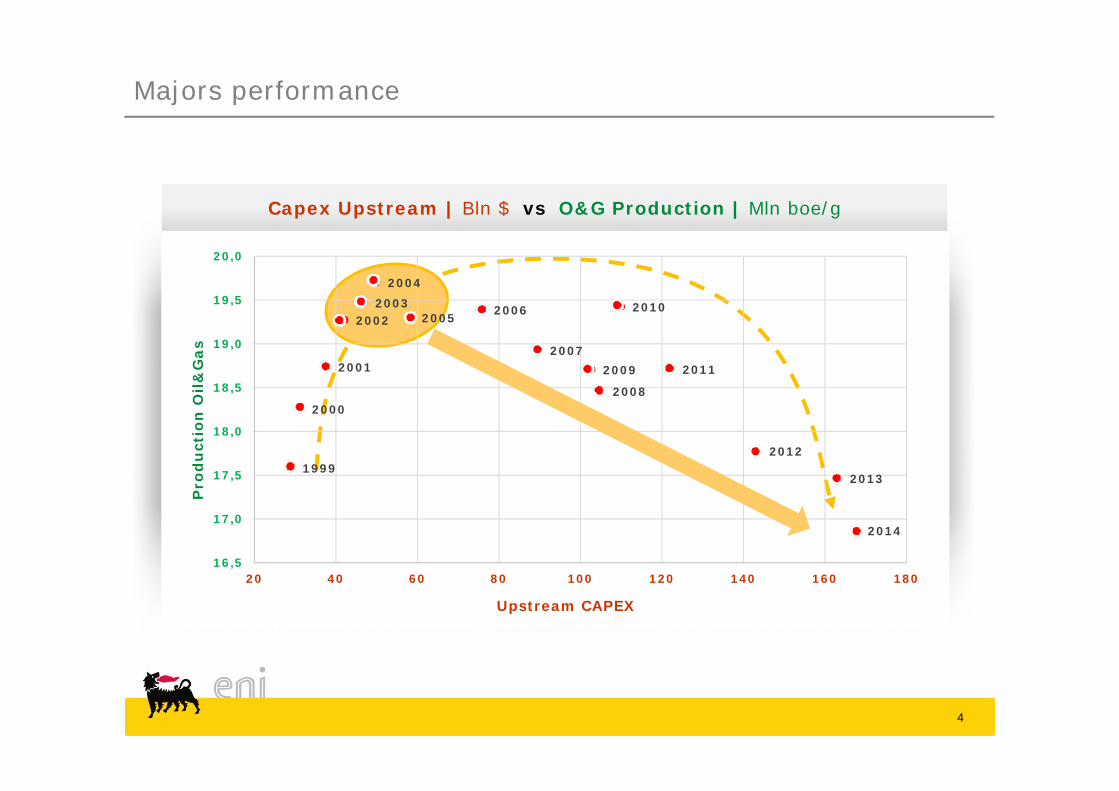
Majors performance
Capex Upstream | Bln $ vs O&G Production | Mln boe/g
4
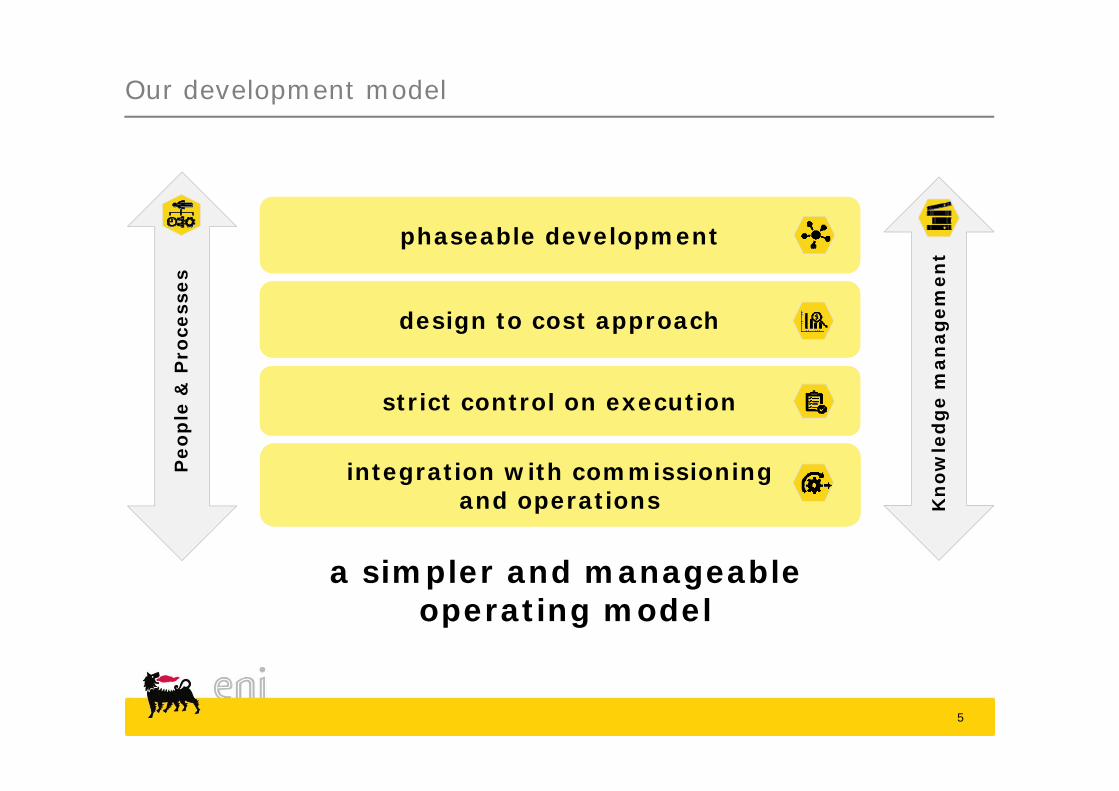
Our development model
phaseable development
design to cost approach
strict control on execution
integration with commissioningand operations
Peo
ple
& P
roce
sses
Kn
ow
led
ge
man
agem
ent
a simpler and manageableoperating model
5
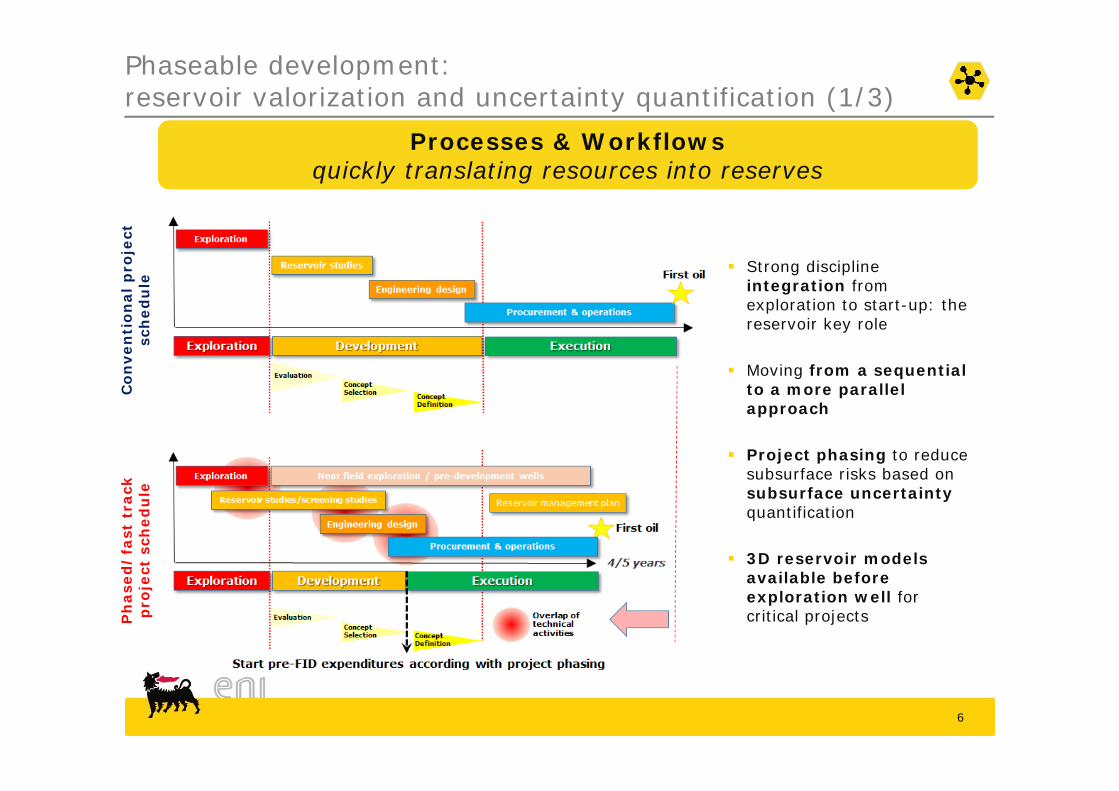
Phaseable development:reservoir valorization and uncertainty quantification (1/3)
Processes & Workflowsquickly translating resources into reserves
Strong discipline integration from exploration to start-up: the reservoir key role
Moving from a sequential to a more parallel approach
Project phasing to reduce subsurface risks based on subsurface uncertainty quantification
3D reservoir models available before exploration well for critical projects
Con
ven
tion
alp
roje
ctsc
hed
ule
Ph
ased
/fa
st t
rack
pro
ject
sch
edu
le
6
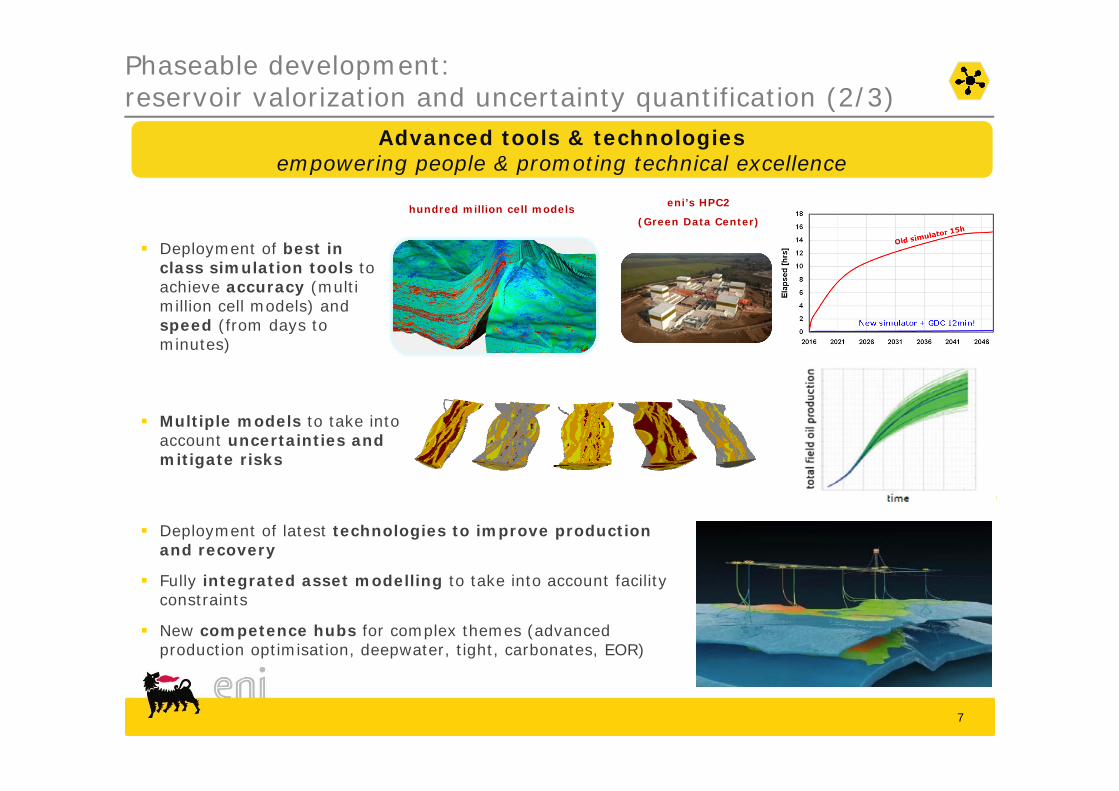
Phaseable development:reservoir valorization and uncertainty quantification (2/3)
Advanced tools & technologiesempowering people & promoting technical excellence
Deployment of best in class simulation tools toachieve accuracy (multi million cell models) and speed (from days to minutes)
Deployment of latest technologies to improve production and recovery
eni’s HPC2
(Green Data Center)hundred million cell models
Fully integrated asset modelling to take into account facility constraints
New competence hubs for complex themes (advanced production optimisation, deepwater, tight, carbonates, EOR)
Multiple models to take into account uncertainties and mitigate risks
7
8
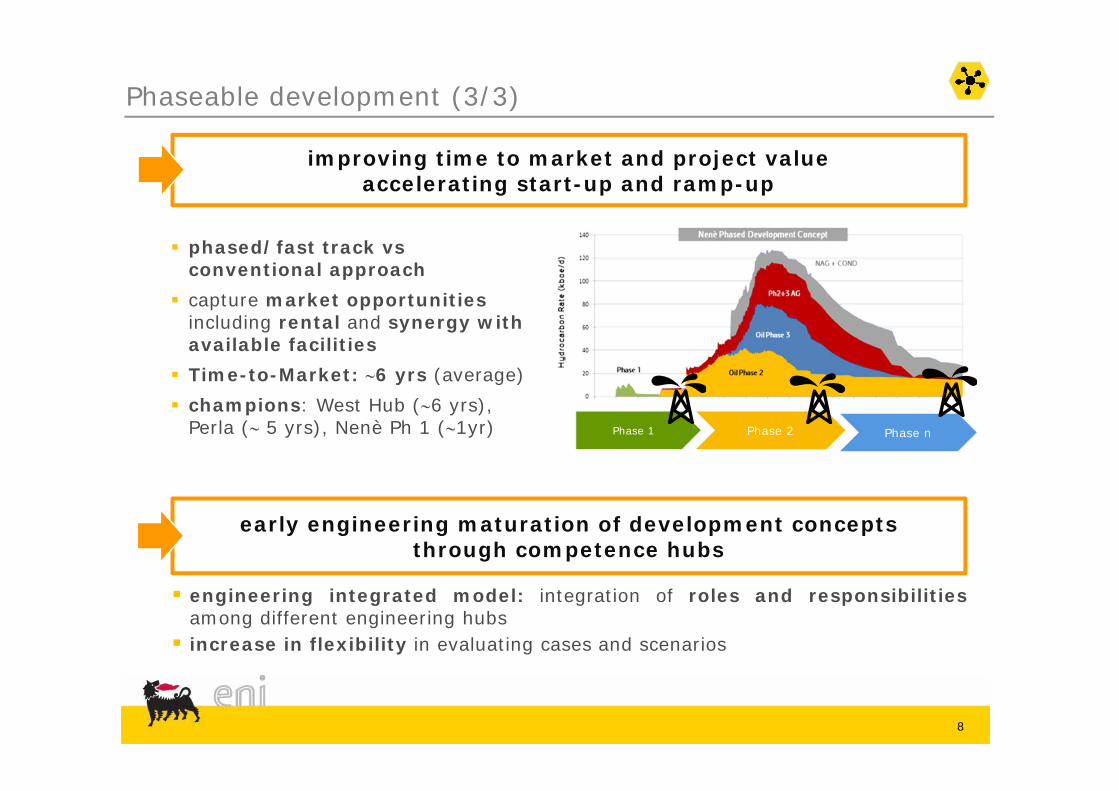
improving time to market and project value accelerating start-up and ramp-up
Phaseable development (3/3)
phased/fast track vs conventional approach
capture market opportunities including rental and synergy with available facilities
Time-to-Market: 6 yrs (average) champions: West Hub (6 yrs),
Perla ( 5 yrs), Nenè Ph 1 (1yr) Phase 1 Phase 2 Phase n
early engineering maturation of development conceptsthrough competence hubs
engineering integrated model: integration of roles and responsibilitiesamong different engineering hubs increase in flexibility in evaluating cases and scenarios
9
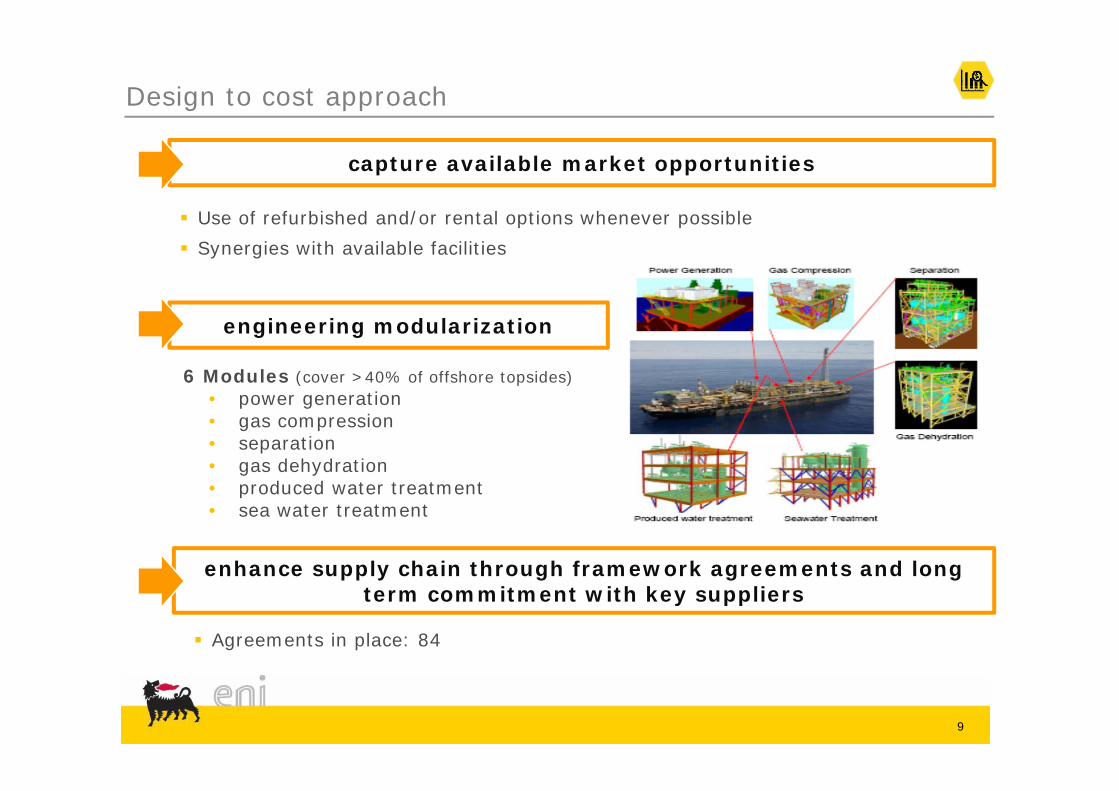
Design to cost approach
engineering modularization
6 Modules (cover >40% of offshore topsides)• power generation• gas compression• separation• gas dehydration• produced water treatment• sea water treatment
Agreements in place: 84
enhance supply chain through framework agreements and long term commitment with key suppliers
capture available market opportunities
Use of refurbished and/or rental options whenever possible Synergies with available facilities
10
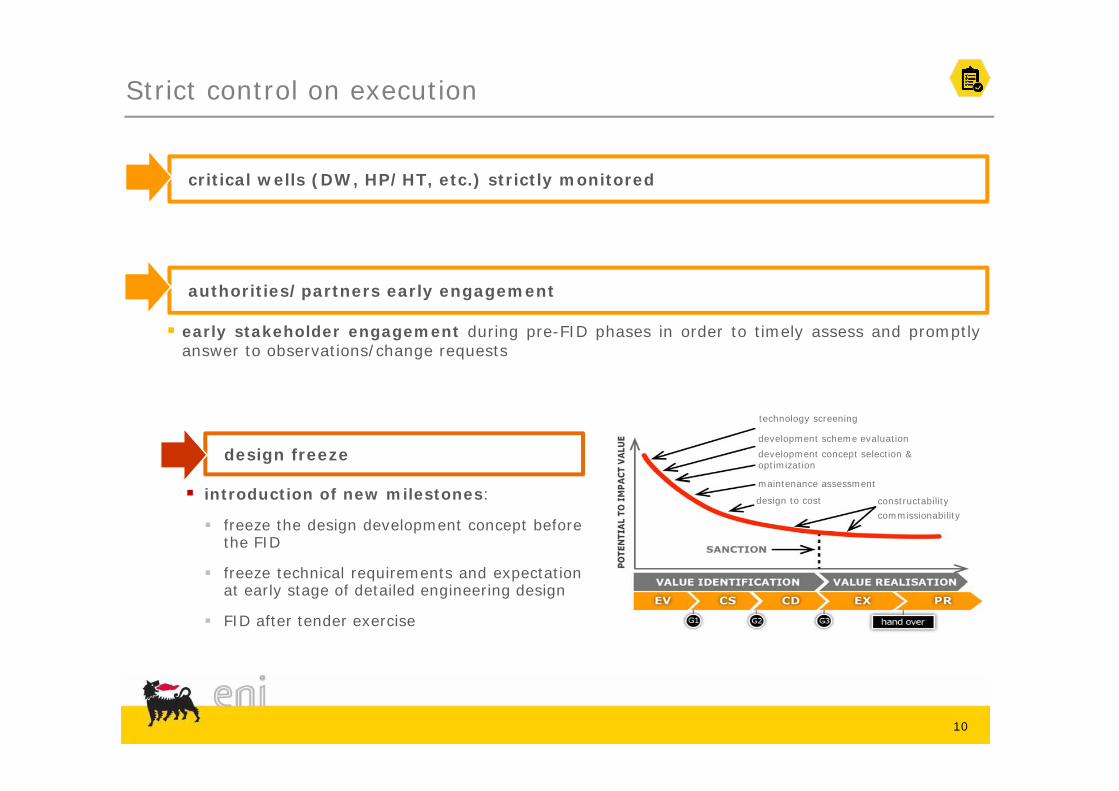
design freeze
Strict control on execution
constructabilitycommissionability
technology screening
development scheme evaluationdevelopment concept selection & optimization
maintenance assessment
design to cost introduction of new milestones:
freeze the design development concept beforethe FID
freeze technical requirements and expectationat early stage of detailed engineering design
FID after tender exercise
critical wells (DW, HP/HT, etc.) strictly monitored
early stakeholder engagement during pre-FID phases in order to timely assess and promptlyanswer to observations/change requests
authorities/partners early engagement
11
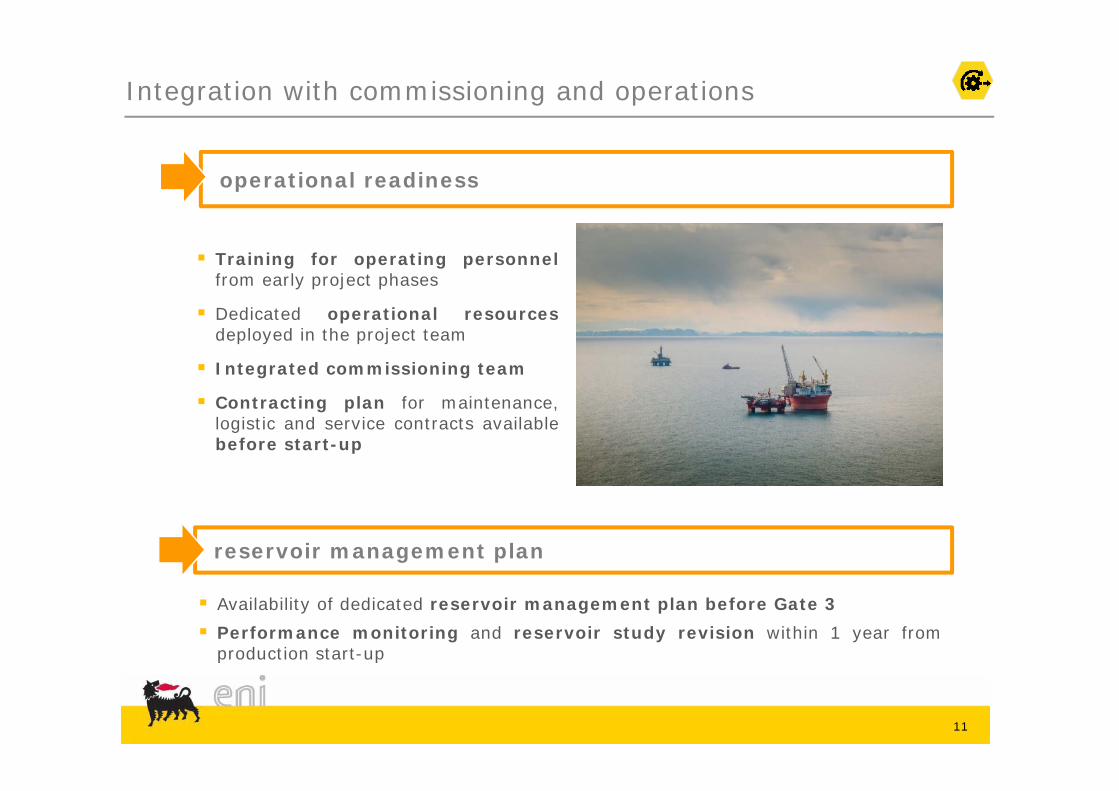
reservoir management plan
Integration with commissioning and operations
operational readiness
Training for operating personnelfrom early project phases
Dedicated operational resourcesdeployed in the project team
Integrated commissioning team
Contracting plan for maintenance,logistic and service contracts availablebefore start-up
Availability of dedicated reservoir management plan before Gate 3 Performance monitoring and reservoir study revision within 1 year from
production start-up
12
Processes & people
organizational structure revision to integrate the new business lines includingupstream, downstream and midstream
workflows and processes revision in order to make them simpler and effectivefor being deployed in all business lines (upstream, downstream and midstream)
adhere to strict staffing discipline with dedicated centralized high level projectstaffing structure
organization and process improvements
our people: the enabling factor
excellence competence hubs in all core disciplines(engineering, reservoir, drilling…)
entrepreneurial skills development throughstrong professional families role
competence sharing - capture opportunitiescoming from a fully integrated company
dedicated training programmes
13
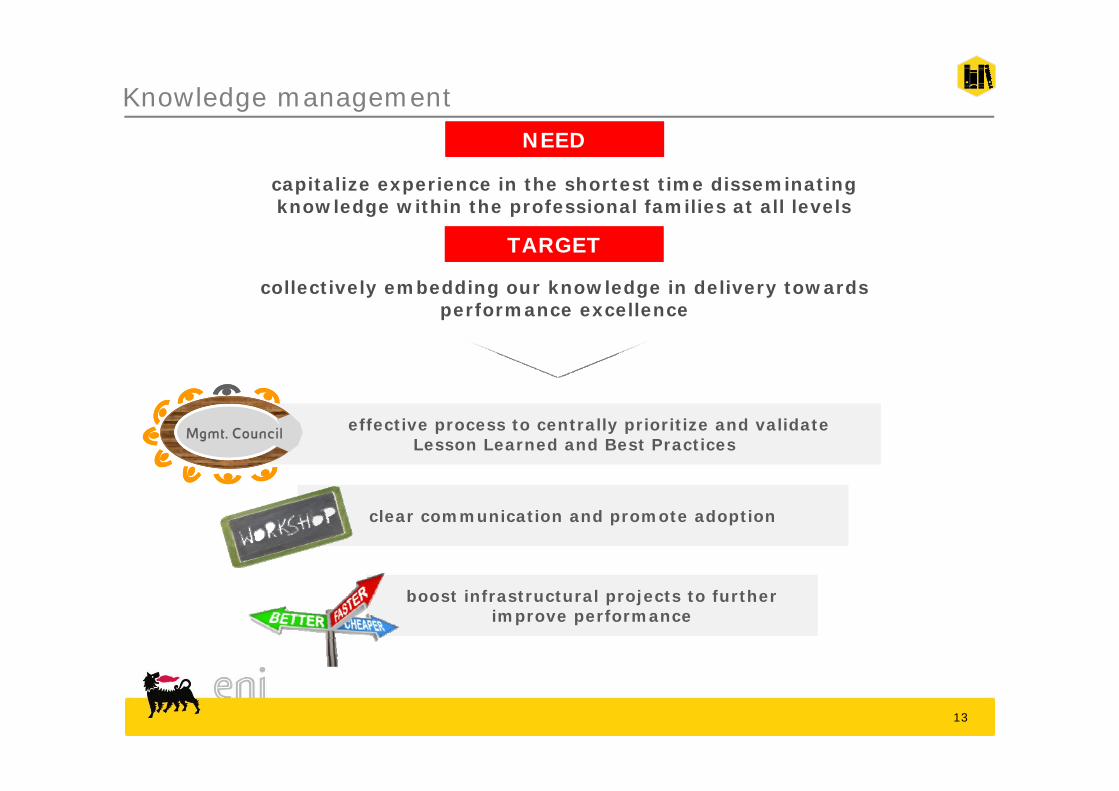
capitalize experience in the shortest time disseminating knowledge within the professional families at all levels
NEED
collectively embedding our knowledge in delivery towards performance excellence
TARGET
effective process to centrally prioritize and validateLesson Learned and Best Practices
boost infrastructural projects to further improve performance
clear communication and promote adoption
Mgmt. Council
Knowledge management
Focus on Zohr
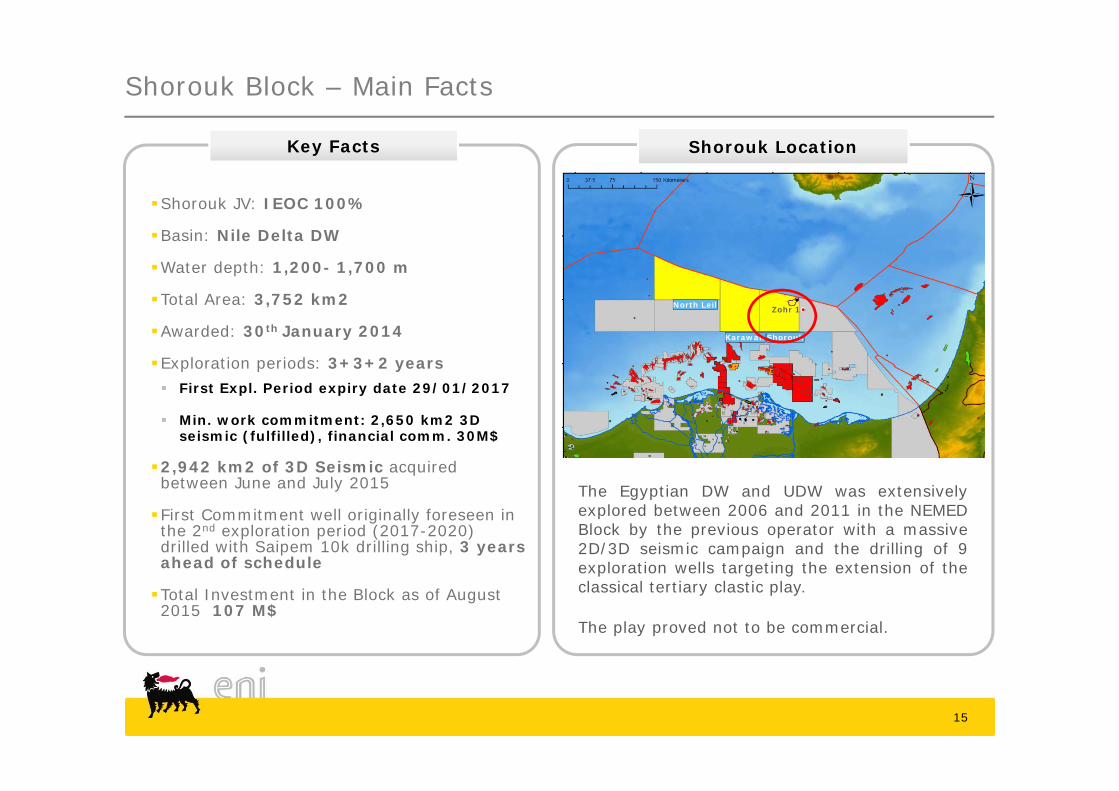
Shorouk Block – Main Facts
Key Facts
Shorouk JV: IEOC 100%
Basin: Nile Delta DW
Water depth: 1,200- 1,700 m
Total Area: 3,752 km2
Awarded: 30th January 2014
Exploration periods: 3+3+2 years First Expl. Period expiry date 29/01/2017
Min. work commitment: 2,650 km2 3D seismic (fulfilled), financial comm. 30M$
2,942 km2 of 3D Seismic acquired between June and July 2015
First Commitment well originally foreseen in the 2nd exploration period (2017-2020) drilled with Saipem 10k drilling ship, 3 years ahead of schedule
Total Investment in the Block as of August 2015 107 M$
Shorouk Location
ShoroukKarawan
North Leil Zohr 1
The Egyptian DW and UDW was extensivelyexplored between 2006 and 2011 in the NEMEDBlock by the previous operator with a massive2D/3D seismic campaign and the drilling of 9exploration wells targeting the extension of theclassical tertiary clastic play.
The play proved not to be commercial.
15
Source: IHS
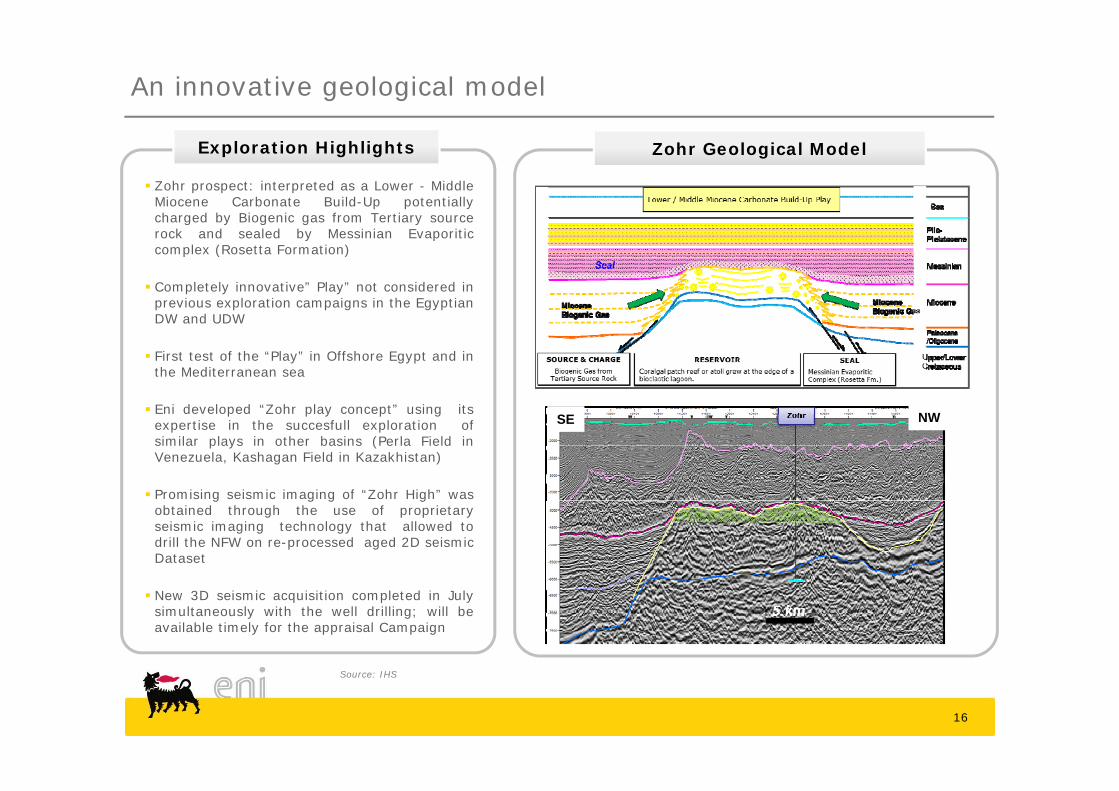
An innovative geological model
16
Exploration Highlights Zohr Geological Model
Zohr prospect: interpreted as a Lower - MiddleMiocene Carbonate Build-Up potentiallycharged by Biogenic gas from Tertiary sourcerock and sealed by Messinian Evaporiticcomplex (Rosetta Formation)
Completely innovative” Play” not considered inprevious exploration campaigns in the EgyptianDW and UDW
First test of the “Play” in Offshore Egypt and inthe Mediterranean sea
Eni developed “Zohr play concept” using itsexpertise in the succesfull exploration ofsimilar plays in other basins (Perla Field inVenezuela, Kashagan Field in Kazakhistan)
Promising seismic imaging of “Zohr High” wasobtained through the use of proprietaryseismic imaging technology that allowed todrill the NFW on re-processed aged 2D seismicDataset
New 3D seismic acquisition completed in Julysimultaneously with the well drilling; will beavailable timely for the appraisal Campaign
NWSE
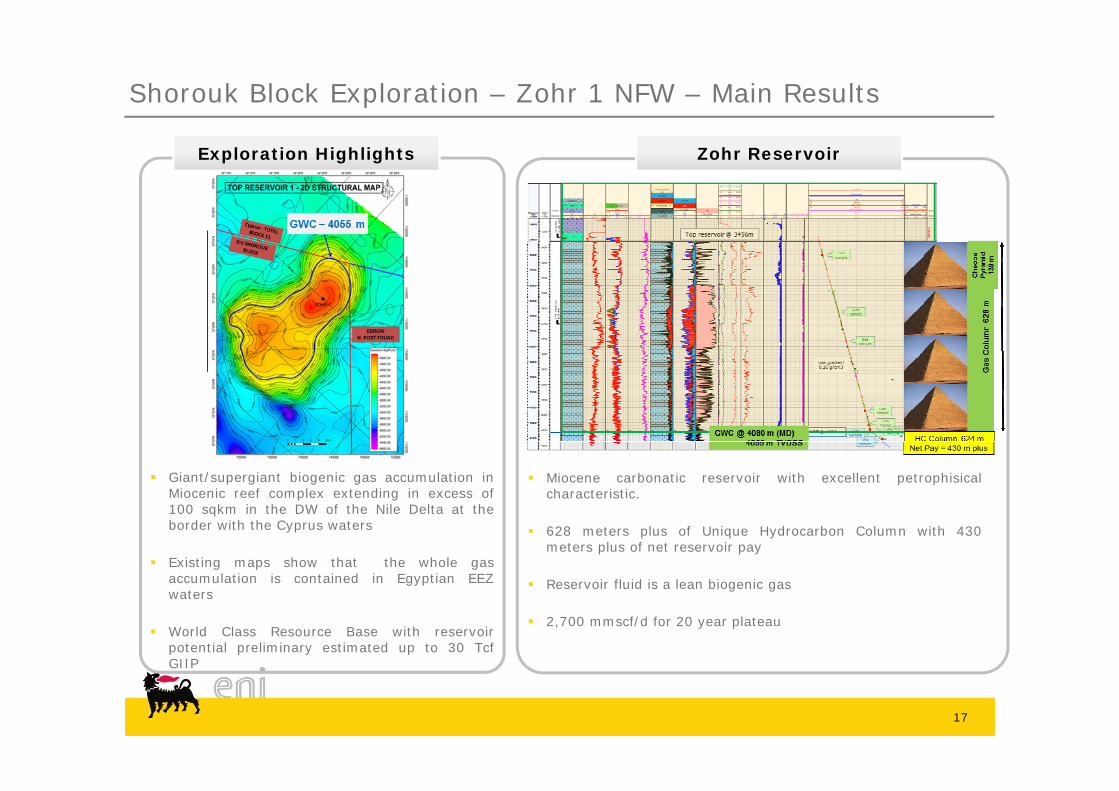
Shorouk Block Exploration – Zohr 1 NFW – Main Results
17
Giant/supergiant biogenic gas accumulation inMiocenic reef complex extending in excess of100 sqkm in the DW of the Nile Delta at theborder with the Cyprus waters
Existing maps show that the whole gasaccumulation is contained in Egyptian EEZwaters
World Class Resource Base with reservoirpotential preliminary estimated up to 30 TcfGIIP
Miocene carbonatic reservoir with excellent petrophisicalcharacteristic.
628 meters plus of Unique Hydrocarbon Column with 430meters plus of net reservoir pay
Reservoir fluid is a lean biogenic gas
2,700 mmscf/d for 20 year plateau
Exploration Highlights Zohr Reservoir
Goliat fieldGoliat field
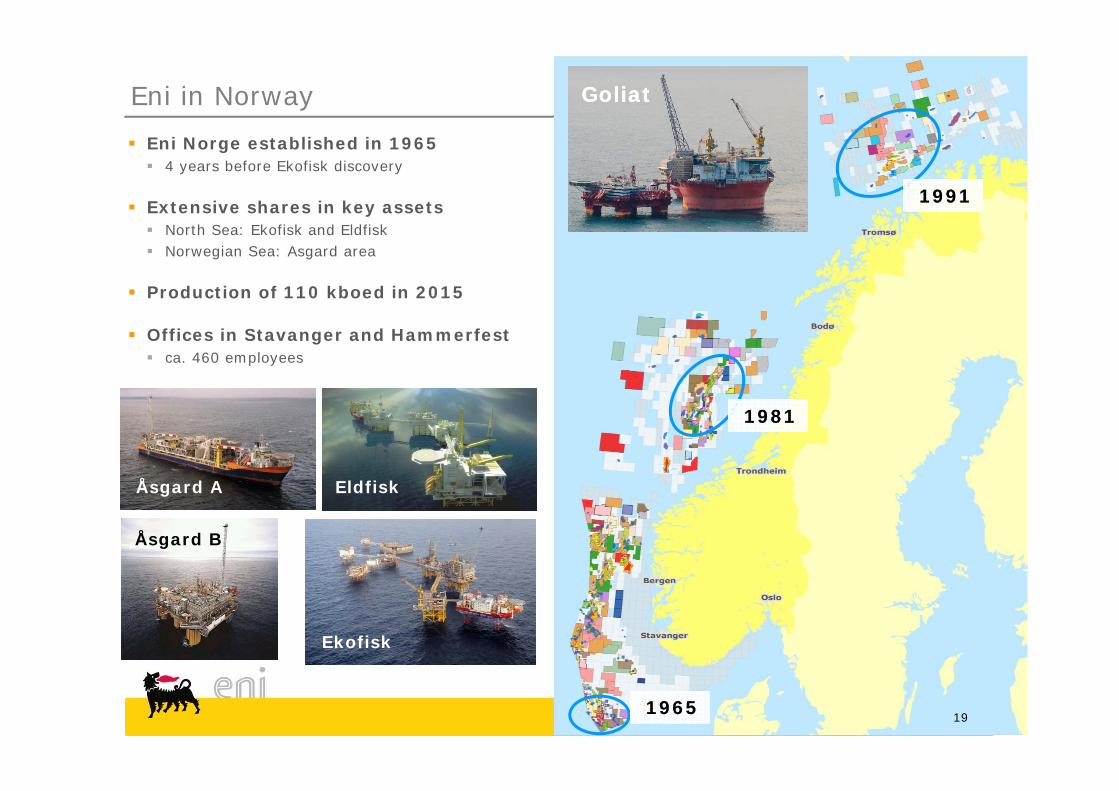
Eni Norge established in 1965 4 years before Ekofisk discovery
Extensive shares in key assets North Sea: Ekofisk and Eldfisk Norwegian Sea: Asgard area
Production of 110 kboed in 2015
Offices in Stavanger and Hammerfest ca. 460 employees
Eni in Norway
Eldfisk
Ekofisk
19651965
19811981
19911991
GoliatGoliat
Åsgard A
Åsgard B
19

198019911997
20002001-0720092011-122015
eni in the Norwegian Barents Sea
Start of exploration drilling in Barents SeaBeginning of eni activity in Barents SeaBarents Sea Program: record 40 applications
award of PL 229 (Goliat) to eni as Operator
Goliat discovery wellFurther explo/appraisal: resource growthGoliat PDO approved by Norwegian ParliamentSkrugard & Havis (Johan Castberg) discoveredGoliat production starting
23 (11 operated) expl. wells drilled from 1991 to 2015
6 (5 operated) expl. wells planned in 2016-2019
20
Hammerfest
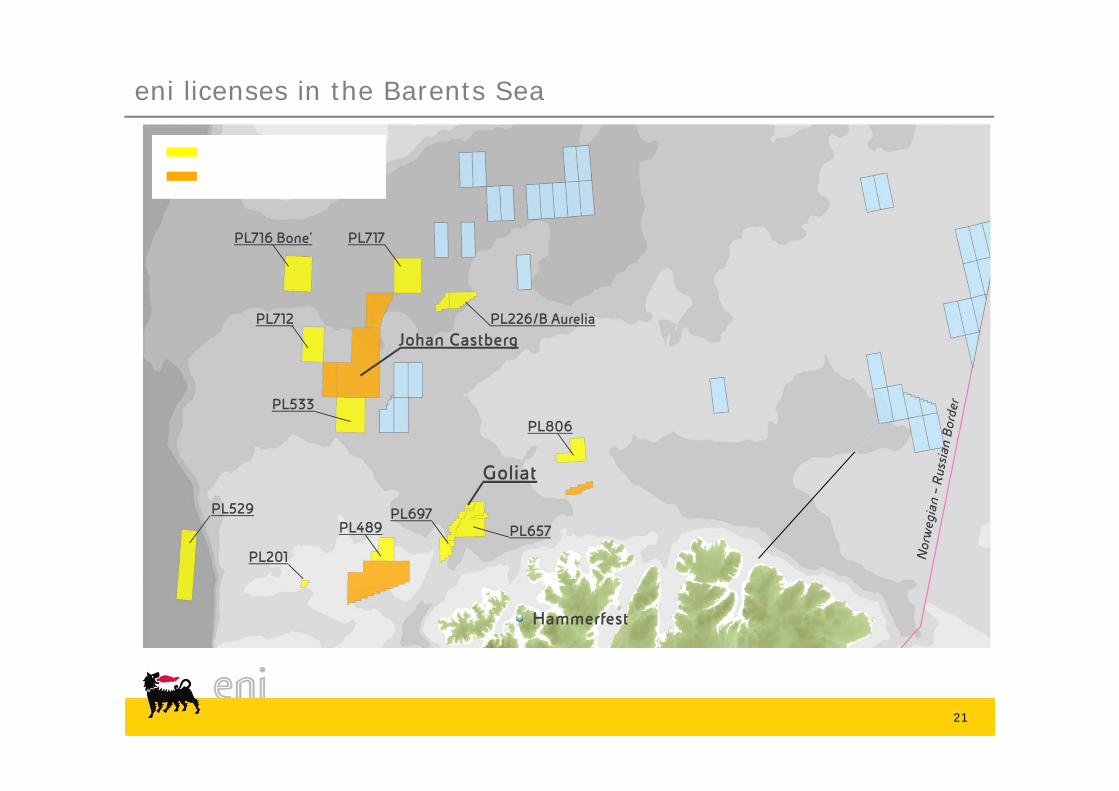
eni licenses in the Barents Sea
eni norge partner (5)
eni norge operated (11)
Goliat
PL489
PL806
PL533
PL529
PL657PL697
PL712
PL716 Bone’ PL717
PL201
PL226/B Aurelia
Johan Castberg
21
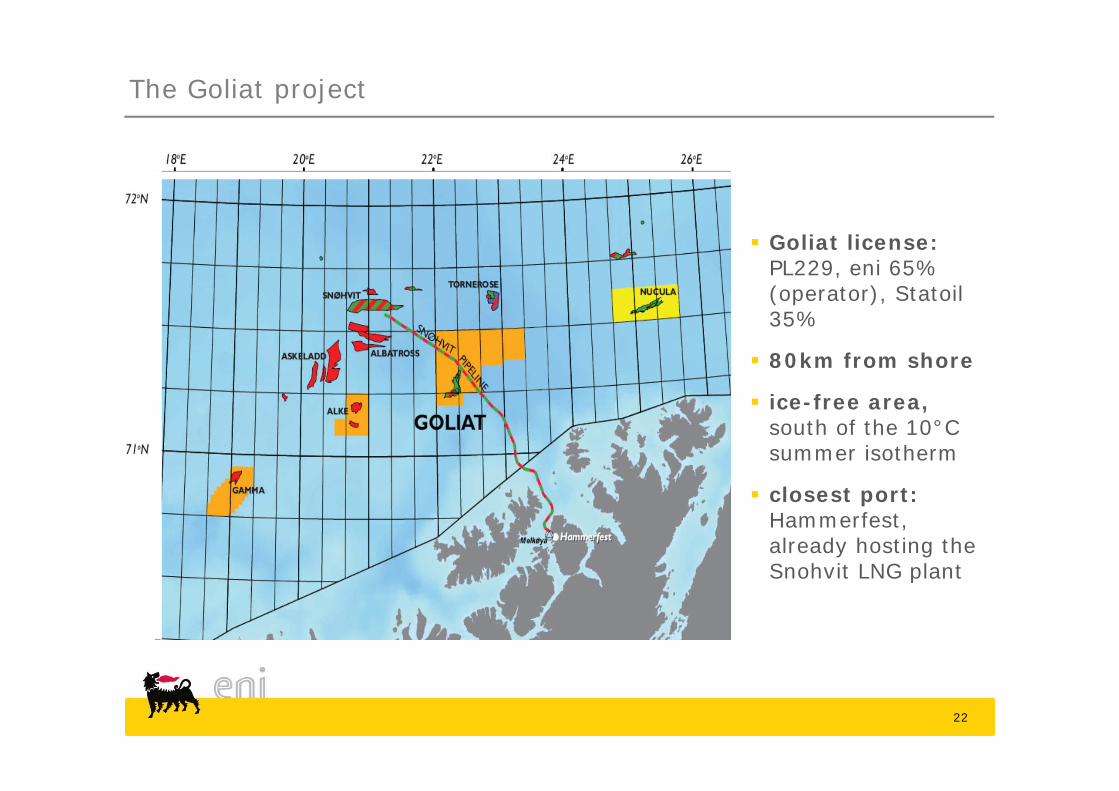
The Goliat project
Goliat license: PL229, eni 65% (operator), Statoil 35%
80km from shore
ice-free area, south of the 10°C summer isotherm
closest port: Hammerfest, already hosting the Snohvit LNG plant
22
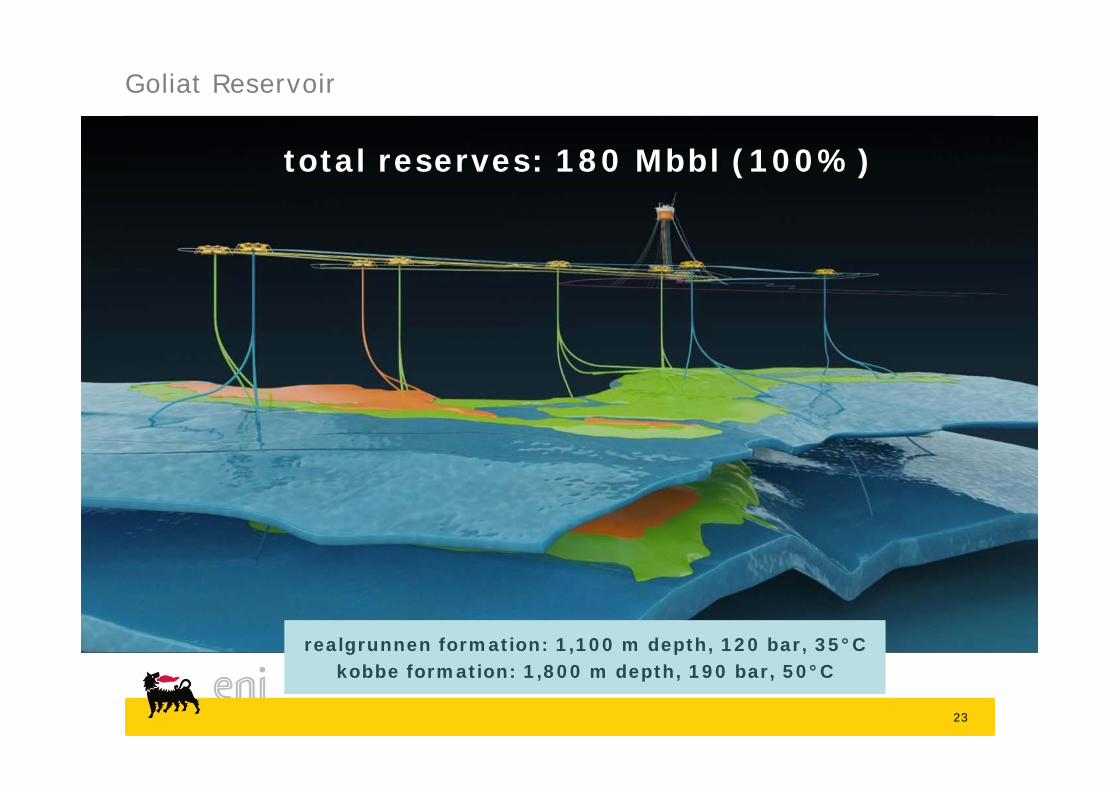
Goliat Reservoir
total reserves: 180 Mbbl (100%)
realgrunnen formation: 1,100 m depth, 120 bar, 35°Ckobbe formation: 1,800 m depth, 190 bar, 50°C
23
24
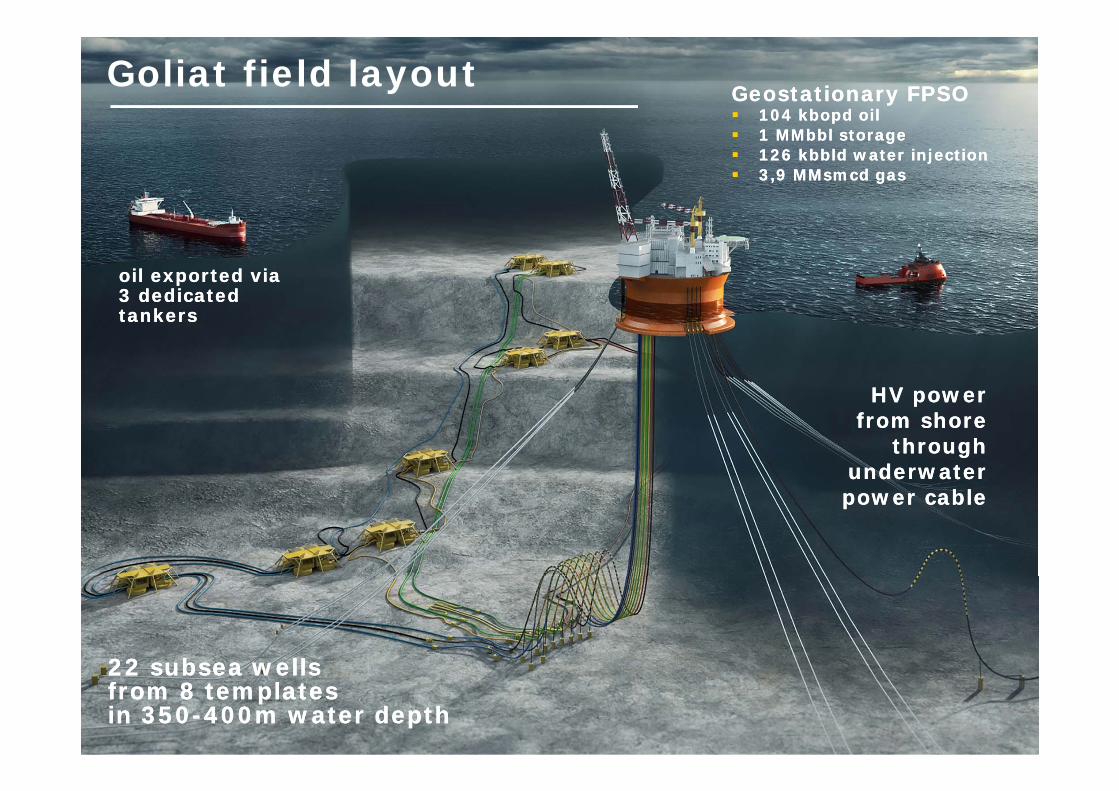
Goliat field layout
22 subsea wellsfrom 8 templatesin 350-400m water depth
22 subsea wellsfrom 8 templatesin 350-400m water depth
Geostationary FPSO 104 kbopd oil 1 MMbbl storage 126 kbbld water injection 3,9 MMsmcd gas
Geostationary FPSO 104 kbopd oil 1 MMbbl storage 126 kbbld water injection 3,9 MMsmcd gas
oil exported via3 dedicatedtankers
oil exported via3 dedicatedtankers
HV powerfrom shore
throughunderwaterpower cable
HV powerfrom shore
throughunderwaterpower cable
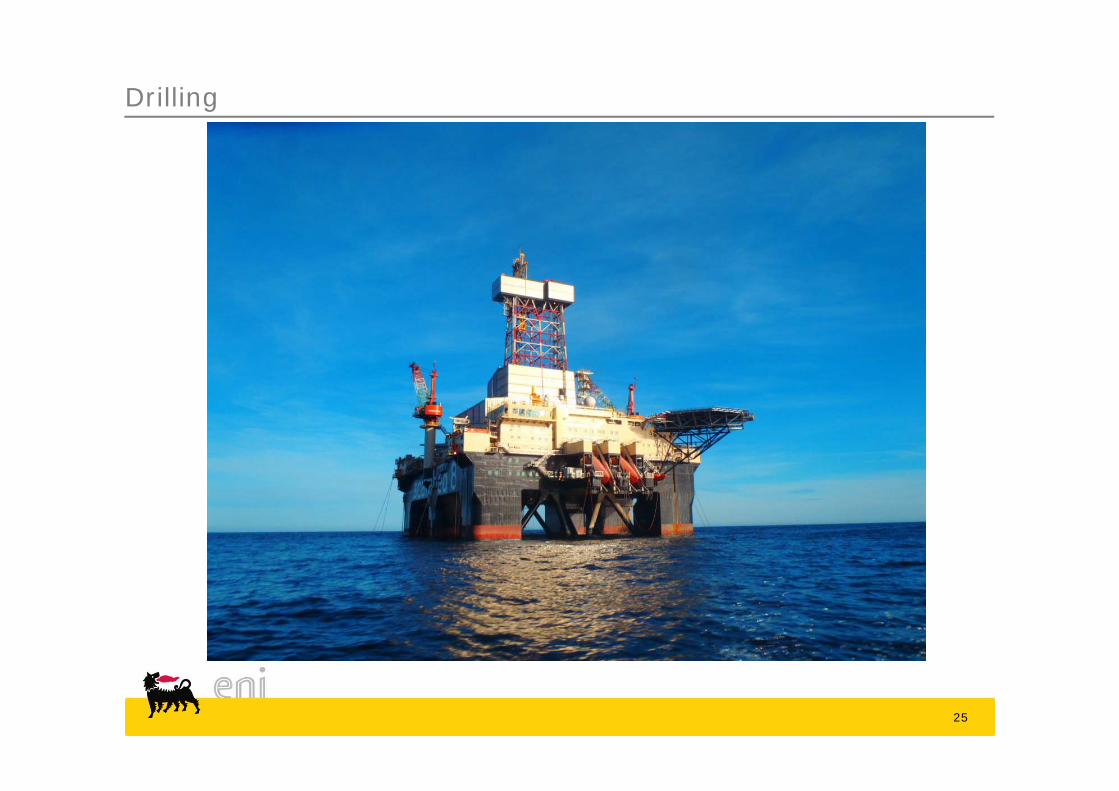
Drilling
25
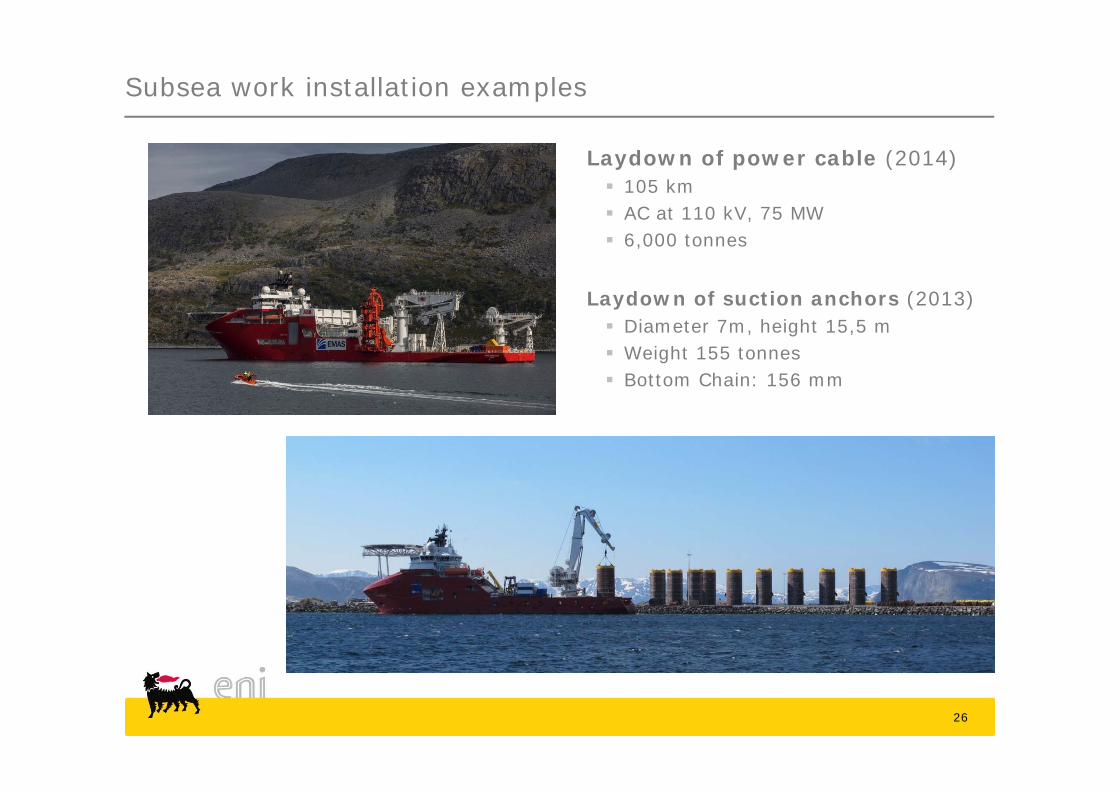
Laydown of power cable (2014) 105 km AC at 110 kV, 75 MW 6,000 tonnes
Laydown of suction anchors (2013) Diameter 7m, height 15,5 m Weight 155 tonnes Bottom Chain: 156 mm
Subsea work installation examples
26

27
largest cylindrical FPSO in the world
64000 tons, 115m wide, 100m tall
built in Hyunday Offshore yards in Ulsan, Korea
transported to Hammerfest with Dockwise Vanguard (15,600nm, 63 days)
the Goliat FPSO
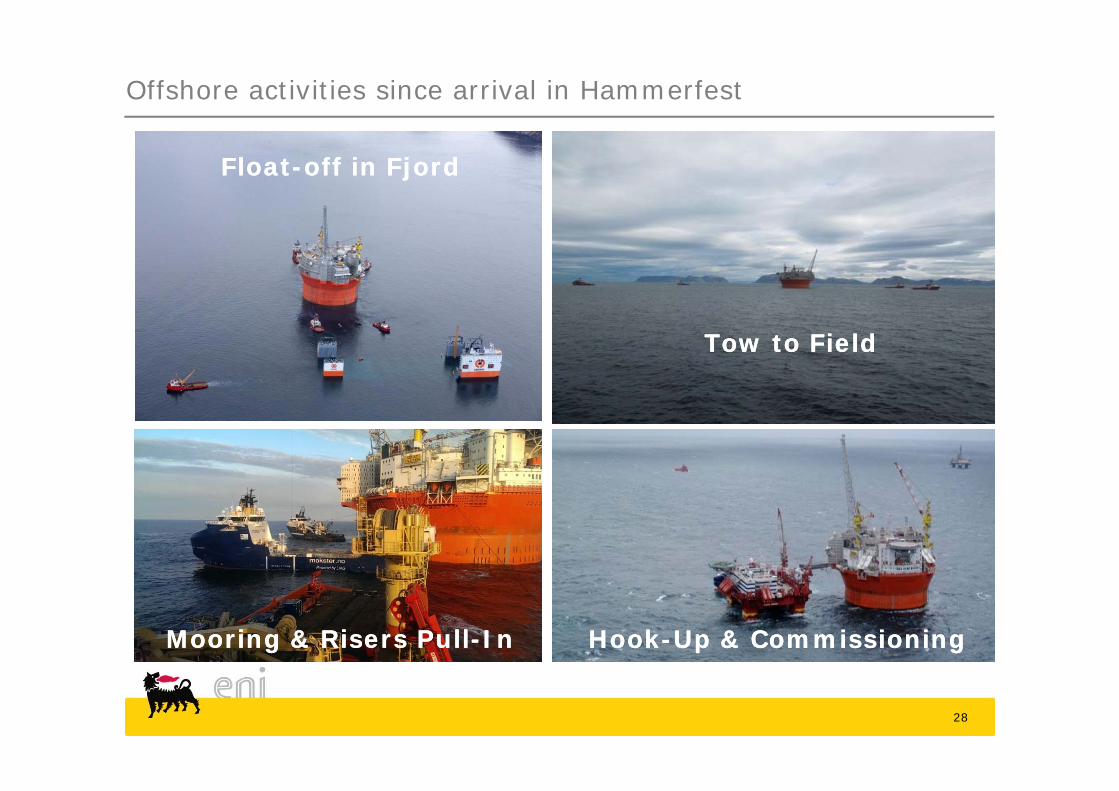
Offshore activities since arrival in Hammerfest
Tow to FieldTow to Field
Mooring & Risers Pull-InMooring & Risers Pull-In Hook-Up & CommissioningHook-Up & Commissioning
FPSO Installation
Float-off in FjordFloat-off in Fjord
28
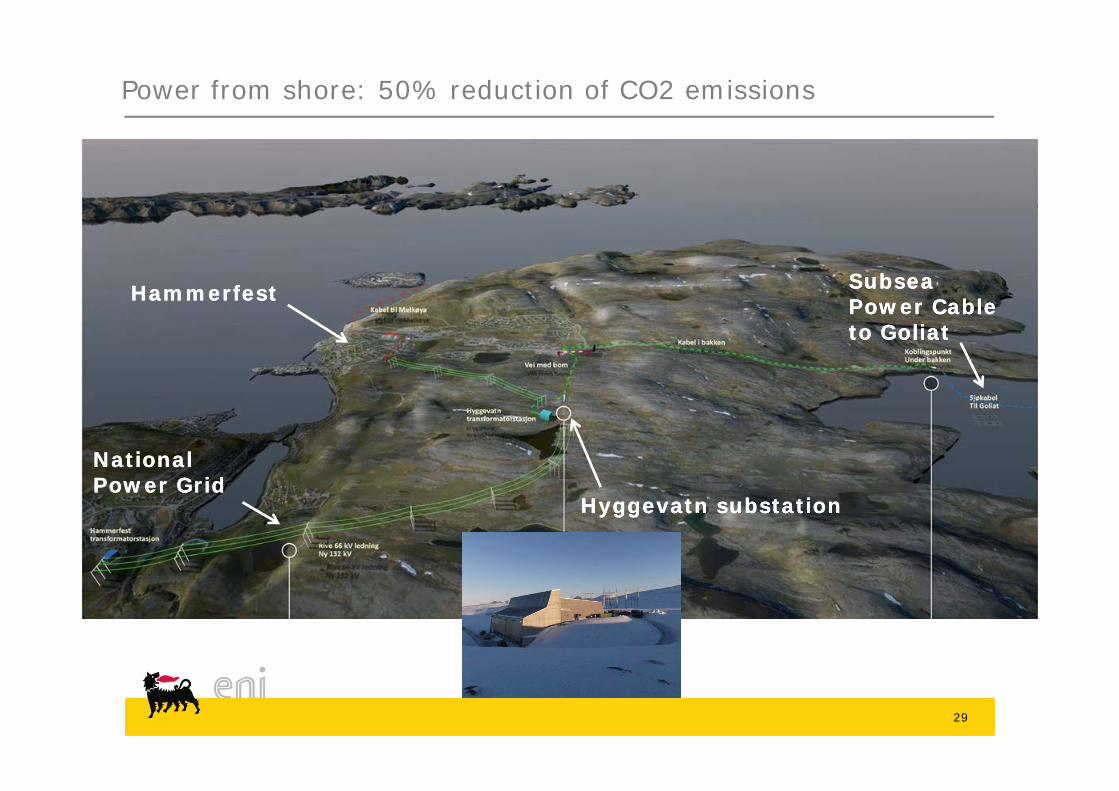
Power from shore: 50% reduction of CO2 emissions
HammerfestHammerfest
National Power GridNational Power Grid
Hyggevatn substationHyggevatn substation
Subsea Power Cable to Goliat
Subsea Power Cable to Goliat
29
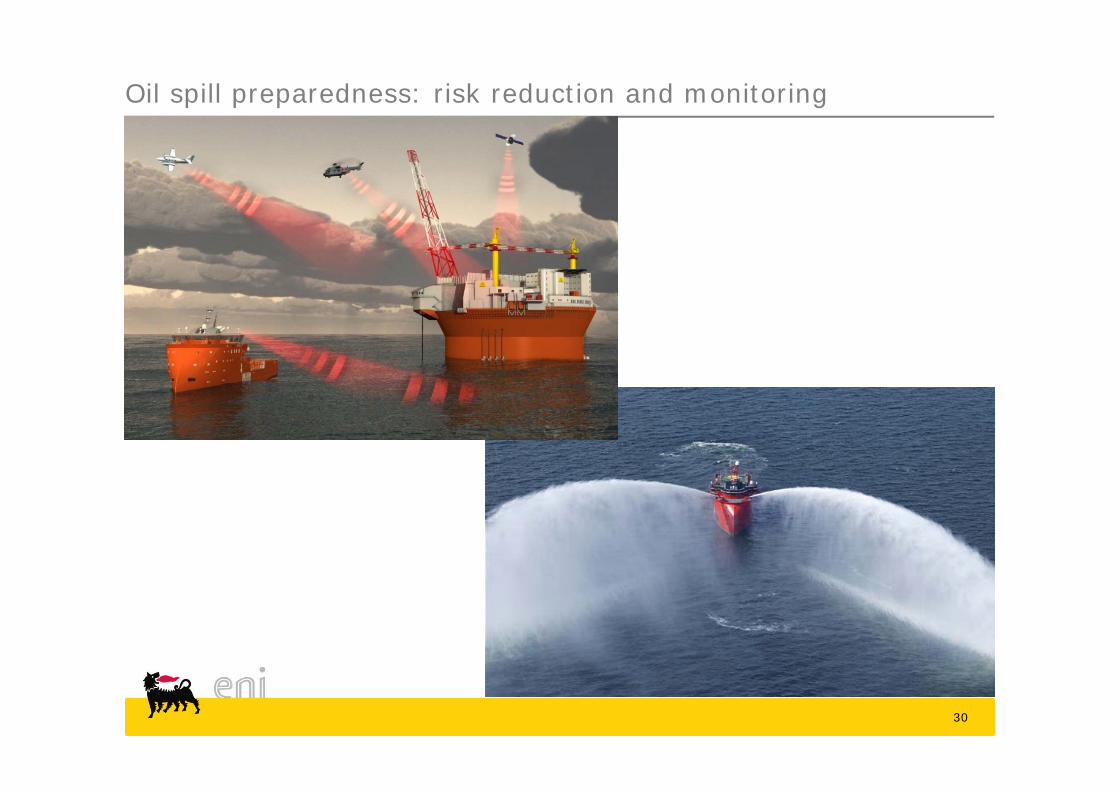
Oil spill preparedness: risk reduction and monitoring
30
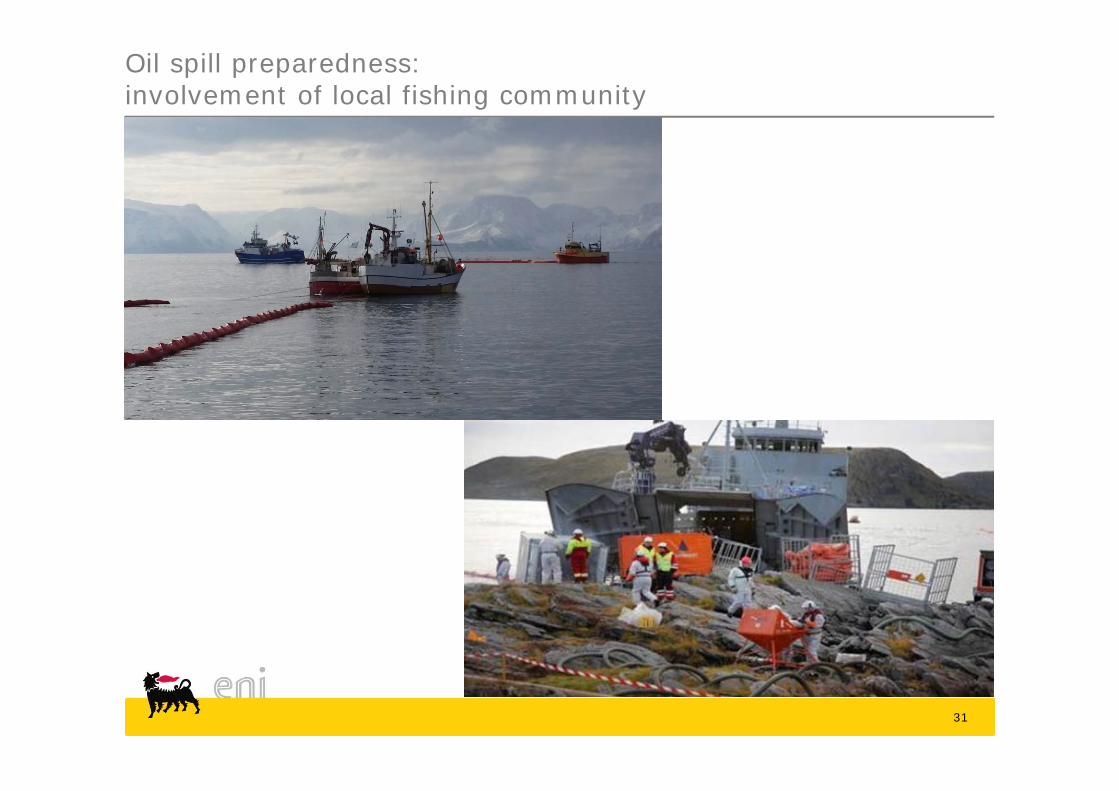
Oil spill preparedness: involvement of local fishing community
31
Goliat firsts
First oil project in the Barents Sea
Northernmost offshore production facility in the world
Largest cylindrical FPSO in the world, fully winterized
Longest subsea power cable to offshore installation(75MW cable, 110 km)
Minimal impact on environment reinjection of produced water into reservoir no gas flaring
New technology for Offloading System: offloading hose reeled-out and in at each oil export operation dedicated shuttle tankers (DP3, winterized)
Extensive provisions for operations in Polar Night
A reference case in Norway for oil spill preparedness
A reference case in Norway for sustainability and collaboration with hosting territory («ripple effects»)
32