Embed Size (px)
DESCRIPTION
Goldsmith 1996
Citation preview
7/21/2019 Goldsmith 1996
http://slidepdf.com/reader/full/goldsmith-1996 1/20
W aste M anagement & Research (1996) 14, 105–124
MULTI-AXIAL TESTING OF GEOMEMBRANES
P.M. Goldsmith1 and R. I. Stessel2
1 Engineering-Science Inc., 57 Executive Park South, Atlanta, GA 30329, U.S.A. and 2 Department of Civil Engineering and M echanics, University of South Florida, Tampa, FL
33620–5350, U .S.A .
(Received 1 February 1993, accepted in revised form 11 August 1994 )
Therearemany accepted methods to ascertain theintegrity of a geomembrane(GM )by subjecting it to a battery of physical, mechanical and chemical tests. However,
there is no single comprehensive performancetesting programme that simulates thestresses to which a GM might besubjected in a serviceenvironment. This paper firstdiscusses the development and testing of a new test system based on multi-axialdeformation; observations concerning system design criteria and relevance to fieldconditions are made. The paper also presents the results of a physical testingprogramme, wherein standard materialstestswereimplemented usingthenewsystem;stress/strain, strain rate, creep and relaxation data arepresented. Where comparisonswere possible, these results reinforced fluid-based multi-axial testing data in theliterature. New data and conclusionsarediscussed. Finally, a new test, cyclic testing,is suggested, demonstrated and discussed. © 1996 ISWA
K ey Words— L andfill, land disposal, liner materials, geomembranes, materialsstrength, cyclic testing, waste disposal, solid waste, hazardous waste.
1. Introduction
Geomembranes (GM s) are sheets of rubber or plastic material used to prevent themigration of liquid or gasfromacontainmentarea. Theinitial publicworkscontainmentuses of these materials were in the lining of reservoirs; they are currently of criticalinterest in theenvironmental field becauseof their usein hazardouswastemanagement.Geomembranes area class of geosynthetic materials composed of very low permeabilitysynthetic polymers, elastomers and plastomers. Their primary uses are for lining andcovers of liquid storage facilities or solid and hazardous waste land disposal facilities.If theseliquidswereallowed to migratefrom thefacility, they would causegroundwateror surfacewater contamination. F ederal laws in theU .S.A. havebeen established which
mandatethepreventionof thismigration into thewater systems. TheU .S.EnvironmentalProtection Agency (EPA ) has determined that GM s are a necessary supplement toprepared clay materials for minimizingpollutant releasefrom hazardouswastefacilities(L andreth 1990).
The study of GM s is of importance for several reasons. Although land disposal of hazardous waste is seen as the least favoured waste management alternative, thesesystems will continue to be permitted due to the lack of technically and economicallyviable alternative management options. Additionally, many installations dealing withhazardous waste other than disposal facilities will be required to use GM s as barriers
2 Author to whomall correspondence should be addressed.
0734–242X/96/020105+20 $18.00/0 © 1996 ISWA
7/21/2019 Goldsmith 1996
http://slidepdf.com/reader/full/goldsmith-1996 2/20
P. M . Goldsmith & R. I . Stessel 106
(e.g. storage, treatmentand transfer areas). Thisallowsfor spills to behandled eff ectivelyby removing and replacing the earth while not allowing the waste to move outside thecontainment area. M unicipal solid waste landfills have also been required to increasethe stringency of their design with recommendations to use GM s. This is due to thegreat practical difficulties in excluding small amounts of hazardous substances frommunicipal wastes. Additional study is also needed because GM s are used beneathhazardouswastelandfills and their long-term behaviour is unknown. Theinaccessibilityof liner systems would preclude investigation of possible unanticipated failure mech-anisms. It is then important to represent exposure conditions in laboratory testing toreveal such failure mechanisms and study their causes prior to installation.
This research presents a testing method and apparatus for strength evaluation of GM s. The test system was designed to better represent the performance of thesematerials under combinations of conditions expected in the field. The system wasdesigned to beeasily modified to allow elevated temperatureandchemical compatibilitytesting. It was developed in an attempt to allow the study of several unanticipatedfailure modes currently being observed under field conditions.
This paper begins with a brief discussion of published literature, emphasizing thoseaspects that led to the design of the test system subsequently described. Due to thepopularity of this material, the paper focuses on the testing of HDPE (high-densitypolyethylene) liner materials. The next section of the paper discusses the actualdevelopment of the test system. This section covers the objectives of the system andthe evolution of the design to meet those objectives. Observations made during thisprocess are discussed. The last section describes the physical testing programme,beginning with experimental procedure. The tests were undertaken first to determinethecorrespondencebetween this system’s performanceof standard tests, and data fromother test systems.
2. Background
A review of data availablein theliterature has been presented by theauthors elsewhere(Stessel & Goldsmith 1992). This section briefly discusses those aspects of existing testinformation that led to the objectives controlling this test system development.
2.1 M ethods of attack and failure
Geomembranes are subjected to a wide variety of stresses during installation andoperation of a land disposal facility. Theliner must support its own weight during andafter installation on the slopes of the sides of the cells and contours of the bottomrequired for drainage. These stresses are due to the characteristically low coefficientsof friction in GM s when placed on significant grades (Richardson & K oerner 1985).
Stresses, potentially cyclic, are generated in the GM during the placement of wastes.Additionally, the landfill applies its considerable weight, thus compressing the liner. If the soils underneath the landfill are not properly prepared, or if an unanticipatedchange in hydrogeological conditions causes a small amount of water to appear underthe liner, localized subsidence can occur to which the liner must conform to remainintact. In the case of storage and treatment facilities, the operation of vehicles andequipment may result in constant cyclic loads; the membranes are closer to thesurface, and vehicles and equipment operatecontinuously. Punctures may occur during
7/21/2019 Goldsmith 1996
http://slidepdf.com/reader/full/goldsmith-1996 3/20
M ulti- axi al testi ng of geomembranes 107
installation from improper handling of equipment and tools, or poor subgrade pre-paration (Hansen & D eatherage 1987). Other potential sources of failure includebendsand creases, cuts and abrasionsduring installation, burrowing animals, plantsand theirroots, and micro-organisms (Haxo & Nelson 1984; M urphy & K oerner 1988; ASTM1990).
Fluid headsmay subject thematerial to additional loads. It is not possible to preventleachatecontact with the liner completely. TheEPA standard calls for limitingleachateheads to 31cm (1 foot) on the liner. These fluids may be incompatible with the liner;thechemical exposuremayoccur in conjunction with thephysical strainingmechanismsdiscussed above. The polymer can swell and soften when it absorbs wastes, but thereis no knowledge of the long-term eff ects on the mechanical resistance to stress fromthese eff ects (L andreth 1990). Better tests are required to determine chemical com-patibilities with GM materials.
2.2 Existing testing
There is a large array of physical, chemical and mechanical property tests currentlyavailable to identify the geomembranes’ strength and compatibility characteristics, forexample, the American Society for Testing and M aterials (ASTM ) physical propertiestesting methods and the U.S. Environmental Protection Agency (EPA) M ethod 9090.
It is necessary to identify theproper applicability of each test and distinguish betweentwo major categories: “performance” and“index” tests. Index testsareconducted understandardized, isolated and relatively ideal conditions. Performance tests are conductedunder specific conditions and are intended to model in-situ conditions as closely aspossible. A n example of an index test is a grab tension test. The most widely used testis ASTM D638 TensileProperties Test (again, thefocusof this paper is HDPE ) (ASTM1990). A performance test confines the sample with a specific soil, while the standardindex test uses an unconfined sample. Currently, performance tests for GM s are not
widely used for standardized testing (U.S. EPA 1988). This work furthers performancetest development to increase the accuracy in simulating actual field conditions.
Current laboratory practicehas involved theuse of simple tests that isolatesamplesof material and test them in one very defined manner. F or example, a sample of linermay be cut into a “dumbbell” or “dogbone” shape. The ends of the “dumbbell” areeach fixed into a testing machine that pulls them apart. With materials that have ashort life, or with which one has extensive experience, this is adequate. It does a verypoor job of replicating conditions in which GM s will be used. Stresses in-situ are notuni-axial; they occur in a two-dimensional plane. Stresses on GM s are applied by soillayers, with movement normal to the planeof the material. TheGM s are stressed whileunder exposure to leachate.
The uniform- and wide-width samples are also standard index tests used to evaluate
strength. These tests attempt to address the problems associated with the dumbbelltest, but thewider samples often fail at thegrip interface (U.S. EPA 1988); wider gripsmust be custom-manufactured to hold widened ends. Additionally, several shape andlength:width ratios havebeen employed. Thewide-width tests aremore useful in designthan the dumbbell shape, but the test does not model in-situ conditions because thereare no soil contact interfaces and necking occurs in the plane. Confinement must beachieved to simulate a performancetest (U .S. EPA 1988).
M cGownet al . (1982) havedeveloped a testingprocedureandapparatusthatattempts
7/21/2019 Goldsmith 1996
http://slidepdf.com/reader/full/goldsmith-1996 4/20
P. M . Goldsmith & R. I . Stessel 108
to simulate a combination of soil stress, strain, creep and relaxation behaviours. Thistest confines a 20cm (8in) by 10cm (4in) specimen with soil interfaces. Air pressureis used to apply stressto themembrane. Resultsindicatethat, under confined conditions,the stress at failure and modulus increase, while thestrain at failure is decreased.
Geomembranes are used in large sheets; their configuration is two-dimensional.Forces due to material weight and displacement are in vectors within that plane andmulti-axial tests most closely represent those conditions. A large circular specimen isplaced in a pressure vessel either with or without soil beneath it. Water is introducedabove the membrane and pressure is applied until failure occurs in the specimen. Thetest is conducted by measuring thepressureapplied and theresulting displaced volume.
The values are then converted to stress and strain assuming elliptical deformation(K oerner 1990). Among thesethree-dimensional tests are Steff en’s (1984) bursting testand Fayoux & L oudiere’s (1984) blister test. The bursting test fixes the GM into apressure vessel and then loads the membrane with air pressure until bursting occurs.
The blistering test is similar but water is used in contact with the membrane and thepressure is more localized.
Whilethesetests haverelevanceto liner applications, they do not accurately simulatethe combination of stresses encountered in operation. The use of a granular mediumso large and sharp as to cause punctures does not reflect any reasonable design; careshould always be taken to sandwich the membrane between prepared soils no largerthan sand. I f one desires to subject a displaced sample to chemical exposure, it is notreasonable to displace the sample with the potentially aggressive chemical; pressurescould beas high as a 30m leachatehead, which would represent a nearly inconceivablecondition requiring complete failure and neglect of the leachate collection system.
Examination of those data from current tests available in the literature revealedvariability in test results between laboratories that could compromisetheusefulness of those tests in design (Stessel & Goldsmith 1992). Tensile break forces for 0.75mmHDPE ranged between 2620–3595 N cm−2 from the same investigator (Haxo et al .
1986). For diff
erent investigators, the tensile break force of 0.75mm HDPE using thestandard dumbbell test ranged between 1751–2677N cm−2; burst tests give resultsranging between 593–2413N cm−2.
The study of the shortcomings of existing test methods led to the formulation of theobjectives of this research.
2.3 Obj ectives
Themain objectiveof this testing project was to develop a testing system and procedureto increase thelaboratory’s ability to represent field conditions a GM could encounter.
To accomplish these objectives, this work was divided into three stages:(1) An apparatus capable of producing and testing a variety of exposure conditions
which a GM might encounter in the field was designed, constructed and in-strumented.
(2) Apparatusperformancetests were conducted andappropriatemodifications weremade. Several interesting observations were made in this process.
(3) Physical testing on samples of GM were conducted. These tests included tensiontests, relaxation tests and creep tests.
To accurately represent the field conditions involved with the combined stresses, theexperimental equipment had to be capable of any combination of the following:
7/21/2019 Goldsmith 1996
http://slidepdf.com/reader/full/goldsmith-1996 5/20
M ulti- axi al testi ng of geomembranes 109
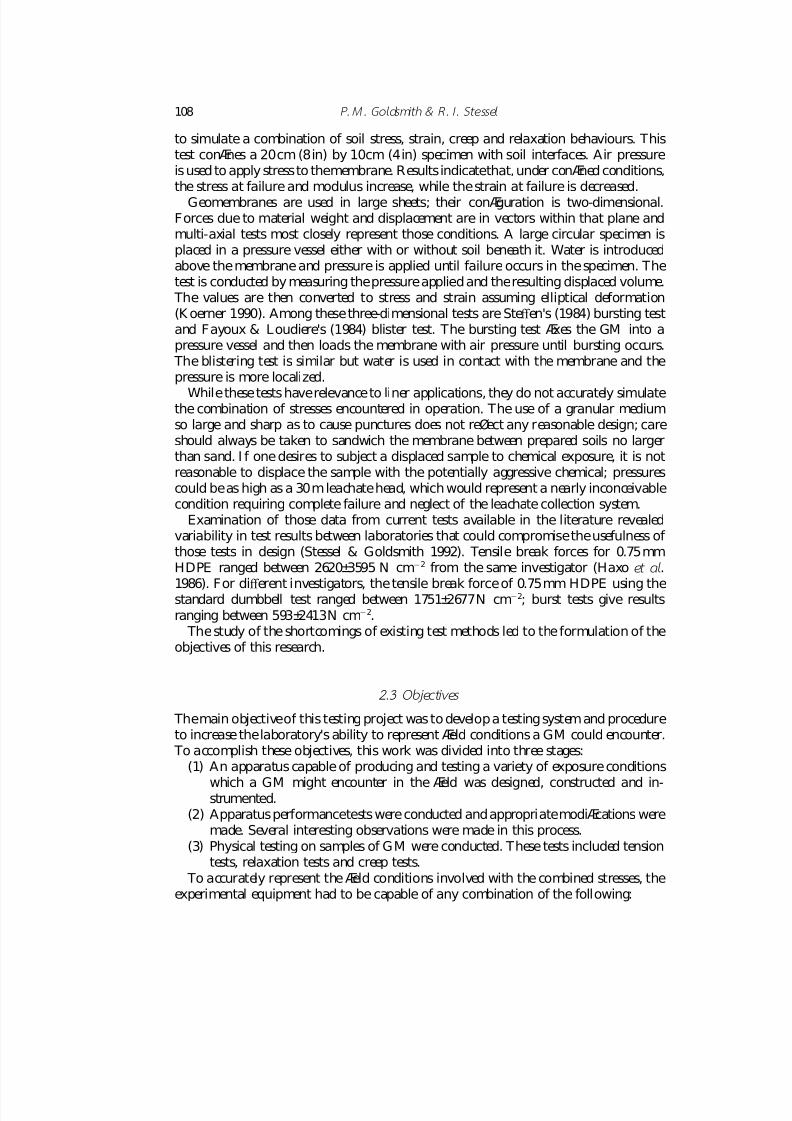
Displacement force
Fluid head
Compression force
Compression force
FML
F ig. 1. Conceptual diagram of forces on a geomembrane.
(1) Apply compression to simulate the weight of thelandfill;(2) Apply fixed displacements for stress/strain, cyclic and relaxation testing;(3) Apply fixed forces to conduct creep tests;(4) Read and store forces and displacements; and
(5) Allow independent application of fluid head (not addressed in this work); and(6) Allow easy modification in order to model additional environmental factors
(chemical attack, temperature).A conceptual diagram of the forces to be applied to a GM to simulate in-service
conditions is presented in Fig. 1.
3. Experimental methodology
Thedevelopment oftheconfigurationof thesystemitself yieldedinterestingobservations. The experimental system was designed to deform a 15cm (6in) diameter circular diskof membranematerial in a clamped ring. Thesystemencased themembranein granularmaterial that simulated the underlying and overlying protective layer. Pistons above
and below the membrane were connected with an independent testing frame that, inturn, fitted inside the testing frame of an automated compression testing machine.
Together, theindependent testing frameand thetesting machineallowed theapplicationof combinations of compressive and displacement forces. The displacement force, ascan be seen in F ig. 1, produces stresses in the plane of the membrane. Stresses in theplane result from either sub-surface subsidence or the membrane’s own weight on aslope. Allowance was made for the later application of fluid head under controlledpressure. A fluid suspected of adversely aff ecting the membrane could be selected; this
7/21/2019 Goldsmith 1996
http://slidepdf.com/reader/full/goldsmith-1996 6/20
P. M . Goldsmith & R. I . Stessel 110
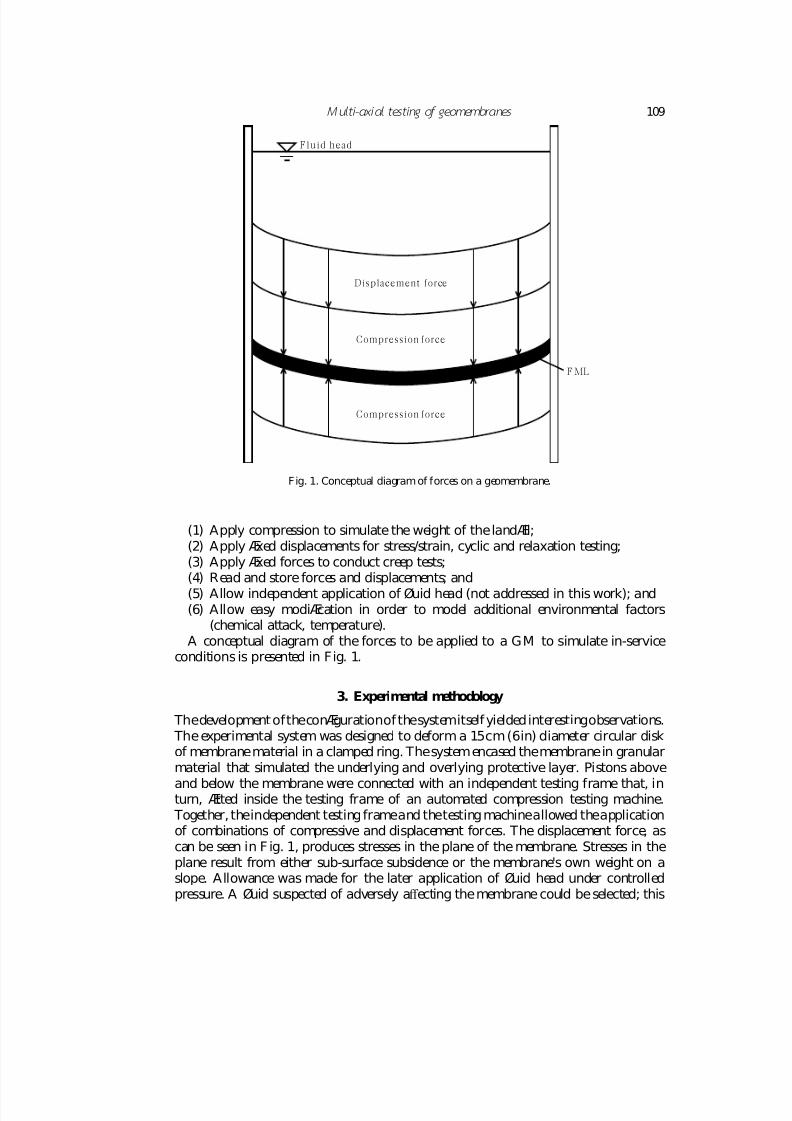
FMLsample
Grips
Innersleave
P ressu re/displa cementpla te
Permeantentrance
Sphericalpistonhead
Permeantexit
Gra nula rmateria l
Fig. 2. Cross-sectional sketch of comprehensivetest system.
was not a part of the research reported here. Figure 2 shows the configuration of thesystem.
In developing the system, it was very important to ensure that failures were not aresult of some peculiarity of thetesting system, but could beused to draw conclusionsconcerning thematerial itself. Of particular concern was theeven distribution of stressthrough thesample. This wasascertained byexamining thesamplesafter each individualtest; stress concentrations proved quite visible.
The core of the device was a modification of a soil testing permeameter. The metal
rings clamping thesample were designed so as not to shear thesample; this provisionwas called “strain relief”. M aterials were limited to corrosion-resistant metals, Teflon®
and Viton® because of the potential use of aggressive chemicals. The selection of the granular media and their manner of containment gave insight
into themechanics and interaction of thesoil particles between themselves and theGMmaterials. At first, there was an attempt to use very fine particles that would not exertany point loads on the GM . Examples were Teflon® microspheres and talc. Thesepowder-size particles showed an extreme tendency to agglomerate. Even the standard
7/21/2019 Goldsmith 1996
http://slidepdf.com/reader/full/goldsmith-1996 7/20
M ulti- axi al testi ng of geomembranes 111
Ottawa sand that was selected showed a tendency to moveas a singlemass, asdiscussedbelow. The only particles that moved smoothly were steel ball bearings, but these, likegravel used in some research, caused failureby puncturing, which was not the objectiveof this test equipment.
Even in thecase of sand, themembranefailed to deform in a smooth manner; ratherthan having a spherical section, a cylindrical section resulted. T he appearance was asif, instead of a granular medium, one had a solid piston. Theexplanation was that theinter-particle friction encountered with the load necessary to deform the membrane,prevented relative movement of the particles; the sand did not flow. Failure thenoccurred in a ring near to where the membrane sample departed from the cylinderwall. This was termed “hoop failure”. I nitially, such a failure was seen as an artifice of the equipment, rather than representing any type of material property. Designing thepiston head in semi-spherical form solved this problem. Nevertheless, this failurecontinued to occur under other conditions. M ost particularly, even after smoothdeformations had been achieved, the addition of a compressive load by applying thebottom piston prior to displacing the membrane, caused the sand cease to flow again.
Examination of photographs of subsidence showed that sharp edges between the areaof subsidence and the surrounding soil are not uncommon; thus, such “hoop failure”might represent real conditions in the field. Nevertheless, the objective of this workwas to test properties within thebody of the sample, without inducing discontinuities;thesystem design features and operational conditions that prevented hoop failure werethus retained throughout this testing.
To measuretheforcesand displacements, standard measuringequipment wasutilized;load cells for load data and linear voltage displacement transducers for displacementdata. Data gathering was automated by use of computerized data conversion andstorage. A micro-computer was adapted to read and store the data from the testingprocedures.
3.1 Str ain/surf ace area relati onship
In order to obtain a relationship between thedisplacement of the piston head and thesurface area of the deformed sample, the development of a correlating equation wasrequired. Ideal deformation would result in a partial sphere. As discussed in standardworks on surface tension, this would signify a uniform stress distribution throughoutthesamplemembrane— with a pressurized liquid blowinga membranethrough a roundopening, a spherical section would result (Stessel & Goldsmith 1992). Due to strainrelief provisions, the geometry of this system was considerably more complicated.
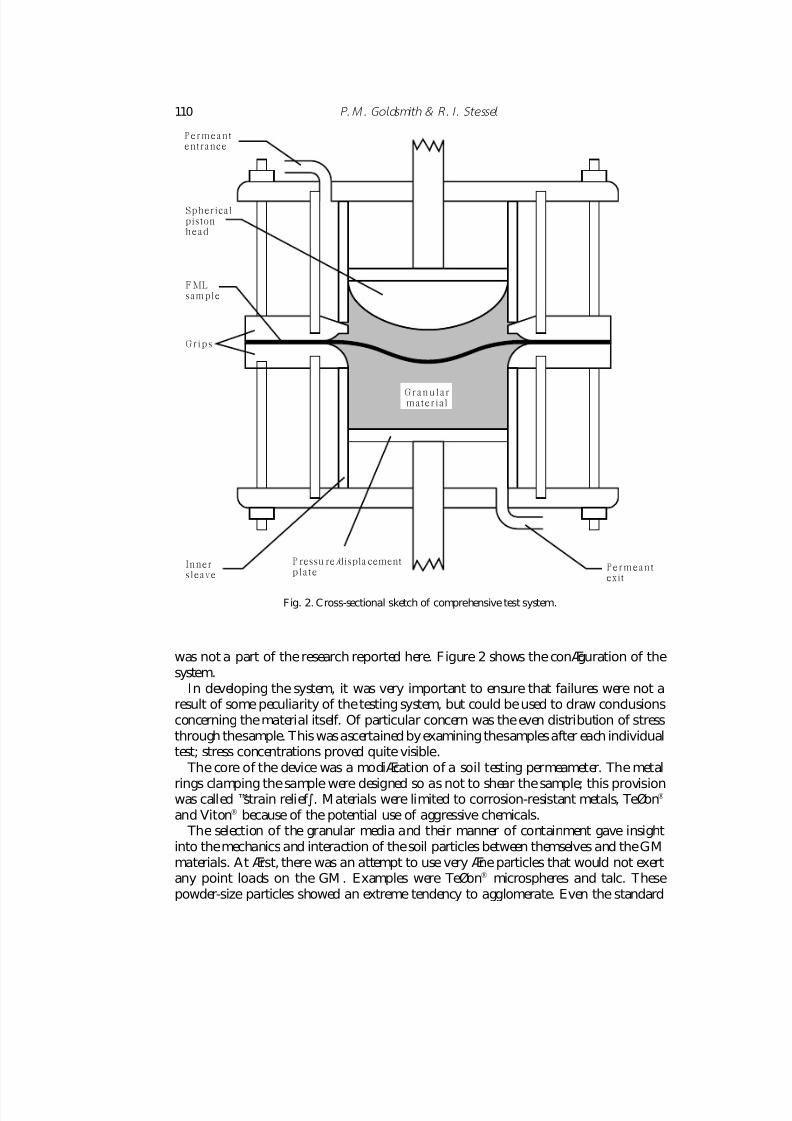
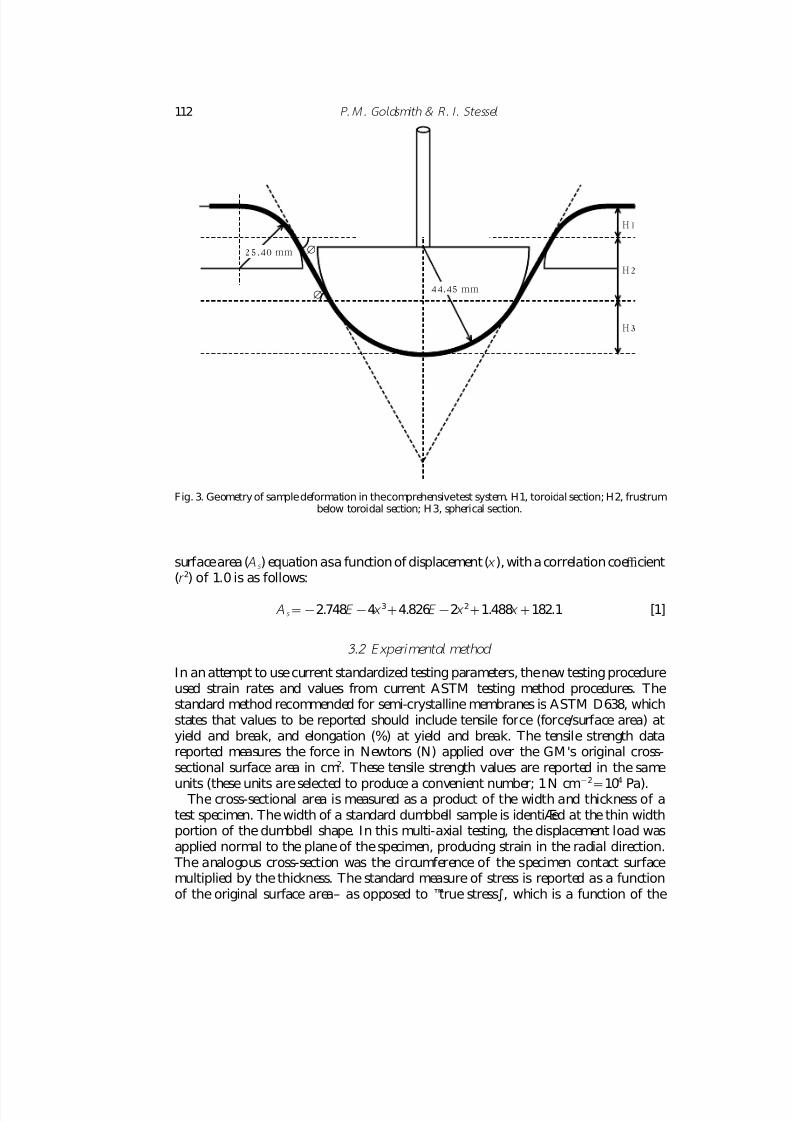
The equation corresponding to the geometry of this system was developed usinggeometric equations and relationships to calculate surface area as a function of displacement. An illustration of thegeometric relationships is presented in Fig. 3. The
formula was developed by initially separating thedisplacement surface area into threedistinct geometric functions; the toroidal section (H1), the frustrum below it (H2), andthespherical section (H3). Combiningthethree separatesurfaces resulted in theoverallsurface area as a function of displacement, which was calculated as a function of onedegreeincrementsof thedepartureangle.A polynomial curve-fittingalgorithmproduceda final equation for area, A , as a function of displacement, x . The polynomial waschosen because it fitted the algorithm extremely well, and allowed easy spreadsheettransformation of piston head displacement into sample surface area. The resulting
7/21/2019 Goldsmith 1996
http://slidepdf.com/reader/full/goldsmith-1996 8/20
P. M . Goldsmith & R. I . Stessel 112
25.40 mm
44.45 mm
∅
∅
H 3
H 2
H 1
Fig. 3. Geometry of sampledeformation in thecomprehensivetest system. H1, toroidal section; H2, frustrumbelow toroidal section; H 3, spherical section.
surfacearea (A s ) equation asa function of displacement (x ), with a correlation coefficient(r 2) of 1.0 is as follows:
A s =−2.748E −4x 3+4.826E −2x 2+1.488x +182.1 [1]
3.2 E xperimental method
In an attempt to usecurrent standardized testing parameters, thenew testing procedureused strain rates and values from current ASTM testing method procedures. Thestandard method recommended for semi-crystalline membranes is ASTM D638, whichstates that values to be reported should include tensile force (force/surface area) atyield and break, and elongation (%) at yield and break. The tensile strength datareported measures the force in Newtons (N) applied over the GM ’s original cross-sectional surface area in cm2. These tensile strength values are reported in the same
units (these units are selected to produce a convenient number; 1N cm−2
=104
Pa). The cross-sectional area is measured as a product of the width and thickness of a
test specimen. The width of a standard dumbbell sample is identified at the thin widthportion of the dumbbell shape. In this multi-axial testing, the displacement load wasapplied normal to the plane of the specimen, producing strain in the radial direction.
The analogous cross-section was the circumference of the specimen contact surfacemultiplied by the thickness. The standard measure of stress is reported as a functionof the original surface area— as opposed to “true stress”, which is a function of the
7/21/2019 Goldsmith 1996
http://slidepdf.com/reader/full/goldsmith-1996 9/20
M ulti- axi al testi ng of geomembranes 113
resultant surface area. The strain or elongation (E ) is measured as the percentagechangein length divided by thesamples’ original length. A relationship between surfacearea (m2) and elongation (%) was developed to reflect the application of force in thistest system. To obtain a representative elongation value, the strain was calculated asthe square root of the change in surface area divided by the square root of the originalsurfacearea, resulting in a unit length relationship (m/m) that moreaccurately expressedstrain. These values were then reported in a standard stress/strain graph; stress (y-axis)vs. strain (x-axis).
To test thecreep behaviour of a GM , a load was applied and held constant (constantstress) while measuring strain as a function of time. The creep compliance was thenmeasured asthestrain:stress ratio. Standard creep experiments report theresults of thestrain (deformation) as a function of time.
Relaxation tests determine the strength response of a membrane to displacement. This type of testing is accomplished by displacing the membrane to a set deformationand allowing it to relax at that position over time. The objective is to measure thechange in load or stress as a function of time. An ideal elastic will not relax. This is
one of a number of physical parameters helping to quantify material characteristics; itdoes not imply that a material exhibiting plastic deformation is poorly suited to barrierapplications. However, retention of a certain degree of elasticity will help the materialdistribute stress in the event of a subsidence, potentially spreading necking normal tothe plane.
Cyclic testing was seen as important for three reasons: (i) live loads will be presentduring placement of waste in a landfill; (ii) live loads will always be present on a GMused to underlay a treatment or transfer facility, due to theoperation for vehicles andequipment; and (iii) cyclic testing might rapidly elicit data concerning the elasticbehaviour of the material. To test adequately the behaviour of the GM under liveloading, cyclic testing can be implemented where stress () is applied in a sinusoidaloscillation varying with time (t ) as follows:
=0 sint [2]
where 0 is the maximum stress and is the angular frequency (2 frequency). Themeasurement of a response to a periodic forces shows that stress and strain arenot inphase. The strain lags behind the stress by a phase angle. A visco-elastic materialdissipates energy when under cyclic loading because the material is not ideally elastic(Ritchie 1965).
These tests were conducted for comparison with published data and to obtain newinformation that thetesting system was able to provide.
4. Results and discussion
This system was used to develop a group of standard strength parameters for testing
HDPE which is the most popular GM in use for wastelining applications. As this wasa new test development, it remained important to compare results to published datawhere possible.
4.1 I nitial observations
During testing of the apparatus’ performance, a variety of interesting phenomenaoccurred. The first interesting failure mechanism that manifested during apparatus
7/21/2019 Goldsmith 1996
http://slidepdf.com/reader/full/goldsmith-1996 10/20
P. M . Goldsmith & R. I . Stessel 114
testing was recurring shearing hoop failure discussed above. T he liner material wouldtear or puncture beyond a certain deformation. Although this failure mechanism wasrejected, as it resulted from the apparatus not producing the smooth deformationsshown in Fig. 3, it may be occurring in the field. There is very little informationavailabledescribingthefailuremechanisms involved in subsidenceunder solid materialsin the field. Questions include: Does the liner shear or gradually relieve strain wheninvolved in a subsidence? Are subsidences sudden or gradual? Are subsidence areastypically sharp-edged or gently-rounded?
Photographic evidence from cells under preparation indicates that the compressiveforce of the landfill may actually shear the membrane at the edges of a subsidence.
Therefore, this shear type failure may be characteristic of some types of subsidence.M ore information and research is needed to evaluate the significance of this failuremechanism. Should it proveto bean important mechanism, experienceobtained duringdevelopment indicated that thetest protocol could bemodified to producesuch failures.
The next interesting phenomenon that was noticed was the grain impressions madein the liner material from the sand when workingunder fairly low loads. Thesand was
actually imbedded into theliner material to cause an impression and slight puncturingeff ect. If sand is themost protective material currently used, it would be interesting toevaluate the eff ects of additional granular media on the liner material. Could theprotective layer actually be responsible for a failure mechanism in liner systems undercompressive load?
Thelast observation concerned theactual quality of material. When a small abrasionwas noticed on the liner material before testing, the result would be a failure atthe point of abrasion. Consistently throughout the apparatus and GM testing, thisphenomenon was noted. Specimen preparation guidelines for future use with thisequipment specifically required the avoidance of such abrasions to allow statistically-sound testing results. These were very small gouges that would certainly pass fieldvisual inspection. If such asmall abrasion caused such problemsin thetestinglaboratory,
onemust question thetypes and number of abrasions caused during installation. Thismaysubstantially aff ecttheoverall performanceof theliner, perhapsrequiring enhancedcare during liner installation.
4.2 Evaluation of displacement r ate
Displacement rateswereevaluated aspart of thetestsystemdevelopment. Two purposeswere served: one was to evaluate the performance of the system as compared withsimilar studies done on other devices; the other was to determine suitable strain ratesto apply in further testing, if the strain rates diff ered substantially from those reportedin theliterature.
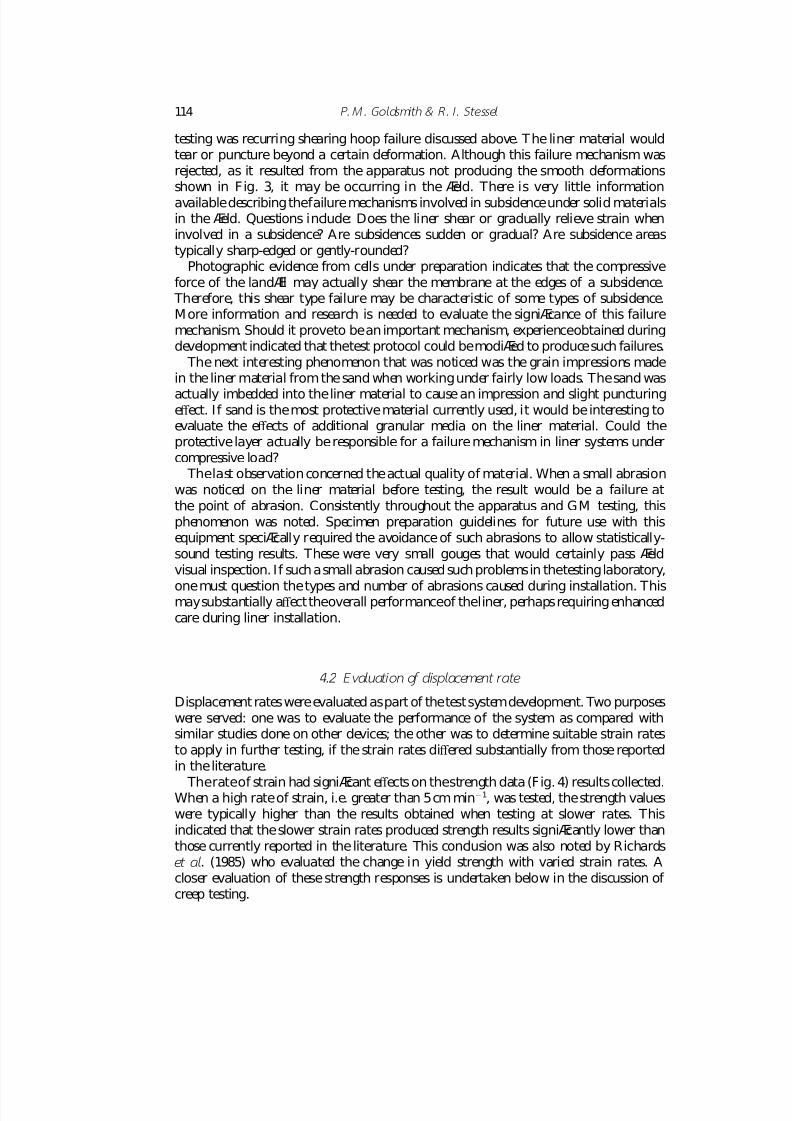
Therateof strain had significant eff ects on thestrength data (Fig. 4) resultscollected.When a high rateof strain, i.e. greater than 5cm min−1, was tested, thestrength valueswere typically higher than the results obtained when testing at slower rates. Thisindicated that theslower strain rates produced strength results significantly lower thanthose currently reported in the literature. This conclusion was also noted by Richardset al . (1985) who evaluated the change in yield strength with varied strain rates. Acloser evaluation of these strength responses is undertaken below in the discussion of creep testing.
7/21/2019 Goldsmith 1996
http://slidepdf.com/reader/full/goldsmith-1996 11/20
M ulti- axi al testi ng of geomembranes 115
2000
St ra in (%)
1000
S t r e s s ( N c m – 2 )
0 15050 100
Fig. 4. Stress vs. strain for various strain rates. Β, 2 in min−1; Φ, 20 in min−1;Α, 0.2 in min−1.
5000
St ra in (%)
1000
S t r e s s ( N c m – 2 )
3000
2000
0
4000
1206020 4 0 80 100
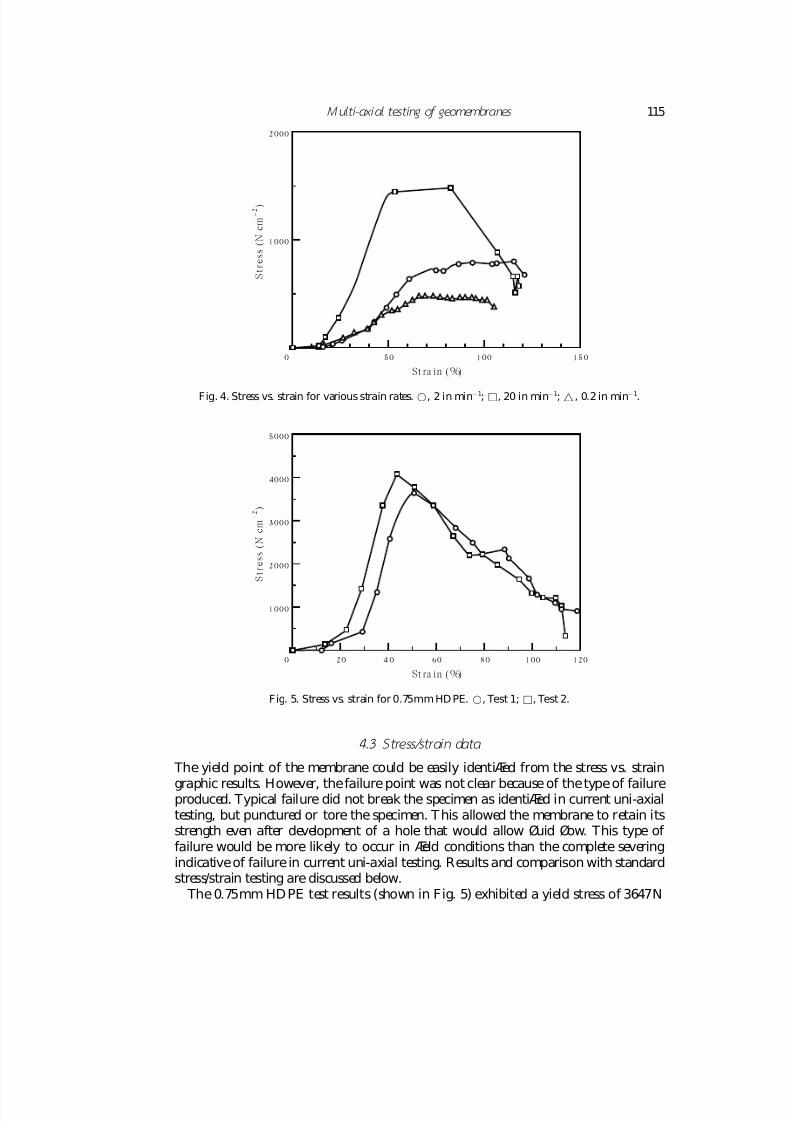
Fig. 5. Stress vs. strain for 0.75mm HD PE. Β, Test 1; Φ, Test 2.
4.3 Stress/str ain data
The yield point of the membrane could be easily identified from the stress vs. strain
graphic results. However, thefailure point was not clear because of thetype of failureproduced. Typical failure did not break the specimen as identified in current uni-axialtesting, but punctured or tore the specimen. T his allowed the membrane to retain itsstrength even after development of a hole that would allow fluid flow. This type of failure would be more likely to occur in field conditions than the complete severingindicativeof failure in current uni-axial testing. Results and comparison with standardstress/strain testing are discussed below.
The 0.75mm HD PE test results (shown in Fig. 5) exhibited a yield stress of 3647N
7/21/2019 Goldsmith 1996
http://slidepdf.com/reader/full/goldsmith-1996 12/20
P. M . Goldsmith & R. I . Stessel 116
2000
St ra in (%)
1000
S t r e s s ( N c m – 2 )
0 1206020 4 0 80 100
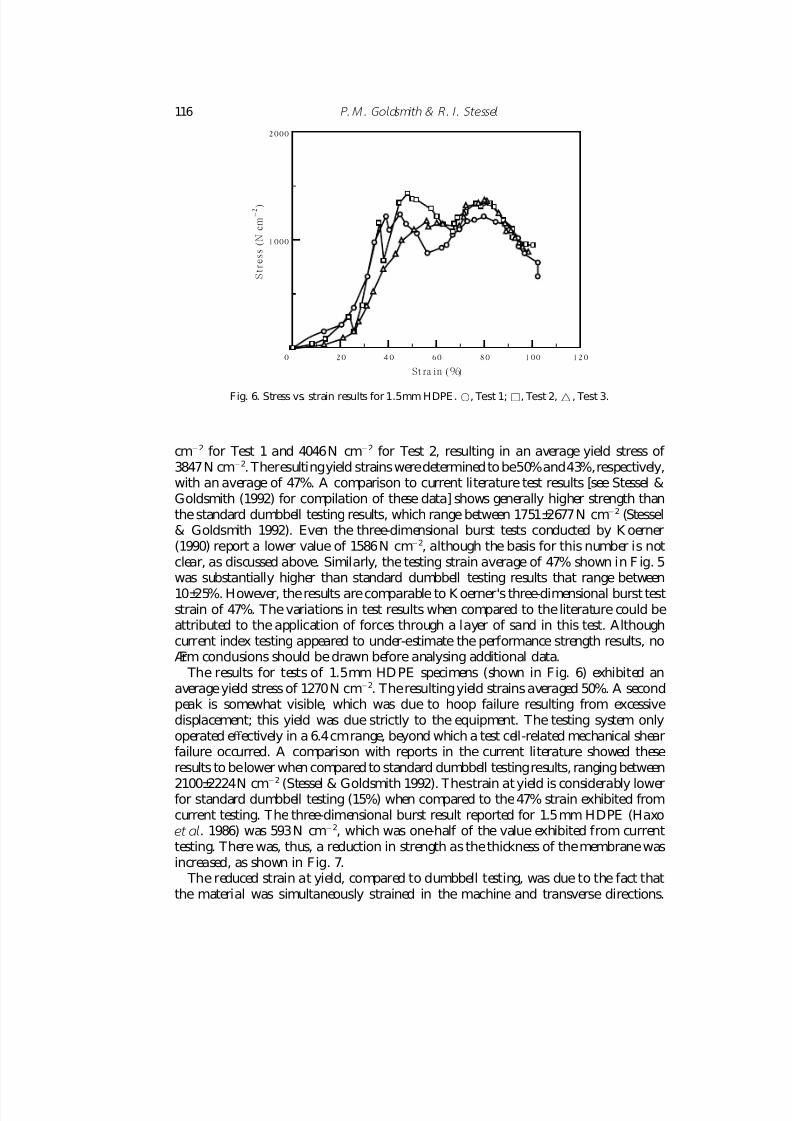
Fig. 6. Stress vs. strain results for 1.5mm HDPE . Β, Test 1;Φ, Test 2, Α , Test 3.
cm−2 for Test 1 and 4046N cm−2 for Test 2, resulting in an average yield stress of 3847N cm−2. Theresultingyield strainsweredeterminedto be50%and43%,respectively,with an average of 47%. A comparison to current literature test results [see Stessel &Goldsmith (1992) for compilation of these data] shows generally higher strength thanthe standard dumbbell testing results, which range between 1751–2677N cm−2 (Stessel& Goldsmith 1992). Even the three-dimensional burst tests conducted by K oerner(1990) report a lower value of 1586N cm−2, although the basis for this number is notclear, as discussed above. Similarly, the testing strain average of 47% shown in F ig. 5was substantially higher than standard dumbbell testing results that range between
10–25%. However, theresults arecomparable to K oerner’s three-dimensional burst teststrain of 47%. The variations in test results when compared to the literature could beattributed to the application of forces through a layer of sand in this test. Althoughcurrent index testing appeared to under-estimate the performance strength results, nofirm conclusions should be drawn before analysing additional data.
The results for tests of 1.5mm HD PE specimens (shown in Fig. 6) exhibited anaverageyield stress of 1270N cm−2. Theresultingyield strains averaged 50%. A secondpeak is somewhat visible, which was due to hoop failure resulting from excessivedisplacement; this yield was due strictly to the equipment. The testing system onlyoperated eff ectively in a 6.4cmrange, beyond which a test cell-related mechanical shearfailure occurred. A comparison with reports in the current literature showed theseresults to belower when compared to standard dumbbell testingresults, ranging between
2100–2224N cm−2
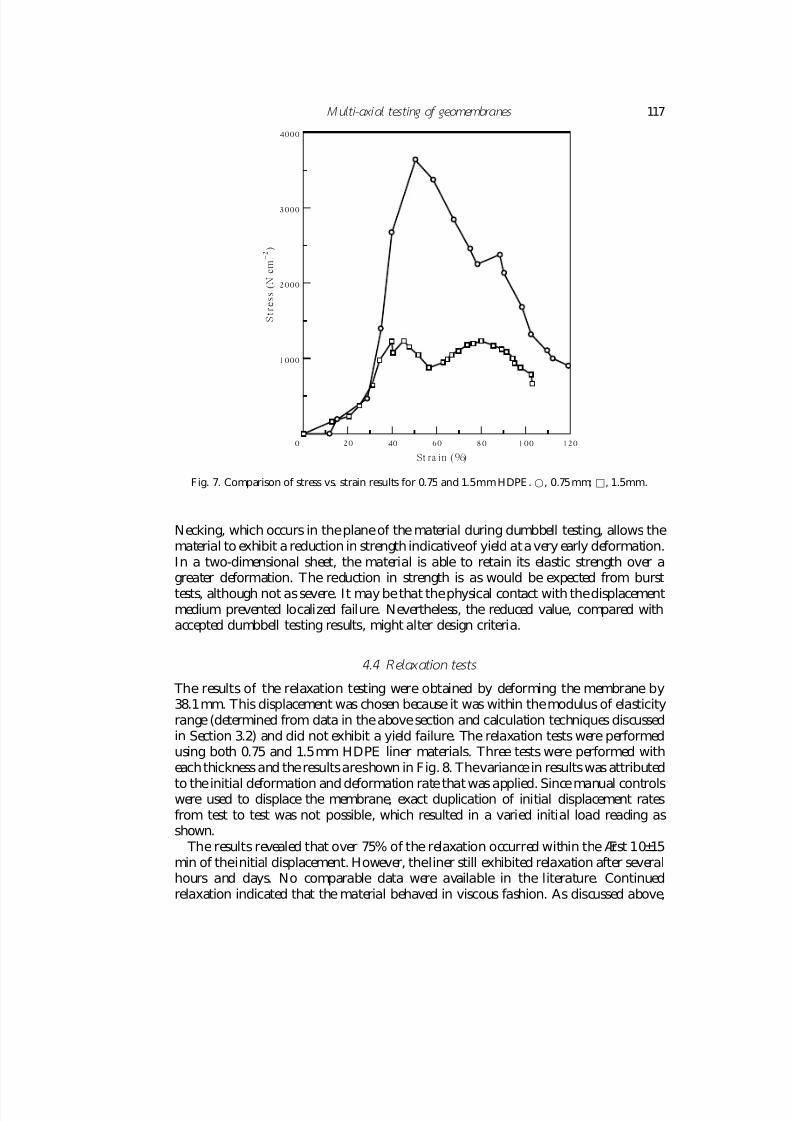
(Stessel & Goldsmith 1992). Thestrain at yield is considerably lowerfor standard dumbbell testing (15%) when compared to the47% strain exhibited fromcurrent testing. The three-dimensional burst result reported for 1.5mm HDPE (Haxoet al . 1986) was 593N cm−2, which was one-half of the value exhibited from currenttesting. There was, thus, a reduction in strength as thethickness of themembranewasincreased, as shown in Fig. 7.
The reduced strain at yield, compared to dumbbell testing, was due to the fact thatthe material was simultaneously strained in the machine and transverse directions.
7/21/2019 Goldsmith 1996
http://slidepdf.com/reader/full/goldsmith-1996 13/20
M ulti- axi al testi ng of geomembranes 117
120
4000
St ra in (%)
1000
6020
S t r e s s ( N c m – 2 )
40
3000
2000
80 1000
Fig. 7. Comparison of stress vs. strain results for 0.75 and 1.5mm HDPE . Β, 0.75mm; Φ, 1.5mm.
Necking, which occurs in theplaneof the material during dumbbell testing, allows thematerial to exhibit a reduction in strength indicativeof yield ata very early deformation.In a two-dimensional sheet, the material is able to retain its elastic strength over agreater deformation. The reduction in strength is as would be expected from burst
tests, although not assevere. It may bethat thephysical contact with thedisplacementmedium prevented localized failure. Nevertheless, the reduced value, compared withaccepted dumbbell testing results, might alter design criteria.
4.4 Relaxati on tests
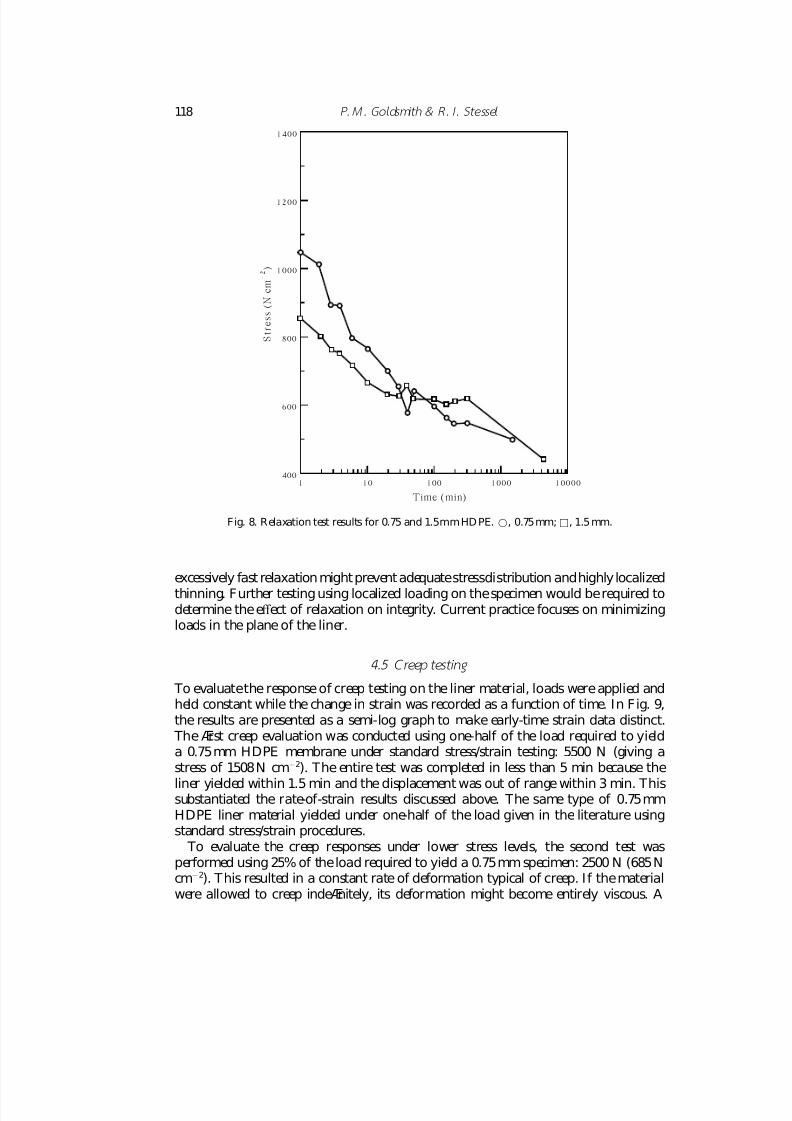
The results of the relaxation testing were obtained by deforming the membrane by38.1mm. This displacement was chosen because it was within themodulus of elasticityrange (determined from data in theabovesection and calculation techniques discussedin Section 3.2) and did not exhibit a yield failure. The relaxation tests were performedusing both 0.75 and 1.5mm HDPE liner materials. Three tests were performed witheachthickness and theresultsareshown in Fig. 8. Thevariancein resultswas attributed
to theinitial deformation and deformation ratethat was applied. Sincemanual controlswere used to displace the membrane, exact duplication of initial displacement ratesfrom test to test was not possible, which resulted in a varied initial load reading asshown.
The results revealed that over 75% of the relaxation occurred within the first 10–15min of theinitial displacement. However, theliner still exhibited relaxation after severalhours and days. No comparable data were available in the literature. Continuedrelaxation indicated that the material behaved in viscous fashion. As discussed above,
7/21/2019 Goldsmith 1996
http://slidepdf.com/reader/full/goldsmith-1996 14/20
P. M . Goldsmith & R. I . Stessel 118
1 10000
1400
Time (min)
800
600
100010
S t r e s s ( N c m – 2 )
400100
1200
1000
Fig. 8. Relaxation test results for 0.75 and 1.5mm HD PE. Β, 0.75mm;Φ, 1.5 mm.
excessively fast relaxation might prevent adequatestressdistribution andhighly localized
thinning. Further testing using localized loading on thespecimen would berequired todetermine the eff ect of relaxation on integrity. Current practice focuses on minimizingloads in the plane of the liner.
4.5 Cr eep t esti ng
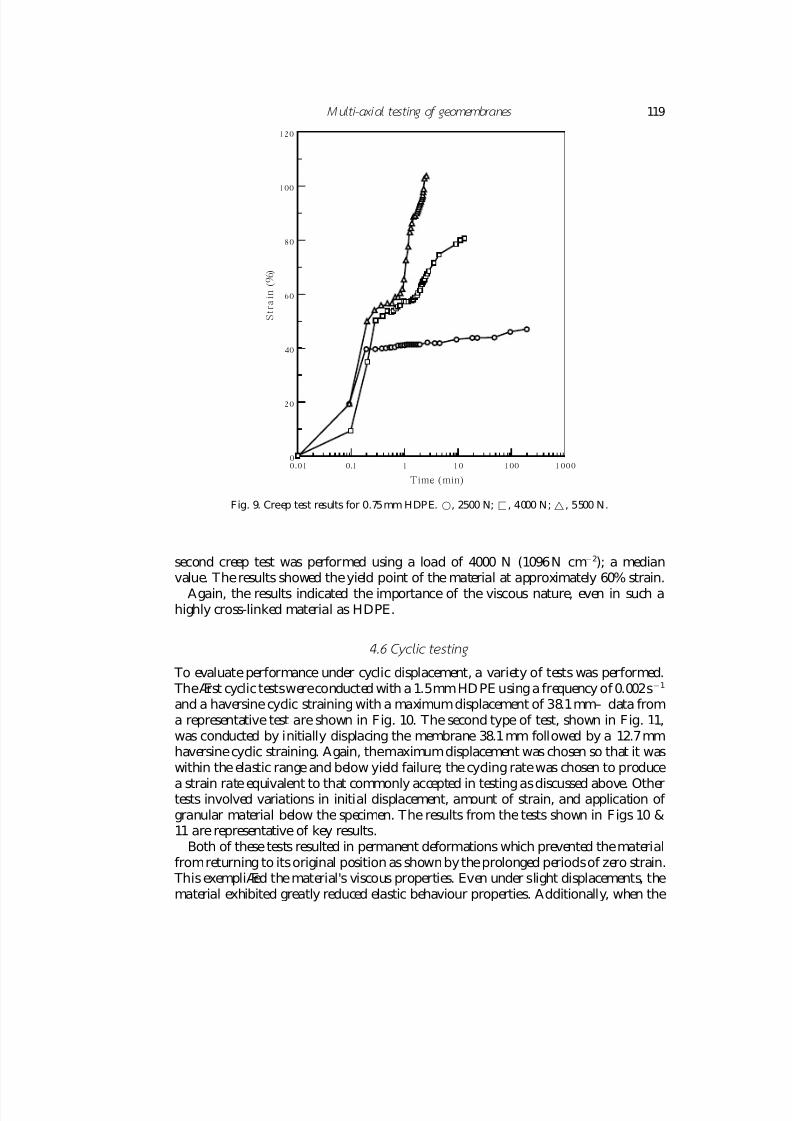
To evaluatethe response of creep testing on the liner material, loads were applied andheld constant while the change in strain was recorded as a function of time. In Fig. 9,the results are presented as a semi-log graph to make early-time strain data distinct.
The first creep evaluation was conducted using one-half of the load required to yielda 0.75mm HDPE membrane under standard stress/strain testing: 5500 N (giving astress of 1508N cm−2). The entire test was completed in less than 5 min because the
liner yielded within 1.5 min and the displacement was out of range within 3 min. Thissubstantiated the rate-of-strain results discussed above. The same type of 0.75mmHDPE liner material yielded under one-half of the load given in the literature usingstandard stress/strain procedures.
To evaluate the creep responses under lower stress levels, the second test wasperformed using 25% of theload required to yield a 0.75mm specimen: 2500 N (685Ncm−2). This resulted in a constant rate of deformation typical of creep. I f thematerialwere allowed to creep indefinitely, its deformation might become entirely viscous. A
7/21/2019 Goldsmith 1996
http://slidepdf.com/reader/full/goldsmith-1996 15/20
M ulti- axi al testi ng of geomembranes 119
0.01 1000
120
Time (min)
80
60
40
20
1 10
S t r a i n ( % )
100
01000.1
Fig. 9. Creep test results for 0.75mm HDPE. Β, 2500 N; Φ, 4000 N;Α, 5500 N.
second creep test was performed using a load of 4000 N (1096N cm−2); a medianvalue. Theresults showed theyield point of the material at approximately 60% strain.
Again, the results indicated the importance of the viscous nature, even in such ahighly cross-linked material as HDPE.
4.6 Cyclic t esti ng
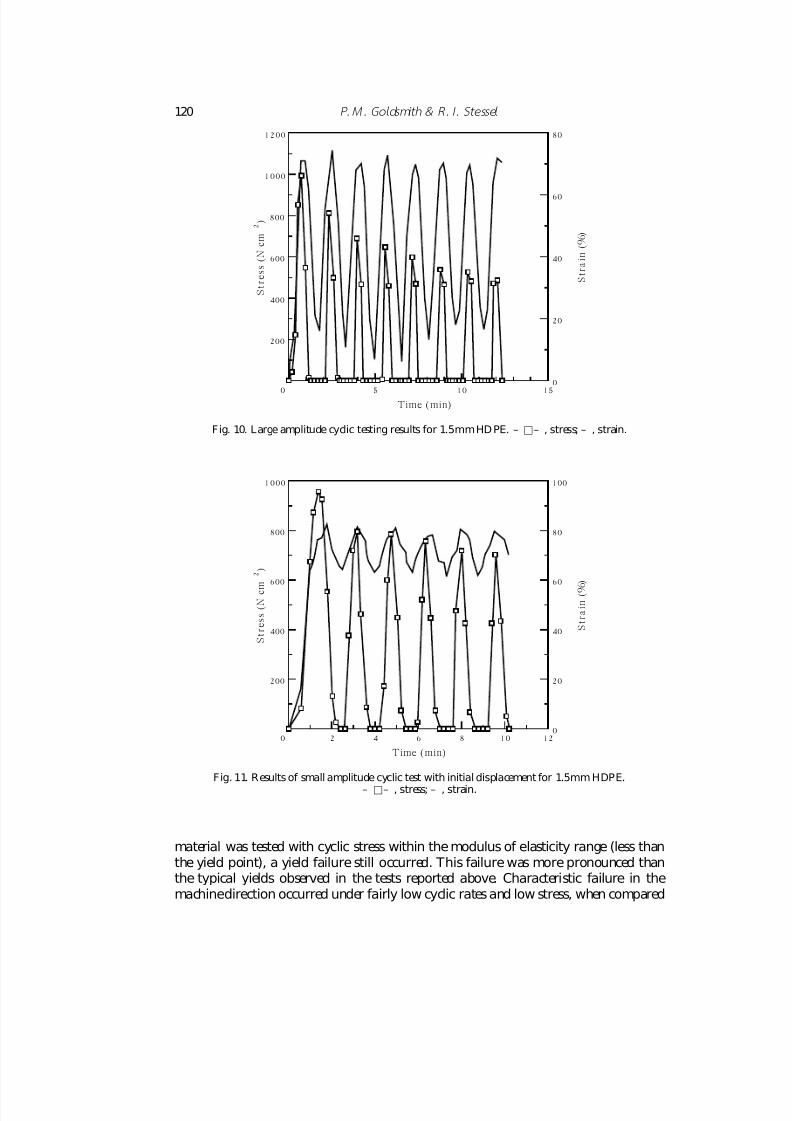
To evaluate performance under cyclic displacement, a variety of tests was performed. Thefirst cyclictestswereconducted with a 1.5mmHD PE using a frequency of 0.002s−1
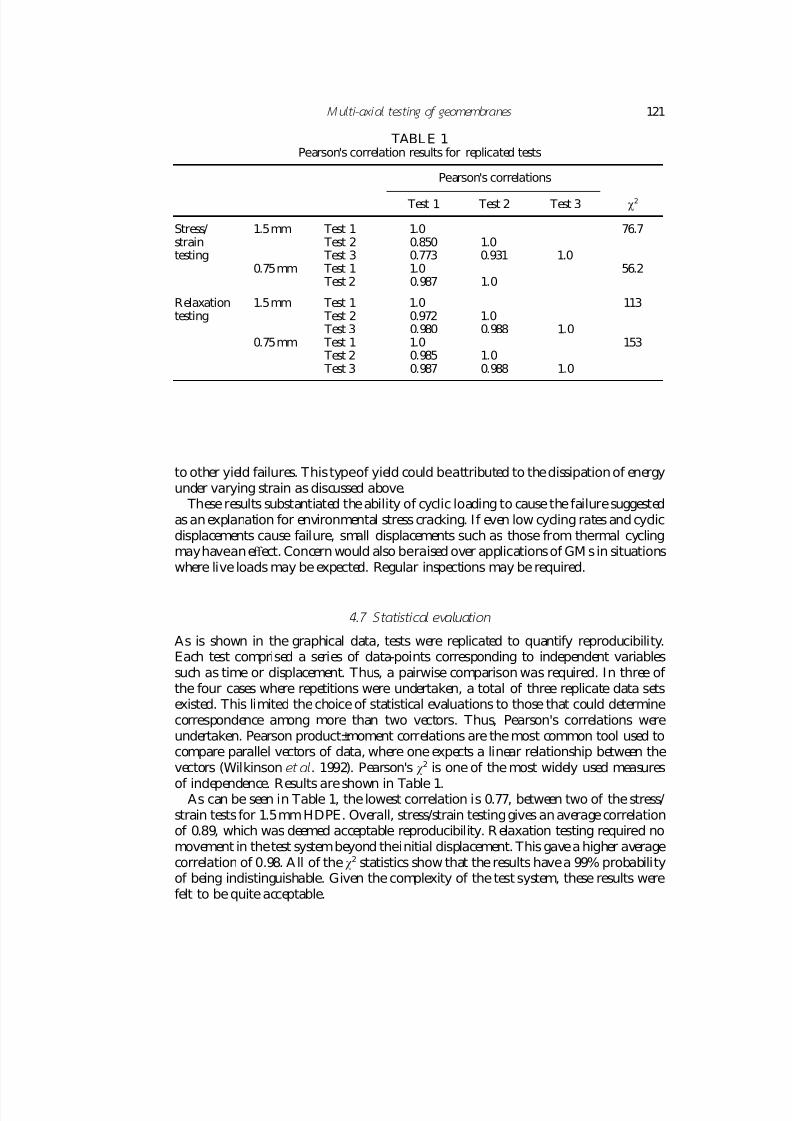
and a haversine cyclic straining with a maximumdisplacement of 38.1mm— data froma representative test are shown in Fig. 10. The second type of test, shown in Fig. 11,was conducted by initially displacing the membrane 38.1mm followed by a 12.7mmhaversinecyclic straining. Again, themaximumdisplacement was chosen so that it waswithin the elastic range and below yield failure; the cycling ratewas chosen to produce
a strain rate equivalent to that commonly accepted in testing asdiscussed above. Othertests involved variations in initial displacement, amount of strain, and application of granular material below the specimen. The results from the tests shown in Figs 10 &11 are representative of key results.
Both of these tests resulted in permanent deformations which prevented thematerialfromreturning to itsoriginal position as shownby theprolonged periodsof zero strain.
This exemplified the material’s viscous properties. Even under slight displacements, thematerial exhibited greatly reduced elastic behaviour properties. Additionally, when the
7/21/2019 Goldsmith 1996
http://slidepdf.com/reader/full/goldsmith-1996 16/20
P. M . Goldsmith & R. I . Stessel 120
15
1200
Time (min)
S t r e s s ( N c m – 2 ) 800
600
400
200
5 100
80
0
60
40
20
S t r a i n ( % )
1000
Fig. 10. L arge amplitude cyclic testing results for 1.5mm HD PE. — Φ— , stress; — , strain.
12
1000
Time (min)
S t r e s s ( N c m
– 2 )
800
600
400
200
2 4 6 8 100
100
0
80
60
40
20
S t r a i n ( %
)
Fig. 11. Results of small amplitude cyclic test with initial displacement for 1.5mm HDPE.— Φ— , stress; — , strain.
material was tested with cyclic stress within the modulus of elasticity range (less thanthe yield point), a yield failure still occurred. This failure was more pronounced thanthe typical yields observed in the tests reported above. Characteristic failure in themachinedirection occurred under fairly low cyclic rates and low stress, when compared
7/21/2019 Goldsmith 1996
http://slidepdf.com/reader/full/goldsmith-1996 17/20
M ulti- axi al testi ng of geomembranes 121
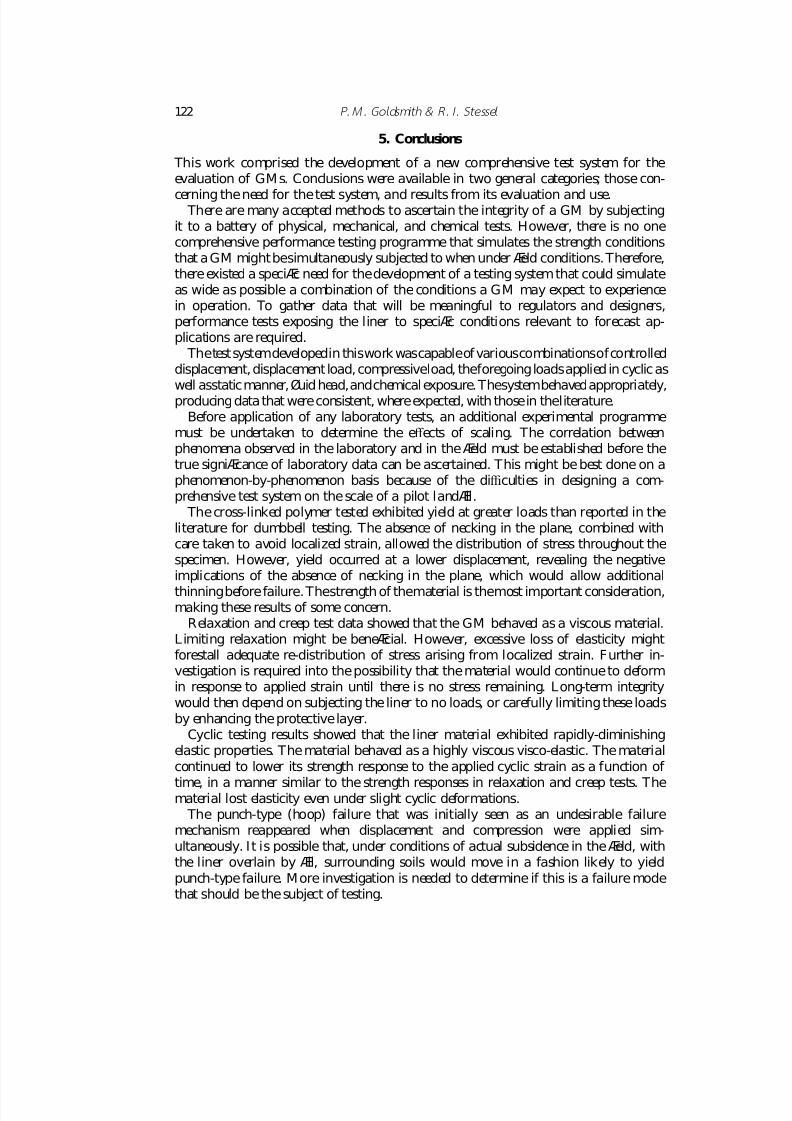
TABL E 1Pearson’s correlation results for replicated tests
Pearson’s correlations
Test 1 Test 2 Test 3 2
Stress/ 1.5mm Test 1 1.0 76.7strain Test 2 0.850 1.0testing Test 3 0.773 0.931 1.0
0.75mm Test 1 1.0 56.2 Test 2 0.987 1.0
Relaxation 1.5mm Test 1 1.0 113testing Test 2 0.972 1.0
Test 3 0.980 0.988 1.00.75mm Test 1 1.0 153
Test 2 0.985 1.0 Test 3 0.987 0.988 1.0
to other yield failures. Thistypeof yield could beattributed to thedissipation of energyunder varying strain as discussed above.
These results substantiated the ability of cyclic loading to cause the failuresuggestedas an explanation for environmental stress cracking. If even low cycling rates and cyclicdisplacements cause failure, small displacements such as those from thermal cyclingmayhavean eff ect. Concern would also beraised over applicationsof GM s in situationswhere live loads may be expected. Regular inspections may be required.
4.7 St atisti cal evaluati on
As is shown in the graphical data, tests were replicated to quantify reproducibility.Each test comprised a series of data-points corresponding to independent variablessuch as time or displacement. Thus, a pairwise comparison was required. In three of the four cases where repetitions were undertaken, a total of three replicate data setsexisted. This limited the choice of statistical evaluations to those that could determinecorrespondence among more than two vectors. Thus, Pearson’s correlations wereundertaken. Pearson product–moment correlations are the most common tool used tocompare parallel vectors of data, where one expects a linear relationship between thevectors (Wilkinson et al . 1992). Pearson’s
2 is one of the most widely used measures
of independence. Results are shown in Table 1.As can be seen in Table 1, the lowest correlation is 0.77, between two of the stress/
strain tests for 1.5mm HDPE. Overall, stress/strain testinggives an average correlationof 0.89, which was deemed acceptable reproducibility. R elaxation testing required nomovement in thetest systembeyond theinitial displacement. This gavea higher averagecorrelation of 0.98. A ll of the
2 statistics show that the results havea 99% probabilityof being indistinguishable. Given the complexity of the test system, these results werefelt to be quite acceptable.
7/21/2019 Goldsmith 1996
http://slidepdf.com/reader/full/goldsmith-1996 18/20
P. M . Goldsmith & R. I . Stessel 122
5. Conclusions
This work comprised the development of a new comprehensive test system for theevaluation of GM s. Conclusions were available in two general categories; those con-
cerning the need for thetest system, and results from its evaluation and use. There are many accepted methods to ascertain the integrity of a GM by subjecting
it to a battery of physical, mechanical, and chemical tests. However, there is no onecomprehensive performance testing programme that simulates the strength conditionsthat a GM mightbesimultaneously subjected to when under field conditions. Therefore,there existed a specific need for thedevelopment of a testing system that could simulateas wide as possible a combination of the conditions a GM may expect to experiencein operation. To gather data that will be meaningful to regulators and designers,performance tests exposing the liner to specific conditions relevant to forecast ap-plications are required.
Thetestsystemdevelopedin thiswork wascapableof variouscombinationsofcontrolleddisplacement, displacement load, compressiveload, theforegoingloadsapplied in cyclic aswell asstaticmanner, fluid head,andchemical exposure. Thesystembehavedappropriately,producing data that wereconsistent, whereexpected, with thosein theliterature.
Before application of any laboratory tests, an additional experimental programmemust be undertaken to determine the eff ects of scaling. The correlation betweenphenomena observed in the laboratory and in the field must be established before thetrue significance of laboratory data can be ascertained. This might be best done on aphenomenon-by-phenomenon basis because of the difficulties in designing a com-prehensive test system on the scale of a pilot landfill.
The cross-linked polymer tested exhibited yield at greater loads than reported in theliterature for dumbbell testing. The absence of necking in the plane, combined withcare taken to avoid localized strain, allowed the distribution of stress throughout thespecimen. However, yield occurred at a lower displacement, revealing the negativeimplications of the absence of necking in the plane, which would allow additional
thinningbeforefailure. Thestrength of thematerial is themost important consideration,making these results of some concern.
Relaxation and creep test data showed that the GM behaved as a viscous material.L imiting relaxation might be beneficial. However, excessive loss of elasticity mightforestall adequate re-distribution of stress arising from localized strain. Further in-vestigation is required into the possibility that the material would continue to deformin response to applied strain until there is no stress remaining. L ong-term integritywould then depend on subjecting the liner to no loads, or carefully limiting these loadsby enhancing the protectivelayer.
Cyclic testing results showed that the liner material exhibited rapidly-diminishingelastic properties. The material behaved as a highly viscous visco-elastic. The materialcontinued to lower its strength response to the applied cyclic strain as a function of
time, in a manner similar to the strength responses in relaxation and creep tests. Thematerial lost elasticity even under slight cyclic deformations.
The punch-type (hoop) failure that was initially seen as an undesirable failuremechanism reappeared when displacement and compression were applied sim-ultaneously. I t is possible that, under conditions of actual subsidence in the field, withthe liner overlain by fill, surrounding soils would move in a fashion likely to yieldpunch-type failure. M ore investigation is needed to determine if this is a failure modethat should be the subject of testing.
7/21/2019 Goldsmith 1996
http://slidepdf.com/reader/full/goldsmith-1996 19/20
M ulti- axi al testi ng of geomembranes 123
To determine accurately the acceptability of a GM for a specific use, a chemicalcompatibility test is required. Current testing is lacking in the evaluation of thiscompatibility testing because the material is not simultaneously stressed while underchemical attack. Theproposed test system will allow evaluation of strength whileunderchemical attack. This could yield very diff erent results from separate exposure andstrength testing. Data from this test system could be helpful in ensuring the integrityof this most critical component of barriers to migration.
Acknowledgements
This work was supported by the Florida Center for Solid and Hazardous WasteM anagement.
References
Anton, H. (1984) Calculus with Analytical Geometry. N ew Y ork, N Y, U.S.A.: J ohn Wiley &
Sons.ASTM (1990) Annual Book of AST M Standards. Philadelphia, PA, U.S.A.: American Society
for Testing and M aterials.Fayoux, D. & L oudiere, D. (1984) The Behavior of Flexible M embrane L iners in Relation to
Soil. In Proceedings of the I nternational C onference on Fl exi ble M embrane L iners. St. Paul,M N, U.S.A.: Industrial Fabrics Association International, pp. 175–180.
Hansen, L . A. & Deatherage, J . D. (1987) Compression Testingof GeomembraneSoil Interfaces.I n Geotechnical A spects of H eap L each D esign (van Zyl & Dirk, eds). L ittleton, CO, U.S.A.:Society of M ining Engineers, Inc.
Haxo, H. E., J r. & Nelson, N. A. (1984) Factors in the Durability of Polymeric M embraneL iners. In Pr oceedings of t he Int ernati onal Conf erence on Flex ibl e M embrane L iners. St. Paul,M N, U.S.A.: Industrial Fabrics Association International, pp. 287–292.
Haxo, H. E., Jr. et al . (1985) L iner M aterials for H azardous and Toxi c Wastes and M unicipal Solid Waste L eachate. Park Ridge, NJ , U.S.A.: Noyes Publications.
Haxo, H . E., J r., L ahey, T. P. & Rosenberg, M . L . (1986) F actors in A ssessing the C ompati bilit y
of Flexi ble M embrane L iners and W aste L iquids, E PA /68-03-3213. Cincinnati, OH, U.S.A.:U.S. EPA.
K oerner, R. M . (1990) Designing with Geosynthetics. Englewood Cliff s, NJ , U.S.A.: Prentice-Hall, Inc.
L andreth, R. E. (1990) ServiceL ife of Geosyntheticsin HazardousWasteM anagement Facilities.I n Geosynthetics; M icrostr ucture and Performance (I. D. Peggs ed.). ASTM STP 1076.Philadelphia, PA, U.S.A.: ASTM , pp. 26–33.
M cGown, A., Andrawes, K . Z. & K abir, M . N. (1982) L oad-Extension Testing of GeotextilesConfined in Soil. In Second International Conference on Geotextiles. St. Paul, M N, U .S.A.:I ndustrial Fabrics Association International, pp. 793–798.
M urphy, V. P. & K oerner, R. M . (1988) CBR strength (puncture) of geosynthetics. A S TM Geotechnical Testing Journal II, 167–172.
Richards, E. A ., Scott, D. & Chalaturnk, R . J . (1985) Cold Temperature Properties of F lexibleM embrane L iners. In Second Canadian Symposium on Geotextiles and Flexible M embrane L iners , Canadian Geotechnical Society, TheGeotechnical Society of Edmonton, Edmonton,
Alberta, Canada.Richardson, G. N. & K oerner, R . M . (1985) Geosynthetic D esign Guidance for H azardous Waste
L andfill Cells and Surf ace I mpoundments, EPA/ 600/S2-87/097 , U.S. EPA, Hazardous WasteEngineering L aboratory, Cincinnati, OH, U .S.A.
Ritchie, P. D ., ed. (1965) Physics of Plastics. L ondon, U .K .: Iliff e Books L td.Schwope, A. D., Lyman, W. J .,Bass, J . M . & Ong, J . H. (1983) Analysis of Flexible M embrane L iner
Chemical C ompati bilit y Tests. U .S. EPA M unicipal Environmental Research L aboratory,Cincinnati, OH, U.S.A.
Sharp, D. A. et al . (1984) Evaluation of L ife E xpectancy of Gundle H igh-Density Polyethylene
7/21/2019 Goldsmith 1996
http://slidepdf.com/reader/full/goldsmith-1996 20/20
P. M . Goldsmith & R. I . Stessel 124
( H DPE) L iner M aterial in C ontact with L eachate: R eport to Waste M anagement I nc. byBatelle Columbus L aboratories, Columbus, OH, U .S.A.
Steff en, H . (1984) R eport on Two D imensional Strain Stress Behaviour of Flexible M embraneL iners With and Without Friction. Proceedings of the I nternational C onference on Fl ex ible
M embrane L iners. St. Paul, M N, U .S.A.: I ndustrial F abrics Association International, pp.
181–185.Stessel, R. I. & Goldsmith, P. M . (1992) Geomembranetesting in wastemanagement. Journal of
the Air and Waste M anagement Association 42, 1178–1185.U.S. EPA M ethod 9090 , SW-846. Office of Solid Waste and Emergency Response, U.S. EPA ,
Washington, D.C., U.S.A.U.S. EPA (1983) L ining of Waste C ontainment and Di sposal Facilit ies , SW-870. Office of Solid
Waste, U .S. EPA, Washington, D .C., U.S.A.U.S. EPA (1985) A ssessment of Syntheti c M embrane Successes and F ail ures at Waste St orage and
Disposal Sites, EPA/600/S2-85/100. Cincinnati, OH, U.S.A.: U.S. EPA.U.S. EPA (1987) L ab Testing of Geosynthetics and Plastic P ipe for D ouble L iner Systems, E PA/
600/d-87/059. Cincinnati, OH, U.S.A.: U.S. EPA.U.S. EPA (1988) L ining of Waste Containment and O ther I mpoundment F acilit ies, EPA/600/2-88/
052. Cincinnati, OH, U.S.A.: U.S. EPA.Wilkinson, L . W. et al . (1992) SYSTAT for Windows: Statistics, Version 5 edition. Evanston, I L ,
U.S.A. SY STAT Inc., Chapter 3.