Embed Size (px)
Citation preview

Page 1 of 28
Continuing GoldMine Education
February 2011
GoldMine Data and Analysis
By Justin Hill
For
The Marks Group
Page 2 of 28
A few notes:
For a complete and detailed table structure, please reference the GoldMine 9.0 Administrator’s
Manual, provided with your software. The schema information contained in this manual is not
all inclusive and is just enough “to get you going”.
GoldMine Version 9.01
Crystal 8.0
Page 3 of 28
GoldMine Tables Or… Can you relate, man?
How GoldMine Tables Relate
The GoldMine table structure has actually changed very little since the good old
Windows ’95 days. Some data types have been modified, some columns have been
added, but essentially it’s the same.
So let’s talk about the GoldMine tables. In this manual I will only be describing
the major tables and their relationships to each other. The “main” GoldMine tables are
thus:
- CONTACT1 : Primary company information
- CONTACT2 : Userdefined fields
- CONTHIST : Company history
- CAL : Calendar information
The first thing we must understand is that the “key” field in GoldMine is the
ACCOUNTNO. This is how the different tables link to one another. So, in each table we
will have an ACCOUNTNO field. There is more information on this in the “Crystal
Reports” section of the manual.
Pro Tip: A quick and easy way to “see” the columns available in a table (and learn their
true back-end names) is this:
- Go to the SQL Query Tool in GoldMine (Tools | SQL Query)
- Type in the following query : SELECT * FROM TABLENAME (where
TABLENAME is the name of a GoldMine table)
- Hit Query
- After the rows are returned you will be able to scroll left and right to navigate
through the columns available
Page 4 of 28
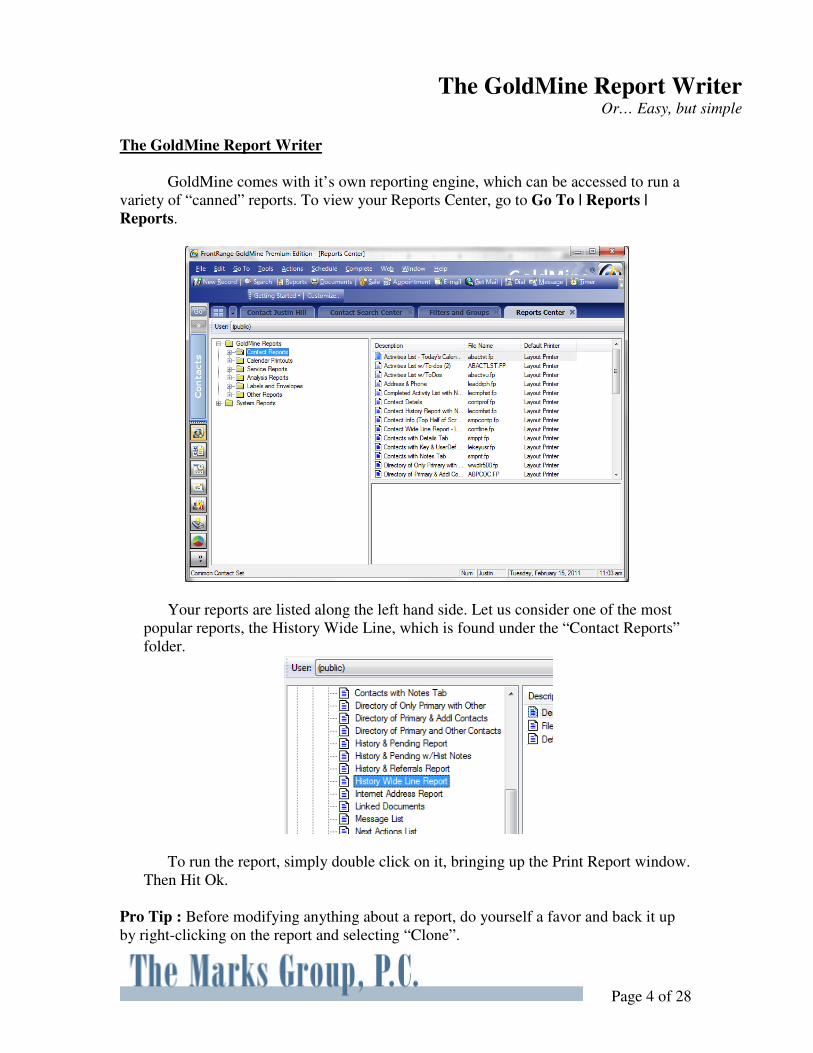
The GoldMine Report Writer Or… Easy, but simple
The GoldMine Report Writer
GoldMine comes with it’s own reporting engine, which can be accessed to run a
variety of “canned” reports. To view your Reports Center, go to Go To | Reports |
Reports.
Your reports are listed along the left hand side. Let us consider one of the most
popular reports, the History Wide Line, which is found under the “Contact Reports”
folder.
To run the report, simply double click on it, bringing up the Print Report window.
Then Hit Ok.
Pro Tip : Before modifying anything about a report, do yourself a favor and back it up
by right-clicking on the report and selecting “Clone”.
Page 5 of 28
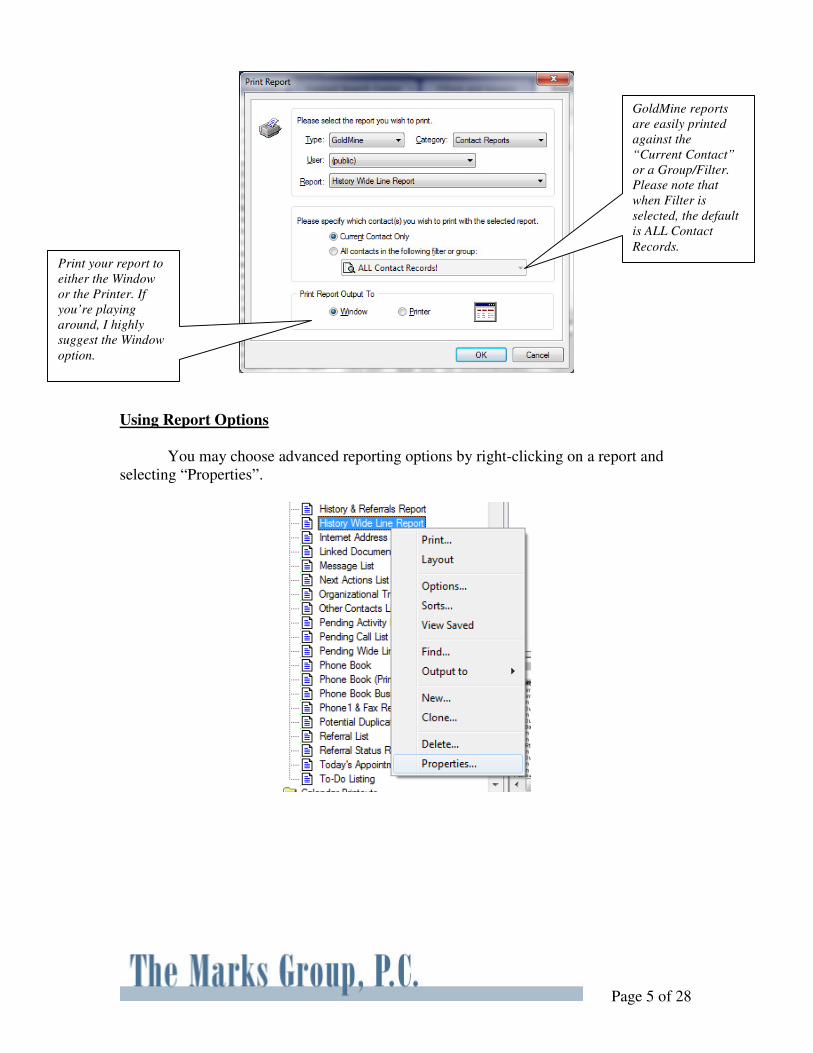
Using Report Options
You may choose advanced reporting options by right-clicking on a report and
selecting “Properties”.
Print your report to
either the Window
or the Printer. If
you’re playing
around, I highly
suggest the Window
option.
GoldMine reports
are easily printed
against the
“Current Contact”
or a Group/Filter.
Please note that
when Filter is
selected, the default
is ALL Contact
Records.
Page 6 of 28
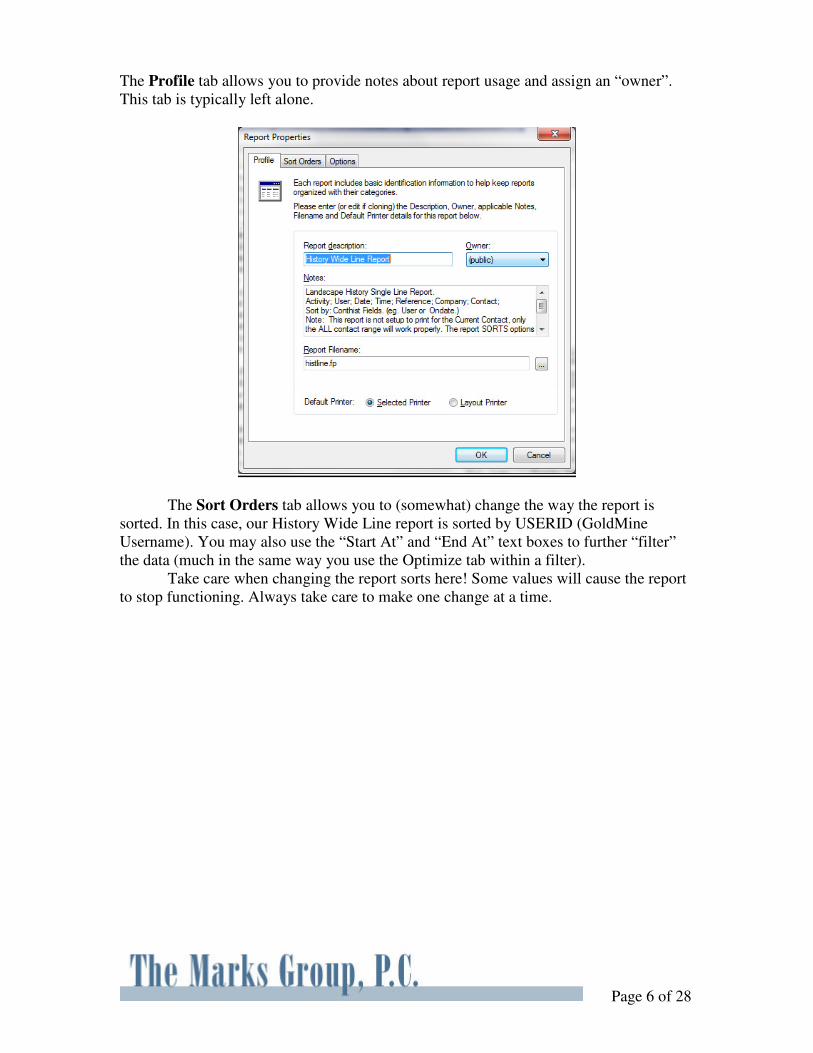
The Profile tab allows you to provide notes about report usage and assign an “owner”.
This tab is typically left alone.
The Sort Orders tab allows you to (somewhat) change the way the report is
sorted. In this case, our History Wide Line report is sorted by USERID (GoldMine
Username). You may also use the “Start At” and “End At” text boxes to further “filter”
the data (much in the same way you use the Optimize tab within a filter).
Take care when changing the report sorts here! Some values will cause the report
to stop functioning. Always take care to make one change at a time.
Page 7 of 28
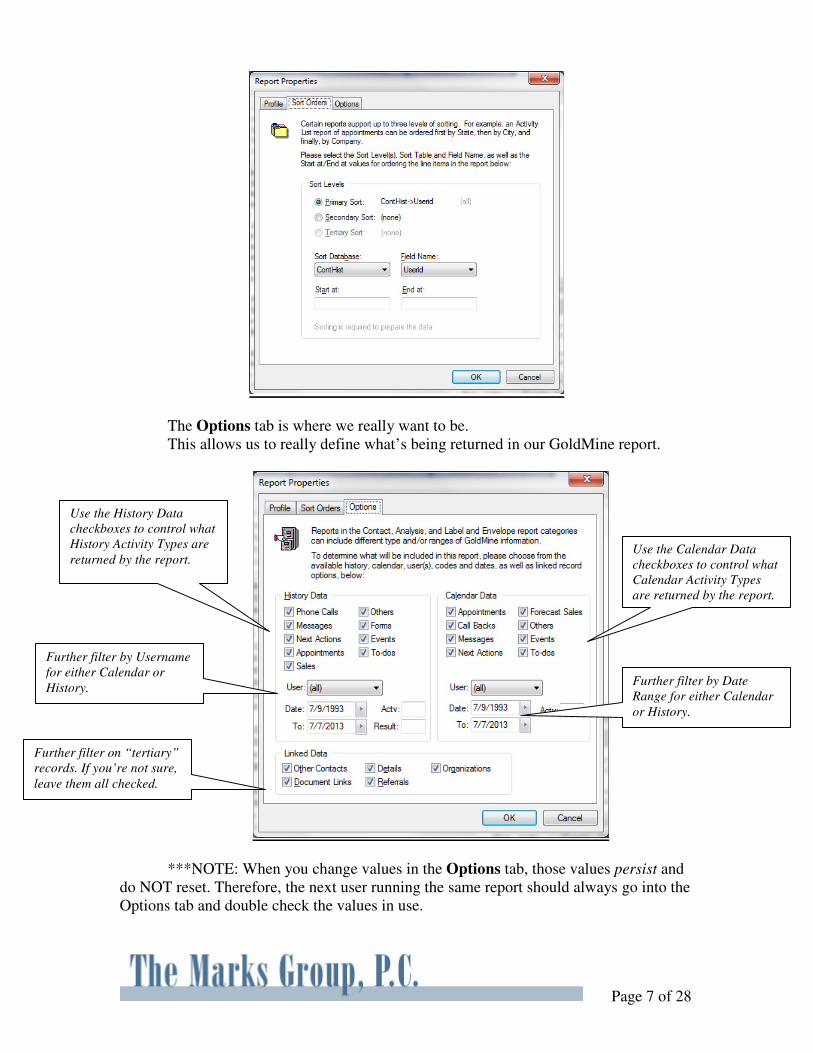
The Options tab is where we really want to be.
This allows us to really define what’s being returned in our GoldMine report.
***NOTE: When you change values in the Options tab, those values persist and
do NOT reset. Therefore, the next user running the same report should always go into the
Options tab and double check the values in use.
Use the History Data
checkboxes to control what
History Activity Types are
returned by the report. Use the Calendar Data
checkboxes to control what
Calendar Activity Types
are returned by the report.
Further filter by Username
for either Calendar or
History. Further filter by Date
Range for either Calendar
or History.
Further filter on “tertiary”
records. If you’re not sure,
leave them all checked.

Page 8 of 28
Page 9 of 28
Crystal Reports …now we’re getting serious
The Case for Crystal
This next section of the manual covers (briefly) using Crystal Reports to access
GoldMine data. For those of you that have any serious reporting needs whatsoever, this is the
superior choice.
Crystal Reports : Database connections …Adding your GoldMine tables
Adding your Data Source
The first thing we need to do is get our blank report connected to a data source. I
like to use ODBC Data Sources almost exclusively for one simple reason; they greatly
facilitate deployment and maintenance of developed reports.
For this reason, it is desirable that you have already added your ODBC Data
Source and have tested it. In secure network environments, you may not have the ability
to define these for yourself. In this case, it’s recommended that you consult with your
network administrator.
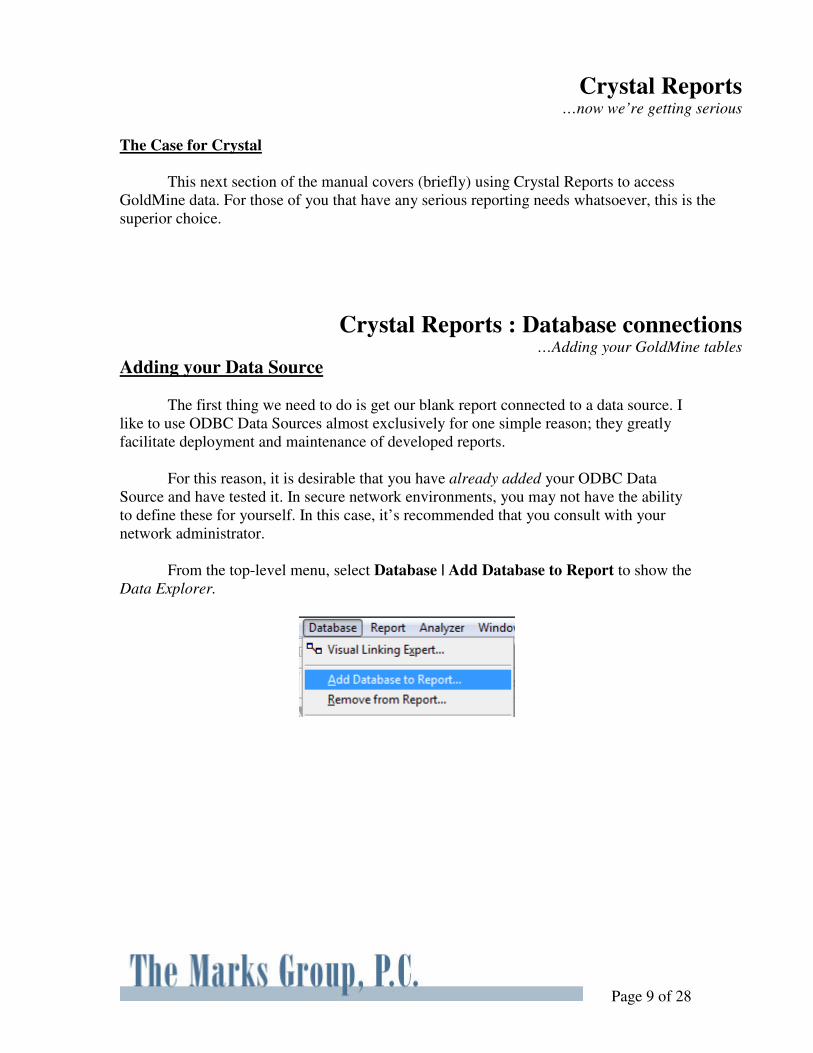
From the top-level menu, select Database | Add Database to Report to show the
Data Explorer.
Page 10 of
28
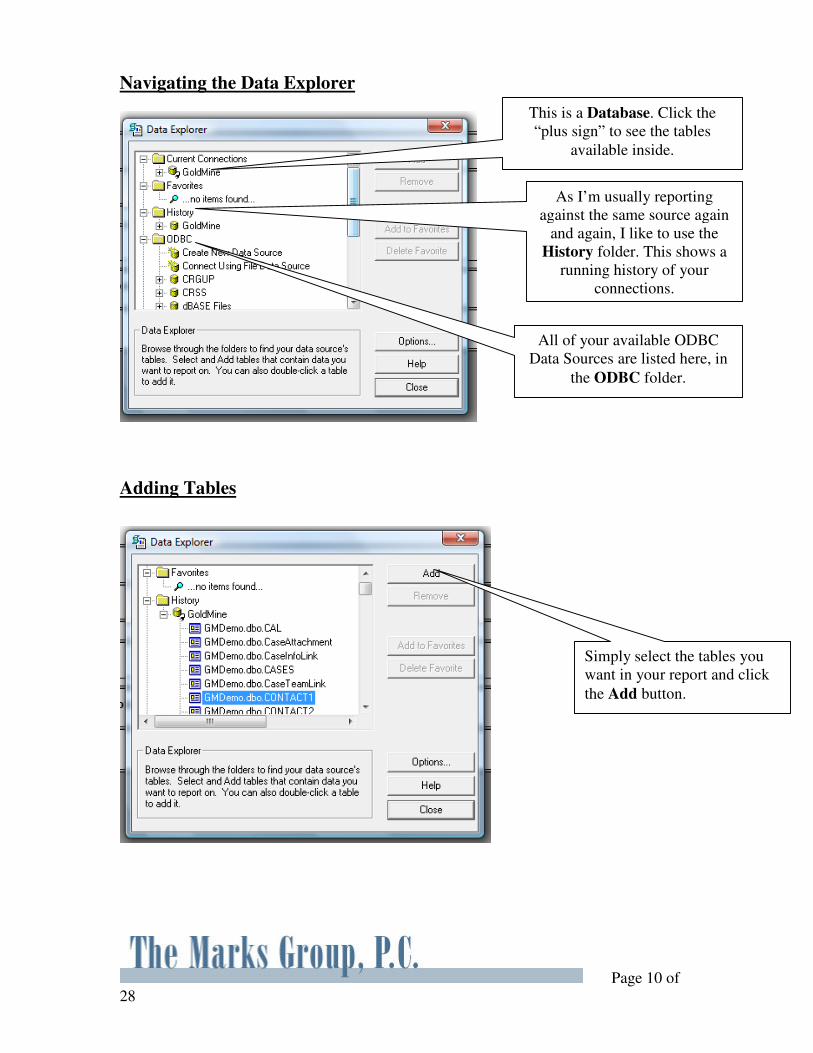
Navigating the Data Explorer
Adding Tables
As I’m usually reporting
against the same source again
and again, I like to use the
History folder. This shows a
running history of your
connections.
All of your available ODBC
Data Sources are listed here, in
the ODBC folder.
This is a Database. Click the
“plus sign” to see the tables
available inside.
Simply select the tables you
want in your report and click
the Add button.
Page 11 of
28
Joining Tables Knowing your Database
Relational Databases
Most data sources are relational, which means that your total customer data is
split between separate tables. Having a good understanding of how your database works
is paramount when developing your own reports. This information, typically called the
Database Schema, can usually be found in your software documentation.
Again, the examples used are specifically for GoldMine Premium Edition.
The Nutshell
This is the way it works: one table holds all your customer records. This would
include their names, phone numbers, addresses, etc. And each of these customer records
has many corresponding history records in a different table. The two tables, then, are
logically linked via a key. In GoldMine, that key is called ACCOUNTNO.
So each row in our customer table (CONTACT1) has an ACCOUNTNO. And
each row in our history table (CONTHIST) has one too. Our job now is to tell Crystal it
should link CONTACT1 and CONTHIST via the ACCOUNTNO.
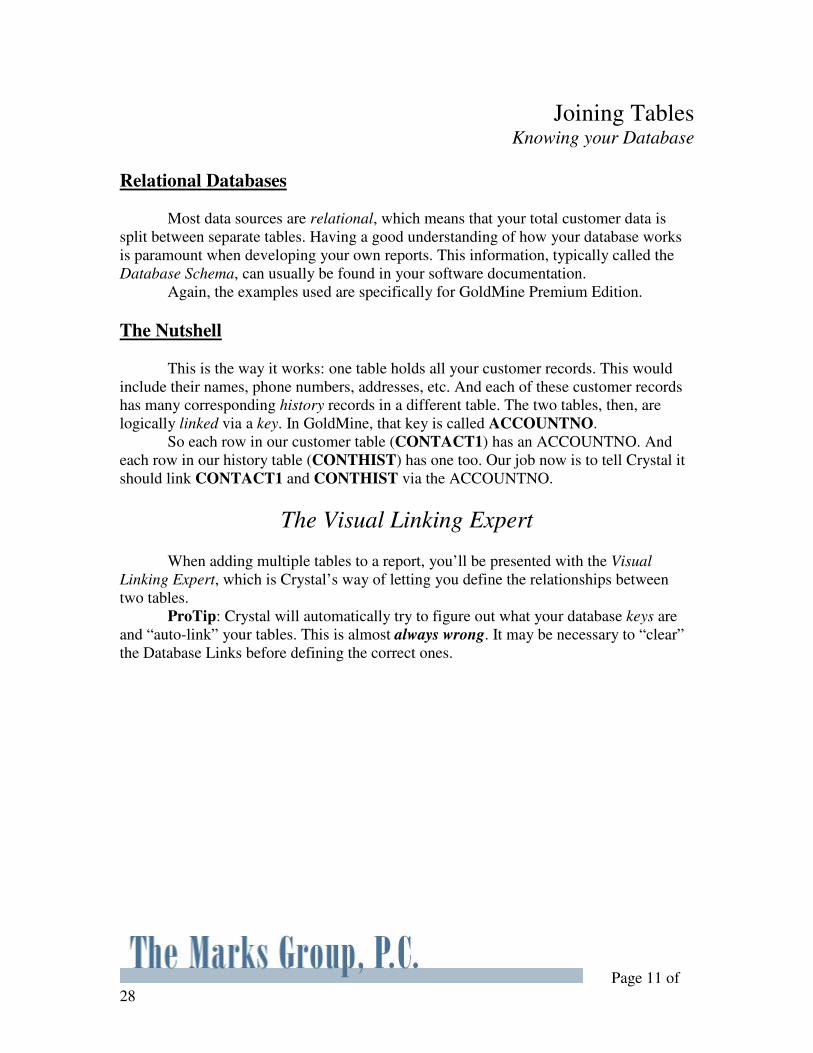
The Visual Linking Expert
When adding multiple tables to a report, you’ll be presented with the Visual
Linking Expert, which is Crystal’s way of letting you define the relationships between
two tables.
ProTip: Crystal will automatically try to figure out what your database keys are
and “auto-link” your tables. This is almost always wrong. It may be necessary to “clear”
the Database Links before defining the correct ones.
Page 12 of
28
Inserting fields Putting your list together
A Note about “Sections”
Before we start adding fields to our Report Layout, we must understand where to
put them and why. Fields are inserted into sections. The section will determine how the
data is repeated, if at all. The different sections are briefly described below:
- Report Header/Footer : these sections are printed only once pre report, at the
beginning and ending, respectively
- Page Header/Footer : these sections are printed at the top and bottom of
every page, and are good places for the report title and page number
- Details : This section will create a single line on your report for each row of
data returned by the source. This is your “list”
- Group Header/Footer : These sections are not shown unless you are
grouping your data. These are printed once per “group”.
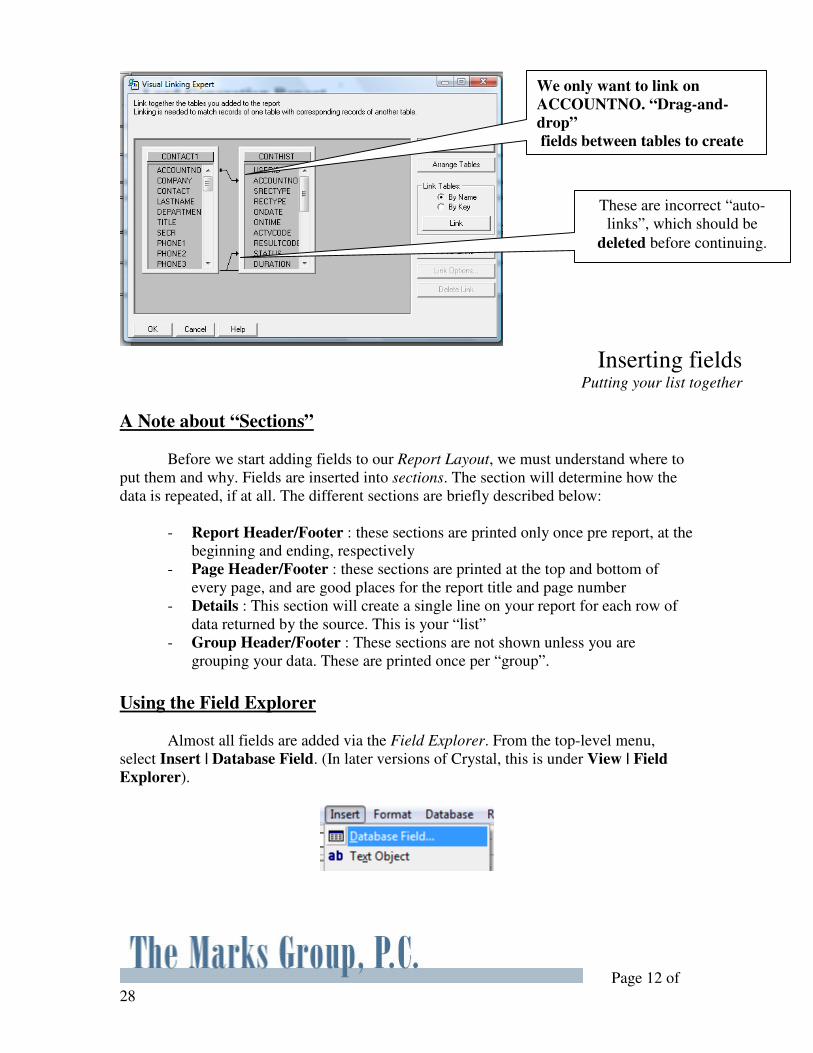
Using the Field Explorer
Almost all fields are added via the Field Explorer. From the top-level menu,
select Insert | Database Field. (In later versions of Crystal, this is under View | Field
Explorer).
We only want to link on
ACCOUNTNO. “Drag-and-
drop”
fields between tables to create
These are incorrect “auto-
links”, which should be
deleted before continuing.
Page 13 of
28
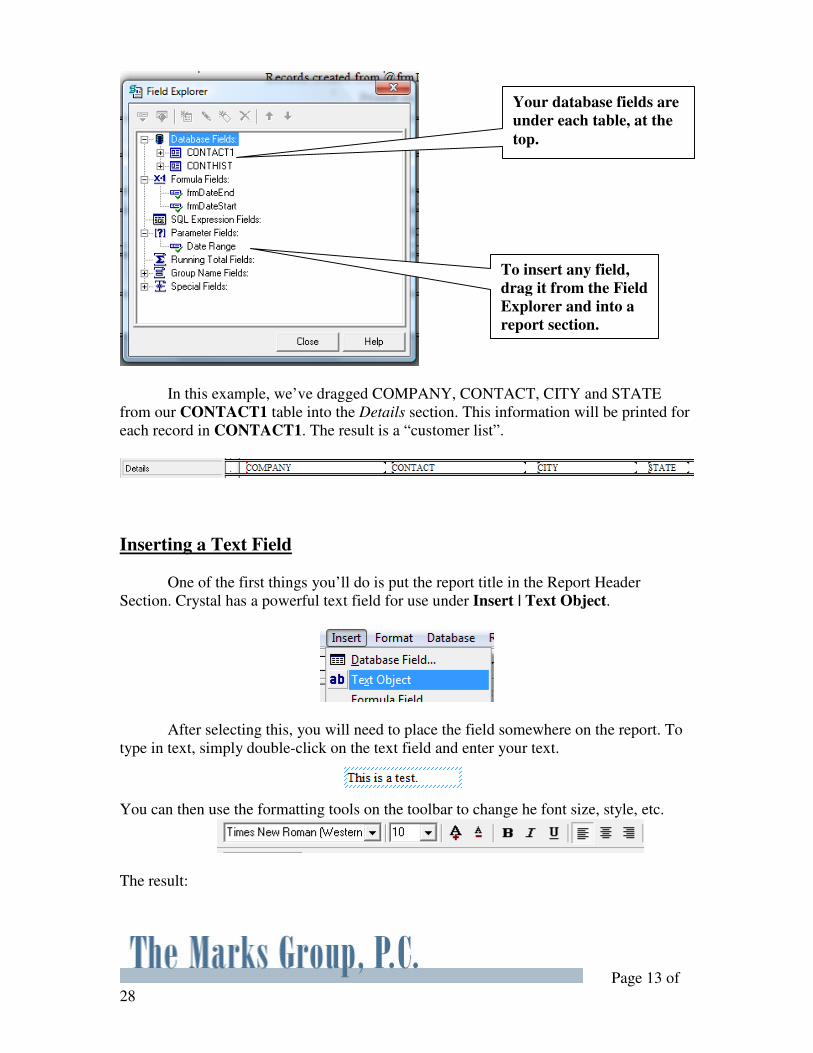
In this example, we’ve dragged COMPANY, CONTACT, CITY and STATE
from our CONTACT1 table into the Details section. This information will be printed for
each record in CONTACT1. The result is a “customer list”.
Inserting a Text Field
One of the first things you’ll do is put the report title in the Report Header
Section. Crystal has a powerful text field for use under Insert | Text Object.
After selecting this, you will need to place the field somewhere on the report. To
type in text, simply double-click on the text field and enter your text.
You can then use the formatting tools on the toolbar to change he font size, style, etc.
The result:
To insert any field,
drag it from the Field
Explorer and into a
report section.
Your database fields are
under each table, at the
top.
Page 14 of
28
Note: You will most likely need to resize your text object after changing the font
size. You can do this by dragging the edges of the text object.
Selecting Data Getting what you want
The Selection Criteria
At the heart of every report is a Selection Criteria. That is to say, a statement that
defines what records the report should operate with. The statement involved here is a
conditional statement: a logical condition must be met for a record to be returned to the
report.
Some examples include:
All customers where STATE = ‘PA’
All histories between 12/01/2009 and 12/31/2009
All customers where STATE = ‘PA’ AND SOURCE = ‘Referral’
In every case, the expression consists of a FIELDNAME (State), an OPERATOR
(equals) and a CONDITION (‘PA’). You may compound expressions by using AND’s
and OR’s in a Boolean fashion.
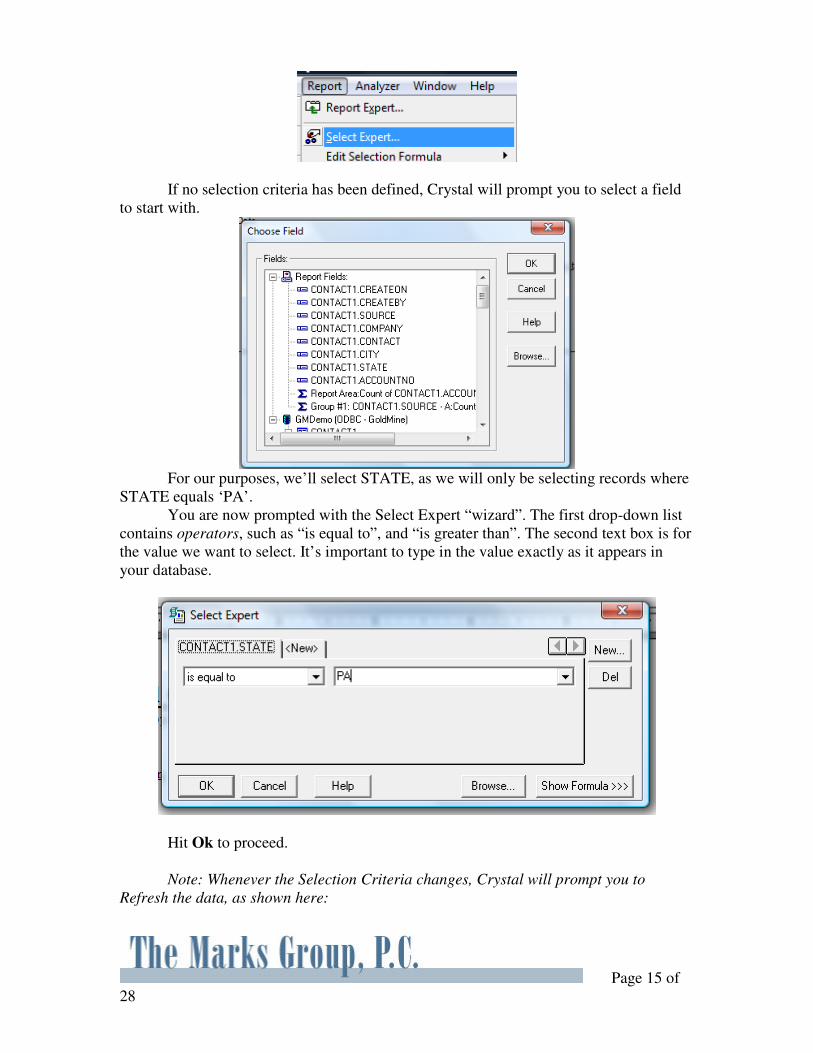
Using the Selection Expert
To access the Selection Expert, select Report | Select Expert from the top level
menu.
Page 15 of
28
If no selection criteria has been defined, Crystal will prompt you to select a field
to start with.
For our purposes, we’ll select STATE, as we will only be selecting records where
STATE equals ‘PA’.
You are now prompted with the Select Expert “wizard”. The first drop-down list
contains operators, such as “is equal to”, and “is greater than”. The second text box is for
the value we want to select. It’s important to type in the value exactly as it appears in
your database.
Hit Ok to proceed.
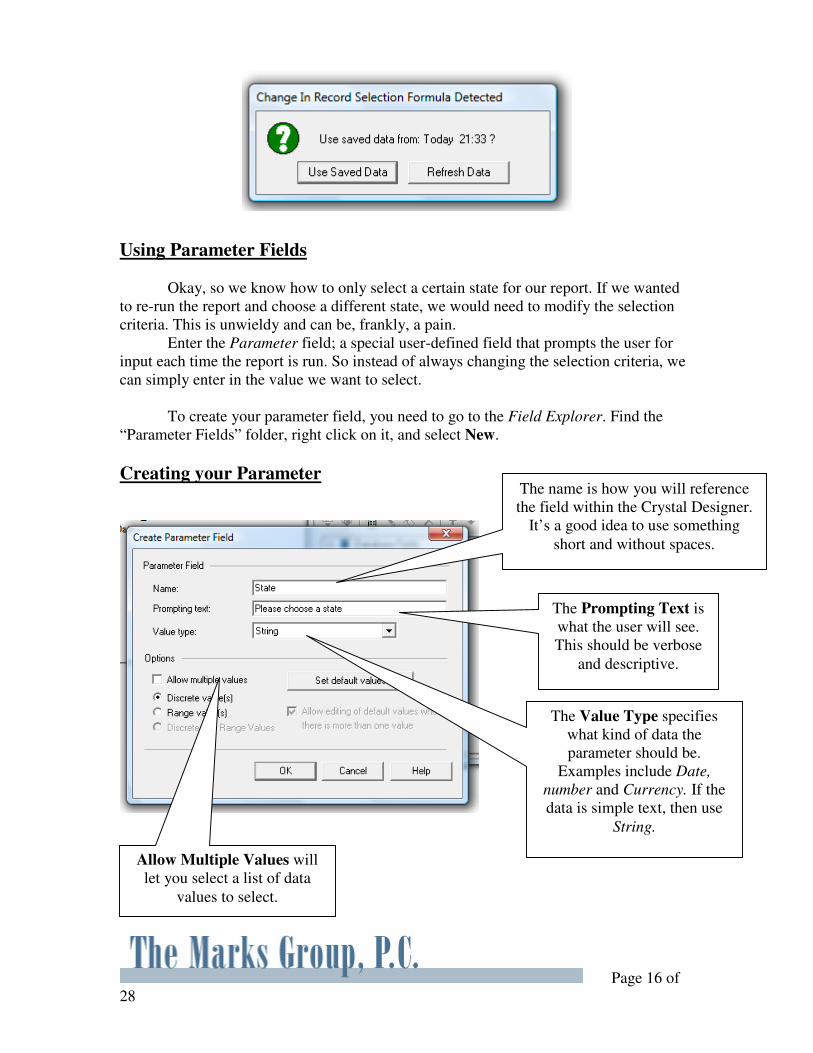
Note: Whenever the Selection Criteria changes, Crystal will prompt you to
Refresh the data, as shown here:
Page 16 of
28
Using Parameter Fields
Okay, so we know how to only select a certain state for our report. If we wanted
to re-run the report and choose a different state, we would need to modify the selection
criteria. This is unwieldy and can be, frankly, a pain.
Enter the Parameter field; a special user-defined field that prompts the user for
input each time the report is run. So instead of always changing the selection criteria, we
can simply enter in the value we want to select.
To create your parameter field, you need to go to the Field Explorer. Find the
“Parameter Fields” folder, right click on it, and select New.
Creating your Parameter
The name is how you will reference
the field within the Crystal Designer.
It’s a good idea to use something
short and without spaces.
The Prompting Text is
what the user will see.
This should be verbose
and descriptive.
The Value Type specifies
what kind of data the
parameter should be.
Examples include Date,
number and Currency. If the
data is simple text, then use
String.
Allow Multiple Values will
let you select a list of data
values to select.
Page 17 of
28
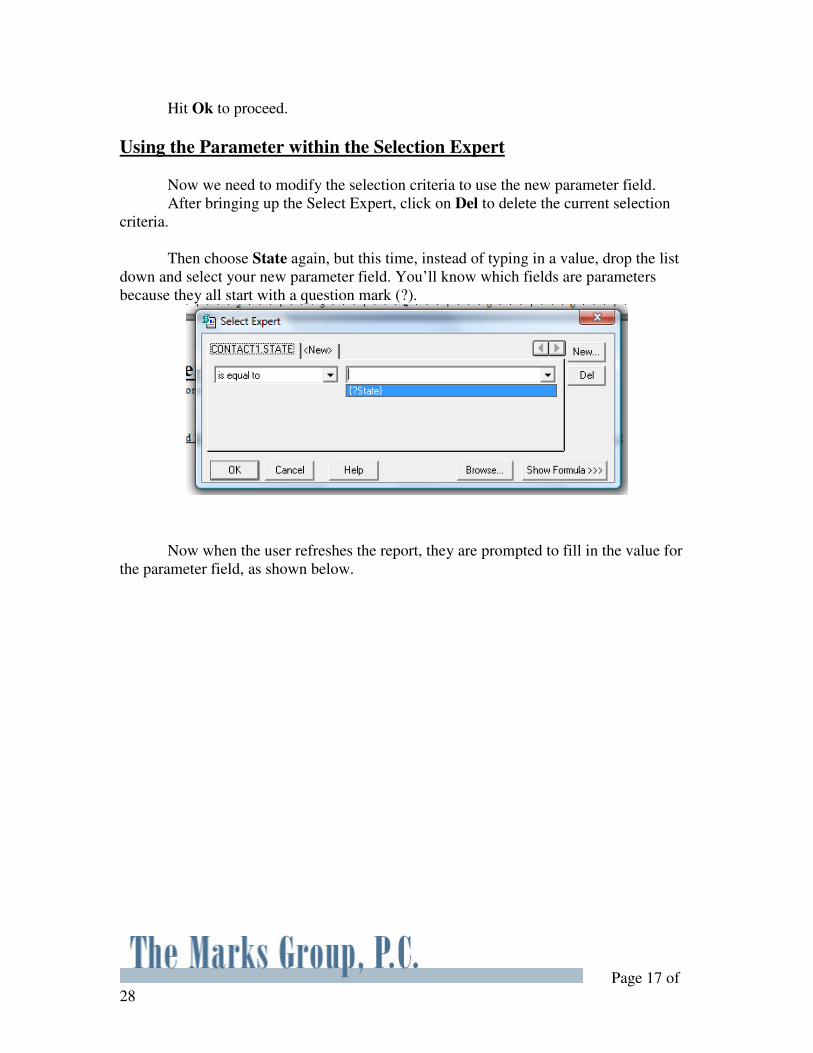
Hit Ok to proceed.
Using the Parameter within the Selection Expert
Now we need to modify the selection criteria to use the new parameter field. After bringing up the Select Expert, click on Del to delete the current selection
criteria.
Then choose State again, but this time, instead of typing in a value, drop the list
down and select your new parameter field. You’ll know which fields are parameters
because they all start with a question mark (?).
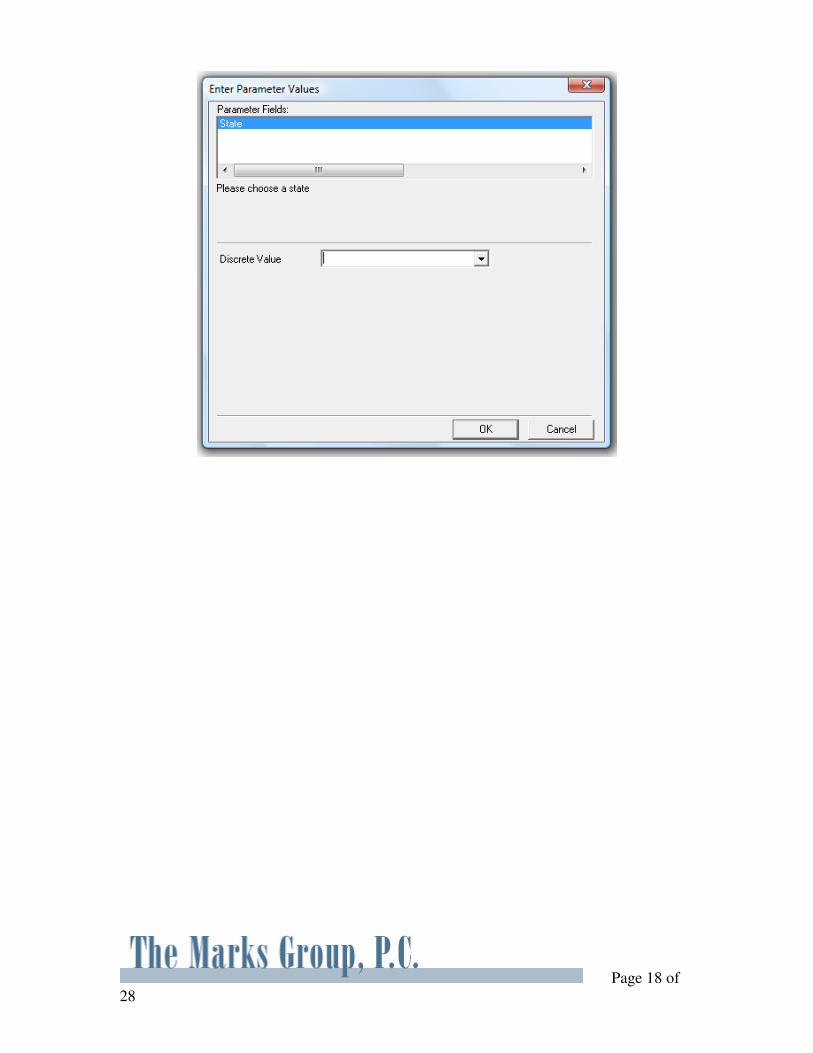
Now when the user refreshes the report, they are prompted to fill in the value for
the parameter field, as shown below.
Page 18 of
28
Page 19 of
28
Sorting and Grouping Data First things first
Sorting your Report
Typically, you will want to sort your report based upon a data value. This will
make your report easier to read and help it to make more sense.
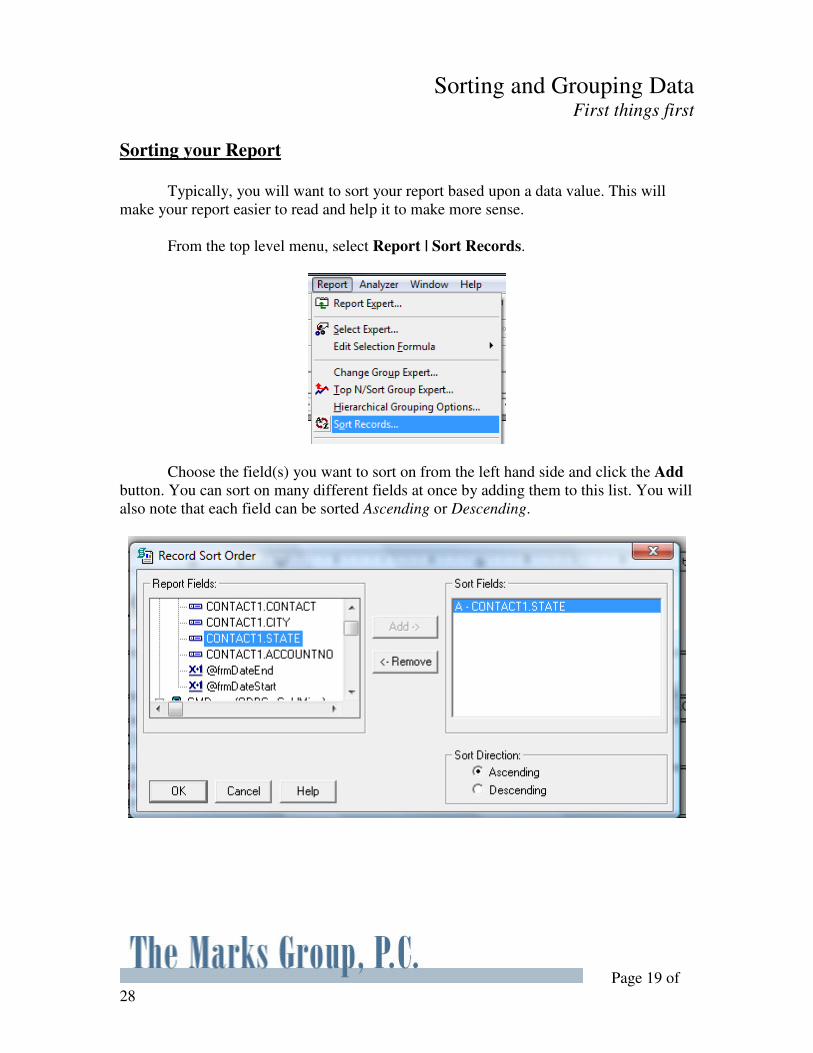
From the top level menu, select Report | Sort Records.
Choose the field(s) you want to sort on from the left hand side and click the Add
button. You can sort on many different fields at once by adding them to this list. You will
also note that each field can be sorted Ascending or Descending.
Page 20 of
28
Grouping Data on your report
Let’s suppose that the report is returning a few thousand records. In this case, you
may want to Group your data together, based upon a field. This can make the report
easier to read and also allows you to start using some of the summarization functions of
Crystal. This will also add Group Headers and Footers to your Report design.
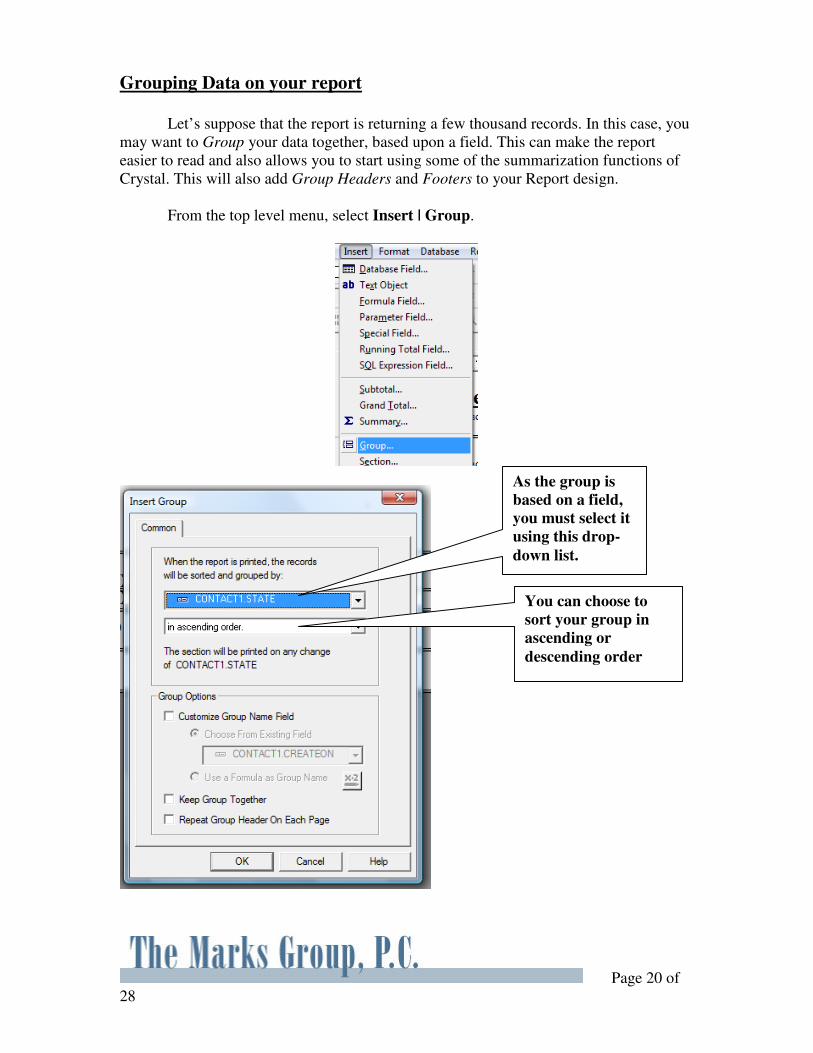
From the top level menu, select Insert | Group.
As the group is
based on a field,
you must select it
using this drop-
down list.
You can choose to
sort your group in
ascending or
descending order
Page 21 of
28
Summarizing Data Analysis at last
Inserting a simple summary
Now that we’ve added a group, we can start to summarize some of our data. Let’s
assume that we want to display a simple count of the records in each state.
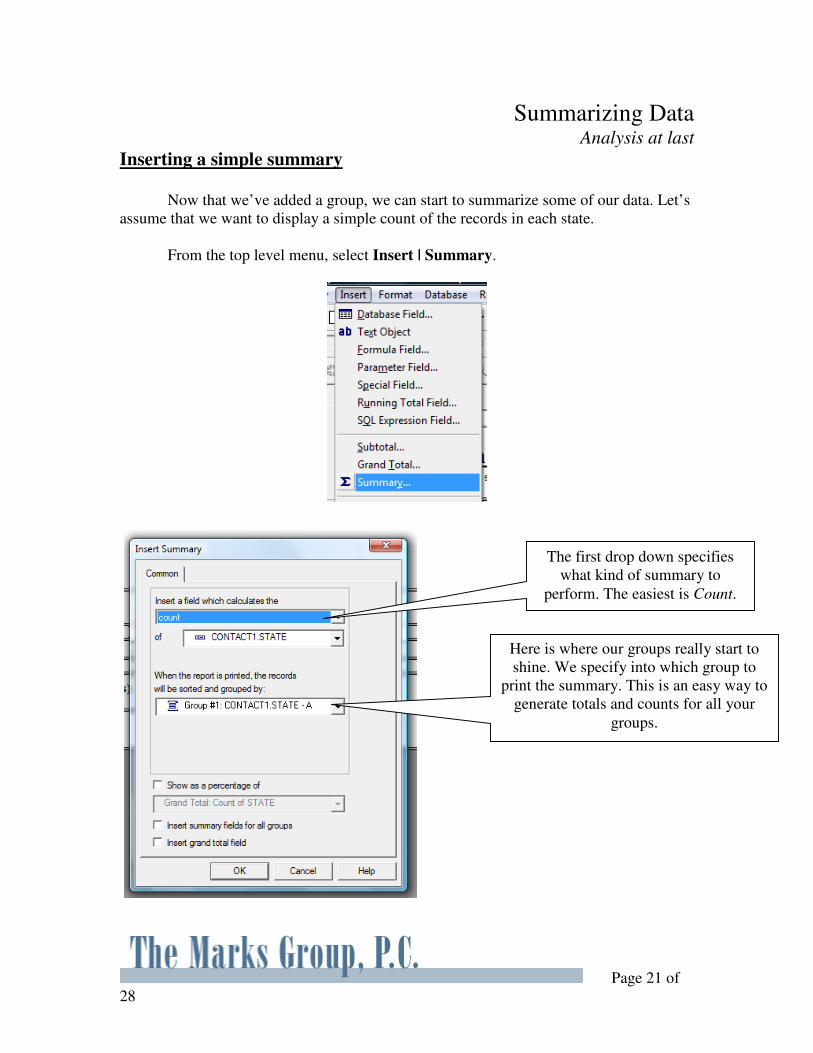
From the top level menu, select Insert | Summary.
The first drop down specifies
what kind of summary to
perform. The easiest is Count.
Here is where our groups really start to
shine. We specify into which group to
print the summary. This is an easy way to
generate totals and counts for all your
groups.
Page 22 of
28
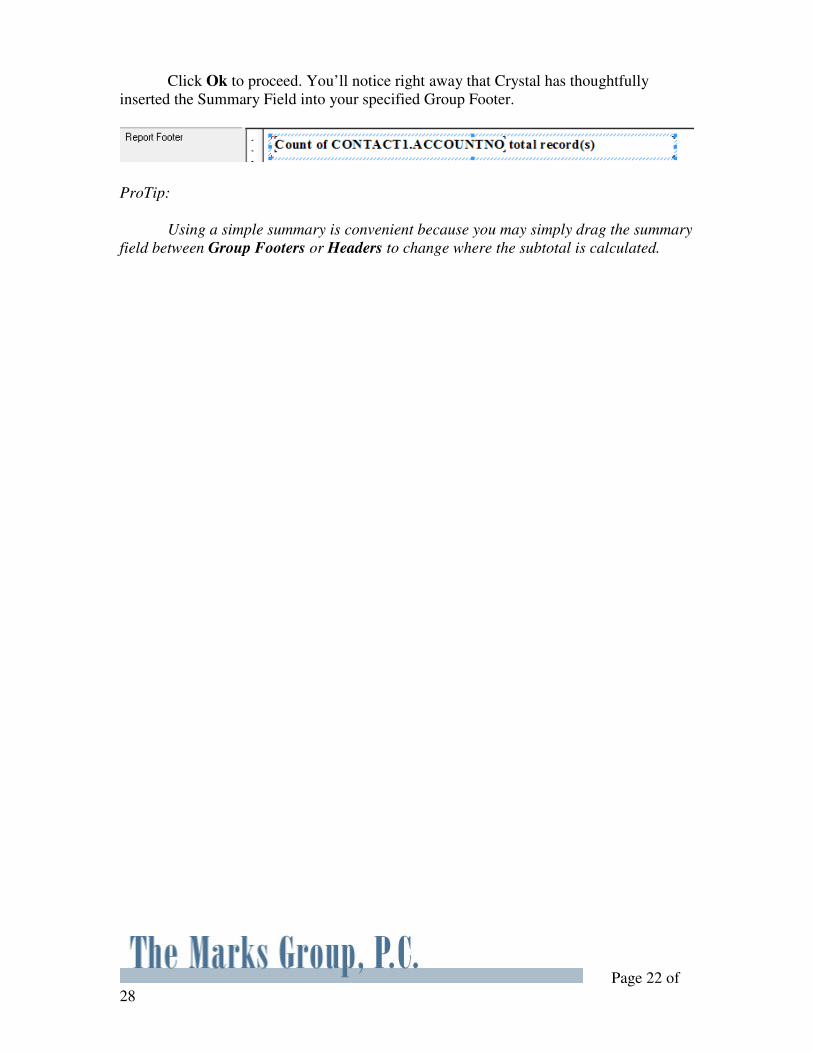
Click Ok to proceed. You’ll notice right away that Crystal has thoughtfully
inserted the Summary Field into your specified Group Footer.
ProTip:
Using a simple summary is convenient because you may simply drag the summary
field between Group Footers or Headers to change where the subtotal is calculated.
Page 23 of
28
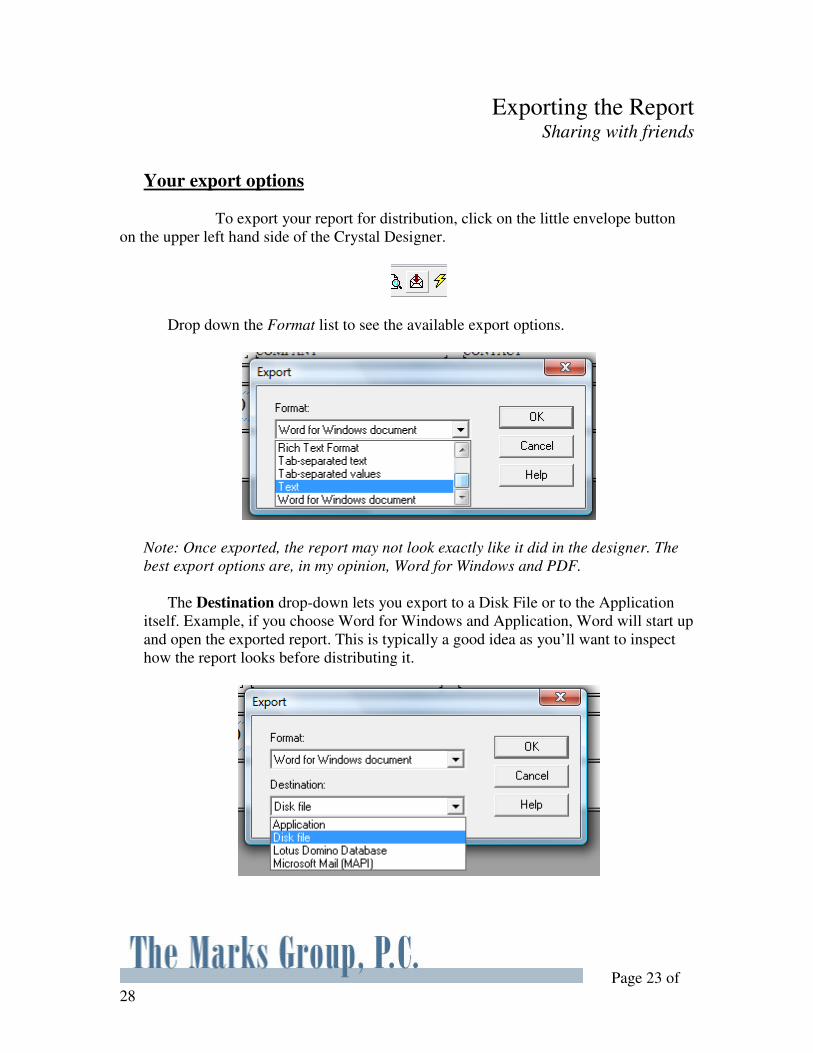
Exporting the Report Sharing with friends
Your export options
To export your report for distribution, click on the little envelope button
on the upper left hand side of the Crystal Designer.
Drop down the Format list to see the available export options.
Note: Once exported, the report may not look exactly like it did in the designer. The
best export options are, in my opinion, Word for Windows and PDF.
The Destination drop-down lets you export to a Disk File or to the Application
itself. Example, if you choose Word for Windows and Application, Word will start up
and open the exported report. This is typically a good idea as you’ll want to inspect
how the report looks before distributing it.
Page 24 of
28
Creating a Simple GoldMine Dashboard Doing it for yourself
A Very Simple Dashboard
We in the industry are all very excited about the Dashboard capabilities in
GoldMine 9. It is something that is not only very useful, but incredibly flexible.
Therefore, we will only be covering a basic Dashboard in this manual, both a Data Grid
and Chart view. Once you get the hang of it, there is much more to explore.
The Parts of a Dashboard
When we think of a GoldMine dashboard, we must understand the constituent
parts:
- Dashboard : The highest level object, think of it as a blank page to put stuff
on. A Dashboard is nothing but a collection of Controls.
- Control : Controls are objects which are dragged onto the Dashboard, and
display data. An example of a Control would be a Chart or a List of records.
- Data Source : What underlies each Control, and provides data to the Control.
Designing Your Dashboard
To access your Dashboards in GoldMine, select Go To | Dashboards.
You’ll notice in the top left corner you can navigate through the “canned”
dashboards. These are actually quite useful and can give you a good idea of what is
possible.
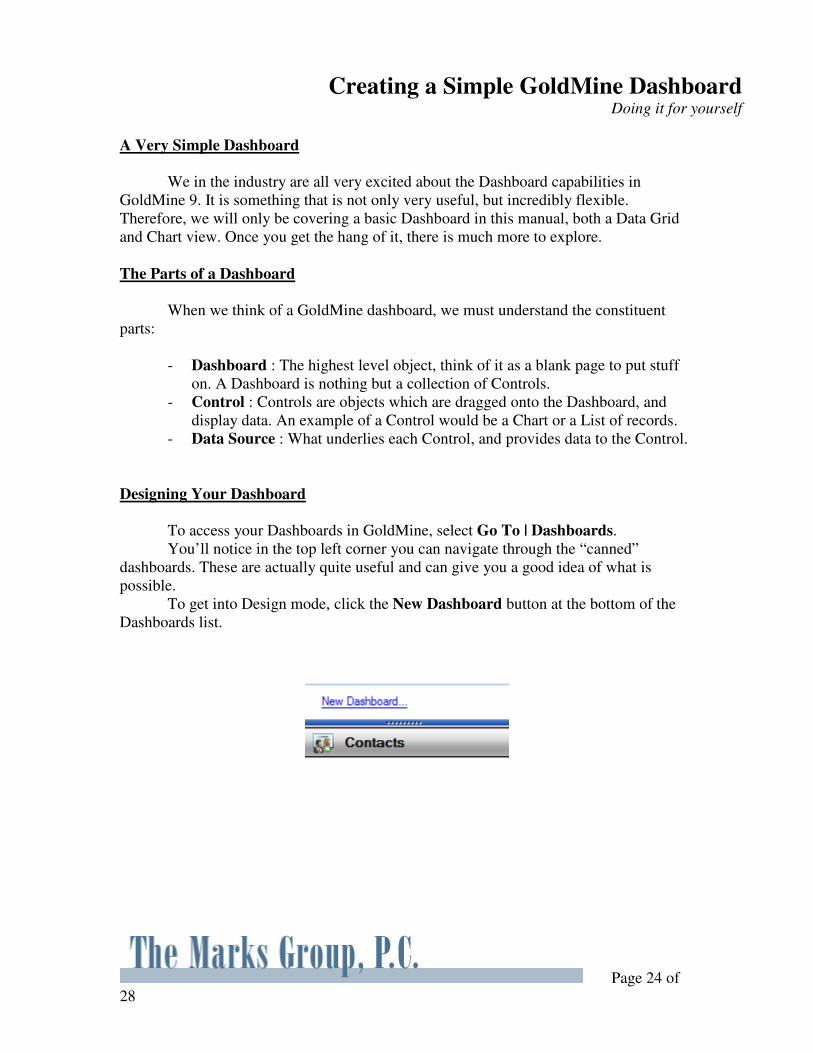
To get into Design mode, click the New Dashboard button at the bottom of the
Dashboards list.
Page 25 of
28
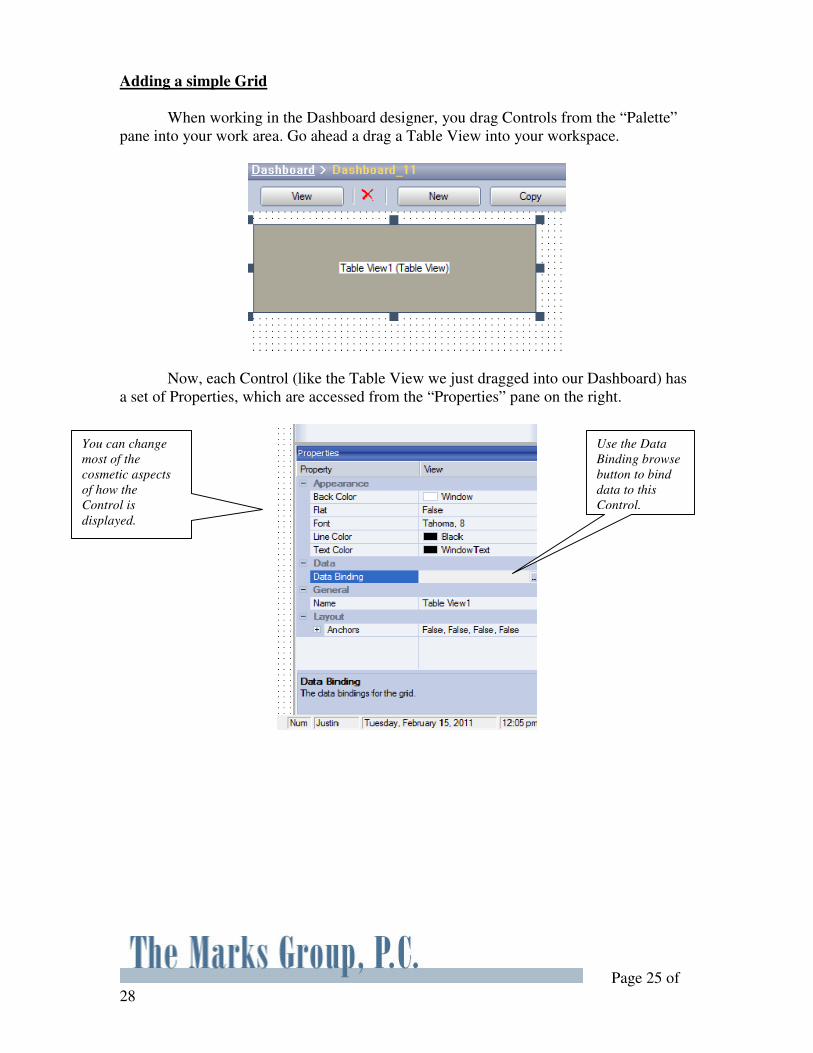
Adding a simple Grid
When working in the Dashboard designer, you drag Controls from the “Palette”
pane into your work area. Go ahead a drag a Table View into your workspace.
Now, each Control (like the Table View we just dragged into our Dashboard) has
a set of Properties, which are accessed from the “Properties” pane on the right.
You can change
most of the
cosmetic aspects
of how the
Control is displayed.
Use the Data
Binding browse
button to bind
data to this
Control.
Page 26 of
28
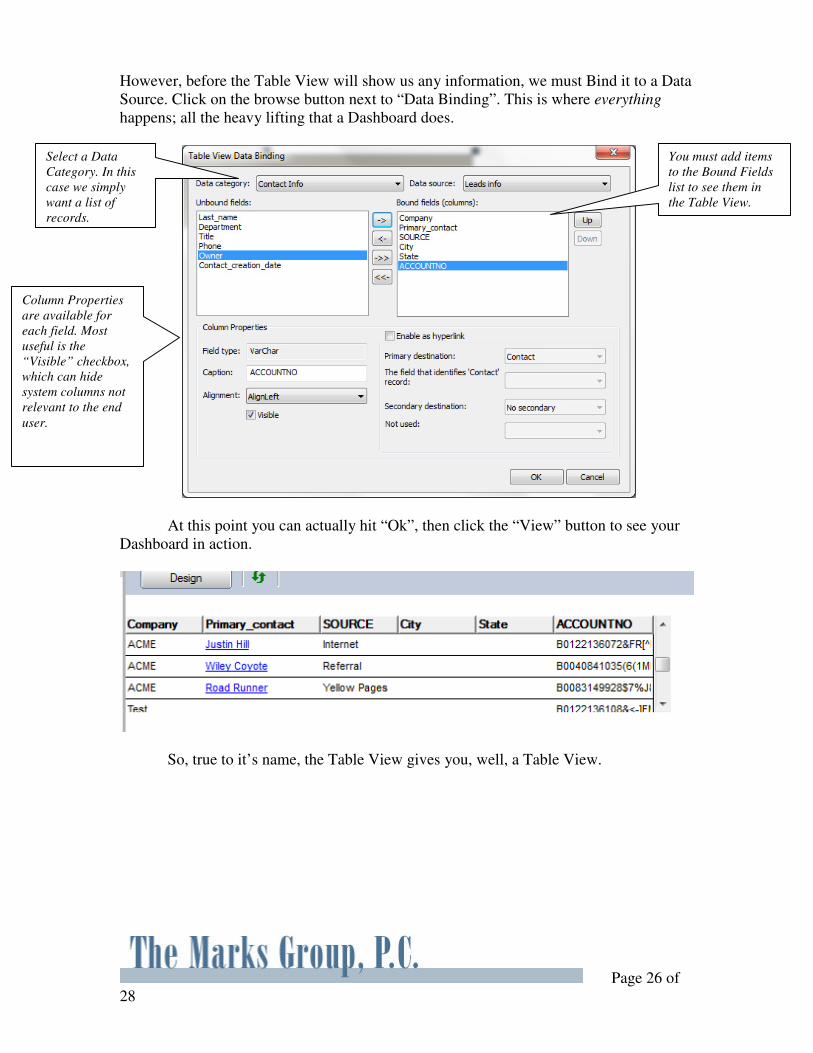
However, before the Table View will show us any information, we must Bind it to a Data
Source. Click on the browse button next to “Data Binding”. This is where everything
happens; all the heavy lifting that a Dashboard does.
At this point you can actually hit “Ok”, then click the “View” button to see your
Dashboard in action.
So, true to it’s name, the Table View gives you, well, a Table View.
Select a Data
Category. In this
case we simply
want a list of
records.
You must add items
to the Bound Fields
list to see them in
the Table View.
Column Properties
are available for
each field. Most
useful is the
“Visible” checkbox,
which can hide
system columns not
relevant to the end
user.
Page 27 of
28
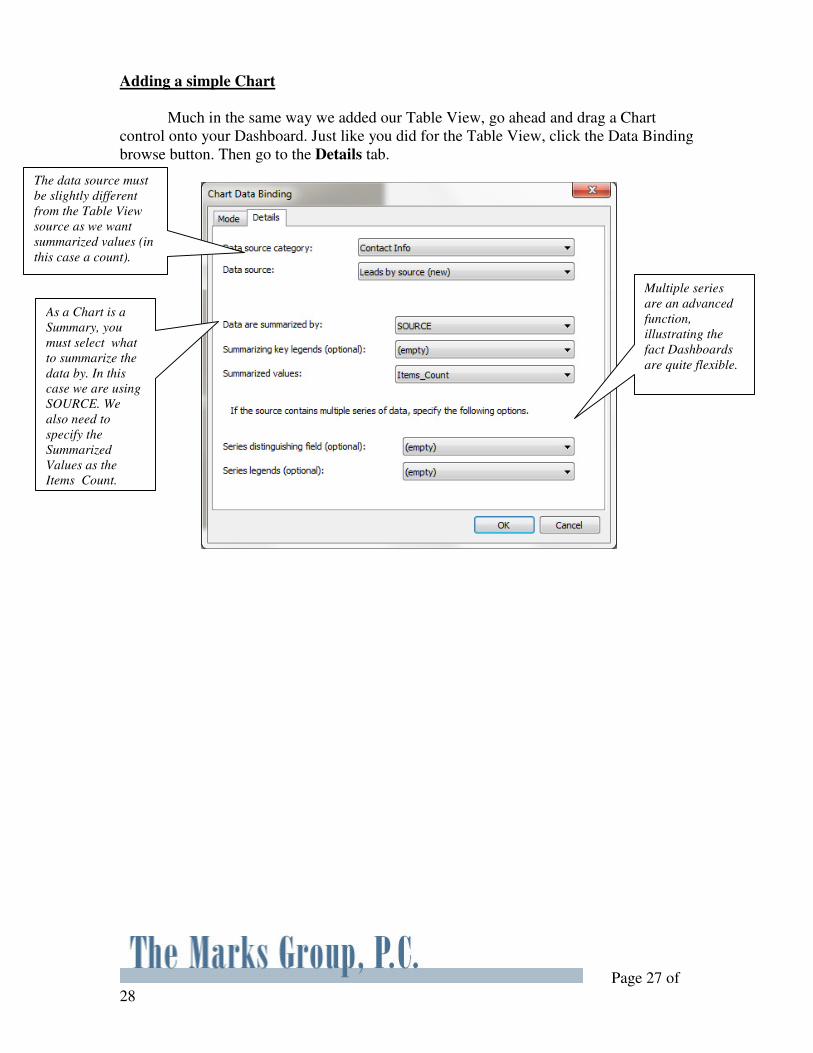
Adding a simple Chart
Much in the same way we added our Table View, go ahead and drag a Chart
control onto your Dashboard. Just like you did for the Table View, click the Data Binding
browse button. Then go to the Details tab.
The data source must
be slightly different
from the Table View
source as we want
summarized values (in
this case a count).
As a Chart is a
Summary, you
must select what
to summarize the
data by. In this
case we are using
SOURCE. We
also need to
specify the
Summarized
Values as the
Items_Count.
Multiple series
are an advanced
function,
illustrating the
fact Dashboards
are quite flexible.
Page 28 of
28
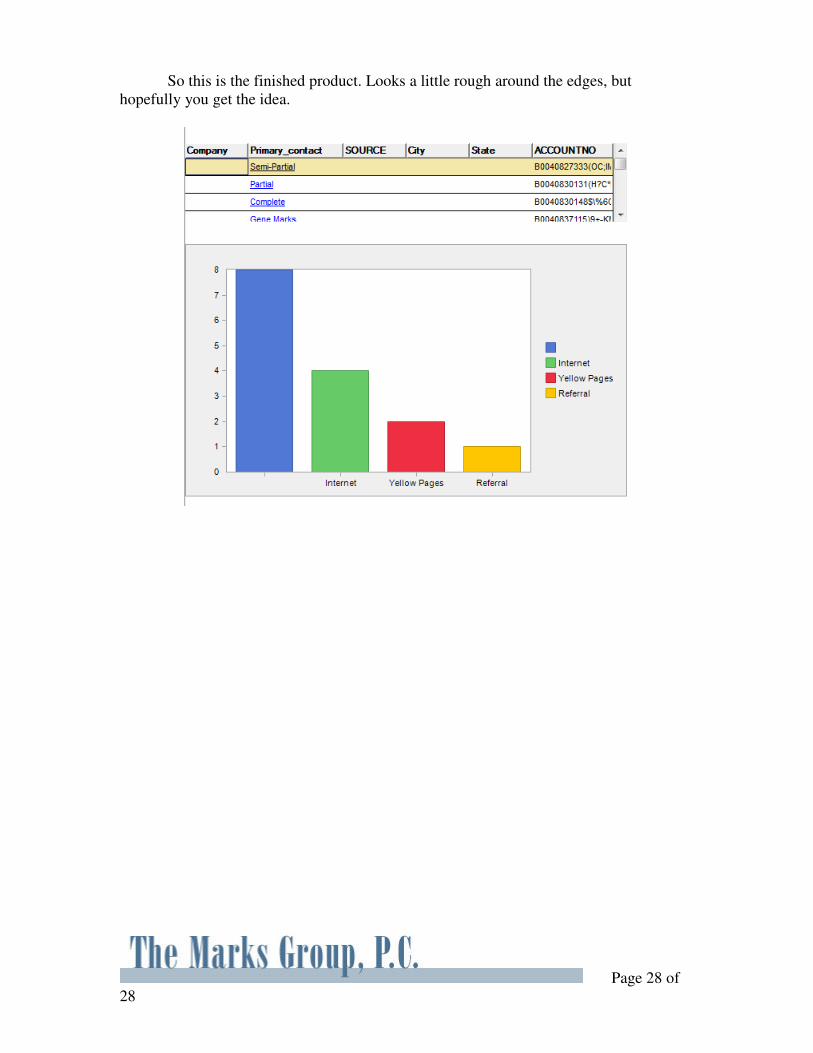
So this is the finished product. Looks a little rough around the edges, but
hopefully you get the idea.


![Goldmine[d] Innovation Workshop](https://img.pdfslide.us/doc/110x75/58f31e051a28ab34068b45bd/goldmined-innovation-workshop.jpg)