Embed Size (px)
Citation preview

©2016 Lincoln National Corporation
December 7, 2016 Chris Giovanni 484-583-1793 [email protected]
GOLDMAN SACHS U.S. FINANCIAL SERVICES CONFERENCE 2016
Dennis R. Glass | President and Chief Executive Officer
New York, NY

LINCOLN STORY
2
3
Highly Integrated
U.S. RETAIL-CENTRIC; TARGETING SELECT HIGH-GROWTH AREAS
Four Core Businesses
High Growth Segments
Centralized Distribution
Retail Focused Products
Risk Management
Strong Capital Position
• Annuity
• Group Protection (GP)
• Life
• Retirement Plan Services (RPS)
• Mass affluent Annuity
• Employee-paid Group Protection
• High end Life
• Gen X / millennial markets
• Small employers and government
• Broad shelf space
• Wholesale
• Retail
• Worksite
• Comprehensive
• Innovative
• Diversified
• Multi-solution
• Rigorous planning
• Active monitoring
• Centralized
• Integral to product design
• Free cash flow generation
• Steady growth in dividends and buybacks
• Appropriate leverage
Clear and consistent focus on retail products in the United States
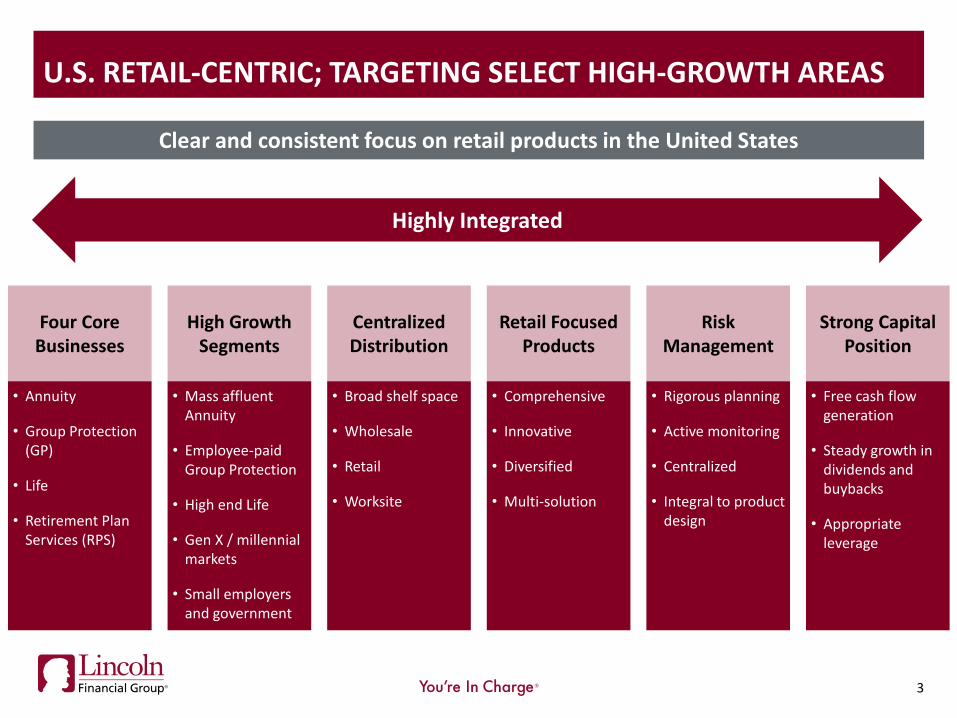
40% 29%
60% 71%
0%
25%
50%
75%
100%
2009 2015With long-term guarantee Without long-term guarantee
67% 33%
All non-mortality/morbidity
Mortality/morbidity
CONTINUING TO DIVERSIFY THE COMPANY’S RISK PROFILE
Achieved long-term guarantee sales mix goal1…
…which supports increasing mortality/morbidity as a source of earnings2
70% 30%
Without long-termguarantee
With long-termguarantee
1 Sales mix: Life, MoneyGuard® and Group Protection: Paid Annualized Premiums as reported; Annuity/Retirement Plan Services at 5% of Deposits. 2 Pre-Tax, excludes Other Operations.
4
Target
73%
27%
3Q16 Long-term goal
5
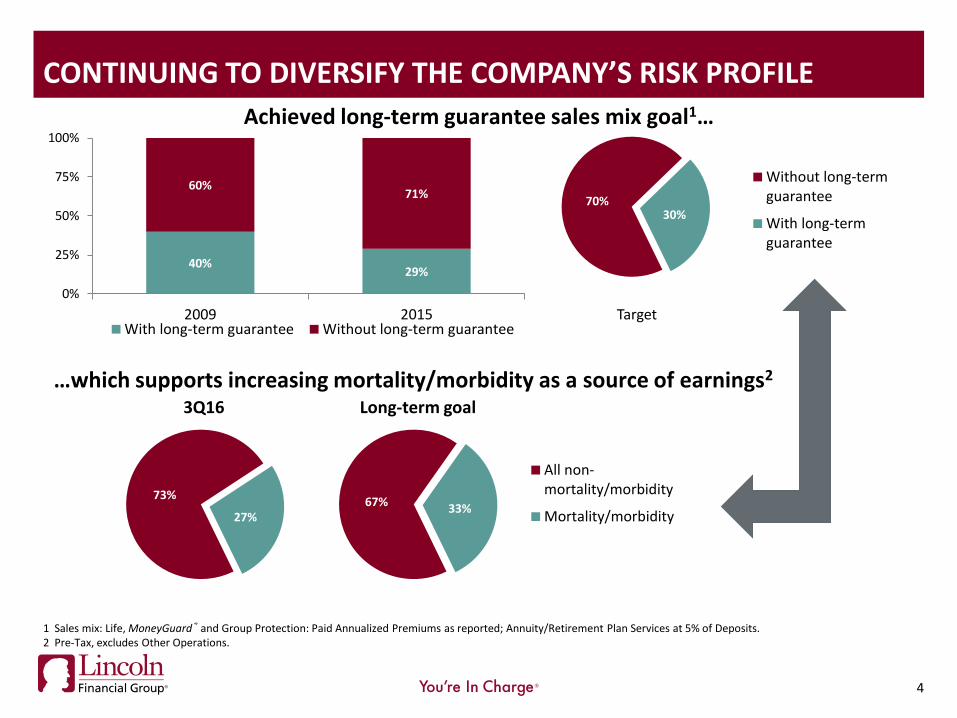
TRACK RECORD OF STRONG AND CONSISTENT PERFORMANCE
350%
400%
450%
500%
550%
$5B
$6B
$7B
$8B
$9B
2009 2015
4%
6%
8%
10%
12%
$20
$30
$40
$50
$60
2009 2015
Strong capital levels BVPS growth and ROE expansion
BVPS ex. AOCI1 ROE1 Statutory capital RBC ratio
$0
$2
$4
$6
$8
2009 2015 Operating EPS1
Strong EPS growth Steady revenue growth with controlled expenses
$3B
$6B
$9B
$12B
$15B
2009 2015 Operating revenue1
G&A as a % of operating revenue1
9%
10%
11%
12%
13%
2009 2015
1 See Appendix for a reconciliation of non-GAAP measures to their most comparable GAAP measures. G&A as a percent of operating revenue represents general and administrative expenses, net of amounts capitalized, as a percent of operating revenue.
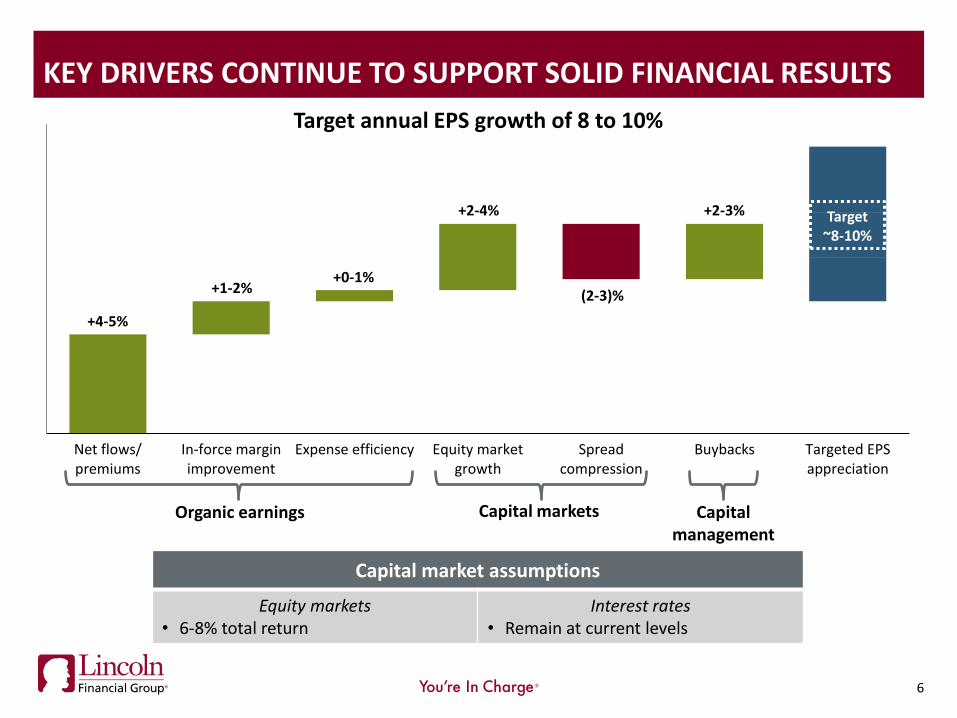
KEY DRIVERS CONTINUE TO SUPPORT SOLID FINANCIAL RESULTS
6
Organic earnings Capital management
Capital markets
Net flows/premiums
In-force marginimprovement
Expense efficiency Equity marketgrowth
Spreadcompression
Buybacks Targeted EPSappreciation
+2-4%
+1-2%
+4-5%
(2-3)%
+2-3%
+0-1%
Target ~8-10%
Capital market assumptions
Equity markets • 6-8% total return
Interest rates • Remain at current levels
Target annual EPS growth of 8 to 10%
7
7
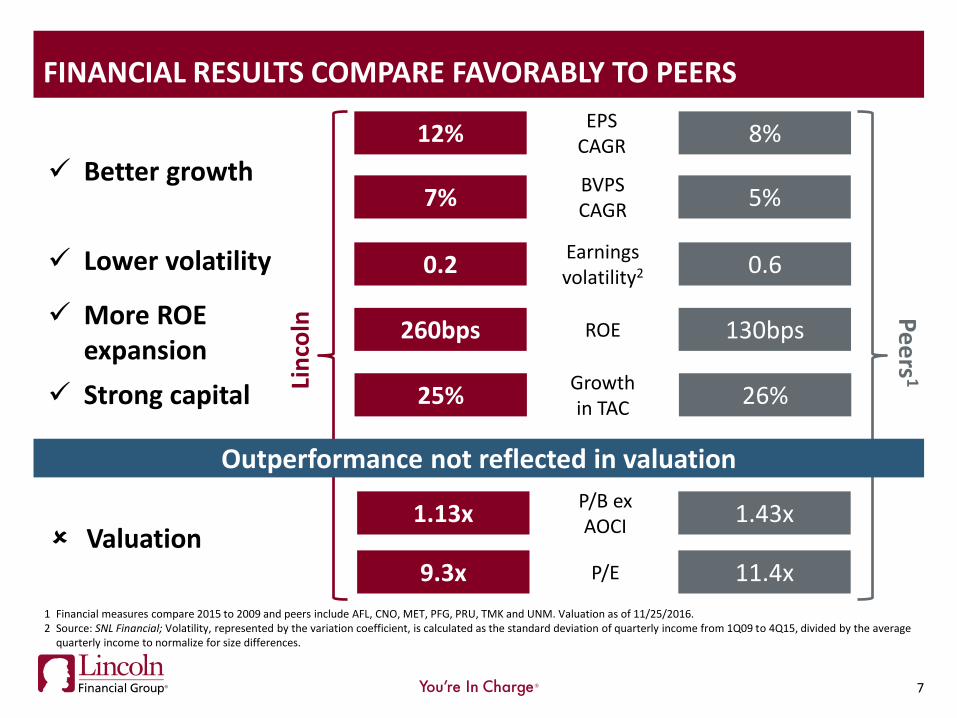
FINANCIAL RESULTS COMPARE FAVORABLY TO PEERS
1 Financial measures compare 2015 to 2009 and peers include AFL, CNO, MET, PFG, PRU, TMK and UNM. Valuation as of 11/25/2016. 2 Source: SNL Financial; Volatility, represented by the variation coefficient, is calculated as the standard deviation of quarterly income from 1Q09 to 4Q15, divided by the average
quarterly income to normalize for size differences.
More ROE expansion
Lower volatility
7%
260bps
0.2
5%
130bps
0.6
Lin
coln
Pe
ers
1
Better growth
12% 8%
Strong capital 25% 26%
BVPS CAGR
ROE
Earnings volatility2
EPS CAGR
Growth in TAC
Outperformance not reflected in valuation
Valuation 1.13x 1.43x
P/B ex AOCI
9.3x 11.4x P/E
6.8% 6.8%
3.4% 3.6%
12.5 12.0
■ Actual ■ Expected
8
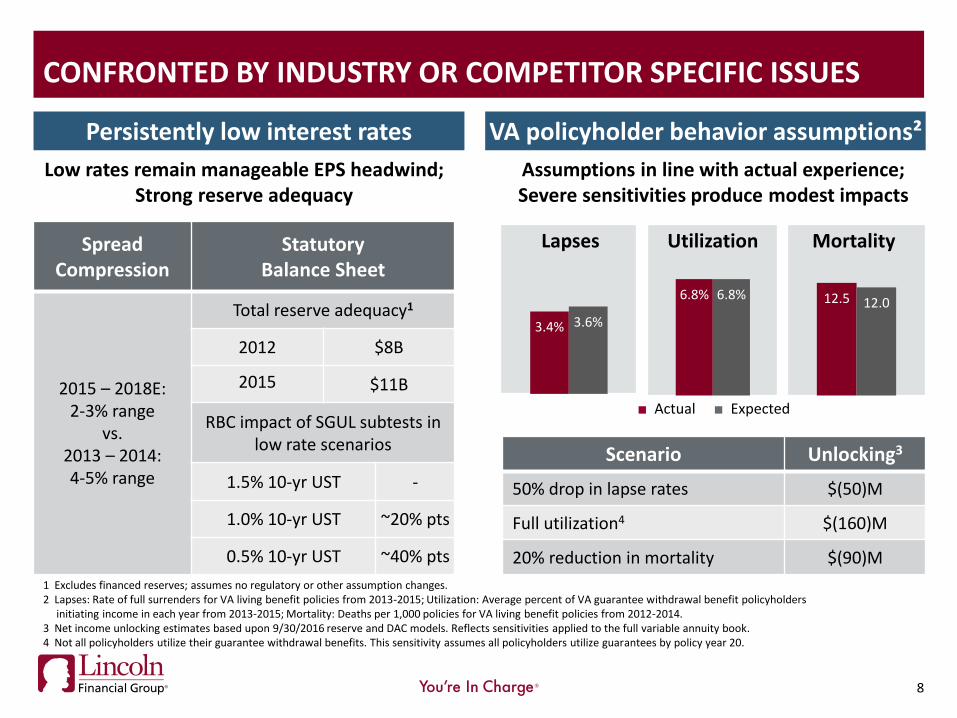
CONFRONTED BY INDUSTRY OR COMPETITOR SPECIFIC ISSUES
1 Excludes financed reserves; assumes no regulatory or other assumption changes. 2 Lapses: Rate of full surrenders for VA living benefit policies from 2013-2015; Utilization: Average percent of VA guarantee withdrawal benefit policyholders initiating income in each year from 2013-2015; Mortality: Deaths per 1,000 policies for VA living benefit policies from 2012-2014. 3 Net income unlocking estimates based upon 9/30/2016 reserve and DAC models. Reflects sensitivities applied to the full variable annuity book. 4 Not all policyholders utilize their guarantee withdrawal benefits. This sensitivity assumes all policyholders utilize guarantees by policy year 20.
Utilization Lapses Mortality
Scenario Unlocking3
50% drop in lapse rates $(50)M
Full utilization4 $(160)M
20% reduction in mortality $(90)M
Assumptions in line with actual experience; Severe sensitivities produce modest impacts
Spread Compression
Statutory Balance Sheet
2015 – 2018E: 2-3% range
vs. 2013 – 2014: 4-5% range
Total reserve adequacy1
2012 $8B
2015 $11B
RBC impact of SGUL subtests in low rate scenarios
1.5% 10-yr UST -
1.0% 10-yr UST ~20% pts
0.5% 10-yr UST ~40% pts
Persistently low interest rates VA policyholder behavior assumptions²
Low rates remain manageable EPS headwind; Strong reserve adequacy
Actions to date
RPS: base spread
9
1%
2%
3%
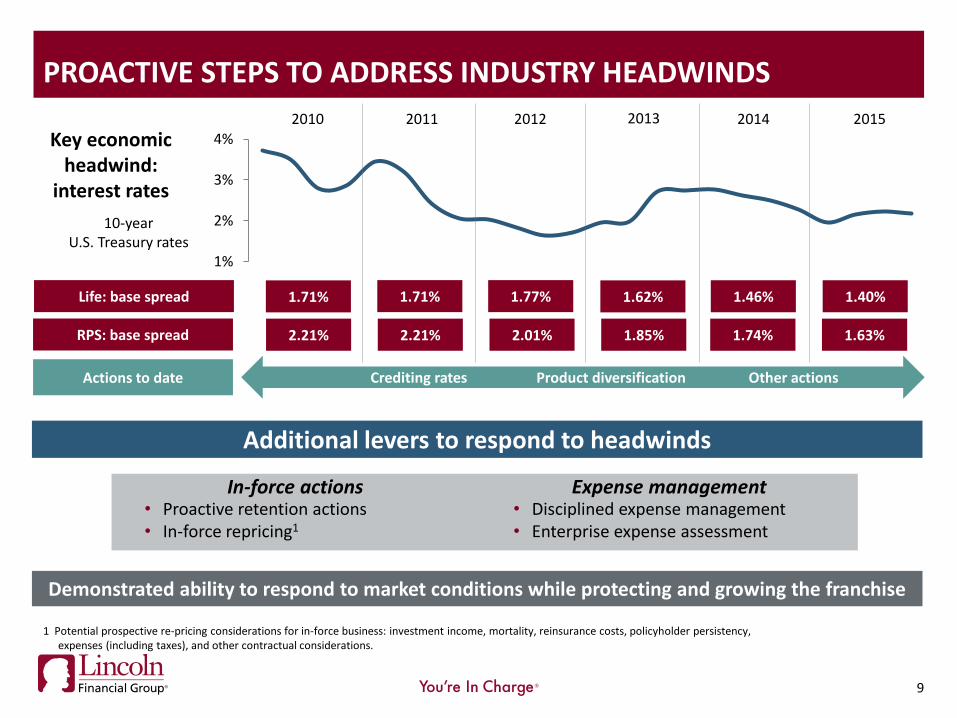
4%2010 2011 2012 2013 2014 2015
Key economic headwind:
interest rates
Demonstrated ability to respond to market conditions while protecting and growing the franchise
Crediting rates Other actions
1 Potential prospective re-pricing considerations for in-force business: investment income, mortality, reinsurance costs, policyholder persistency, expenses (including taxes), and other contractual considerations.
• Proactive retention actions • In-force repricing1
Life: base spread 1.71% 1.71% 1.77% 1.62% 1.46% 1.40%
10-year U.S. Treasury rates
• Disciplined expense management • Enterprise expense assessment
In-force actions
PROACTIVE STEPS TO ADDRESS INDUSTRY HEADWINDS
Additional levers to respond to headwinds
Expense management
Product diversification
2.21% 2.21% 2.01% 1.85% 1.74% 1.63%
0%
4%
8%
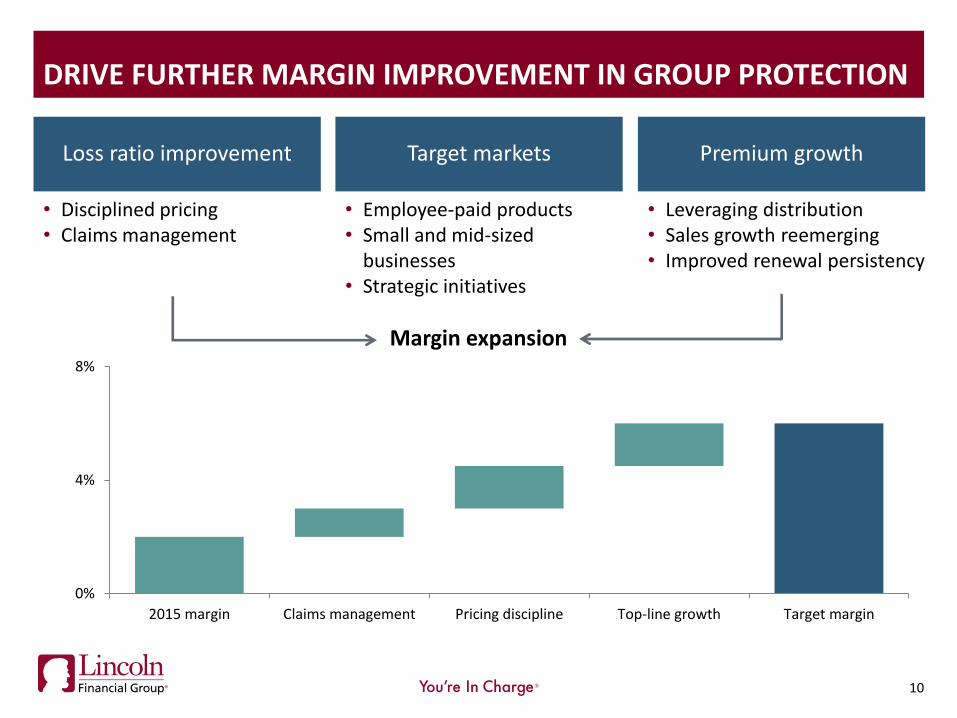
2015 margin Claims management Pricing discipline Top-line growth Target margin
10
Loss ratio improvement Premium growth Target markets
• Disciplined pricing • Claims management
• Employee-paid products • Small and mid-sized
businesses • Strategic initiatives
• Leveraging distribution • Sales growth reemerging • Improved renewal persistency
Margin expansion
DRIVE FURTHER MARGIN IMPROVEMENT IN GROUP PROTECTION
11
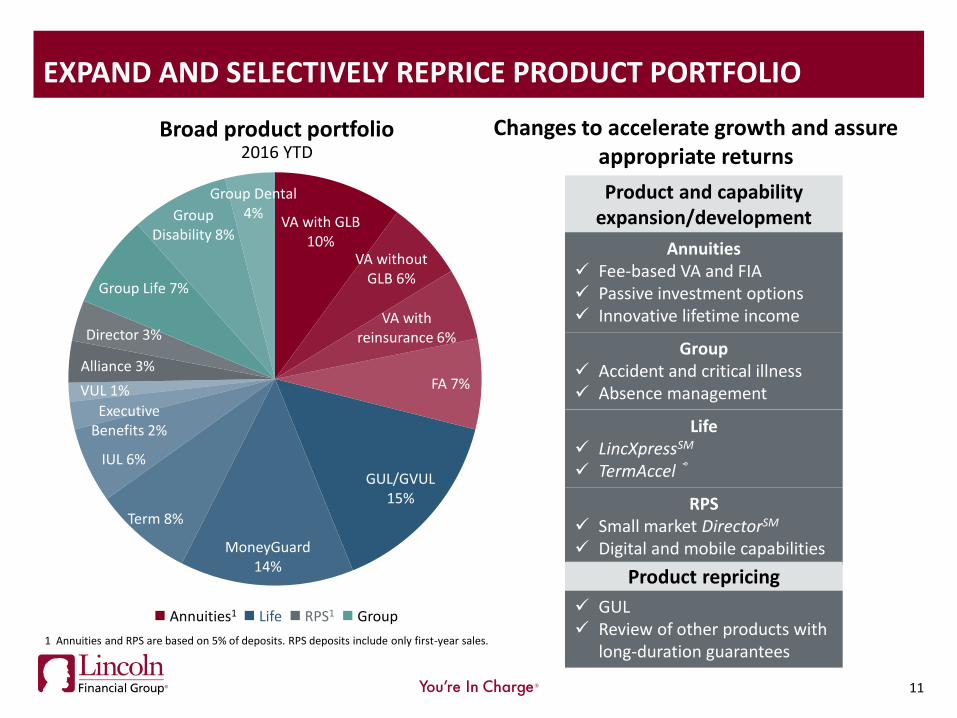
EXPAND AND SELECTIVELY REPRICE PRODUCT PORTFOLIO
Broad product portfolio 2016 YTD
Changes to accelerate growth and assure appropriate returns
Product and capability expansion/development
Annuities Fee-based VA and FIA Passive investment options Innovative lifetime income
Group Accident and critical illness Absence management
Life LincXpressSM
TermAccel ®
RPS Small market DirectorSM Digital and mobile capabilities
GUL Review of other products with
long-duration guarantees
Product repricing
1 Annuities and RPS are based on 5% of deposits. RPS deposits include only first-year sales.
Annuities1 Life RPS1 Group
VA with GLB 10%
VA without GLB 6%
VA with reinsurance 6%
FA 7%
GUL/GVUL 15%
MoneyGuard 14%
Term 8%
IUL 6%
Executive Benefits 2%
VUL 1%
Alliance 3%
Director 3%
Group Life 7%
Group Disability 8%
Group Dental 4%
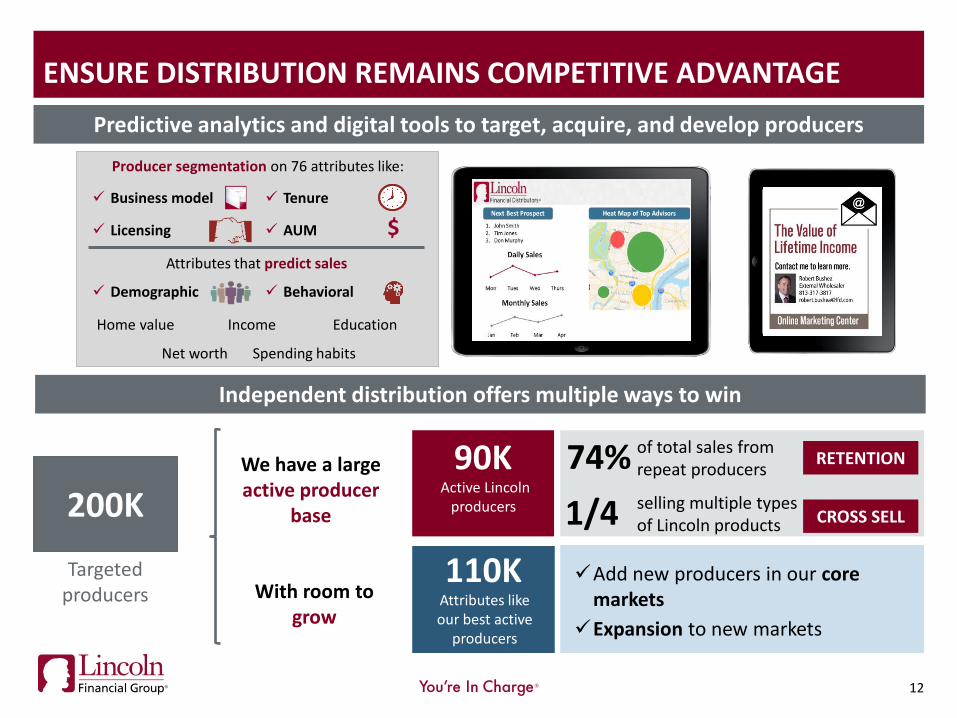
RETENTION We have a large active producer
base
With room to grow
Add new producers in our core markets
Expansion to new markets
of total sales from repeat producers 74%
1/4 selling multiple types of Lincoln products
Predictive analytics and digital tools to target, acquire, and develop producers
CROSS SELL
90K
110K
Active Lincoln producers
Attributes like our best active
producers
Targeted producers
ENSURE DISTRIBUTION REMAINS COMPETITIVE ADVANTAGE
200K
12
$
Producer segmentation on 76 attributes like:
Behavioral Demographic
Tenure
Licensing AUM
Business model
Attributes that predict sales
Home value
Net worth
Income
Spending habits
Education
Independent distribution offers multiple ways to win
13
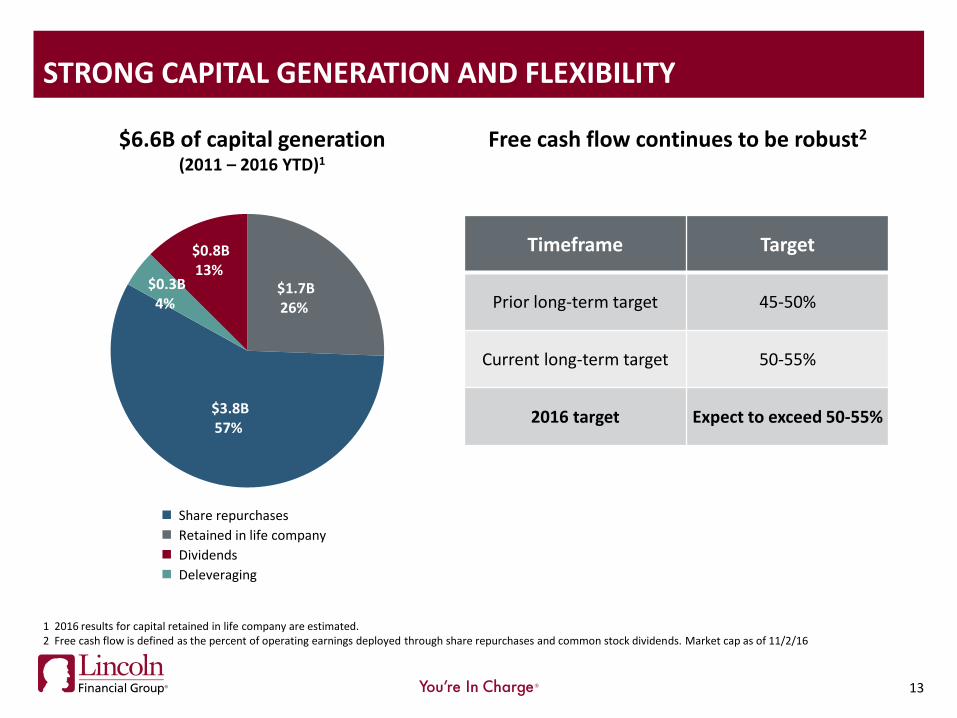
Share repurchases
Retained in life company
Dividends
Deleveraging
STRONG CAPITAL GENERATION AND FLEXIBILITY
$6.6B of capital generation (2011 – 2016 YTD)1
1 2016 results for capital retained in life company are estimated. 2 Free cash flow is defined as the percent of operating earnings deployed through share repurchases and common stock dividends. Market cap as of 11/2/16
$1.7B 26%
$3.8B 57%
$0.8B 13%
$0.3B 4%
Free cash flow continues to be robust2
Timeframe Target
Prior long-term target 45-50%
Current long-term target 50-55%
2016 target Expect to exceed 50-55%

ANNUITIES
14
$0M
$200M
$400M
$600M
$800M
$1,000M
$1,200M
20
09
20
10
20
11
20
12
20
13
20
14
20
15
YTD
15
YTD
16
2015 YTD 2016 YTD
15
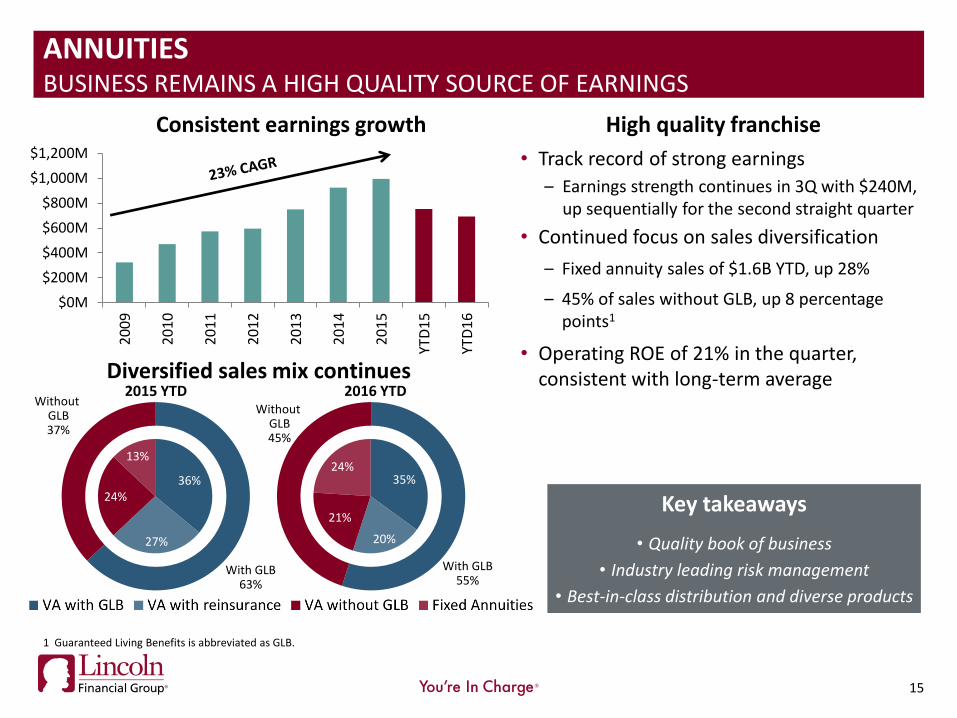
Diversified sales mix continues
1 Guaranteed Living Benefits is abbreviated as GLB.
ANNUITIES BUSINESS REMAINS A HIGH QUALITY SOURCE OF EARNINGS
Consistent earnings growth
With GLB 63%
Without GLB 37%
With GLB 55%
35%
20%
21%
24%
Without GLB 45%
36%
27%
24%
13%
• Track record of strong earnings
– Earnings strength continues in 3Q with $240M, up sequentially for the second straight quarter
• Continued focus on sales diversification
– Fixed annuity sales of $1.6B YTD, up 28%
– 45% of sales without GLB, up 8 percentage points1
• Operating ROE of 21% in the quarter, consistent with long-term average
Key takeaways
• Quality book of business
• Industry leading risk management
• Best-in-class distribution and diverse products
High quality franchise
$(3)B$(2)B$(1)B
$0B$1B$2B$3B
1Q
10
2Q
10
3Q
10
4Q
10
1Q
11
2Q
11
3Q
11
4Q
11
1Q
12
2Q
12
3Q
12
4Q
12
1Q
13
2Q
13
3Q
13
4Q
13
1Q
14
2Q
14
3Q
14
4Q
14
1Q
15
2Q
15
3Q
15
4Q
15
1Q
16
2Q
16
3Q
16
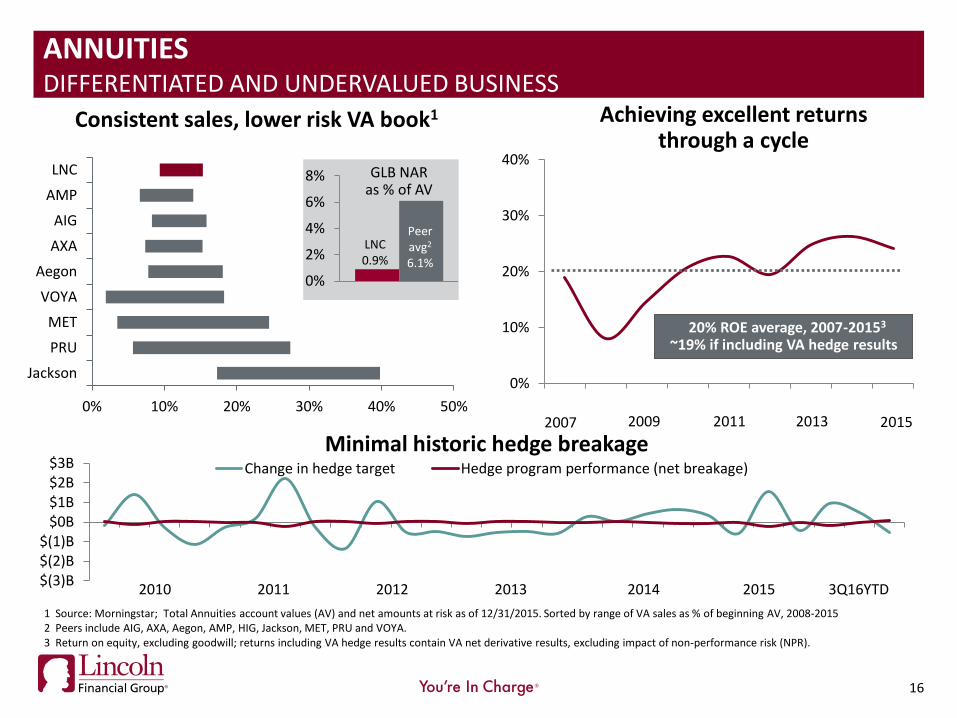
Change in hedge target Hedge program performance (net breakage)
2010 2011 2012 2013 2014 2015 3Q16YTD
0% 10% 20% 30% 40% 50%
LNC
AMP
AIG
AXA
Aegon
VOYA
MET
PRU
Jackson
16
Consistent sales, lower risk VA book1
0%
2%
4%
6%
8% GLB NAR as % of AV
LNC 0.9%
Peer avg2
6.1%
ANNUITIES DIFFERENTIATED AND UNDERVALUED BUSINESS
Minimal historic hedge breakage
Achieving excellent returns through a cycle
0%
10%
20%
30%
40%
20% ROE average, 2007-20153
~19% if including VA hedge results
2007 2009 2011 2013 2015
1 Source: Morningstar; Total Annuities account values (AV) and net amounts at risk as of 12/31/2015. Sorted by range of VA sales as % of beginning AV, 2008-2015 2 Peers include AIG, AXA, Aegon, AMP, HIG, Jackson, MET, PRU and VOYA. 3 Return on equity, excluding goodwill; returns including VA hedge results contain VA net derivative results, excluding impact of non-performance risk (NPR).
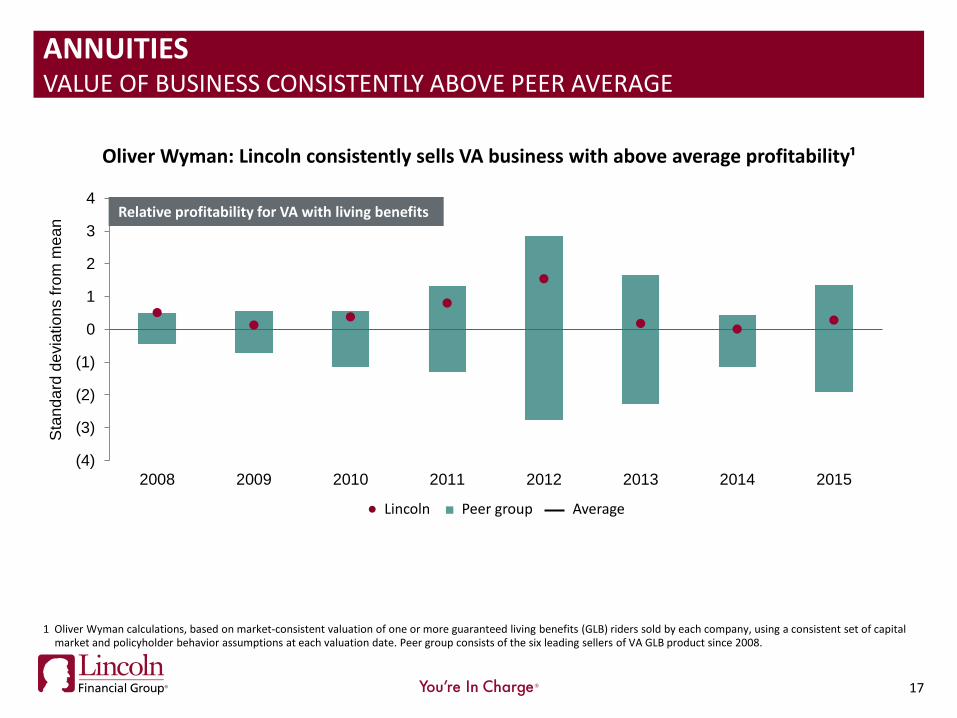
ANNUITIES VALUE OF BUSINESS CONSISTENTLY ABOVE PEER AVERAGE
(4)
(3)
(2)
(1)
0
1
2
3
4
2008 2009 2010 2011 2012 2013 2014 2015
Sta
nd
ard
de
via
tion
s f
rom
me
an
Oliver Wyman: Lincoln consistently sells VA business with above average profitability¹
Relative profitability for VA with living benefits
17
● Lincoln ■ Peer group Average
1 Oliver Wyman calculations, based on market‐consistent valuation of one or more guaranteed living benefits (GLB) riders sold by each company, using a consistent set of capital market and policyholder behavior assumptions at each valuation date. Peer group consists of the six leading sellers of VA GLB product since 2008.
18 18
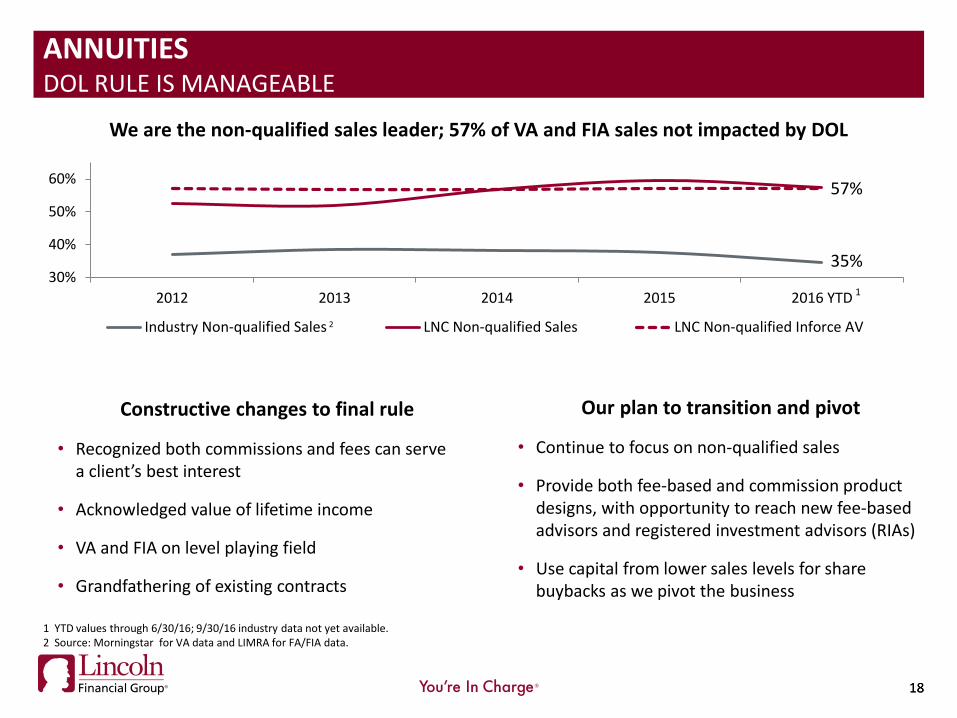
ANNUITIES DOL RULE IS MANAGEABLE
Our plan to transition and pivot
• Continue to focus on non-qualified sales
• Provide both fee-based and commission product designs, with opportunity to reach new fee-based advisors and registered investment advisors (RIAs)
• Use capital from lower sales levels for share buybacks as we pivot the business
We are the non-qualified sales leader; 57% of VA and FIA sales not impacted by DOL
Constructive changes to final rule
• Recognized both commissions and fees can serve a client’s best interest
• Acknowledged value of lifetime income
• VA and FIA on level playing field
• Grandfathering of existing contracts
35%
57%
30%
40%
50%
60%
2012 2013 2014 2015 2016 YTD
Industry Non-qualified Sales LNC Non-qualified Sales LNC Non-qualified Inforce AV
1 YTD values through 6/30/16; 9/30/16 industry data not yet available. 2 Source: Morningstar for VA data and LIMRA for FA/FIA data.
1
2

RETIREMENT PLAN SERVICES
19
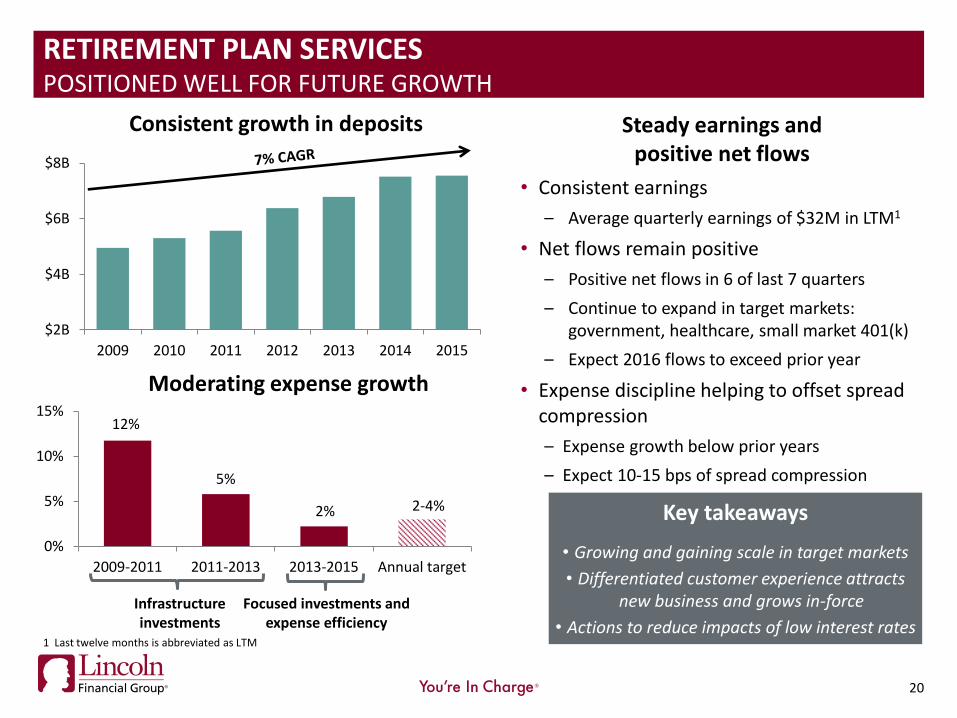
Steady earnings and positive net flows
• Consistent earnings
– Average quarterly earnings of $32M in LTM1
• Net flows remain positive
– Positive net flows in 6 of last 7 quarters
– Continue to expand in target markets: government, healthcare, small market 401(k)
– Expect 2016 flows to exceed prior year
• Expense discipline helping to offset spread compression
– Expense growth below prior years
– Expect 10-15 bps of spread compression
20
RETIREMENT PLAN SERVICES POSITIONED WELL FOR FUTURE GROWTH
Key takeaways
• Growing and gaining scale in target markets
• Differentiated customer experience attracts new business and grows in-force
• Actions to reduce impacts of low interest rates
Moderating expense growth
12%
5%
2%
0%
5%
10%
15%
2009-2011 2011-2013 2013-2015 Annual target
2-4%
Focused investments and expense efficiency
$2B
$4B
$6B
$8B
2009 2010 2011 2012 2013 2014 2015
Consistent growth in deposits
1 Last twelve months is abbreviated as LTM
Infrastructure investments
21
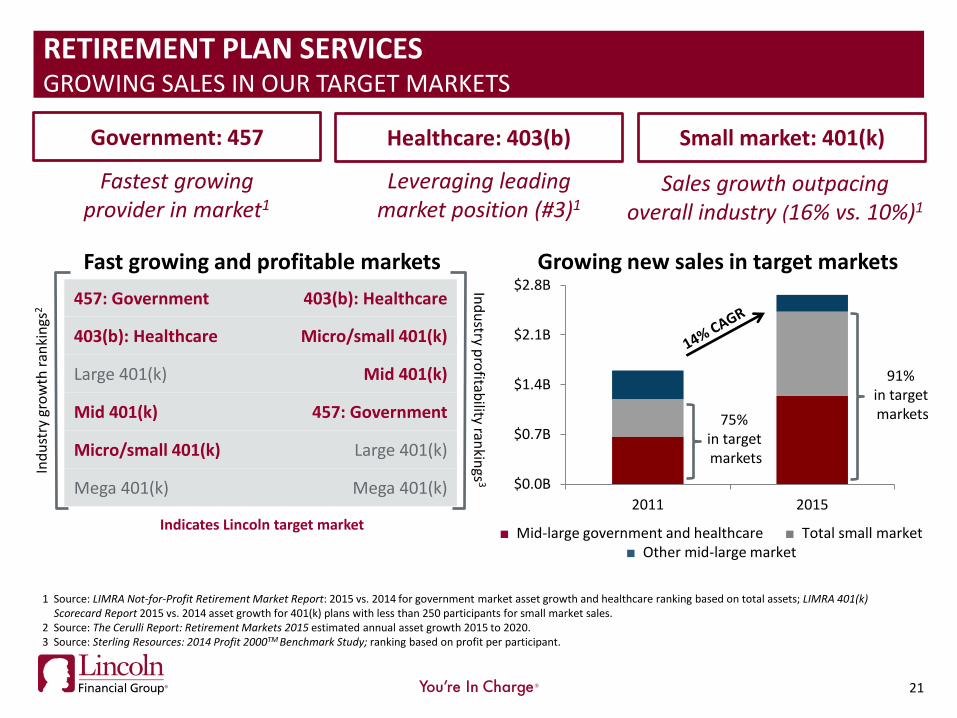
Government: 457
Healthcare: 403(b) Small market: 401(k)
Fastest growing provider in market1
Leveraging leading market position (#3)1
Sales growth outpacing overall industry (16% vs. 10%)1
21
1 Source: LIMRA Not-for-Profit Retirement Market Report: 2015 vs. 2014 for government market asset growth and healthcare ranking based on total assets; LIMRA 401(k) Scorecard Report 2015 vs. 2014 asset growth for 401(k) plans with less than 250 participants for small market sales.
2 Source: The Cerulli Report: Retirement Markets 2015 estimated annual asset growth 2015 to 2020. 3 Source: Sterling Resources: 2014 Profit 2000TM Benchmark Study; ranking based on profit per participant.
$0.0B
$0.7B
$1.4B
$2.1B
$2.8B
2011 2015
Growing new sales in target markets
■ Mid-large government and healthcare ■ Total small market ■ Other mid-large market
91% in target markets 75%
in target markets
Ind
ust
ry g
row
th r
anki
ngs
2
Ind
ustry p
rofitab
ility rankin
gs3
Fast growing and profitable markets
457: Government 403(b): Healthcare
403(b): Healthcare Micro/small 401(k)
Large 401(k) Mid 401(k)
Mid 401(k) 457: Government
Micro/small 401(k) Large 401(k)
Mega 401(k) Mega 401(k)
Indicates Lincoln target market
RETIREMENT PLAN SERVICES GROWING SALES IN OUR TARGET MARKETS
22
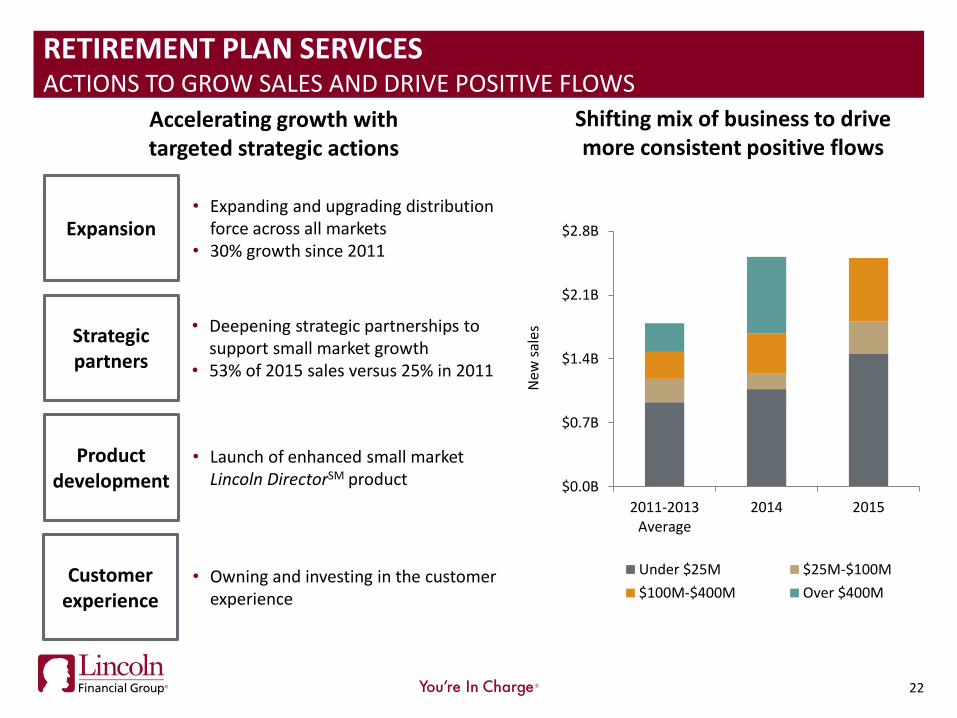
Shifting mix of business to drive more consistent positive flows
Accelerating growth with targeted strategic actions
Expansion
Strategic partners
Product development
Customer experience
• Expanding and upgrading distribution force across all markets
• 30% growth since 2011
• Deepening strategic partnerships to support small market growth
• 53% of 2015 sales versus 25% in 2011
• Launch of enhanced small market Lincoln DirectorSM product
• Owning and investing in the customer experience
$0.0B
$0.7B
$1.4B
$2.1B
$2.8B
2011-2013Average
2014 2015
New
sal
es
Under $25M $25M-$100M
$100M-$400M Over $400M
RETIREMENT PLAN SERVICES ACTIONS TO GROW SALES AND DRIVE POSITIVE FLOWS
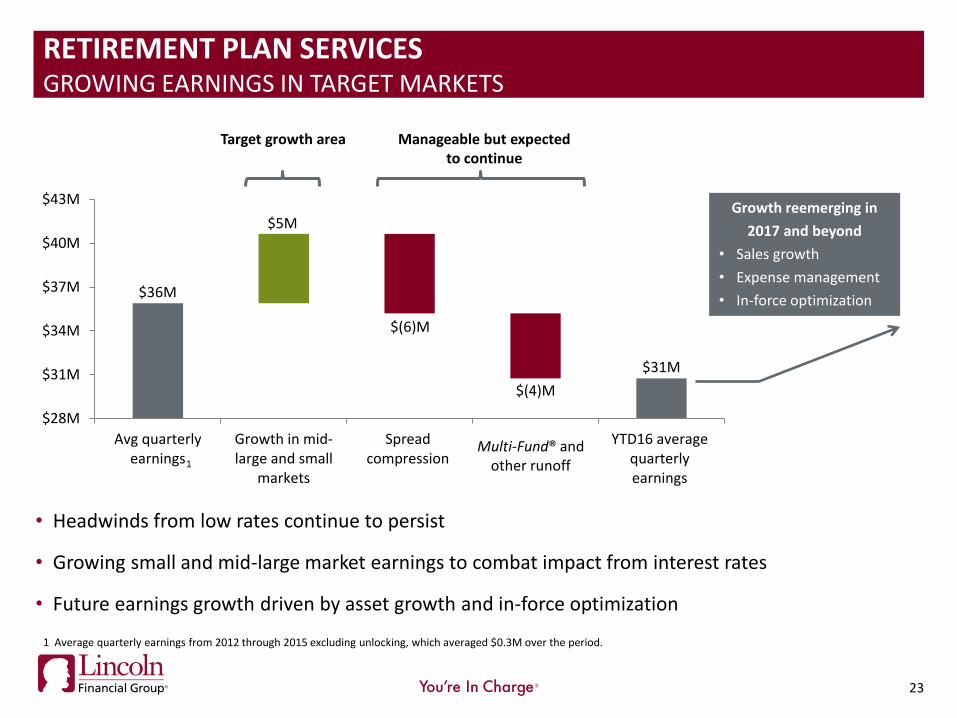
$36M
$31M
$5M
$(6)M
$(4)M
$28M
$31M
$34M
$37M
$40M
$43M
Avg quarterlyearnings
Growth in mid-large and small
markets
Spreadcompression
Multi-Fund® andOther Run-off
YTD16 averagequarterlyearnings
23
RETIREMENT PLAN SERVICES GROWING EARNINGS IN TARGET MARKETS
• Headwinds from low rates continue to persist
• Growing small and mid-large market earnings to combat impact from interest rates
• Future earnings growth driven by asset growth and in-force optimization
Multi-Fund® and other runoff
1 Average quarterly earnings from 2012 through 2015 excluding unlocking, which averaged $0.3M over the period.
Target growth area Manageable but expected to continue
Growth reemerging in
2017 and beyond
• Sales growth
• Expense management
• In-force optimization
1

LIFE INSURANCE
24
2016 YTD
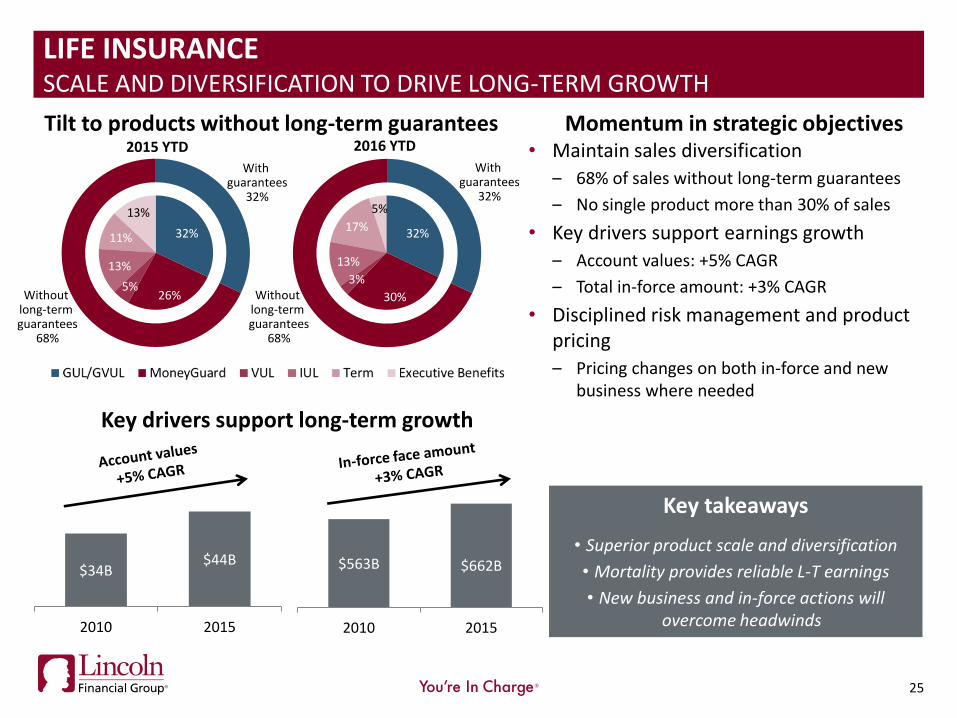
Tilt to products without long-term guarantees 2015 YTD
25
LIFE INSURANCE SCALE AND DIVERSIFICATION TO DRIVE LONG-TERM GROWTH
Momentum in strategic objectives • Maintain sales diversification
– 68% of sales without long-term guarantees
– No single product more than 30% of sales
• Key drivers support earnings growth
– Account values: +5% CAGR
– Total in-force amount: +3% CAGR
• Disciplined risk management and product pricing
– Pricing changes on both in-force and new business where needed
With guarantees
32%
32%
30%
3%
13%
17%
5%
Without long-term guarantees
68%
With guarantees
32%
Without long-term guarantees
68%
Key takeaways
• Superior product scale and diversification
• Mortality provides reliable L-T earnings
• New business and in-force actions will overcome headwinds
$34B $44B
2010 2015
$563B
$662B
2010 2015
Key drivers support long-term growth
32%
26% 5%
13%
11%
13%
10
9
8
7
6
5
4
Lincoln
2
1
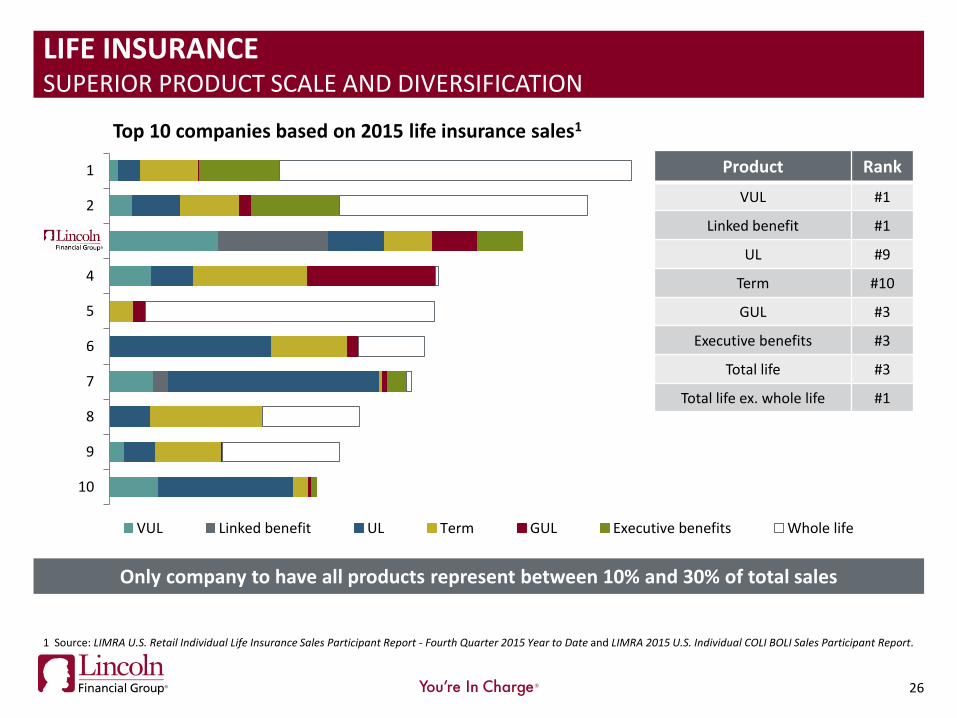
Top 10 companies based on 2015 life insurance sales1
VUL Linked benefit UL Term GUL Executive benefits Whole life
Only company to have all products represent between 10% and 30% of total sales
26
Product Rank
VUL #1
Linked benefit #1
UL #9
Term #10
GUL #3
Executive benefits #3
Total life #3
Total life ex. whole life #1
1 Source: LIMRA U.S. Retail Individual Life Insurance Sales Participant Report - Fourth Quarter 2015 Year to Date and LIMRA 2015 U.S. Individual COLI BOLI Sales Participant Report.
LIFE INSURANCE SUPERIOR PRODUCT SCALE AND DIVERSIFICATION
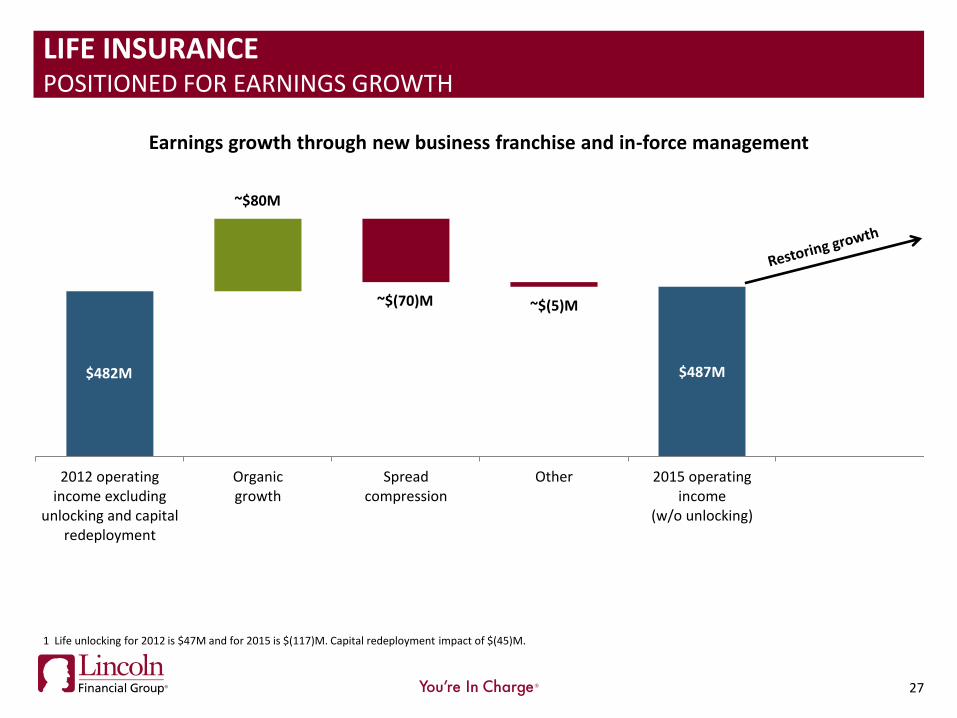
$487M
2012 operatingincome excluding
unlocking and capitalredeployment
Organicgrowth
Spreadcompression
Other 2015 operatingincome
(w/o unlocking)
27
LIFE INSURANCE POSITIONED FOR EARNINGS GROWTH
~$80M
~$(70)M ~$(5)M
Earnings growth through new business franchise and in-force management
1 Life unlocking for 2012 is $47M and for 2015 is $(117)M. Capital redeployment impact of $(45)M.
$482M

GROUP PROTECTION
28
55%
60%
65%
70%
75%
80%
85%
3Q
12
4Q
12
1Q
13
2Q
13
3Q
13
4Q
13
1Q
14
2Q
14
3Q
14
4Q
14
1Q
15
2Q
15
3Q
15
4Q
15
1Q
16
2Q
16
3Q
16
Non-medical LR TTM Non-medical LR
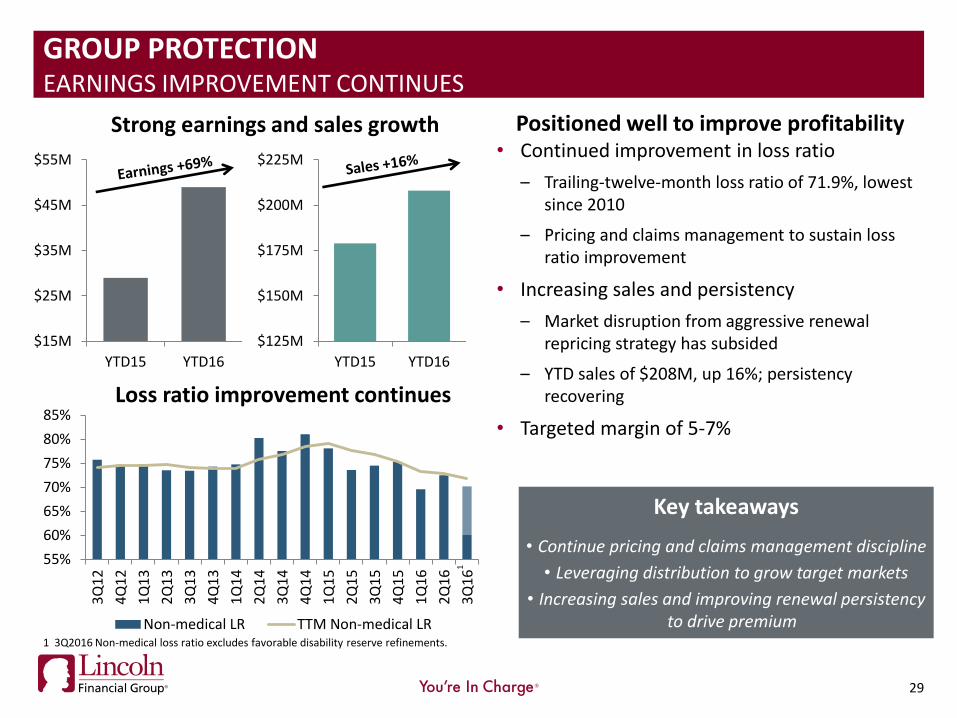
Positioned well to improve profitability • Continued improvement in loss ratio
– Trailing-twelve-month loss ratio of 71.9%, lowest since 2010
– Pricing and claims management to sustain loss ratio improvement
• Increasing sales and persistency
– Market disruption from aggressive renewal repricing strategy has subsided
– YTD sales of $208M, up 16%; persistency recovering
• Targeted margin of 5-7%
29
GROUP PROTECTION EARNINGS IMPROVEMENT CONTINUES
Strong earnings and sales growth
Loss ratio improvement continues
$15M
$25M
$35M
$45M
$55M
YTD15 YTD16
Key takeaways
• Continue pricing and claims management discipline
• Leveraging distribution to grow target markets
• Increasing sales and improving renewal persistency to drive premium
$125M
$150M
$175M
$200M
$225M
YTD15 YTD16
1 3Q2016 Non-medical loss ratio excludes favorable disability reserve refinements.
1
30
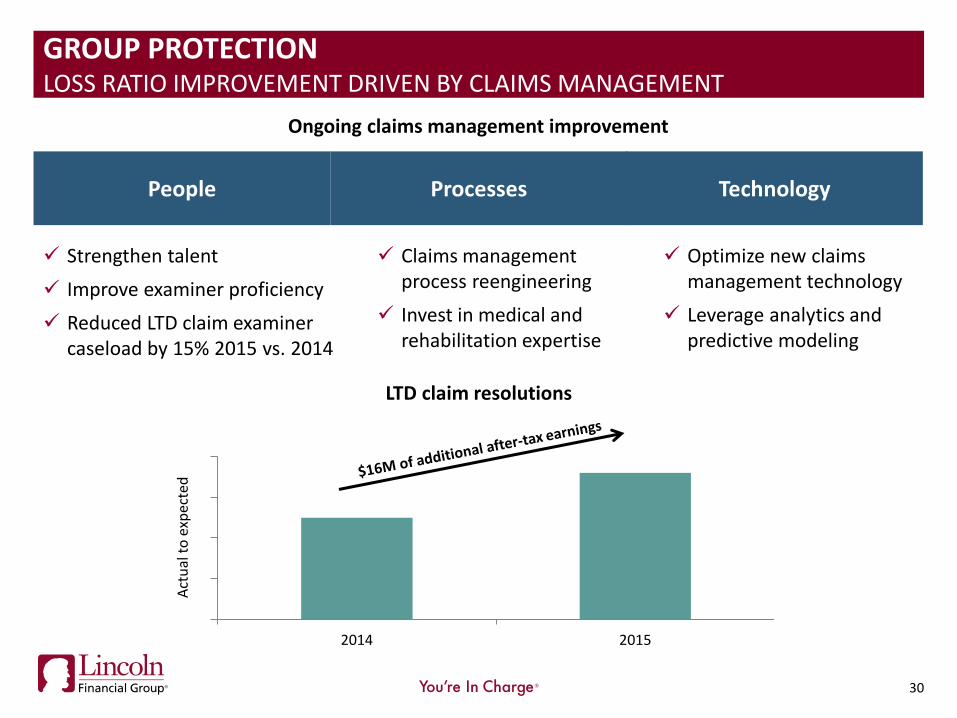
GROUP PROTECTION LOSS RATIO IMPROVEMENT DRIVEN BY CLAIMS MANAGEMENT
Optimize new claims management technology
Leverage analytics and predictive modeling
Strengthen talent
Improve examiner proficiency
Reduced LTD claim examiner caseload by 15% 2015 vs. 2014
Claims management process reengineering
Invest in medical and rehabilitation expertise
Technology People Processes
Ongoing claims management improvement
120%
130%
140%
150%
160%
2014 2015
Act
ual
to
exp
ecte
d
LTD claim resolutions
31
Consumer marketing
Data and analytics
Education and advice
Customer buying experience
Service delivery
Onboarding process and data exchange
Selling and renewal processes
Value added services – absence management
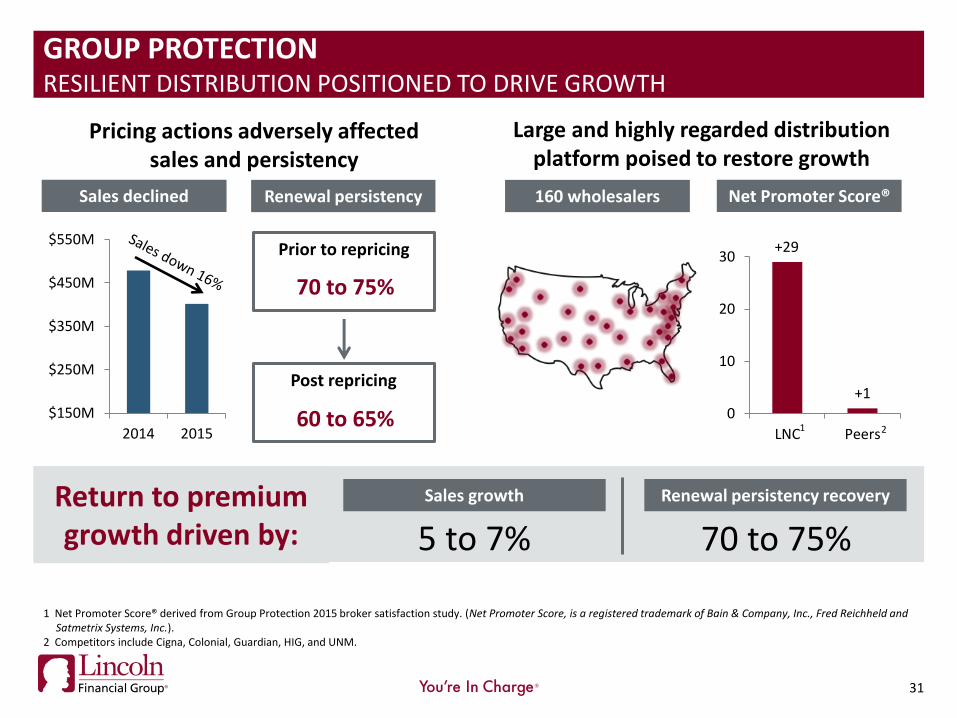
+29
+1
0
10
20
30
LNC Peers2
Pricing actions adversely affected sales and persistency
Large and highly regarded distribution platform poised to restore growth
1
5 to 7%
Sales growth Renewal persistency recovery
70 to 75%
Return to premium growth driven by:
$150M
$250M
$350M
$450M
$550M
2014 2015
Sales declined Renewal persistency
Prior to repricing
70 to 75%
Post repricing
60 to 65%
160 wholesalers Net Promoter Score®
1 Net Promoter Score® derived from Group Protection 2015 broker satisfaction study. (Net Promoter Score, is a registered trademark of Bain & Company, Inc., Fred Reichheld and Satmetrix Systems, Inc.).
2 Competitors include Cigna, Colonial, Guardian, HIG, and UNM.
GROUP PROTECTION RESILIENT DISTRIBUTION POSITIONED TO DRIVE GROWTH
APPENDIX
32
33
33
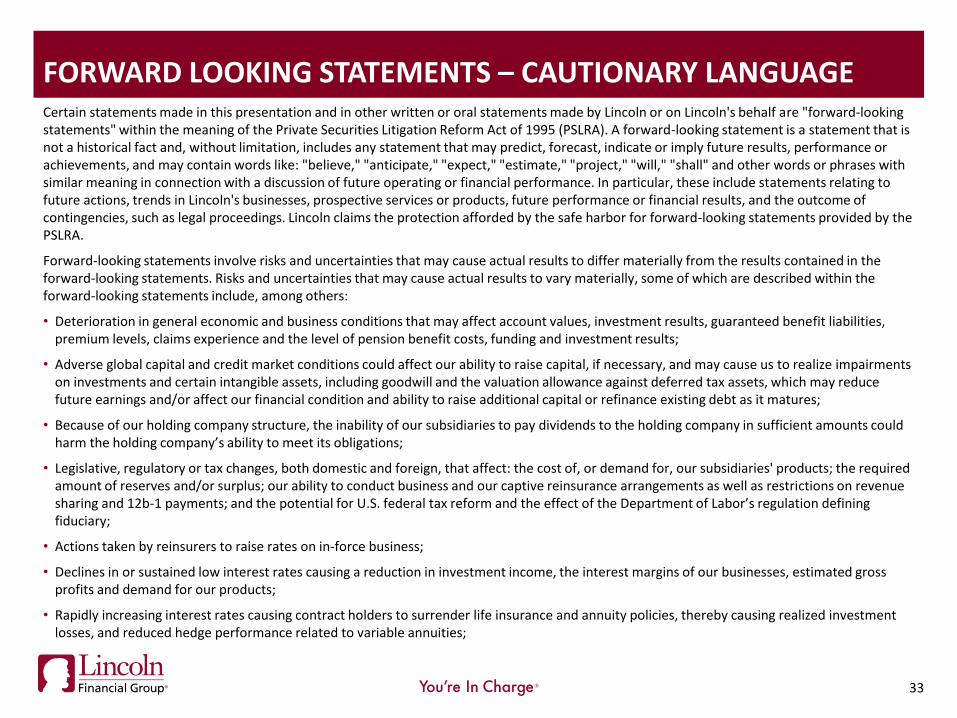
FORWARD LOOKING STATEMENTS – CAUTIONARY LANGUAGE Certain statements made in this presentation and in other written or oral statements made by Lincoln or on Lincoln's behalf are "forward-looking statements" within the meaning of the Private Securities Litigation Reform Act of 1995 (PSLRA). A forward-looking statement is a statement that is not a historical fact and, without limitation, includes any statement that may predict, forecast, indicate or imply future results, performance or achievements, and may contain words like: "believe," "anticipate," "expect," "estimate," "project," "will," "shall" and other words or phrases with similar meaning in connection with a discussion of future operating or financial performance. In particular, these include statements relating to future actions, trends in Lincoln's businesses, prospective services or products, future performance or financial results, and the outcome of contingencies, such as legal proceedings. Lincoln claims the protection afforded by the safe harbor for forward-looking statements provided by the PSLRA.
Forward-looking statements involve risks and uncertainties that may cause actual results to differ materially from the results contained in the forward-looking statements. Risks and uncertainties that may cause actual results to vary materially, some of which are described within the forward-looking statements include, among others:
• Deterioration in general economic and business conditions that may affect account values, investment results, guaranteed benefit liabilities, premium levels, claims experience and the level of pension benefit costs, funding and investment results;
• Adverse global capital and credit market conditions could affect our ability to raise capital, if necessary, and may cause us to realize impairments on investments and certain intangible assets, including goodwill and the valuation allowance against deferred tax assets, which may reduce future earnings and/or affect our financial condition and ability to raise additional capital or refinance existing debt as it matures;
• Because of our holding company structure, the inability of our subsidiaries to pay dividends to the holding company in sufficient amounts could harm the holding company’s ability to meet its obligations;
• Legislative, regulatory or tax changes, both domestic and foreign, that affect: the cost of, or demand for, our subsidiaries' products; the required amount of reserves and/or surplus; our ability to conduct business and our captive reinsurance arrangements as well as restrictions on revenue sharing and 12b-1 payments; and the potential for U.S. federal tax reform and the effect of the Department of Labor’s regulation defining fiduciary;
• Actions taken by reinsurers to raise rates on in-force business;
• Declines in or sustained low interest rates causing a reduction in investment income, the interest margins of our businesses, estimated gross profits and demand for our products;
• Rapidly increasing interest rates causing contract holders to surrender life insurance and annuity policies, thereby causing realized investment losses, and reduced hedge performance related to variable annuities;
34
34
FORWARD LOOKING STATEMENTS – CAUTIONARY LANGUAGE (CONT.)
• Uncertainty about the effect of rules and regulations to be promulgated under the Dodd-Frank Wall Street Reform and Consumer Protection Act on us and the economy, and financial services sector in particular;
• The initiation of legal or regulatory proceedings against us, and the outcome of any legal or regulatory proceedings, such as: adverse actions related to present or past business practices common in businesses in which we compete; adverse decisions in significant actions including, but not limited to, actions brought by federal and state authorities and class action cases; new decisions that result in changes in law; and unexpected trial court rulings;
• A decline in the equity markets causing a reduction in the sales of our subsidiaries' products; a reduction of asset-based fees that our subsidiaries charge on various investment and insurance products; an acceleration of the net amortization of deferred acquisition costs, or "DAC;" value of business acquired, or "VOBA;" deferred sales inducements, or "DSI;" and deferred front end sales loads, or "DFEL;" and an increase in liabilities related to guaranteed benefit features of our subsidiaries' variable annuity products;
• Ineffectiveness of our risk management policies and procedures, including various hedging strategies used to offset the effect of changes in the value of liabilities due to changes in the level and volatility of the equity markets and interest rates;
• A deviation in actual experience regarding future persistency, mortality, morbidity, interest rates or equity market returns from the assumptions used in pricing our subsidiaries' products, in establishing related insurance reserves and in the net amortization of DAC, VOBA, DSI and DFEL, which may reduce future earnings;
• Changes in accounting principles generally accepted in the United States, or "GAAP," including convergence with International Financial Reporting Standards (IFRS), that may result in unanticipated changes to our net income;
• Lowering of one or more of our debt ratings issued by nationally recognized statistical rating organizations and the adverse effect such action may have on our ability to raise capital and on our liquidity and financial condition;
• Lowering of one or more of the insurer financial strength ratings of our insurance subsidiaries and the adverse effect such action may have on the premium writings, policy retention, profitability of our insurance subsidiaries and liquidity;
• Significant credit, accounting, fraud, corporate governance or other issues that may adversely affect the value of certain investments in our portfolios as well as counterparties to which we are exposed to credit risk requiring that we realize losses on investments;
• Inability to protect our intellectual property rights or claims of infringement of the intellectual property rights of others;
• Interruption in telecommunication, information technology or other operational systems, or failure to safeguard the confidentiality or privacy of sensitive data on such systems from cyberattacks or other breaches of our data security systems;
35
• The effect of acquisitions and divestitures, restructurings, product withdrawals and other unusual items;
• The adequacy and collectability of reinsurance that we have purchased;
• Acts of terrorism, a pandemic, war or other man-made and natural catastrophes that may adversely affect our businesses and the cost and availability of reinsurance;
• Competitive conditions, including pricing pressures, new product offerings and the emergence of new competitors, that may affect the level of premiums and fees that our subsidiaries can charge for their products;
• The unknown effect on our subsidiaries' businesses resulting from changes in the demographics of their client base, as aging baby-boomers move from the asset-accumulation stage to the asset-distribution stage of life; and
• Loss of key management, financial planners or wholesalers.
The risks included here are not exhaustive. Our annual report on Form 10-K, quarterly reports on Form 10-Q, current reports on Form 8-K and other documents filed with the SEC include additional factors which could impact our business and financial performance. Moreover, we operate in a rapidly changing and competitive environment. New risk factors emerge from time to time, and it is not possible for management to predict all such risk factors.
Further, it is not possible to assess the impact of all risk factors on our businesses or the extent to which any factor, or combination of factors, may cause actual results to differ materially from those contained in any forward-looking statements. Given these risks and uncertainties, investors should not place undue reliance on forward-looking statements as a prediction of actual results. In addition, Lincoln disclaims any obligation to update any forward-looking statements to reflect events or circumstances that occur after the date of this presentation.
The reporting of RBC measures is not intended for the purpose of ranking any insurance company or for use in connection with any marketing, advertising or promotional activities.
FORWARD LOOKING STATEMENTS – CAUTIONARY LANGUAGE (CONT.)
36
RECONCILIATION NET INCOME TO INCOME FROM OPERATIONS
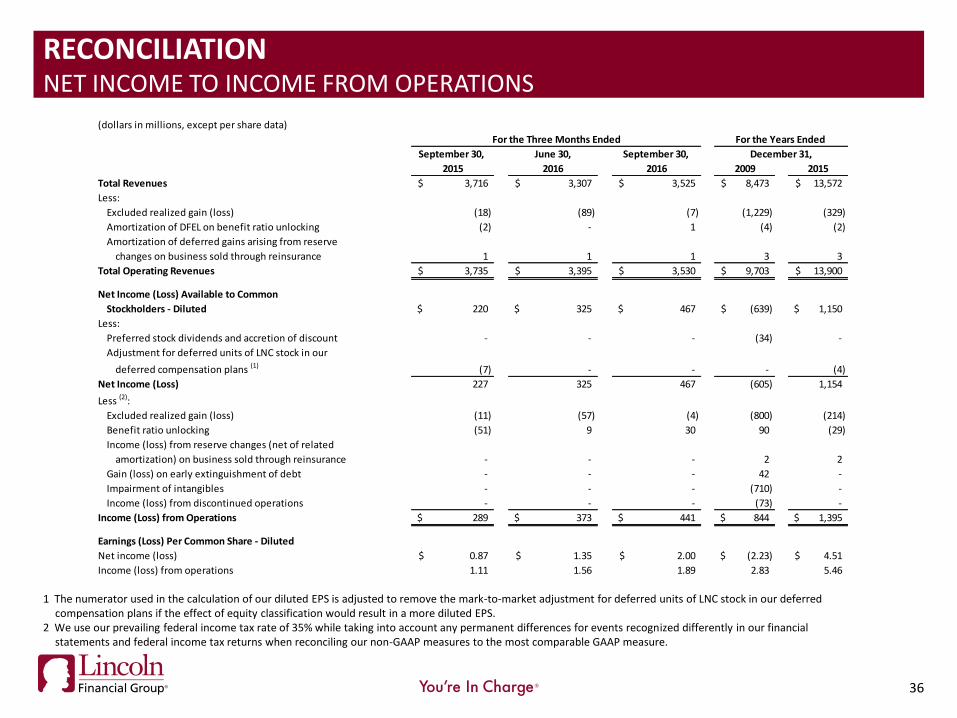
1 The numerator used in the calculation of our diluted EPS is adjusted to remove the mark-to-market adjustment for deferred units of LNC stock in our deferred compensation plans if the effect of equity classification would result in a more diluted EPS.
2 We use our prevailing federal income tax rate of 35% while taking into account any permanent differences for events recognized differently in our financial statements and federal income tax returns when reconciling our non-GAAP measures to the most comparable GAAP measure.
(dollars in millions, except per share data)
September 30, June 30, September 30,
2015 2016 2016 2009 2015
Total Revenues 3,716$ 3,307$ 3,525$ 8,473$ 13,572$
Less:
Excluded realized gain (loss) (18) (89) (7) (1,229) (329)
Amortization of DFEL on benefit ratio unlocking (2) - 1 (4) (2)
Amortization of deferred gains arising from reserve
changes on business sold through reinsurance 1 1 1 3 3
Total Operating Revenues 3,735$ 3,395$ 3,530$ 9,703$ 13,900$
Net Income (Loss) Available to Common
Stockholders - Diluted 220$ 325$ 467$ (639)$ 1,150$
Less:
Preferred stock dividends and accretion of discount - - - (34) -
Adjustment for deferred units of LNC stock in our
deferred compensation plans (1) (7) - - - (4)
Net Income (Loss) 227 325 467 (605) 1,154
Less (2):
Excluded realized gain (loss) (11) (57) (4) (800) (214)
Benefit ratio unlocking (51) 9 30 90 (29)
Income (loss) from reserve changes (net of related
amortization) on business sold through reinsurance - - - 2 2
Gain (loss) on early extinguishment of debt - - - 42 -
Impairment of intangibles - - - (710) -
Income (loss) from discontinued operations - - - (73) -
Income (Loss) from Operations 289$ 373$ 441$ 844$ 1,395$
Earnings (Loss) Per Common Share - Diluted
Net income (loss) 0.87$ 1.35$ 2.00$ (2.23)$ 4.51$
Income (loss) from operations 1.11 1.56 1.89 2.83 5.46
For the Three Months Ended
December 31,
For the Years Ended
37
RECONCILIATION BOOK VALUE PER SHARE AND RETURN ON EQUITY
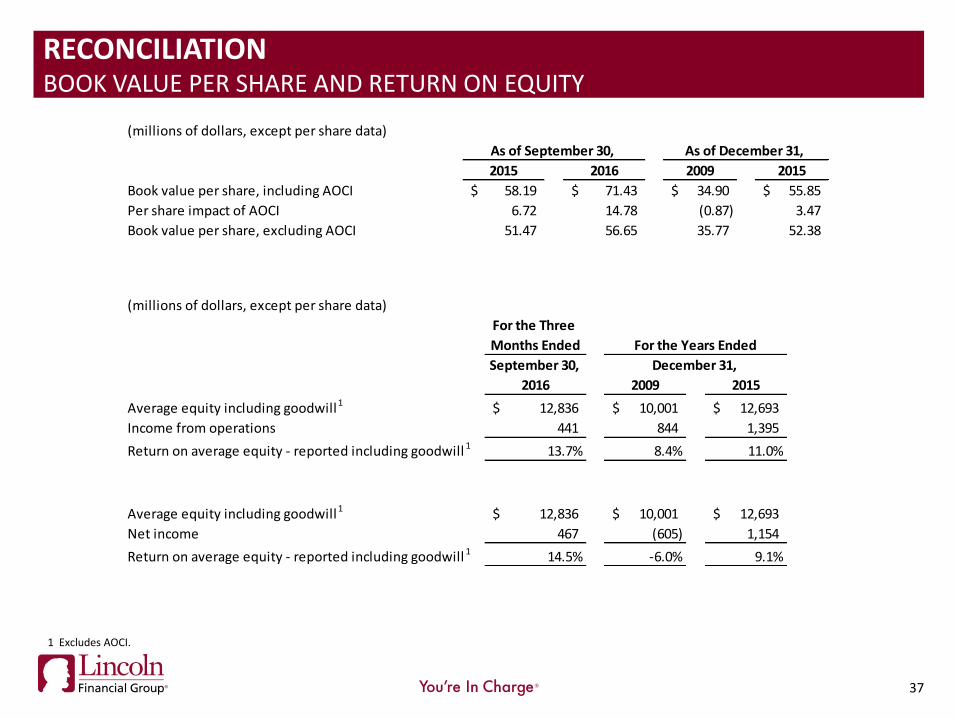
1 Excludes AOCI.
(millions of dollars, except per share data)
2015 2016 2009 2015
Book value per share, including AOCI 58.19$ 71.43$ 34.90$ 55.85$
Per share impact of AOCI 6.72 14.78 (0.87) 3.47
Book value per share, excluding AOCI 51.47 56.65 35.77 52.38
As of December 31, As of September 30,
(millions of dollars, except per share data)
For the Three
Months Ended
September 30,
2016 2009 2015
Average equity including goodwill1 12,836$ 10,001$ 12,693$
Income from operations 441 844 1,395
Return on average equity - reported including goodwill 1 13.7% 8.4% 11.0%
Average equity including goodwill1 12,836$ 10,001$ 12,693$
Net income 467 (605) 1,154
Return on average equity - reported including goodwill 1 14.5% -6.0% 9.1%
December 31,
For the Years Ended
38
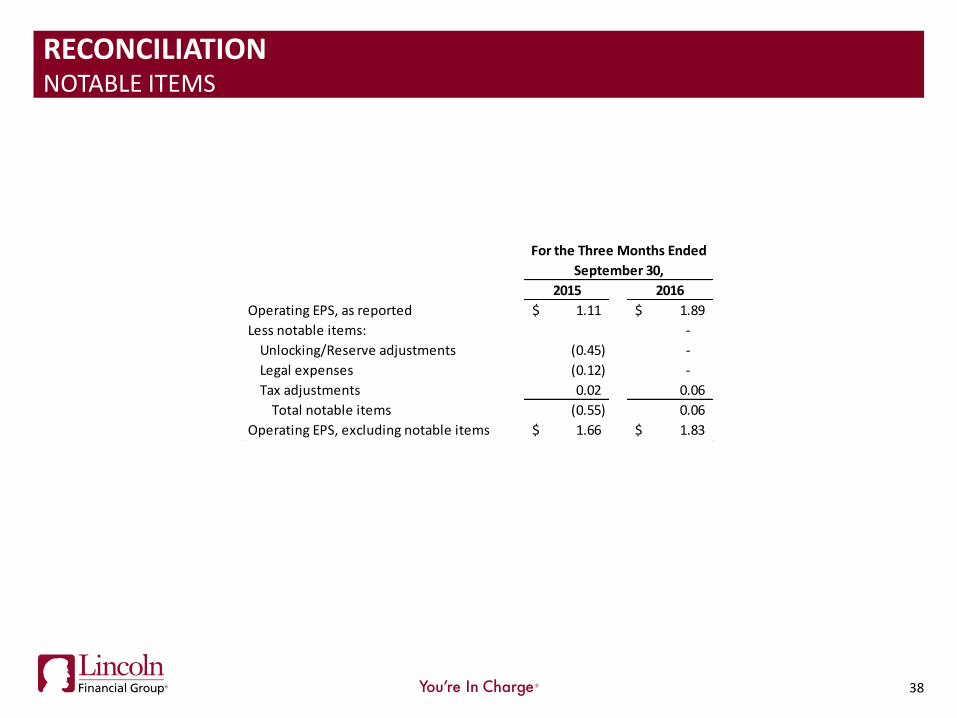
RECONCILIATION NOTABLE ITEMS
September 30,
2015 2016
Operating EPS, as reported 1.11$ 1.89$
Less notable items: -
Unlocking/Reserve adjustments (0.45) -
Legal expenses (0.12) -
Tax adjustments 0.02 0.06
Total notable items (0.55) 0.06
Operating EPS, excluding notable items 1.66$ 1.83$
For the Three Months Ended
39
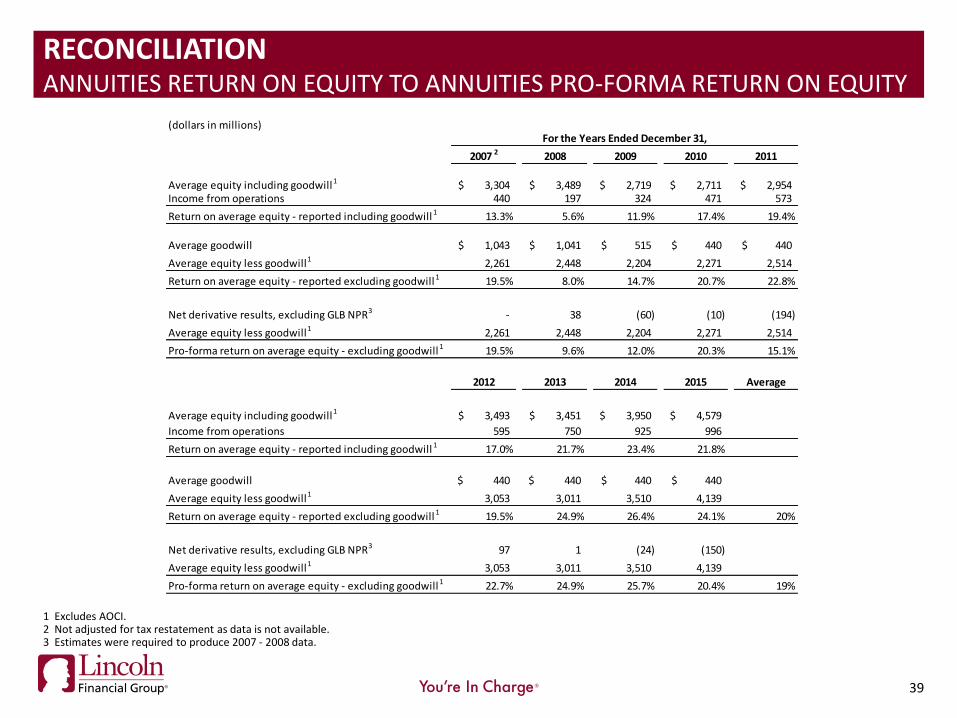
RECONCILIATION ANNUITIES RETURN ON EQUITY TO ANNUITIES PRO-FORMA RETURN ON EQUITY
1 Excludes AOCI. 2 Not adjusted for tax restatement as data is not available. 3 Estimates were required to produce 2007 - 2008 data.
(dollars in millions)
2007 2 2008 2009 2010 2011
Average equity including goodwill1 3,304$ 3,489$ 2,719$ 2,711$ 2,954$ Income from operations 440 197 324 471 573
Return on average equity - reported including goodwill1 13.3% 5.6% 11.9% 17.4% 19.4%
Average goodwill 1,043$ 1,041$ 515$ 440$ 440$
Average equity less goodwill1 2,261 2,448 2,204 2,271 2,514
Return on average equity - reported excluding goodwill1 19.5% 8.0% 14.7% 20.7% 22.8%
Net derivative results, excluding GLB NPR3 - 38 (60) (10) (194)
Average equity less goodwill1 2,261 2,448 2,204 2,271 2,514
Pro-forma return on average equity - excluding goodwill1 19.5% 9.6% 12.0% 20.3% 15.1%
2012 2013 2014 2015 Average
Average equity including goodwill1 3,493$ 3,451$ 3,950$ 4,579$
Income from operations 595 750 925 996
Return on average equity - reported including goodwill1 17.0% 21.7% 23.4% 21.8%
Average goodwill 440$ 440$ 440$ 440$
Average equity less goodwill1 3,053 3,011 3,510 4,139
Return on average equity - reported excluding goodwill1 19.5% 24.9% 26.4% 24.1% 20%
Net derivative results, excluding GLB NPR3 97 1 (24) (150)
Average equity less goodwill1 3,053 3,011 3,510 4,139
Pro-forma return on average equity - excluding goodwill1 22.7% 24.9% 25.7% 20.4% 19%
For the Years Ended December 31,