Embed Size (px)
Citation preview

Goldman Sachs Presentation to
Deutsche Bank Global Financial Services Investor
Conference
May 31, 2016
Gary D. Cohn
President and Chief Operating Officer
Cautionary Note
on Forward-Looking Statements
Today’s presentation and any presentation summary on our website may include forward-looking statements.
These statements are not historical facts, but instead represent only the Firm’s beliefs regarding future events,
many of which, by their nature, are inherently uncertain and outside of the Firm’s control. It is possible that the
Firm’s actual results and financial condition may differ, possibly materially, from the anticipated results and
financial condition indicated in these forward-looking statements.
For a discussion of some of the risks and important factors that could affect the Firm’s future results and
financial condition, see “Risk Factors” in our Annual Report on Form 10-K for the year ended December 31,
2015. You should also read the forward-looking disclaimers in our Form 10-Q for the quarter ended March 31,
2016, particularly as it relates to capital and leverage ratios, and information on the calculation of non-GAAP
financial measures that is posted on the Investor Relations portion of our website: www.gs.com.
The statements in the presentation are current only as of its date, May 31, 2016.
2
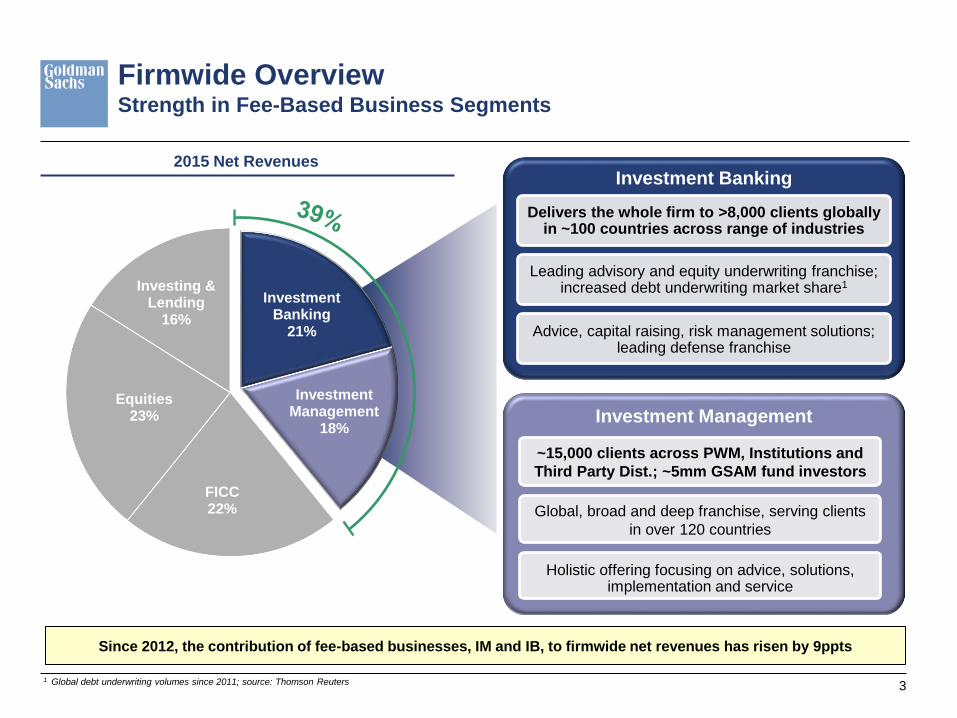
Firmwide Overview Strength in Fee-Based Business Segments
Since 2012, the contribution of fee-based businesses, IM and IB, to firmwide net revenues has risen by 9ppts
Investment Banking
Delivers the whole firm to >8,000 clients globally in ~100 countries across range of industries
Leading advisory and equity underwriting franchise; increased debt underwriting market share1
Advice, capital raising, risk management solutions; leading defense franchise
Investment Management
~15,000 clients across PWM, Institutions and
Third Party Dist.; ~5mm GSAM fund investors
Global, broad and deep franchise, serving clients
in over 120 countries
Holistic offering focusing on advice, solutions, implementation and service
2015 Net Revenues
1 Global debt underwriting volumes since 2011; source: Thomson Reuters 3
FICC 22%
Equities 23%
Investing & Lending
16%
Investment Banking
21%
Investment Management
18%

Firmwide Overview Investing & Lending Activities are Valuable to Our Franchise
Investment Banking
21%
Investment Management
18%
FICC 22%
Equities 23%
Investing & Lending
16%
I&L enhances our franchise businesses and is a driver of book value growth over the past 5 years
2015 Net Revenues
Investing & Lending
Synergistic: Complement our best-in-class advice with provisioning of capital to clients; Co-investors are
often clients in other areas of the firm; Source opportunities via global client franchises
Return-focused: Generating strong risk-adjusted returns from portfolios over the past 5 years; ROAE framework optimizes return profile against variety of
constraints; Low net charge-off rate within loan portfolio
Adaptable: Funded loan portfolio more than doubled since the end of 2012; Effectively allocating capital within I&L, can redeploy or return to shareholders
Diversified across asset classes and within each asset class
4

Macro
Micro
Commissions and Fees
Equities Client
Execution
Sec. Services
Firmwide Overview ICS in Focus
1 FICC and Equities exclude DVA for GS 2 JPM, C excludes DVA/CVA/FVA; MS excludes DVA/FVA, BAC excludes DVA/FVA for years 2011-2014, excludes DVA for 2015
2015 Net Revenues GS Average ICS Net Revenues Contribution 2011–20151
53% 40%
70% 75% 83%
47% 60%
30% 25% 17%
GS MS BAC JPM C
FICC Equities
2011-2015 Average FICC/Equities Net Revenues Mix1,2
Balance between
FICC and Equities
and across
geographies:
Americas ~55%
EMEA ~30%
APAC ~15%
FICC 22%
Equities 23%
Investing & Lending
16%
Investment Banking
21%
Investment Management
18%
5

Active Client Growth, 2015 vs. 20111
1 Active clients represents clients with a minimum amount of trading activity 2 Pensions, Endowments, Foundations & Insurance Companies
We maintain a diversified client base, with growth in key areas given changes in the market backdrop
ICS Clients Overview Diversified Client Base, with Steps Taken to Adapt to Environment
Asset Managers and Corporates
+12%
Hedge Funds and Banks/Brokers
-7%
2015 Client Mix by Active Clients1
Hedge Funds 22%
Banks/Brokers 22%
Asset Managers 30%
Corporates 17%
PEF&I2 7%
6
PEF&I and Gov’ts/Central Banks
+1%
Gov’ts/Central
Banks
2%

4.3% 5.8% 5.9%
8.8% 10.2%
MS C UBS GS JPM
0.6% 1.0% 2.6% 2.8%
DB BARC CS BAC
$4
$8
$12
$16
$20
0% 2% 4% 6% 8% 10%
Ave
rag
e F
ICC
an
d E
qu
itie
s N
et
Reve
nu
es
1 (
$b
n)
Avg. Firm ROE 2011-2015
Revenues vs. Returns Size of FICC and Equities Net Revenues is Not a Barometer for Success
Little correlation between FICC/Equities concentration or net revenue size with firmwide ROE1
GS
JPM
UBS
C
CS
BAC
BARC
DB
MS
Avg. FICC and Equities Net Revs.
as % of Firmwide Net Revs.
10%
1 FICC and Equities exclude DVA for GS; JPM, C excludes DVA/CVA/FVA; MS excludes DVA/FVA, BAC excludes DVA/FVA for years 2011-2014, excludes DVA for 2015; CS, DB, BARC as-reported; UBS
excludes DVA 7

Decision-Making Framework Optimizing Long-Term Returns for Shareholders
Americas Reinsurance
European Insurance
Hedge Fund Administration
Business
Exits/Dispositions
Prime Brokerage
Mortgages
Credit
Repo
Adapting
Electronic Execution in
FICC & Equities
Client Financing in Micro
and Macro FICC
European FICC/Prime
Brokerage
Investing
8
Client Relationships
Risk
Credit Reputational Market Operational
Return on Attributed Equity

2012 2015
2012 2015
Adapting our Business to the Environment Continually Adapting to Changes in Market Opportunity Set
Capital
2Q13 YE 2015
ICS Alternative Balance Sheet1
(25)%
2Q13 YE 2015
FICC Credit and Market RWAs2
~(30)%
Note: Headcount amounts calculated from the beginning of 2012 to the end of 2015; Income Statement amounts calculated from FY2012 to FY2015 1 Represents the allocation of assets from the balance sheet to the Institutional Client Services business 2 Calculated on a Basel III advanced basis
9
Costs
FICC Headcount
~(10)%
FICC Compensation & Benefits
>(20)%

Market-Making Revenue Drivers Opportunities for the Forward
Global GDP growth
Global financial market growth
Business Opportunities
1 Source: World Bank; 2015 calculated using the World Bank’s forecast of 2.4% growth YoY as of January 2016
2 Source: Securities Industry and Financial Markets Association (SIFMA) 3 Source: BIS Quarterly Report released September 2015; data as of March 2015
Structural Growth in Global Markets
Client needs remain intact
Competitive retrenchment
Global GDP ($tn)1
0
10,000
20,000
30,000
40,000
50,000
60,000
70,000
80,000
90,000
2000 2003 2006 2009 2012 2015
+2x
2000 to 2015 +2x
+2x
+16x
Total US Bond
Market2
EM Local Bond
Market3
Global Market
Capitalization1
2000 to 2015 ∆
10

Improving our Electronic Offering Strengthening our Quantitative Capabilities
We have continued to invest in our electronic capabilities, which started in our equities business and has evolved
tremendously over the last 15 years
In 2015, we acquired the Pantor platform to expand our global low-touch offering
— Furthers execution capabilities for quantitative asset managers, index fund clients
In 2015, we launched our consolidated systematic market making (SMM) platform, representing the latest evolution
in electronic fixed income products, which began over 20 years ago in the FX market
SMM benefits include lower cost to clients, greater integration, standardization of technology and faster product
development
Strengthening Our Electronic Offering for Equities and FICC Clients
~70%
~20% ~15%
~15%
~10%
US Index CDX US Cash Credit Commodities FX Spot US Govts Euro Govts
>100%
Growth in GS Electronic Volumes (2015 vs. 2011)
~85% ~15% ~25% ~90% ~90% ~80% % of GS
Volumes
Electronic2
1 US government and Euro government electronic volume growth based on trade count. All other electronic volume growth based on dollar volumes
2 GS electronic product volume as a percentage of GS total product volume 11
1 1
Goldman Sachs Presentation to
Deutsche Bank Global Financial Services Investor
Conference
May 31, 2016
Gary D. Cohn
President and Chief Operating Officer