Embed Size (px)
Citation preview

1
Goldman Sachs Global Energy Conference
January 2017
2
Forward-Looking Statements
Statements contained in this press release that are not historical facts are forward-looking statements within the meaning
of Section 27A of the Securities Act of 1933 and Section 21E of the Securities Exchange Act of 1934. Forward-looking
statements include words or phrases such as “anticipate,” “believe,” “estimate,” “expect,” “intend,” “plan,” “project,”
“could,” “may,” “might,” “should,” “will” and similar words and specifically include statements involving expected financial
performance, effective tax rate, expected expense savings, day rates and backlog, estimated rig availability; rig
commitments and contracts; contract duration, status, terms and other contract commitments; estimated capital
expenditures; letters of intent or letters of award; scheduled delivery dates for rigs; the timing of delivery, mobilization,
contract commencement, relocation or other movement of rigs; our intent to sell or scrap rigs; and general market,
business and industry conditions, trends and outlook. Such statements are subject to numerous risks, uncertainties and
assumptions that may cause actual results to vary materially from those indicated, including commodity price
fluctuations, customer demand, new rig supply, downtime and other risks associated with offshore rig operations,
relocations, severe weather or hurricanes; changes in worldwide rig supply and demand, competition and technology;
future levels of offshore drilling activity; governmental action, civil unrest and political and economic uncertainties;
terrorism, piracy and military action; risks inherent to shipyard rig construction, repair, maintenance or enhancement;
possible cancellation, suspension or termination of drilling contracts as a result of mechanical difficulties, performance,
customer finances, the decline or the perceived risk of a further decline in oil and/or natural gas prices, or other reasons,
including terminations for convenience (without cause); the cancellation of letters of intent or letters of award or any
failure to execute definitive contracts following announcements of letters of intent or letters of award; the outcome of
litigation, legal proceedings, investigations or other claims or contract disputes; governmental regulatory, legislative and
permitting requirements affecting drilling operations; our ability to attract and retain skilled personnel on commercially
reasonable terms; environmental or other liabilities, risks or losses; debt restrictions that may limit our liquidity and
flexibility; our ability to realize the expected benefits from our redomestication and actual contract commencement dates;
tax matters including our effective tax rate; cybersecurity risks and threats; and the occurrence or threat of epidemic or
pandemic diseases or any governmental response to such occurrence or threat. In addition to the numerous factors
described above, you should also carefully read and consider “Item 1A. Risk Factors” in Part I and “Item 7.
Management’s Discussion and Analysis of Financial Condition and Results of Operations” in Part II of our most recent
annual report on Form 10-K, as updated in our subsequent quarterly reports on Form 10-Q, which are available on the
SEC’s website at www.sec.gov or on the Investor Relations section of our website at www.enscoplc.com. Each forward-
looking statement speaks only as of the date of the particular statement, and we undertake no obligation to publicly
update or revise any forward-looking statements, except as required by law.

3
Executive Summary
• Positive medium-/long-term outlook for offshore market
• Ensco is well positioned to capitalize on future recovery
• Strong record of proactive capital, fleet and expense management
• Record operational utilization and safety performance
• #1 customer satisfaction – six consecutive years (EnergyPoint Research Inc.)
• Among highest net income/revenue margins
• High-quality rig fleet that leverages standardization
• Global presence and large/diverse customer base

4
Agenda
• Market Conditions
• Decisive actions to persevere through the downturn
– capital & expense management
– fleet restructuring
– investments in engineering and innovation to improve operational &
safety performance
• Outlook for offshore drilling
– efficiency & cost improvements
– attrition of older rigs & deferral/cancellation of newbuild deliveries
– catalyst markets
5
$218
$208
$181
$126
$120
$0
$50
$100
$150
$200
$250
$ billions
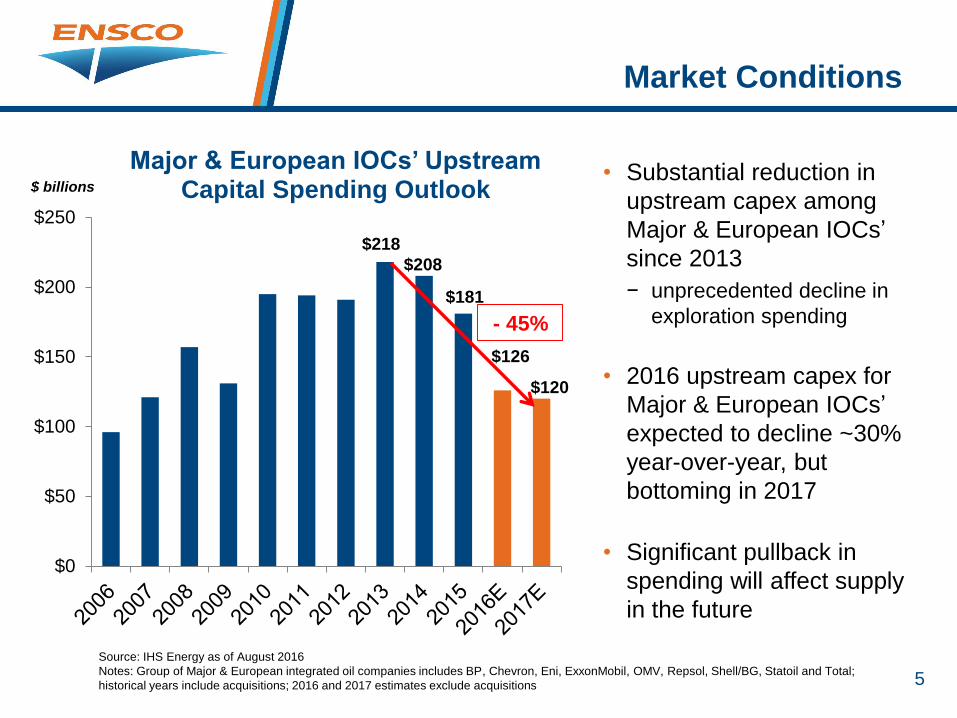
Major & European IOCs’ Upstream Capital Spending Outlook
Market Conditions
Source: IHS Energy as of August 2016
Notes: Group of Major & European integrated oil companies includes BP, Chevron, Eni, ExxonMobil, OMV, Repsol, Shell/BG, Statoil and Total;
historical years include acquisitions; 2016 and 2017 estimates exclude acquisitions
• Substantial reduction in
upstream capex among
Major & European IOCs’
since 2013
− unprecedented decline in
exploration spending
• 2016 upstream capex for
Major & European IOCs’
expected to decline ~30%
year-over-year, but
bottoming in 2017
• Significant pullback in
spending will affect supply
in the future
- 45%

6
• Capital management
• Expense management
• Fleet restructuring
• Investments to improve
operational & safety
performance
– engineering & innovation
– process improvements
Decisive
Actions To
Persevere
Through The
Downturn

7
• Accessed the debt markets initially to bolster liquidity and refinance ‘near-term’ debt maturities: $1.25 billion raised in 2014 and $1.1 billion raised in 2015
• Raised equity in April 2016 to further enhance liquidity position
• Increased revolver to $2.25 billion and extended to September 2019; then extended maturity of $1.13 billion of revolver commitments by one year to September 2020
• Reduced capital expenditures and dividend to preserve cash
• Delayed delivery of newbuilds to postpone final milestone payments
• Recently refinanced ‘medium-term’ debt maturities to further improve financial flexibility
• Significantly reduced leverage
Proactive Capital Management

8
Benefits of Capital Management
Actions Through 3Q16
Note: Net debt is a non-GAAP financial measure defined as long-term debt less cash and short-term investments. Non-GAAP financial measures should
be considered as a supplement to, and not as a substitute for, or superior to, financial measures prepared in accordance with GAAP. 4Q15 net debt-to-
capital is calculated as follows: long-term debt of $5.9 billion, less $1.3 billion of cash and short-term investments, divided by the sum of long-term debt
of $5.9 billion plus shareholders’ equity of $6.5 billion, minus $1.3 billion of cash and short-term investments. 3Q16 net debt-to-capital is calculated as
follows: long-term debt of $4.7 billion, less $1.8 billion of cash and short-term investments, divided by the sum of long-term debt of $4.7 billion plus
shareholders’ equity of $8.0 billion, minus $1.8 billion of cash and short-term investments.
2.25 2.25
1.3
1.8
4Q15 3Q16
Liquidity
Revolver Cash + Short-term investments
$ billions
4Q15 3Q16
Net Debt-to-Capital Ratio
$3.55
$4.0541%
27%
$1.6 billion
reduction in
net debt

9
Debt Maturity Schedule: 9/30/16
$438
$681 $683$623
$669
2017 2018 2019 2020 2021 2022 2023 2024 2025 2027 2040
$300
2044
$ millions
$1,001
No debt
maturities
until 2019
$150
Note: Reflects principal amount outstanding as of September 30, 2016, as adjusted to give effect to $24.5 million aggregate principal amount of 2044
senior notes that were exchanged for 1.8 million shares on October 3, 2016.
$2.25B Revolver to Sept.
2019 then $1.13B to Sept.
2020
Recent debt raise/tender/exchange
announcements to be completed in 1Q17

10
Capital Expenditure Outlook
$70
$375
$225
4Q16E 2017E 2018E 2019E
Newbuild Capital Expenditures
New rig construction
$ millions
$0
Note: Estimates for 2016, 2017, 2018 and 2019; final capex estimates to be determined upon completion of annual budget process and subject to
change based on rig contracting; new rig construction represents contractual commitments plus anticipated capex associated with rig construction;
2017 and 2018 rig enhancements capex are estimates and not earmarked for any specific projects at this time; capex for minor upgrades and
improvements are based on the currently active fleet.
2050 50
2550
4Q16E 2017E 2018E
Other Capital Expenditures
Rig enhancements Minor upgrades & improvements
$ millions
$20
$75$100

11
2015 Actions
• 15% reduction in offshore unit labor cost
• $60+ million of annual savings from 27% reduction in onshore support
headcount
– consolidated business unit reporting structure from five to three
– centralized certain functions
• $100+ million of additional contract drilling and G&A expense savings
– repair and maintenance rate reductions and lower rig insurance premiums
– other savings through negotiated discounts with vendors
Recent Actions
• Recently instituted a lower base salary structure for new hire offshore crews
• Further streamlining organizational structure: reduced onshore support costs
and compensation expense that is expected to result in more than $50 million of
annualized cost savings per 3Q16 earnings release
Expense Management Actions

12
Strong 3Q16 Results
• Revenues exceeded initial outlook driven by record rig uptime performance
– 99% operational utilization fleet wide
– record safety statistics
• Awarded 30% of rig years contracted industrywide during 3Q16(1)
• Additional expense savings announced
– $50 million annualized savings from onshore support and compensation plans versus 2Q16 levels
• Repurchased additional $189 million of senior notes
• Extended $1.1 billion of $2.25 billion revolver by one year to September 2020
• Solid financial position at quarter end September 30, 2016:
– $3.8 billion contracted backlog
– $4.0 billion of liquidity: $1.8 billion cash and ST investments + $2.25 billion revolver
– 27% net debt-to-capital ratio(2)
(1)Source: IHS Markit RigPoint(2) Net debt is a non-GAAP financial measure. See slide 8.

13
Fleet Management Strategy
• Leverage record uptime/safety performance to negotiate extensions for contracted rigs
• Maintain warm stacked rig availability in each region in order to bid into new opportunities, examples include:
– West Africa: ENSCO DS-7
– U.S. Gulf of Mexico: ENSCO 8503, ENSCO 68 & ENSCO 87
– Asia: ENSCO DS-9, ENSCO 8504 & ENSCO 106
– Middle East: ENSCO 140/1 & ENSCO 110
– North Sea: ENSCO 120, ENSCO 121 & ENSCO 102
• Preservation stack excess high-spec rig capacity to prudently reduce expenses, yet maintain high-spec capacity that may be reactivated within 90 – 120 days
• Retire older, less capable rigs as they roll off contract as part of continuous high-grading/expense management
14
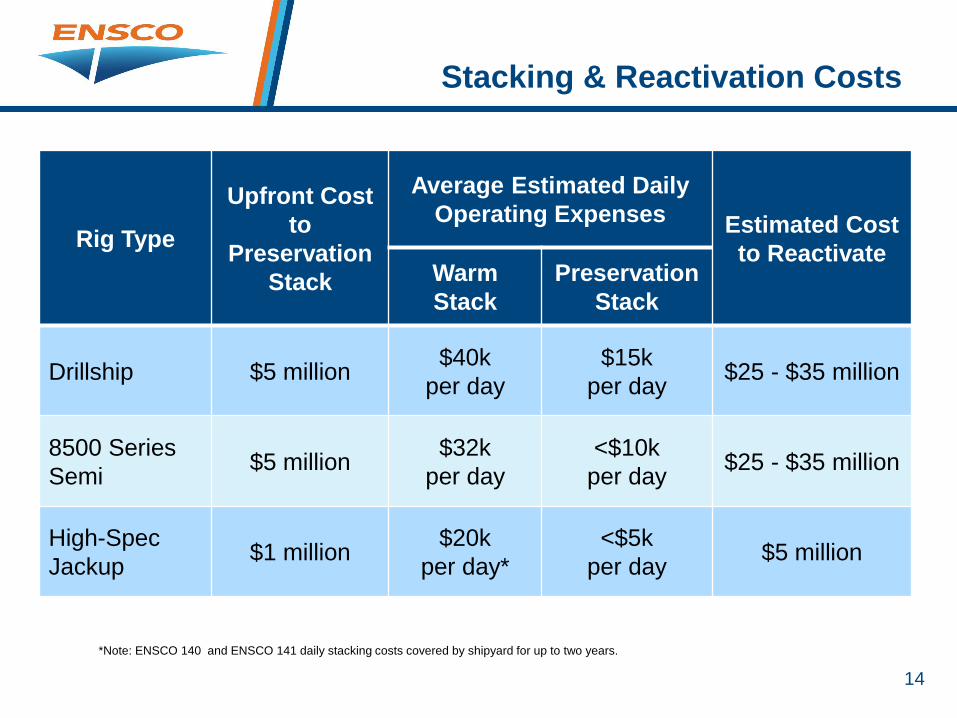
Stacking & Reactivation Costs
Rig Type
Upfront Cost
to
Preservation
Stack
Average Estimated Daily
Operating Expenses Estimated Cost
to ReactivateWarm
Stack
Preservation
Stack
Drillship $5 million$40k
per day
$15k
per day$25 - $35 million
8500 Series
Semi$5 million
$32k
per day
<$10k
per day$25 - $35 million
High-Spec
Jackup$1 million
$20k
per day*
<$5k
per day$5 million
*Note: ENSCO 140 and ENSCO 141 daily stacking costs covered by shipyard for up to two years.

15
(1) Includes ENSCO DS-10 newbuild currently scheduled for delivery in 1Q17
(2) Includes ENSCO 7500 that is expected to be retired from Ensco’s go-forward fleet
Note: adjusted for 2011 acquisition of Pride International; ultra-deepwater defined as 7500 ft. or greater
17
Fleet Restructuring: Floaters
Newbuilds(1)
Current
Fleet
Year-End
2009
Retirements
& Sales(2)
+13 -10 20
17 years Lower average fleet age
Greater drilling capabilities
10 years
4 ultra-deepwater
capable floaters
7 floaters with
15k psi BOPs
15 ultra-deepwater
capable floaters
18 floaters with
15k psi BOPsEnhanced well control

16
51
Fleet Restructuring: Jackups
Current
Fleet
Year-End
2009
+7 -26 32
6 newbuild jackups delivered
since 2013
Jackup sales since 2009 have
generated ~$600 million in
proceeds
Newbuilds(1)
Retirements
& Sales(2)
(1) Includes ENSCO 140 and ENSCO 141 newbuilds that were delivered in August and November 2016, respectively, and ENSCO 123 with
scheduled delivery of 1Q18.
(2) Includes ENSCO 56, ENSCO 81, ENSCO 82, ENSCO 86, ENSCO 90 & ENSCO 99 that are expected to be retired from Ensco’s go-forward fleet
Note: adjusted for 2011 acquisition of Pride International

17
Investment in Engineering:
8500 Series Mooring Upgrade
Source: IHS Markit RigPoint as of December 2016; Ultra deepwater defined as 7500 ft. or greater
Dynamically Positioned
288
Rig CountGlobal Floater
Fleet
Ultra-deepwater capable
15K+ psi & 6+ ram BOP
8 mooring
winches
194
162
130
9
• Low-cost mooring
upgrade increases the
versatility of our 8500
Series rigs, placing
them among a select
group of floaters with
superior technological
capabilities and the
ability to operate in a
dynamically
positioned and/or
moored capacityENSCO 8503
ENSCO 8505

18
• Improving the drilling process
– advanced hybrid DP/Moored 8500 Series semis
– ENSCO 120/140 Series cantilever advantage
• Asset uptime and efficiency
– Ensco Asset Management System
• Re-engineering the support structure
– business unit consolidation
– centralization of staff functions
Investments in Innovation

19
Improved Operational Utilization
98.5%
99.0%99.1%
99.3%
2013 2014 2015 YTDSep16
Jackups
92.0% 92.9%
94.0%
99.1%
2013 2014 2015 YTDSep16
Floaters

20
Excellent Safety Performance
Total Recordable
Incident Rate
• Record 2016 TRIR
• Leading-edge safety
management systems
• Enhancing process
safety to drive further
improvements
0.0
0.2
0.4
0.6
0.8
1.0
1.2
2008 2009 2010 2011 2012 2013 2014 2015 2016
Ensco Industry
Note: IADC industry statistics are as of 3Q16.

21
Net Income Margin
Ensco Peer Average
24%
18%
Source: FactSet; sum of trailing eight quarters of net income divided by sum of trailing eight quarters of revenue. FactSet's data is based on
aggregation of information collected from industry equity research analysts and may not be based on GAAP reported financial data. Financials as
of 3Q16. Peer average includes Transocean, Noble Corp., Diamond Offshore, Seadrill, and Rowan Co.
Consistent
outperformance
versus major
peer average
22
High Levels of Customer Satisfaction
Rated #1• Total Satisfaction
• Safety & Environment
• Performance & Reliability
• Job Quality
• Special Applications
• Ultra-Deepwater Wells
• Deepwater Wells
• Harsh Environment Wells
• Horizontal & Directional Wells
• Shelf Wells
• North Sea
• Middle East
• Asia & Pacific Rim

23
Outlook for
Offshore Drilling
24
Offshore Exploration & Production
• Offshore production is ~33% of global supply
• Offshore reserves are a critical part of major E&P portfolios and
are vital to the economies of several countries
• Excessive costs/inefficiencies crept into sector during the $100+
oil environment
• Industry is proactively responding to commodity price pressures
and breakeven commodity prices for offshore programs are
declining
• Unprecedented decline in E&P spending will lead to supply side
challenges – the longer the duration of the pullback, the greater
the chance of significant upward movements in commodity prices

25
Catalyst
Markets
Offshore
Rig Supply
Path to Recovery
Breakeven Economics
Commodity
• Improvement /
stabilization in oil
prices
• Re-engineering /
standardization /
innovation
• Cost deflation
and efficiency
gains
• Brazil opens pre-
salt to more
players
• Mexico offshore
lease sales and
entrance of
international
operators
• Retirement of
older, less
capable assets
• Deferral and
cancellation of
newbuild
deliveries

26
• Cost estimates reduced to less than $10 billion from previous
estimate of $22 billion
• Project re-engineering through standardization and scope
optimization, coupled with industry deflation, resulted in significantly
less capital required to develop approximately 90% of resources
Industrywide Re-Engineering,
Efficiency Gains & Cost Deflation
BP Mad Dog:
Phase 2
Shell
Appomattox
Statoil
• 20% reduction in project costs from supply chain savings, design
improvements, etc.
• “Standardization is the new innovation”
Total Block
32
• Capital expenditure estimate reduced by $4 billion to $16 billion
• Optimized project design and contracting strategy
Recent Customer Commentary on Deepwater ProjectsOffshore Outlook
• Customers attention
has turned to project
re-engineering,
efficiency gains and
better expense
management
• Cost deflation across
supply chain:
operators, service
companies
• Break-even
economics are
improving
significantly for
offshore projects
27
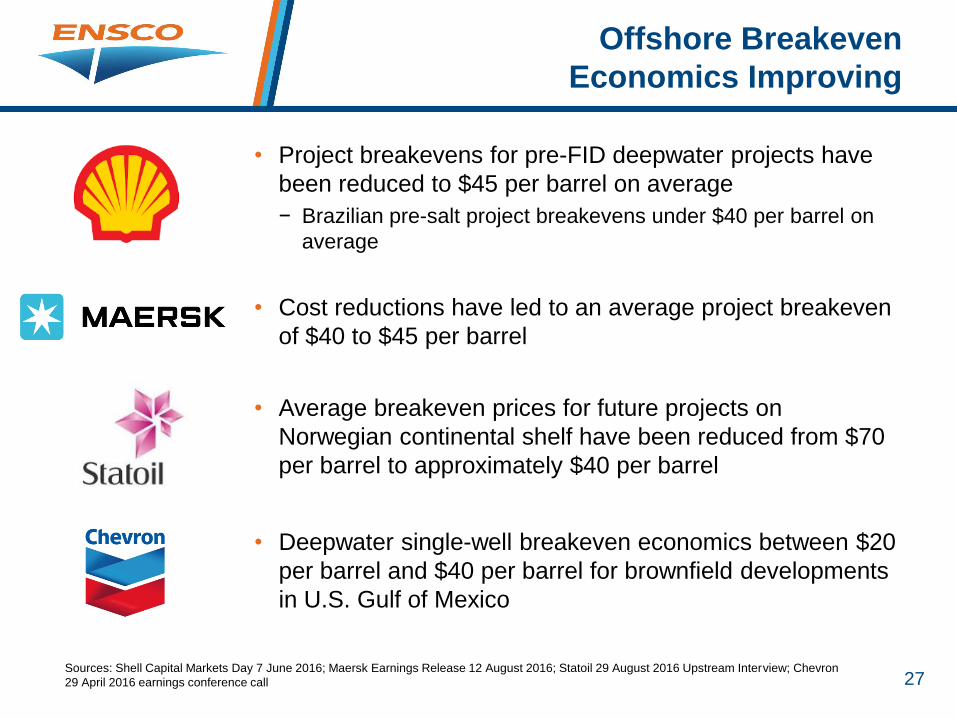
• Cost reductions have led to an average project breakeven
of $40 to $45 per barrel
• Average breakeven prices for future projects on
Norwegian continental shelf have been reduced from $70
per barrel to approximately $40 per barrel
• Project breakevens for pre-FID deepwater projects have
been reduced to $45 per barrel on average
− Brazilian pre-salt project breakevens under $40 per barrel on
average
Offshore Breakeven
Economics Improving
Sources: Shell Capital Markets Day 7 June 2016; Maersk Earnings Release 12 August 2016; Statoil 29 August 2016 Upstream Interview; Chevron
29 April 2016 earnings conference call
• Deepwater single-well breakeven economics between $20
per barrel and $40 per barrel for brownfield developments
in U.S. Gulf of Mexico

28
Strategic Combinations & Alliances
Among Offshore Service Companies
Strategic combinations and alliances drive greater efficiencies and lower the
breakeven commodity prices for offshore projects
Innovation, efficiencies
and cost reductions in
deepwater projects
Enhance project delivery,
improve recovery and
optimize cost/efficiency of
subsea developments
Overhaul subsea field
operations to drive
efficiencies
Integrated FPSO solutions
to reduce costs of offshore
developments
Optimize the cost and
efficiency of subsea well
intervention systems
Develop production
solutions to boost output,
increase recovery rates
and reduce costs for
subsea fields

29
Attrition of Older Rigs
50 more floaters could be retired by year-end 2017 if attrition
continues at similar rates observed throughout the downturn
Retired to Date
69 floaters retired
since 3Q14
Currently Idle
~35 floaters >30 years of
age idle without follow-
on work could be retired
Expiring Contracts~15 floaters >30 years of
age have contracts expiring
before YE17 without follow-
on work could be retired
Source: IHS-ODS Petrodata as of December 2016
Note: (1) ‘Retired’ includes scrapped rigs, announced scrapping and rigs converted to non-drilling units; (2) Competitive jackups are independent leg cantilever rigs; (3) Historical
attrition ratio of 88% for floaters older than 35 years of age and 67% for floaters between 30 and 35 years of age applied annually to rigs that are currently idle or rolling off contract
for each age category.
Up to ~150 additional jackups could be retired as expiring contracts
and survey costs lead to the removal of older rigs from drilling supply
Retired to Date
27 competitive
jackups retired
since 3Q14
Currently Idle97 competitive
jackups >30 years of age idle without follow-
on work could be retired
Expiring Contracts49 jackups >30 years of
age have contracts expiring
before YE17 without follow-
on work could be retired
FLO
AT
ER
SJA
CK
UP
S

30
Newbuild Order Book
Source: IHS-ODS Petrodata as of December 2016; marketed competitive floaters and jackups (independent leg cantilever rigs). Jackups numbers
above do not include recently announced intention by Middle East Joint Venture to order up to 20 rigs to be delivered over ten years beginning as
early as 2021.
Floaters
2
Uncontracted,
On Order
3
Contracted
45%27
Uncontracted,
Under
Construction
5%
3%
47%
News reports
suggest SETE
Brasil program
could be reduced to
8 newbuilds in total
Jackups
8 – 28
SETE Brasil
4
Contracted,
Established
Drillers
34
Uncontracted,
Established
Drillers
? – 62
Uncontracted,
Speculators
4%
34%
62%
Zero rigs built in
China by
speculators have
been contracted

31
Jackup Delivery Deferrals
05
1015202530
1Q
14
2Q
14
3Q
14
4Q
14
1Q
15
2Q
15
3Q
15
4Q
15
1Q
16
2Q
16
3Q
16
4Q
16
1Q
17
2Q
17
3Q
17
4Q
17
1Q
18
2Q
18
3Q
18
4Q
18
1Q
19
2Q
19
3Q
19
4Q
19
1Q
20
2Q
20
3Q
20
4Q
20
May 2014 Delivery Schedule
Delivered Under Costruction
05
1015202530
1Q
14
2Q
14
3Q
14
4Q
14
1Q
15
2Q
15
3Q
15
4Q
15
1Q
16
2Q
16
3Q
16
4Q
16
1Q
17
2Q
17
3Q
17
4Q
17
1Q
18
2Q
18
3Q
18
4Q
18
1Q
19
2Q
19
3Q
19
4Q
19
1Q
20
2Q
20
3Q
20
4Q
20
December 2016 Delivery Schedule
Delivered Under Costruction
Source: IHS-ODS Petrodata as of December 2016
Note: December 2016 delivery schedule includes 20 new orders and excludes 11 orders cancelled since May 2014. Numbers above do not include recently
announced intention by Middle East Joint Venture to order up to 20 rigs to be delivered over ten years beginning as early as 2021.
105 Scheduled Deliveries49 Actual Deliveries
130 Scheduled Deliveries 15 Scheduled Deliveries

32
Future Catalyst Markets: Brazil
• Following Senate approval earlier this
year, the Brazilian House recently passed
a bill that would eliminate requirement for
Petrobras to manage all pre-salt
operations and hold a minimum 30%
stake in pre-salt projects
• More recently, Statoil has acquired
Petrobras’ 66% operating interest in BM-
S-8 offshore Brazil including the Carcará
discovery for $2.5 billion
• Diversification of customer base offshore
Brazil is ongoing with outstanding tenders
from Premier, Total and Chevron
“We believe in the strong
fundamentals of Brazil
and the fundamentals of
its geology. We will be
looking at a substantial
part of our production
from Brazil.”
– Ben van Beurden,
Shell CEO
February 2016

33
Future Catalyst Markets: Mexico
• During 4Q15, an auction was completed
for shallow-water blocks offshore Mexico,
awarding licenses to several exploration
and production companies
• Deepwater acreage auctioned in 4Q16
with eight of ten blocks awarded to large
companies including several majors,
integrated, and national oil companies
“Regardless of what
happens in the
international context,
Mexico will move forward
with the energy reform
implementation.”
– Enrique Peña Nieto,
President of Mexico
February 2016

34
Recap
• Proactive steps to:
– improve capital structure
– reduce expenses
– restructure fleet
– invest in engineering and innovation that improves operational and safety
performance
• Positive steps taken by the offshore sector to reduce breakeven
economics are building the foundation for future market recovery
• Rig attrition improving rig supply dynamics
• Our actions and investments position Ensco to capitalize as we
navigate through the market cycle

35

36
Source: IHS Petrodata as of December 2016; competitive floaters and jackups (independent leg cantilever rigs); ‘contracted’ includes rigs currently under contract
or with a future contract; Newbuilds do not include recently announced intention by Middle East Joint Venture to order up to 20 jackups to be delivered over ten
years beginning as early as 2021; Potential retirements calculated using historical attrition ratio of 88% for floaters older than 35 years of age and 67% for floaters
between 30 and 35 years of age applied annually to rigs that are currently idle or rolling off contract for each age category.(1) News reports suggest SETE Brasil program could be reduced to 8 newbuilds in total
Appendix:
Global Rig Fleet
Newbuilds
Floaters Jackups
Contracted 140 237
Idle/Other 65 140
Cold Stacked 66 46
Total 271 423
Established Drillers 32 38
Uncertain (SETE Brasil(1) or Speculator) 28 62
Total 60 100
Potential Incremental
Retirements by Year-End
2017
Up to 50 Up to 150
DeliveredFleet
Attrition
-? -?
-? -?

37
Appendix:
Liquidity and Leverage
*Pro forma for new debt issues: $850 million of 3% exchangeable senior notes issued in December 2016 and approximately $332 million of 8% senior notes to be issued
in January 2017, both due 2024. A portion of the 3% exchangeable senior notes is treated as shareholders’ equity and the remainder as debt.
Note: Net debt is a non-GAAP financial measure defined as long-term debt less cash and short-term investments. Non-GAAP financial measures should be considered as
a supplement to, and not as a substitute for, or superior to, financial measures prepared in accordance with GAAP. 4Q15 net debt-to-capital is calculated as follows: long-
term debt of $5.9 billion, less $1.3 billion of cash and short-term investments, divided by the sum of long-term debt of $5.9 billion plus shareholders’ equity of $6.5 billion,
minus $1.3 billion of cash and short-term investments. 3Q16 net debt-to-capital is calculated as follows: long-term debt of $4.7 billion, less $1.8 billion of cash and short-
term investments, divided by the sum of long-term debt of $4.7 billion plus shareholders’ equity of $8.0 billion, minus $1.8 billion of cash and short-term investments.
2.25 2.25 2.25
1.3
1.82.3
4Q15 3Q16 3Q16Pro forma*
Liquidity
Revolver Cash + Short-term investments
$ billions
41%
27%
25%
4Q15 3Q16 3Q16Pro forma*
Net Debt-to-Capital Ratio
$3.55
$4.05
$4.54

38
Appendix:
Debt Maturity Schedule Proforma 9/30/16
$292
$551
$309
$623
$669$332
$850
2017 2018 2019 2020 2021 2022 2023 2024 2025 2027 2040
$300
2044
$ millions
$1,001No debt
maturities
until 2019
$150
Note: Reflects principal amount outstanding as of September 30, 2016, as adjusted to give effect to $24.5 million aggregate principal amount of 2044
senior notes that were exchanged for 1.8 million shares on October 3, 2016 and recent offerings: $850 million of 3% exchangeable senior notes and
$332 million of 8% senior notes, both due 2024.
$2.25B Revolver to Sept.
2019 then $1.13B to Sept.
2020
Recent
tender/exchange
announced for
2019-2021
maturities; $650M
tendered
$1,805 $1.182B of debt raised in Dec ‘16/
Jan ’17; $494M excess cash to be
used for additional debt
repurchases and/or general
corporate purposes