Embed Size (px)
Citation preview

John Gerspach Chief Financial Officer
December 5, 2012
Goldman Sachs Financial Services
Conference
Citigroup
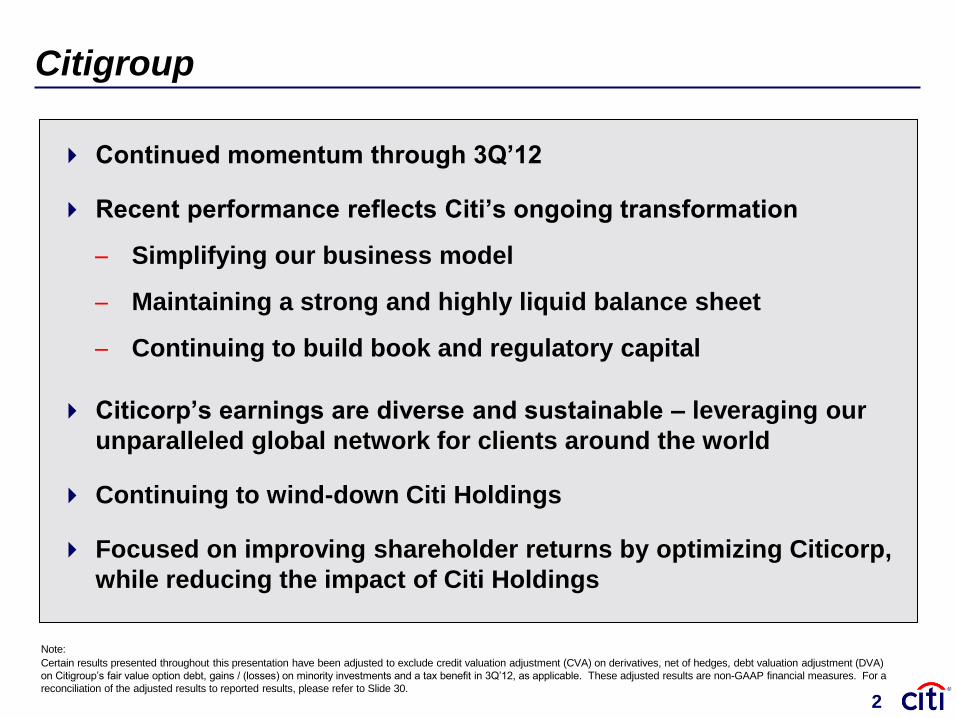
Continued momentum through 3Q’12
Recent performance reflects Citi’s ongoing transformation
– Simplifying our business model
– Maintaining a strong and highly liquid balance sheet
– Continuing to build book and regulatory capital
Citicorp’s earnings are diverse and sustainable – leveraging our
unparalleled global network for clients around the world
Continuing to wind-down Citi Holdings
Focused on improving shareholder returns by optimizing Citicorp,
while reducing the impact of Citi Holdings
2
Note:
Certain results presented throughout this presentation have been adjusted to exclude credit valuation adjustment (CVA) on derivatives, net of hedges, debt valuation adjustment (DVA)
on Citigroup’s fair value option debt, gains / (losses) on minority investments and a tax benefit in 3Q’12, as applicable. These adjusted results are non-GAAP financial measures. For a
reconciliation of the adjusted results to reported results, please refer to Slide 30.
Agenda
Financial Results
Announced Repositioning Actions
Citi Holdings
Capital and Returns
Conclusions
4
Note:
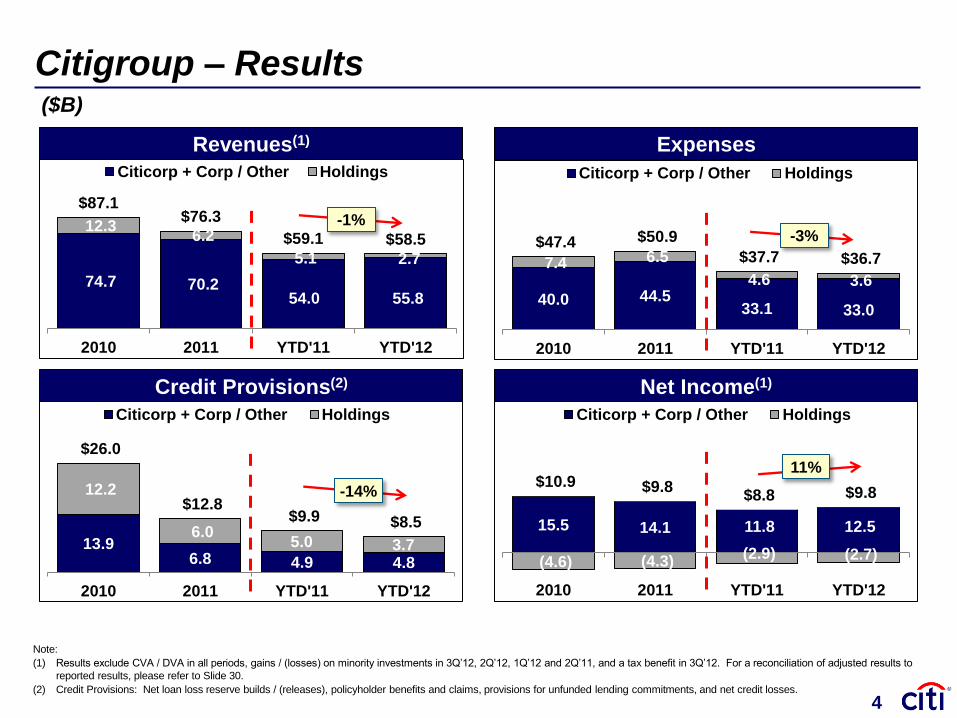
(1) Results exclude CVA / DVA in all periods, gains / (losses) on minority investments in 3Q’12, 2Q’12, 1Q’12 and 2Q’11, and a tax benefit in 3Q’12. For a reconciliation of adjusted results to
reported results, please refer to Slide 30.
(2) Credit Provisions: Net loan loss reserve builds / (releases), policyholder benefits and claims, provisions for unfunded lending commitments, and net credit losses.
40.0 44.5 33.1 33.0
7.4 6.5
4.6 3.6
$47.4 $50.9
$37.7 $36.7
2010 2011 YTD'11 YTD'12
Citicorp + Corp / Other Holdings
Credit Provisions(2) Net Income(1)
Expenses Revenues(1)
Citigroup – Results
13.9 6.8 4.9 4.8
12.2
6.0 5.0 3.7
$26.0
$12.8 $9.9 $8.5
2010 2011 YTD'11 YTD'12
Citicorp + Corp / Other Holdings
15.5 14.1 11.8 12.5
(4.6) (4.3) (2.9) (2.7)
$10.9 $9.8 $8.8 $9.8
2010 2011 YTD'11 YTD'12
Citicorp + Corp / Other Holdings
-1% -3%
-14%
11%
74.7 70.2 54.0 55.8
12.3 6.2
5.1 2.7
$87.1 $76.3
$59.1 $58.5
2010 2011 YTD'11 YTD'12
Citicorp + Corp / Other Holdings
4
($B)
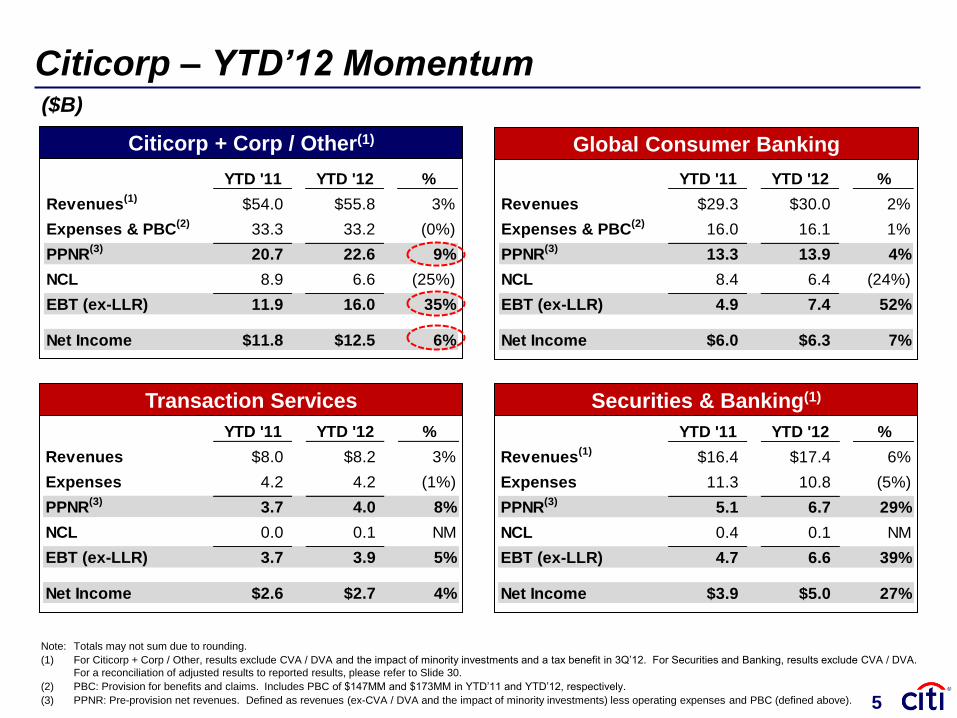
YTD '11 YTD '12 %
Revenues(1)
$54.0 $55.8 3%
Expenses & PBC(2)
33.3 33.2 (0%)
PPNR(3)
20.7 22.6 9%
NCL 8.9 6.6 (25%)
EBT (ex-LLR) 11.9 16.0 35%
Net Income $11.8 $12.5 6%
Securities & Banking(1)
Global Consumer Banking Citicorp + Corp / Other(1)
Citicorp – YTD’12 Momentum
Note: Totals may not sum due to rounding.
(1) For Citicorp + Corp / Other, results exclude CVA / DVA and the impact of minority investments and a tax benefit in 3Q’12. For Securities and Banking, results exclude CVA / DVA.
For a reconciliation of adjusted results to reported results, please refer to Slide 30.
(2) PBC: Provision for benefits and claims. Includes PBC of $147MM and $173MM in YTD’11 and YTD’12, respectively.
(3) PPNR: Pre-provision net revenues. Defined as revenues (ex-CVA / DVA and the impact of minority investments) less operating expenses and PBC (defined above).
Transaction Services
5
($B)
YTD '11 YTD '12 %
Revenues $29.3 $30.0 2%
Expenses & PBC(2)
16.0 16.1 1%
PPNR(3)
13.3 13.9 4%
NCL 8.4 6.4 (24%)
EBT (ex-LLR) 4.9 7.4 52%
Net Income $6.0 $6.3 7%
YTD '11 YTD '12 %
Revenues $8.0 $8.2 3%
Expenses 4.2 4.2 (1%)
PPNR(3)
3.7 4.0 8%
NCL 0.0 0.1 NM
EBT (ex-LLR) 3.7 3.9 5%
Net Income $2.6 $2.7 4%
YTD '11 YTD '12 %
Revenues(1)
$16.4 $17.4 6%
Expenses 11.3 10.8 (5%)
PPNR(3)
5.1 6.7 29%
NCL 0.4 0.1 NM
EBT (ex-LLR) 4.7 6.6 39%
Net Income $3.9 $5.0 27%
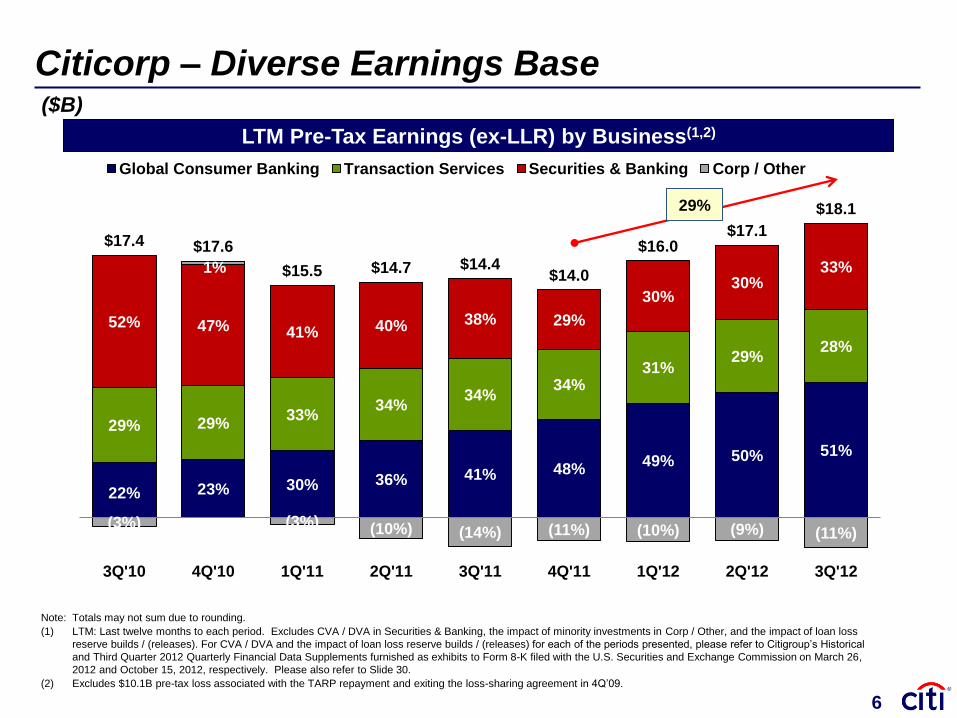
22% 23% 30% 36% 41% 48% 49% 50% 51%
29% 29% 33%
34% 34%
34% 31%
29% 28%
52% 47% 41% 40% 38% 29%
30% 30%
33%
(3%)
1%
(3%) (10%) (14%) (11%) (10%) (9%) (11%)
$17.4 $17.6
$15.5 $14.7 $14.4 $14.0
$16.0 $17.1
$18.1
3Q'10 4Q'10 1Q'11 2Q'11 3Q'11 4Q'11 1Q'12 2Q'12 3Q'12
Global Consumer Banking Transaction Services Securities & Banking Corp / Other
LTM Pre-Tax Earnings (ex-LLR) by Business(1,2)
Citicorp – Diverse Earnings Base
29%
6
($B)
Note: Totals may not sum due to rounding.
(1) LTM: Last twelve months to each period. Excludes CVA / DVA in Securities & Banking, the impact of minority investments in Corp / Other, and the impact of loan loss
reserve builds / (releases). For CVA / DVA and the impact of loan loss reserve builds / (releases) for each of the periods presented, please refer to Citigroup’s Historical
and Third Quarter 2012 Quarterly Financial Data Supplements furnished as exhibits to Form 8-K filed with the U.S. Securities and Exchange Commission on March 26,
2012 and October 15, 2012, respectively. Please also refer to Slide 30.
(2) Excludes $10.1B pre-tax loss associated with the TARP repayment and exiting the loss-sharing agreement in 4Q’09.
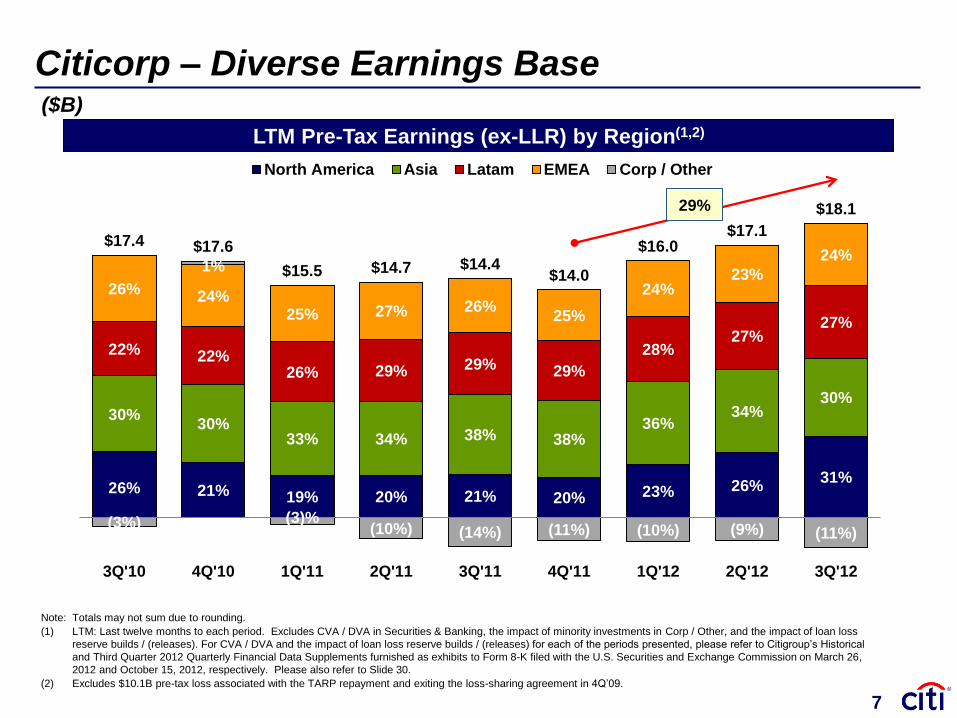
26% 21% 19% 20% 21% 20% 23% 26% 31%
30% 30%
33% 34% 38% 38% 36%
34% 30%
22% 22% 26% 29% 29% 29%
28% 27%
27%
26% 24% 25% 27% 26%
25%
24% 23%
24%
(3%)
1%
(3)% (10%) (14%) (11%) (10%) (9%) (11%)
$17.4 $17.6
$15.5 $14.7 $14.4 $14.0
$16.0 $17.1
$18.1
3Q'10 4Q'10 1Q'11 2Q'11 3Q'11 4Q'11 1Q'12 2Q'12 3Q'12
North America Asia Latam EMEA Corp / Other
LTM Pre-Tax Earnings (ex-LLR) by Region(1,2)
Citicorp – Diverse Earnings Base
29%
7
($B)
Note: Totals may not sum due to rounding.
(1) LTM: Last twelve months to each period. Excludes CVA / DVA in Securities & Banking, the impact of minority investments in Corp / Other, and the impact of loan loss
reserve builds / (releases). For CVA / DVA and the impact of loan loss reserve builds / (releases) for each of the periods presented, please refer to Citigroup’s Historical
and Third Quarter 2012 Quarterly Financial Data Supplements furnished as exhibits to Form 8-K filed with the U.S. Securities and Exchange Commission on March 26,
2012 and October 15, 2012, respectively. Please also refer to Slide 30.
(2) Excludes $10.1B pre-tax loss associated with the TARP repayment and exiting the loss-sharing agreement in 4Q’09.
Financial Results
Announced Repositioning Actions
Citi Holdings
Capital and Returns
Conclusions
Agenda
3
Note:
(1)
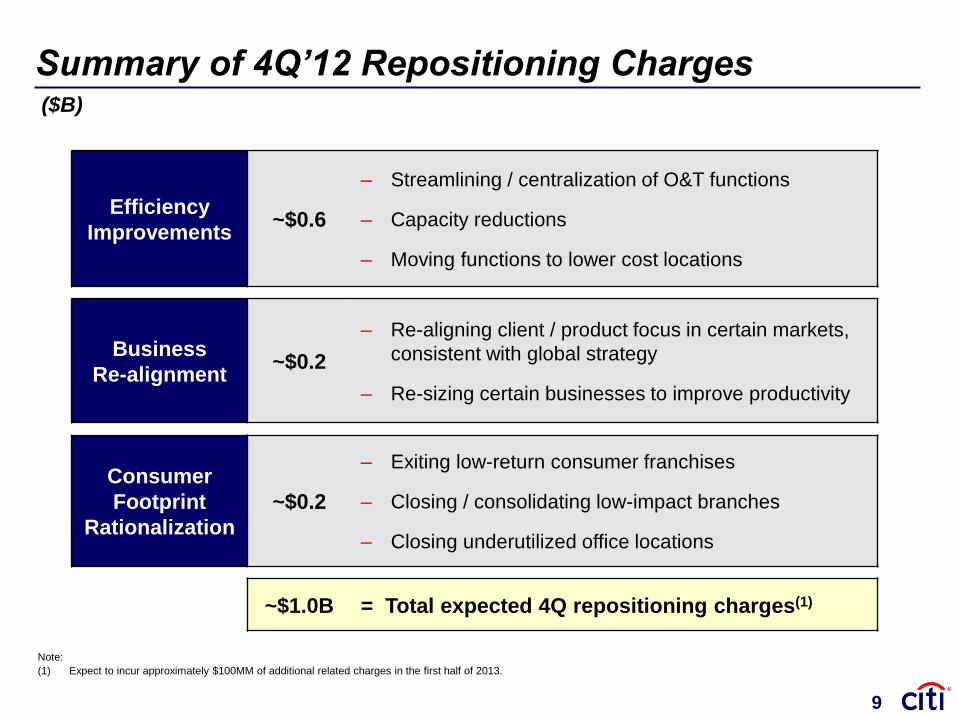
Expect to incur approximately $100MM of additional related charges in the first half of 2013.
Summary of 4Q’12 Repositioning Charges
9
Efficiency
Improvements ~$0.6
‒ Streamlining / centralization of O&T functions
‒ Capacity reductions
‒ Moving functions to lower cost locations
Business
Re-alignment ~$0.2
‒ Re-aligning client / product focus in certain markets,
consistent with global strategy
‒ Re-sizing certain businesses to improve productivity
Consumer
Footprint
Rationalization
~$0.2
‒ Exiting low-return consumer franchises
‒ Closing / consolidating low-impact branches
‒ Closing underutilized office locations
~$1.0B = Total expected 4Q repositioning charges(1)
($B)
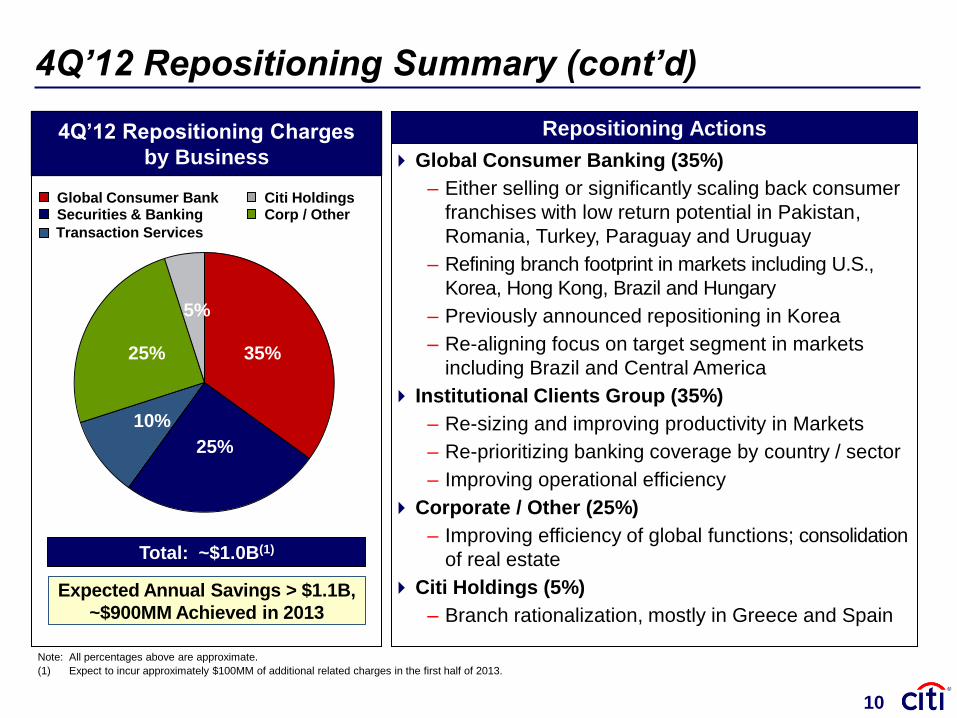
4Q’12 Repositioning Summary (cont’d)
Total: ~$1.0B(1)
Global Consumer Banking (35%)
– Either selling or significantly scaling back consumer
franchises with low return potential in Pakistan,
Romania, Turkey, Paraguay and Uruguay
– Refining branch footprint in markets including U.S.,
Korea, Hong Kong, Brazil and Hungary
– Previously announced repositioning in Korea
– Re-aligning focus on target segment in markets
including Brazil and Central America
Institutional Clients Group (35%)
– Re-sizing and improving productivity in Markets
– Re-prioritizing banking coverage by country / sector
– Improving operational efficiency
Corporate / Other (25%)
– Improving efficiency of global functions; consolidation
of real estate
Citi Holdings (5%)
– Branch rationalization, mostly in Greece and Spain
Repositioning Actions
Expected Annual Savings > $1.1B,
~$900MM Achieved in 2013
4Q’12 Repositioning Charges
by Business
35%
25%
10%
25%
5%
Transaction Services
Securities & Banking Corp / Other Global Consumer Bank Citi Holdings
10
Note: All percentages above are approximate.
(1)
Expect to incur approximately $100MM of additional related charges in the first half of 2013.
Financial Results
Announced Repositioning Actions
Citi Holdings
Capital and Returns
Conclusions
Agenda
3
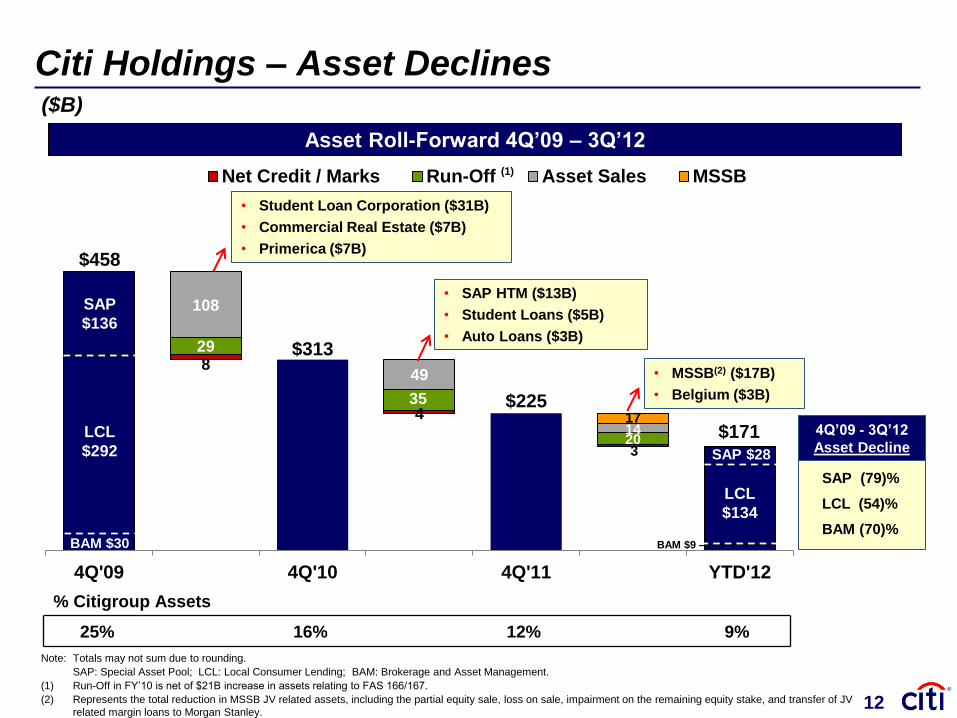
313
$313
225
$225
171
171
8
4
3
29
35
20
108
49
14 17
4Q'09 4Q'10 4Q'11 YTD'12
Net Credit / Marks Run-Off Asset Sales MSSB
SAP
$136
LCL
$292
BAM $30
SAP $28
LCL
$134
$458
$171
Citi Holdings – Asset Declines
Note: Totals may not sum due to rounding.
SAP: Special Asset Pool; LCL: Local Consumer Lending; BAM: Brokerage and Asset Management.
(1) Run-Off in FY’10 is net of $21B increase in assets relating to FAS 166/167.
(2) Represents the total reduction in MSSB JV related assets, including the partial equity sale, loss on sale, impairment on the remaining equity stake, and transfer of JV
related margin loans to Morgan Stanley.
• Student Loan Corporation ($31B)
• Commercial Real Estate ($7B)
• Primerica ($7B)
• SAP HTM ($13B)
• Student Loans ($5B)
• Auto Loans ($3B)
• MSSB(2) ($17B)
• Belgium ($3B)
Asset Roll-Forward 4Q’09 – 3Q’12
% Citigroup Assets
25% 16% 12% 9%
($B)
SAP (79)%
LCL (54)%
BAM (70)%
4Q’09 - 3Q’12
Asset Decline
BAM $9 –
12
(1)
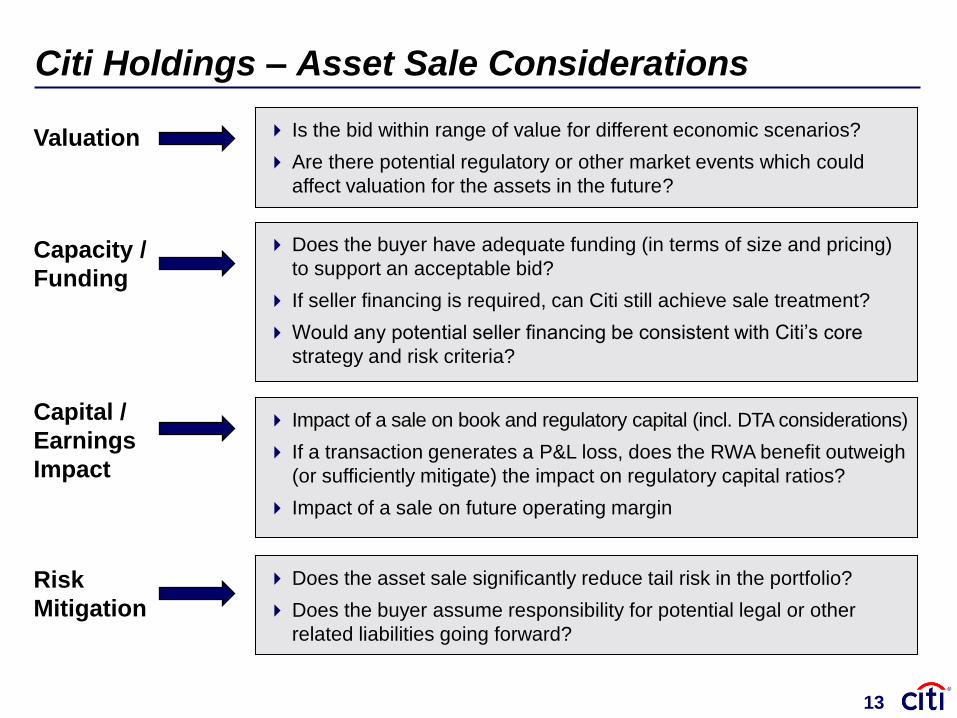
Capital /
Earnings
Impact
Valuation Is the bid within range of value for different economic scenarios?
Are there potential regulatory or other market events which could
affect valuation for the assets in the future?
Impact of a sale on book and regulatory capital (incl. DTA considerations)
If a transaction generates a P&L loss, does the RWA benefit outweigh
(or sufficiently mitigate) the impact on regulatory capital ratios?
Impact of a sale on future operating margin
Citi Holdings – Asset Sale Considerations
Does the asset sale significantly reduce tail risk in the portfolio?
Does the buyer assume responsibility for potential legal or other
related liabilities going forward?
Risk
Mitigation
Does the buyer have adequate funding (in terms of size and pricing)
to support an acceptable bid?
If seller financing is required, can Citi still achieve sale treatment?
Would any potential seller financing be consistent with Citi’s core
strategy and risk criteria?
Capacity /
Funding
13
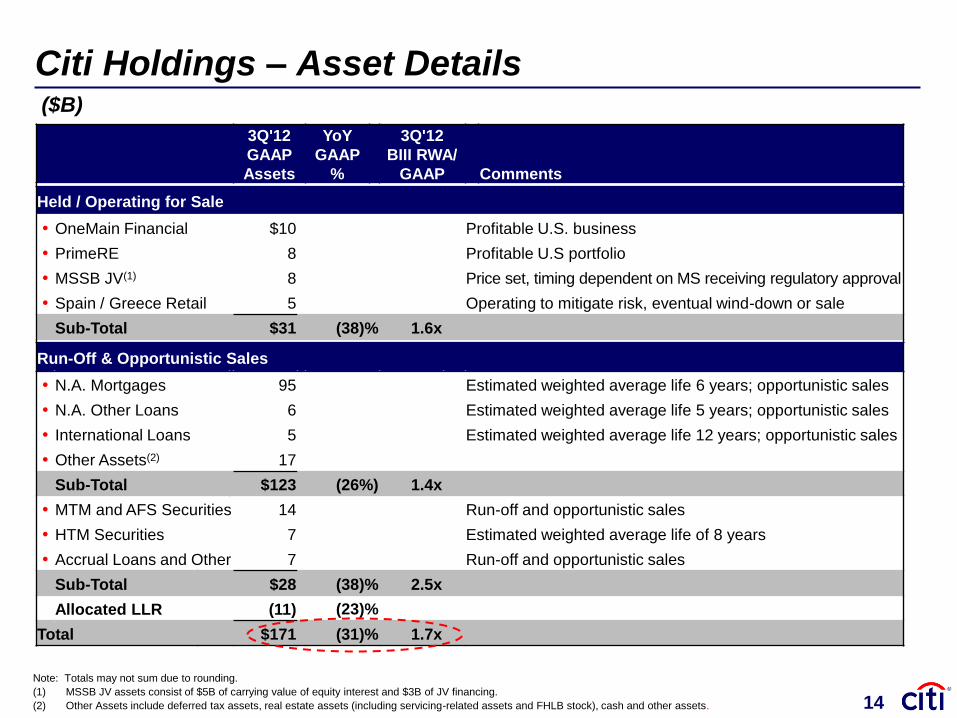
Citi Holdings – Asset Details
Note: Totals may not sum due to rounding.
(1) MSSB JV assets consist of $5B of carrying value of equity interest and $3B of JV financing.
(2) Other Assets include deferred tax assets, real estate assets (including servicing-related assets and FHLB stock), cash and other assets. 14
3Q'12
GAAP
Assets
YoY
GAAP
%
3Q'12
BIII RWA/
GAAP Comments
Held / Operating for Sale
• OneMain Financial $10 Profitable U.S. business
• PrimeRE 8 Profitable U.S portfolio
• MSSB JV(1) 8 Price set, timing dependent on MS receiving regulatory approval
• Spain / Greece Retail 5 Operating to mitigate risk, eventual wind-down or sale
Sub-Total $31 (38)% 1.6x
Run-Off & Opportunistic Sales
• N.A. Mortgages 95 Estimated weighted average life 6 years; opportunistic sales
• N.A. Other Loans 6 Estimated weighted average life 5 years; opportunistic sales
• International Loans 5 Estimated weighted average life 12 years; opportunistic sales
• Other Assets(2) 17
Sub-Total $123 (26%) 1.4x
• MTM and AFS Securities 14 Run-off and opportunistic sales
• HTM Securities 7 Estimated weighted average life of 8 years
• Accrual Loans and Other 7 Run-off and opportunistic sales
Sub-Total $28 (38)% 2.5x
Allocated LLR (11) (23)%
Total $171 (31)% 1.7x
($B)
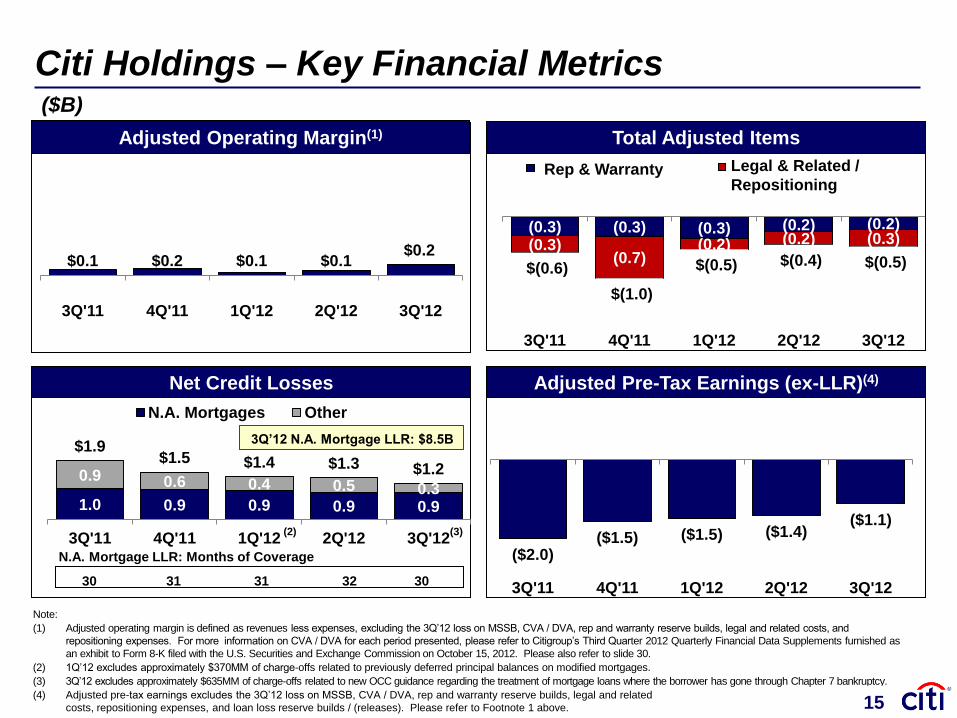
(0.3) (0.3) (0.3) (0.2) (0.2)
(0.3) (0.7)
(0.2) (0.2) (0.3)
$(0.6)
$(1.0)
$(0.5) $(0.4) $(0.5)
3Q'11 4Q'11 1Q'12 2Q'12 3Q'12
Rep & Warranty Legal & Related /
Repositioning
$0.1 $0.2 $0.1 $0.1 $0.2
3Q'11 4Q'11 1Q'12 2Q'12 3Q'12
($2.0) ($1.5) ($1.5) ($1.4)
($1.1)
3Q'11 4Q'11 1Q'12 2Q'12 3Q'12
Citi Holdings – Key Financial Metrics
Adjusted Operating Margin(1)
Net Credit Losses Adjusted Pre-Tax Earnings (ex-LLR)(4)
Total Adjusted Items
1.0 0.9 0.9 0.9 0.9
0.9 0.6 0.4 0.5 0.3
$1.9 $1.5 $1.4 $1.3 $1.2
3Q'11 4Q'11 1Q'12 2Q'12 3Q'12
N.A. Mortgages Other
N.A. Mortgage LLR: Months of Coverage
(2)
3Q’12 N.A. Mortgage LLR: $8.5B
(3)
30 31 31 32 30
Note:
(1) Adjusted operating margin is defined as revenues less expenses, excluding the 3Q’12 loss on MSSB, CVA / DVA, rep and warranty reserve builds, legal and related costs, and
repositioning expenses. For more information on CVA / DVA for each period presented, please refer to Citigroup’s Third Quarter 2012 Quarterly Financial Data Supplements furnished as
an exhibit to Form 8-K filed with the U.S. Securities and Exchange Commission on October 15, 2012. Please also refer to slide 30.
(2) 1Q’12 excludes approximately $370MM of charge-offs related to previously deferred principal balances on modified mortgages.
(3) 3Q’12 excludes approximately $635MM of charge-offs related to new OCC guidance regarding the treatment of mortgage loans where the borrower has gone through Chapter 7 bankruptcy.
(4) Adjusted pre-tax earnings excludes the 3Q’12 loss on MSSB, CVA / DVA, rep and warranty reserve builds, legal and related
costs, repositioning expenses, and loan loss reserve builds / (releases). Please refer to Footnote 1 above.
($B)
15
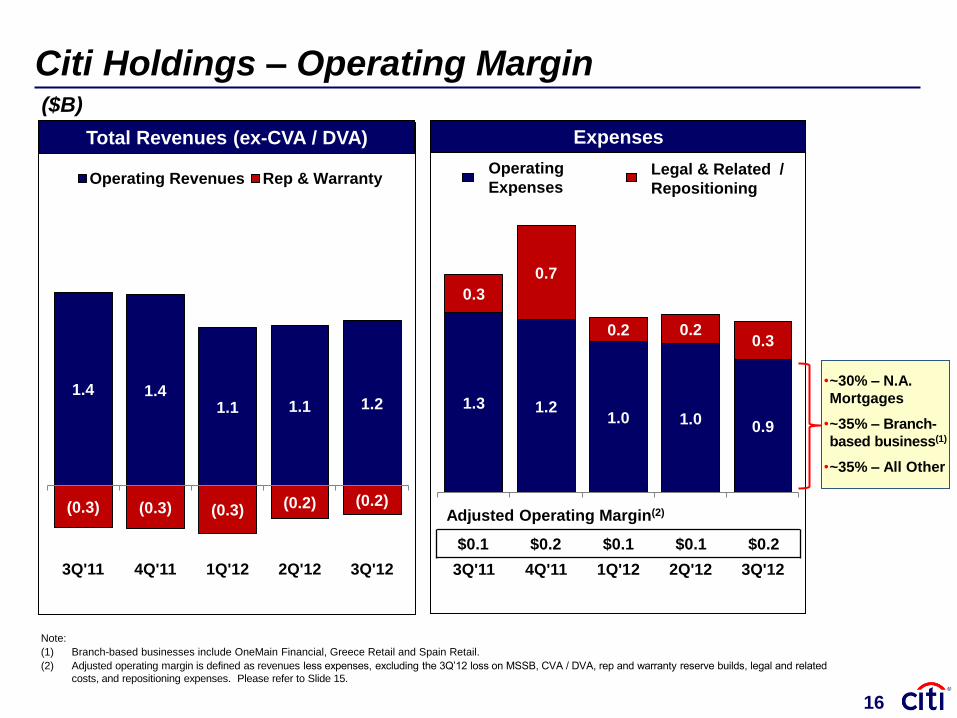
1.3 1.2 1.0 1.0
0.9
0.3
0.7
0.2 0.2 0.3
3Q'11 4Q'11 1Q'12 2Q'12 3Q'12
Operating
Expenses Legal & Related /
Repositioning
1.4 1.4 1.1 1.1 1.2
(0.3) (0.3) (0.3) (0.2) (0.2)
3Q'11 4Q'11 1Q'12 2Q'12 3Q'12
Operating Revenues Rep & Warranty
Citi Holdings – Operating Margin
Total Revenues (ex-CVA / DVA) Expenses
Adjusted Operating Margin(2)
$0.1 $0.2 $0.1 $0.1 $0.2
•~30% – N.A.
Mortgages
•~35% – Branch-
based business(1)
•~35% – All Other
($B)
Note:
(1) Branch-based businesses include OneMain Financial, Greece Retail and Spain Retail.
(2) Adjusted operating margin is defined as revenues less expenses, excluding the 3Q’12 loss on MSSB, CVA / DVA, rep and warranty reserve builds, legal and related
costs, and repositioning expenses. Please refer to Slide 15.
16
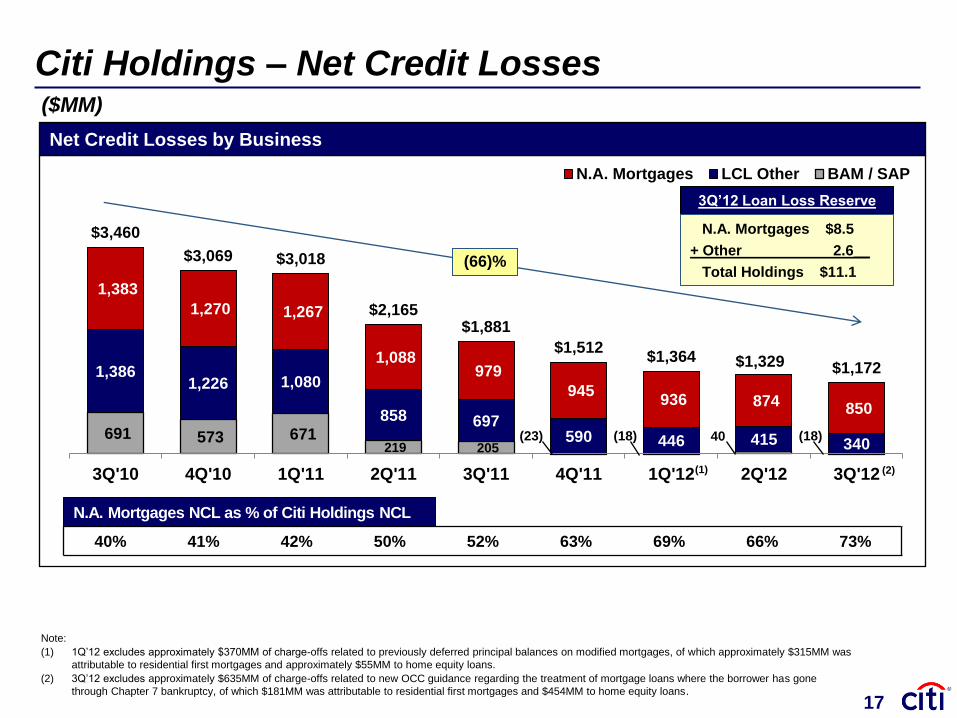
691 573 671 219 205
(23) (18) 40 (18)
1,386 1,226 1,080
858 697 590 446 415 340
1,383
1,270 1,267
1,088 979
945 936 874
850
$3,460
$3,069 $3,018
$2,165 $1,881
$1,512 $1,364 $1,329 $1,172
3Q'10 4Q'10 1Q'11 2Q'11 3Q'11 4Q'11 1Q'12 2Q'12 3Q'12
N.A. Mortgages LCL Other BAM / SAP
Citi Holdings – Net Credit Losses
Net Credit Losses by Business
(66)%
Note:
(1) 1Q’12 excludes approximately $370MM of charge-offs related to previously deferred principal balances on modified mortgages, of which approximately $315MM was
attributable to residential first mortgages and approximately $55MM to home equity loans.
(2) 3Q’12 excludes approximately $635MM of charge-offs related to new OCC guidance regarding the treatment of mortgage loans where the borrower has gone
through Chapter 7 bankruptcy, of which $181MM was attributable to residential first mortgages and $454MM to home equity loans.
40% 41% 42% 50% 52% 63% 69% 66% 73%
(1) (2)
N.A. Mortgages $8.5
+ Other 2.6__
Total Holdings $11.1
3Q’12 Loan Loss Reserve
N.A. Mortgages NCL as % of Citi Holdings NCL
($MM)
17
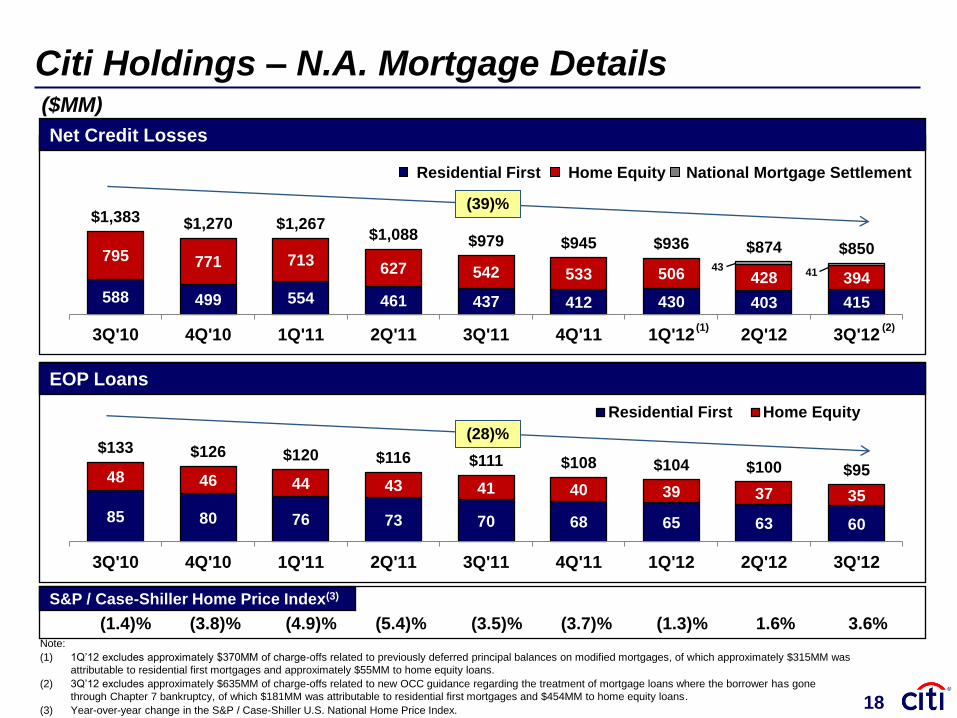
85 80 76 73 70 68 65 63 60
48 46 44 43 41 40 39 37 35
$133 $126 $120 $116 $111 $108 $104 $100 $95
3Q'10 4Q'10 1Q'11 2Q'11 3Q'11 4Q'11 1Q'12 2Q'12 3Q'12
Residential First Home Equity
588 499 554 461 437 412 430 403 415
795 771 713 627 542 533 506 428 394
43 41
$1,383 $1,270 $1,267 $1,088 $979 $945 $936 $874 $850
3Q'10 4Q'10 1Q'11 2Q'11 3Q'11 4Q'11 1Q'12 2Q'12 3Q'12
(1.4)% (3.8)% (4.9)% (5.4)% (3.5)% (3.7)% (1.3)% 1.6% 3.6%
Citi Holdings – N.A. Mortgage Details
S&P / Case-Shiller Home Price Index(3)
EOP Loans
Note:
(1) 1Q’12 excludes approximately $370MM of charge-offs related to previously deferred principal balances on modified mortgages, of which approximately $315MM was
attributable to residential first mortgages and approximately $55MM to home equity loans.
(2) 3Q’12 excludes approximately $635MM of charge-offs related to new OCC guidance regarding the treatment of mortgage loans where the borrower has gone
through Chapter 7 bankruptcy, of which $181MM was attributable to residential first mortgages and $454MM to home equity loans.
(3) Year-over-year change in the S&P / Case-Shiller U.S. National Home Price Index.
(28)%
(2)
Residential First Home Equity
(1)
Net Credit Losses
(39)%
($MM)
18
National Mortgage Settlement
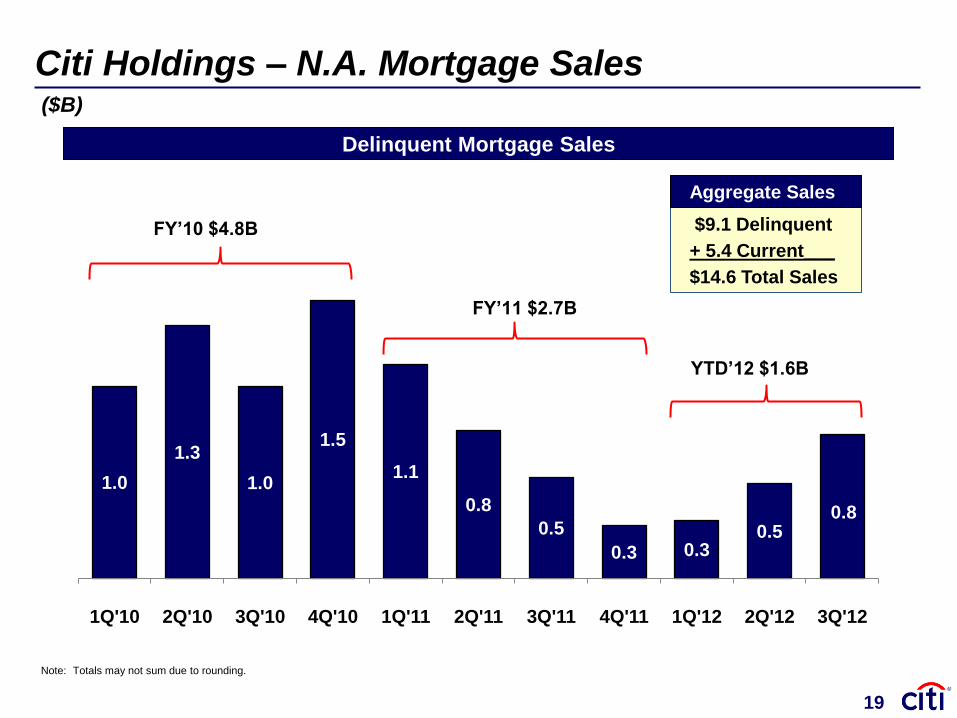
1.0
1.3
1.0
1.5
1.1
0.8
0.5
0.3 0.3 0.5
0.8
1Q'10 2Q'10 3Q'10 4Q'10 1Q'11 2Q'11 3Q'11 4Q'11 1Q'12 2Q'12 3Q'12
FY’10 $4.8B
FY’11 $2.7B
YTD’12 $1.6B
Citi Holdings – N.A. Mortgage Sales
$9.1 Delinquent
+ 5.4 Current___
$14.6 Total Sales
Delinquent Mortgage Sales
Note: Totals may not sum due to rounding.
Aggregate Sales
($B)
19
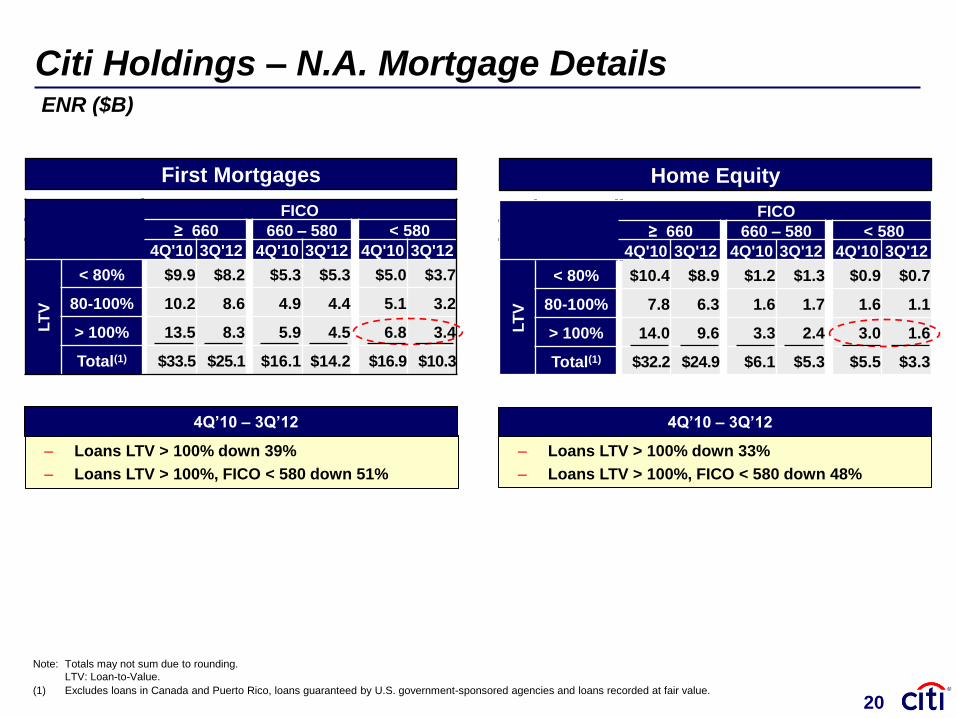
Citi Holdings – N.A. Mortgage Details
Note: Totals may not sum due to rounding.
LTV: Loan-to-Value.
(1) Excludes loans in Canada and Puerto Rico, loans guaranteed by U.S. government-sponsored agencies and loans recorded at fair value.
20
FICO
≥ 660 660 – 580 < 580
4Q'10 3Q'12 4Q'10 3Q'12 4Q'10 3Q'12
LT
V
< 80% $9.9 $8.2 $5.3 $5.3 $5.0 $3.7
80-100% 10.2 8.6 4.9 4.4 5.1 3.2
> 100% 13.5 8.3 5.9 4.5 6.8 3.4
Total(1) $33.5 $25.1 $16.1 $14.2 $16.9 $10.3
First Mortgages
FICO
≥ 660 660 – 580 < 580
4Q'10 3Q'12 4Q'10 3Q'12 4Q'10 3Q'12
LT
V
< 80% $10.4 $8.9 $1.2 $1.3 $0.9 $0.7
80-100% 7.8 6.3 1.6 1.7 1.6 1.1
> 100% 14.0 9.6 3.3 2.4 3.0 1.6
Total(1) $32.2 $24.9 $6.1 $5.3 $5.5 $3.3
Home Equity
‒ Loans LTV > 100% down 39%
‒ Loans LTV > 100%, FICO < 580 down 51%
4Q’10 – 3Q’12
‒ Loans LTV > 100% down 33%
‒ Loans LTV > 100%, FICO < 580 down 48%
4Q’10 – 3Q’12
ENR ($B)
Financial Results
Announced Repositioning Actions
Citi Holdings
Capital and Returns
Conclusions
Agenda
3
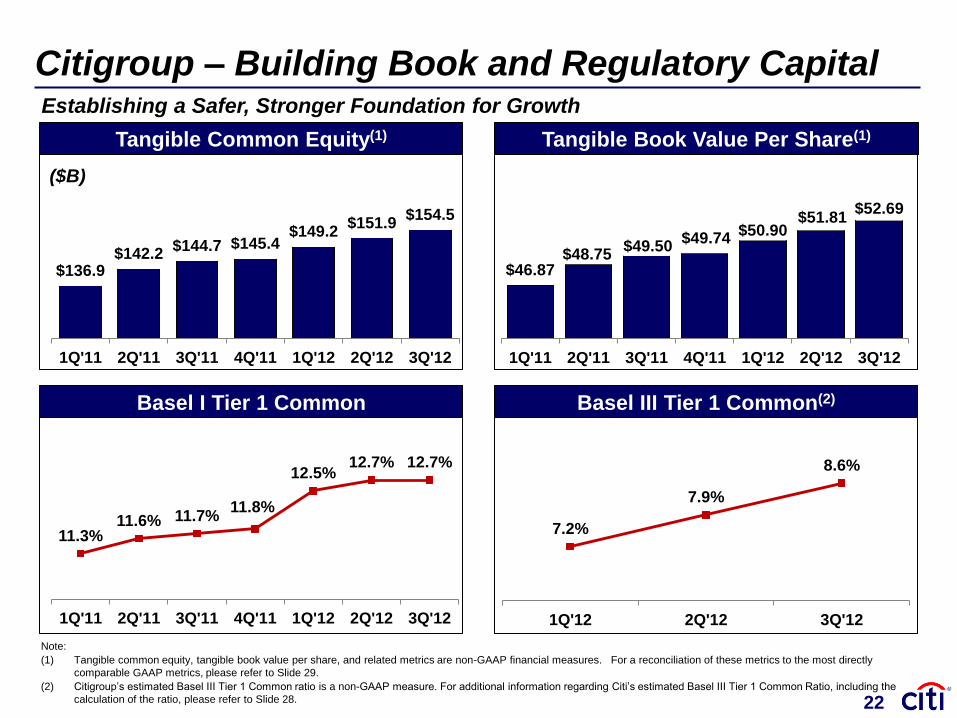
22
7.2%
7.9%
8.6%
1Q'12 2Q'12 3Q'12
$136.9 $142.2
$144.7 $145.4 $149.2
$151.9 $154.5
1Q'11 2Q'11 3Q'11 4Q'11 1Q'12 2Q'12 3Q'12
Basel I Tier 1 Common Basel III Tier 1 Common(2)
($B)
Tangible Book Value Per Share(1) Tangible Common Equity(1)
Citigroup – Building Book and Regulatory Capital
11.3% 11.6% 11.7%
11.8%
12.5% 12.7% 12.7%
1Q'11 2Q'11 3Q'11 4Q'11 1Q'12 2Q'12 3Q'12
$46.87 $48.75
$49.50 $49.74
$50.90 $51.81
$52.69
1Q'11 2Q'11 3Q'11 4Q'11 1Q'12 2Q'12 3Q'12
Note:
(1) Tangible common equity, tangible book value per share, and related metrics are non-GAAP financial measures. For a reconciliation of these metrics to the most directly
comparable GAAP metrics, please refer to Slide 29.
(2) Citigroup’s estimated Basel III Tier 1 Common ratio is a non-GAAP measure. For additional information regarding Citi’s estimated Basel III Tier 1 Common Ratio, including the
calculation of the ratio, please refer to Slide 28.
Establishing a Safer, Stronger Foundation for Growth
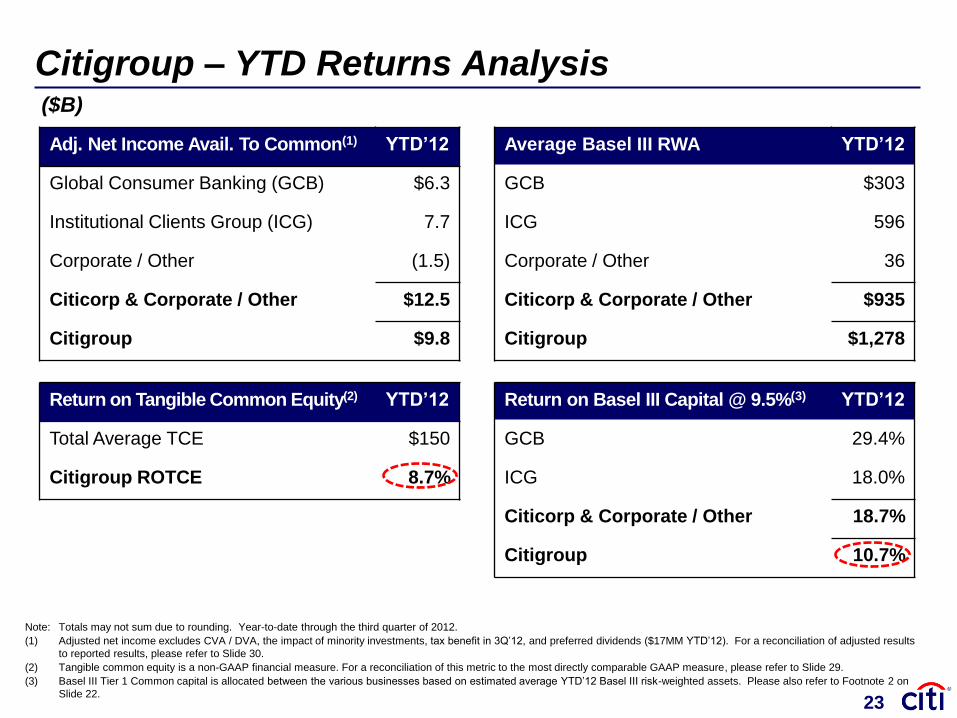
Return on Tangible Common Equity(2) YTD’12
Total Average TCE $150
Citigroup ROTCE 8.7%
Citigroup – YTD Returns Analysis
Note: Totals may not sum due to rounding. Year-to-date through the third quarter of 2012.
(1) Adjusted net income excludes CVA / DVA, the impact of minority investments, tax benefit in 3Q’12, and preferred dividends ($17MM YTD’12). For a reconciliation of adjusted results
to reported results, please refer to Slide 30.
(2) Tangible common equity is a non-GAAP financial measure. For a reconciliation of this metric to the most directly comparable GAAP measure, please refer to Slide 29.
(3) Basel III Tier 1 Common capital is allocated between the various businesses based on estimated average YTD’12 Basel III risk-weighted assets. Please also refer to Footnote 2 on
Slide 22.
Adj. Net Income Avail. To Common(1) YTD’12
Global Consumer Banking (GCB) $6.3
Institutional Clients Group (ICG) 7.7
Corporate / Other (1.5)
Citicorp & Corporate / Other $12.5
Citigroup $9.8
Return on Basel III Capital @ 9.5%(3) YTD’12
GCB 29.4%
ICG 18.0%
Citicorp & Corporate / Other 18.7%
Citigroup 10.7%
Average Basel III RWA YTD’12
GCB $303
ICG 596
Corporate / Other 36
Citicorp & Corporate / Other $935
Citigroup $1,278
23
($B)
Financial Results
Announced Repositioning Actions
Citi Holdings
Capital and Returns
Conclusions
Agenda
3
Conclusions
Year-to-date results reflect continued transformation of Citigroup
Strong momentum in core Citicorp franchise
Repositioning actions are an important step in the rationalization
and simplification of operations
Highly focused on improving Citigroup returns with goals of:
– Optimizing efficiency and returns in Citicorp
– Winding down Citi Holdings in an economically rational manner
– Beginning to return capital to our shareholders
25
Certain statements in this document are “forward-looking statements” within the meaning of the
rules and regulations of the U.S. Securities and Exchange Commission. These statements are
based on management’s current expectations and are subject to uncertainty and changes in
circumstances. These statements are not guarantees of future results or occurrences. Actual
results and capital and other financial condition may differ materially from those included in
these statements due to a variety of factors, including the precautionary statements included in
this document and those contained in Citigroup’s filings with the U.S. Securities and Exchange
Commission, including without limitation the “Risk Factors” section of Citigroup’s 2011 Form
10-K. Any forward-looking statements made by or on behalf of Citigroup speak only as to the
date they are made, and Citi does not undertake to update forward-looking statements to
reflect the impact of circumstances or events that arise after the date the forward-looking
statements were made.
26
John Gerspach Chief Financial Officer
December 5, 2012
Goldman Sachs Financial Services
Conference
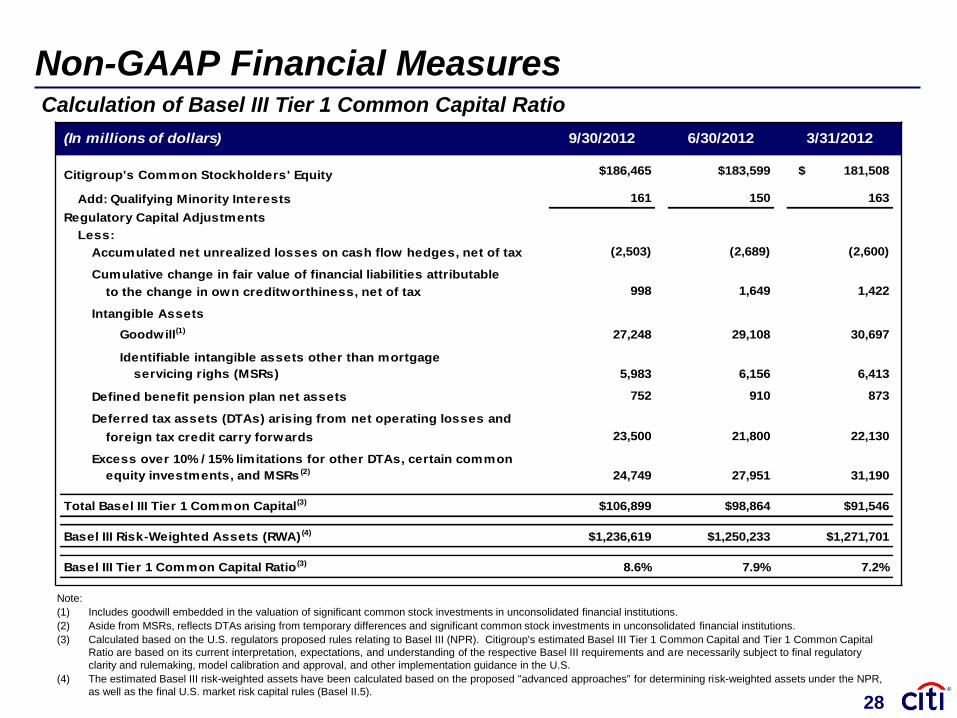
(In millions of dollars) 9/30/2012 6/30/2012 3/31/2012
Citigroup's Common Stockholders' Equity $186,465 $183,599 $ 181,508
Add: Qualifying Minority Interests 161 150 163
Regulatory Capital Adjustments
Less:
Accumulated net unrealized losses on cash flow hedges, net of tax (2,503) (2,689) (2,600)
Cumulative change in fair value of financial liabilities attributable
to the change in own creditworthiness, net of tax 998 1,649 1,422
Intangible Assets
Goodwill(1) 27,248 29,108 30,697
Identifiable intangible assets other than mortgage
servicing righs (MSRs) 5,983 6,156 6,413
Defined benefit pension plan net assets 752 910 873
Deferred tax assets (DTAs) arising from net operating losses and
foreign tax credit carry forwards 23,500 21,800 22,130
Excess over 10% / 15% limitations for other DTAs, certain common
equity investments, and MSRs (2) 24,749 27,951 31,190
Total Basel III Tier 1 Common Capital(3) $106,899 $98,864 $91,546
Basel III Risk-Weighted Assets (RWA) (4) $1,236,619 $1,250,233 $1,271,701
Basel III Tier 1 Common Capital Ratio (3) 8.6% 7.9% 7.2%
Non-GAAP Financial Measures
Note:
(1) Includes goodwill embedded in the valuation of significant common stock investments in unconsolidated financial institutions.
(2) Aside from MSRs, reflects DTAs arising from temporary differences and significant common stock investments in unconsolidated financial institutions.
(3) Calculated based on the U.S. regulators proposed rules relating to Basel III (NPR). Citigroup's estimated Basel III Tier 1 Common Capital and Tier 1 Common Capital
Ratio are based on its current interpretation, expectations, and understanding of the respective Basel III requirements and are necessarily subject to final regulatory
clarity and rulemaking, model calibration and approval, and other implementation guidance in the U.S.
(4) The estimated Basel III risk-weighted assets have been calculated based on the proposed "advanced approaches" for determining risk-weighted assets under the NPR,
as well as the final U.S. market risk capital rules (Basel II.5).
Calculation of Basel III Tier 1 Common Capital Ratio
28
Non-GAAP Financial Measures
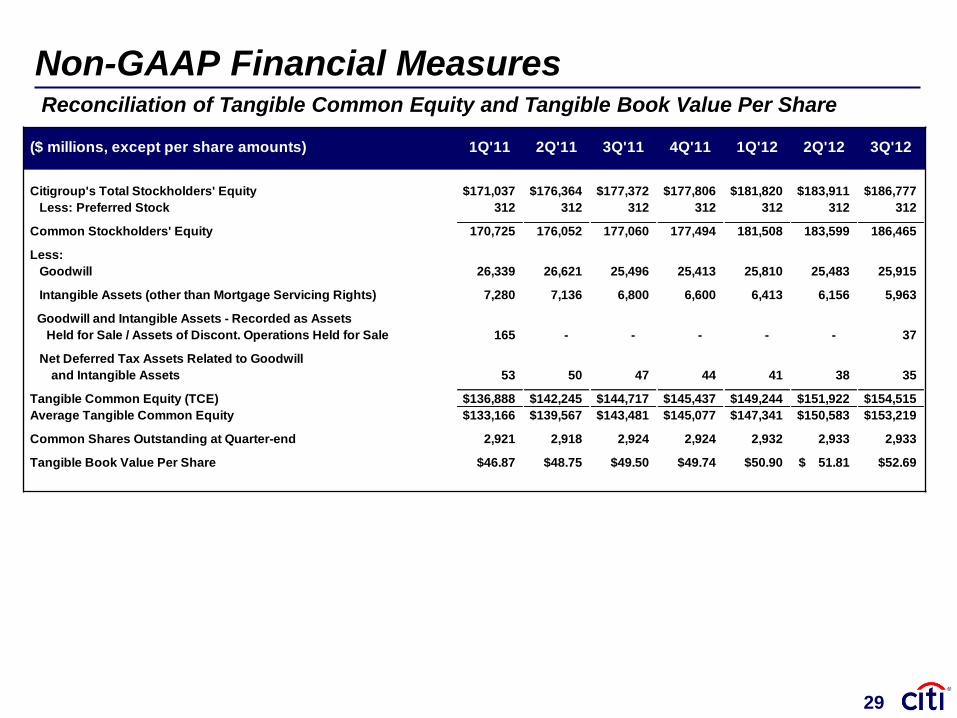
($ millions, except per share amounts) 1Q'11 2Q'11 3Q'11 4Q'11 1Q'12 2Q'12 3Q'12
Citigroup's Total Stockholders' Equity $171,037 $176,364 $177,372 $177,806 $181,820 $183,911 $186,777
Less: Preferred Stock 312 312 312 312 312 312 312
Common Stockholders' Equity 170,725 176,052 177,060 177,494 181,508 183,599 186,465
Less:
Goodwill 26,339 26,621 25,496 25,413 25,810 25,483 25,915
Intangible Assets (other than Mortgage Servicing Rights) 7,280 7,136 6,800 6,600 6,413 6,156 5,963
Goodwill and Intangible Assets - Recorded as Assets
Held for Sale / Assets of Discont. Operations Held for Sale 165 - - - - - 37
Net Deferred Tax Assets Related to Goodwill
and Intangible Assets 53 50 47 44 41 38 35
Tangible Common Equity (TCE) $136,888 $142,245 $144,717 $145,437 $149,244 $151,922 $154,515
Average Tangible Common Equity $133,166 $139,567 $143,481 $145,077 $147,341 $150,583 $153,219
Common Shares Outstanding at Quarter-end 2,921 2,918 2,924 2,924 2,932 2,933 2,933
Tangible Book Value Per Share $46.87 $48.75 $49.50 $49.74 $50.90 51.81$ $52.69
Reconciliation of Tangible Common Equity and Tangible Book Value Per Share
29
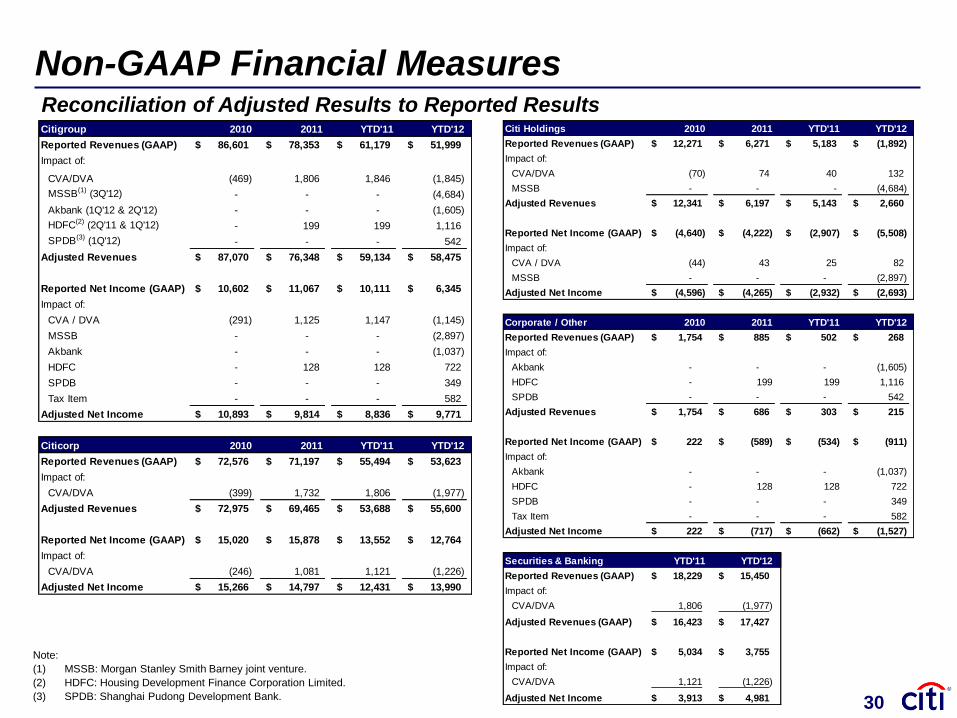
Citigroup 2010 2011 YTD'11 YTD'12
Reported Revenues (GAAP) 86,601$ 78,353$ 61,179$ 51,999$
Impact of:
CVA/DVA (469) 1,806 1,846 (1,845)
MSSB(1) (3Q'12) - - - (4,684)
Akbank (1Q'12 & 2Q'12) - - - (1,605)
HDFC(2) (2Q'11 & 1Q'12) - 199 199 1,116
SPDB(3) (1Q'12) - - - 542
Adjusted Revenues 87,070$ 76,348$ 59,134$ 58,475$
Reported Net Income (GAAP) 10,602$ 11,067$ 10,111$ 6,345$
Impact of:
CVA / DVA (291) 1,125 1,147 (1,145)
MSSB - - - (2,897)
Akbank - - - (1,037)
HDFC - 128 128 722
SPDB - - - 349
Tax Item - - - 582
Adjusted Net Income 10,893$ 9,814$ 8,836$ 9,771$
Citicorp 2010 2011 YTD'11 YTD'12
Reported Revenues (GAAP) 72,576$ 71,197$ 55,494$ 53,623$
Impact of:
CVA/DVA (399) 1,732 1,806 (1,977)
Adjusted Revenues 72,975$ 69,465$ 53,688$ 55,600$
Reported Net Income (GAAP) 15,020$ 15,878$ 13,552$ 12,764$
Impact of:
CVA/DVA (246) 1,081 1,121 (1,226)
Adjusted Net Income 15,266$ 14,797$ 12,431$ 13,990$
Note:
(1) MSSB: Morgan Stanley Smith Barney joint venture.
(2) HDFC: Housing Development Finance Corporation Limited.
(3) SPDB: Shanghai Pudong Development Bank.
Non-GAAP Financial Measures Reconciliation of Adjusted Results to Reported Results
30
Citi Holdings 2010 2011 YTD'11 YTD'12
Reported Revenues (GAAP) 12,271$ 6,271$ 5,183$ (1,892)$
Impact of:
CVA/DVA (70) 74 40 132
MSSB - - - (4,684)
Adjusted Revenues 12,341$ 6,197$ 5,143$ 2,660$
Reported Net Income (GAAP) (4,640)$ (4,222)$ (2,907)$ (5,508)$
Impact of:
CVA / DVA (44) 43 25 82
MSSB - - - (2,897)
Adjusted Net Income (4,596)$ (4,265)$ (2,932)$ (2,693)$
Corporate / Other 2010 2011 YTD'11 YTD'12
Reported Revenues (GAAP) 1,754$ 885$ 502$ 268$
Impact of:
Akbank - - - (1,605)
HDFC - 199 199 1,116
SPDB - - - 542
Adjusted Revenues 1,754$ 686$ 303$ 215$
Reported Net Income (GAAP) 222$ (589)$ (534)$ (911)$
Impact of:
Akbank - - - (1,037)
HDFC - 128 128 722
SPDB - - - 349
Tax Item - - - 582
Adjusted Net Income 222$ (717)$ (662)$ (1,527)$
Securities & Banking YTD'11 YTD'12
Reported Revenues (GAAP) 18,229$ 15,450$
Impact of:
CVA/DVA 1,806 (1,977)
Adjusted Revenues (GAAP) 16,423$ 17,427$
Reported Net Income (GAAP) 5,034$ 3,755$
Impact of:
CVA/DVA 1,121 (1,226)
Adjusted Net Income 3,913$ 4,981$