Embed Size (px)
Citation preview

www.fcx.com
Goldman SachsBasic Materials
Conference
Goldman SachsBasic Materials
Conference
June 4, 2009June 4, 2009
Kathleen L. QuirkExecutive Vice President &
Chief Financial Officer
Kathleen L. QuirkExecutive Vice President &
Chief Financial Officer

2
This presentation contains forward-looking statements in which we discuss factors we believe may affect our performance
in the future. Forward-looking statements are all statements other than historical facts, such as statements regarding
projected ore grades and milling rates, projected sales volumes, projected unit net cash costs, projected operating cash flows,
projected capital expenditures, the impact of copper, gold and molybdenum price changes, and projected EBITDA. Accuracy
of the forward-looking statements depends on assumptions about events that change over time and is thus susceptible to
periodic change based on actual experience and new developments. FCX cautions readers that it assumes no obligation to
update or publicly release any revisions to the forward-looking statements in this presentation and, except to the extent
required by applicable law, does not intend to update or otherwise revise the forward-looking statements more frequently
than quarterly. Additionally, important factors that might cause future results to differ from these projections include mine
sequencing, production rates, industry risks, commodity prices, political risks, weather-related risks, labor relations, currency
translation risks and other factors described in FCX's Annual Report on Form 10-K for the year ended December 31, 2008,
filed with the Securities and Exchange Commission (SEC), as updated by our subsequent filings with the SEC.
This presentation also contains certain financial measures such as unit net cash costs per pound of copper and unit net cash
costs per pound of molybdenum. As required by SEC Regulation G, reconciliations of these measures to amounts reported in
FCX’s consolidated financial statements are in the supplemental schedule, “Product Revenues and Production Costs,” which is
available on our internet web site www.fcx.com.
Cautionary Statement Regarding Forward-Looking Statements
Cautionary Statement Regarding Forward-Looking Statements
3
Core AssetsCore Assets
Long-Lived Reserves with Growth Potential
Geographically Diverse Operations
Flexible Operating Structure
Experienced Team
Focused Strategy
2008 Annual Report Highlights
4
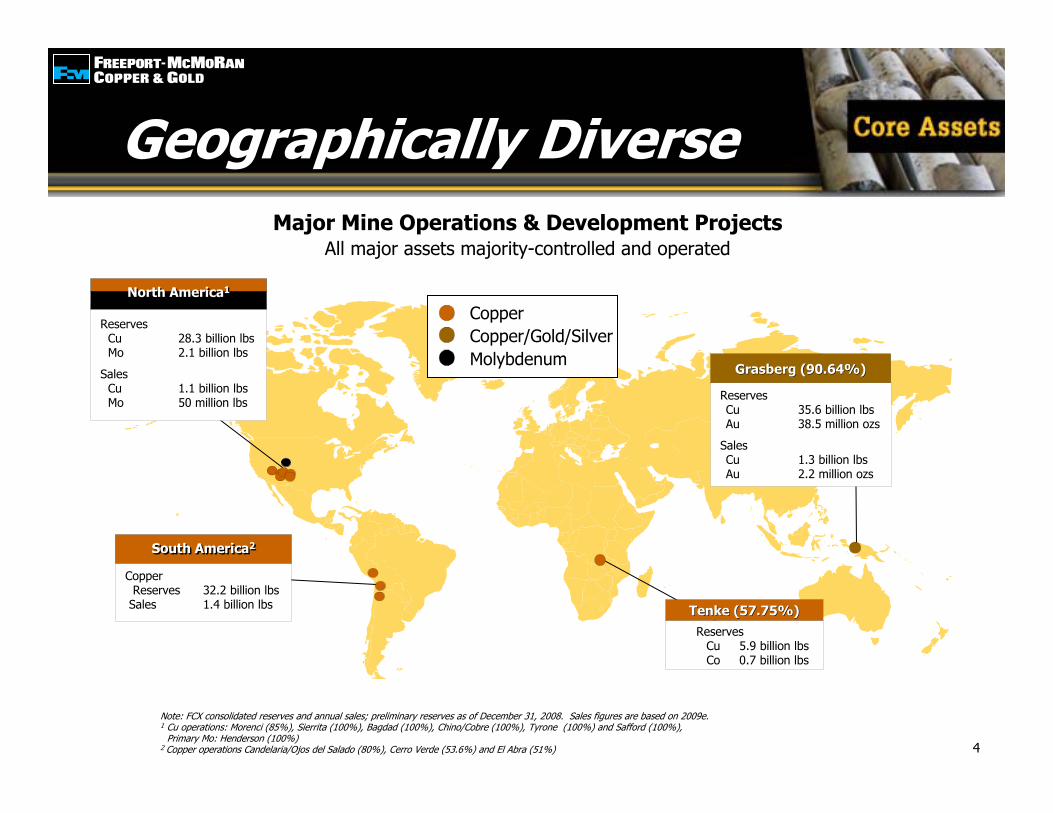
Tenke (57.75%)Tenke (57.75%)Reserves
Cu 5.9 billion lbsCo 0.7 billion lbs
Grasberg (90.64%)Grasberg (90.64%)
ReservesCu 35.6 billion lbsAu 38.5 million ozs
SalesCu 1.3 billion lbsAu 2.2 million ozs
CopperCopper/Gold/SilverMolybdenum
Major Mine Operations & Development ProjectsAll major assets majority-controlled and operated
ReservesCu 28.3 billion lbsMo 2.1 billion lbs
SalesCu 1.1 billion lbsMo 50 million lbs
North America1North America1
Note: FCX consolidated reserves and annual sales; preliminary reserves as of December 31, 2008. Sales figures are based on 2009e.1 Cu operations: Morenci (85%), Sierrita (100%), Bagdad (100%), Chino/Cobre (100%), Tyrone (100%) and Safford (100%),
Primary Mo: Henderson (100%) 2 Copper operations Candelaria/Ojos del Salado (80%), Cerro Verde (53.6%) and El Abra (51%)
Geographically DiverseGeographically Diverse
4
CopperReserves 32.2 billion lbs
Sales 1.4 billion lbs
South America2South America2
5
First Quarter HighlightsFirst Quarter Highlights
Strong Execution of Revised Operating Plan
Solid Performance at Grasberg
Achievement of Significant Cost Reductions
Advanced Construction at Tenke
Strengthened Liquidity Position Through Equity Offering
Improved Market Sentiment – Copper Top Performing Commodity

66
Achieving Cost ReductionsSite Production & Delivery Costs - ConsolidatedAchieving Cost ReductionsSite Production & Delivery Costs - Consolidated
$1.66
$1.07
Revised Operating Plans
Grasberg Ore Grades
Aggressive Cost Management/Lower Input Costs
36%Reduction
3Q08 1Q09
ConsolidatedSite Production & Delivery
$ per pound
77
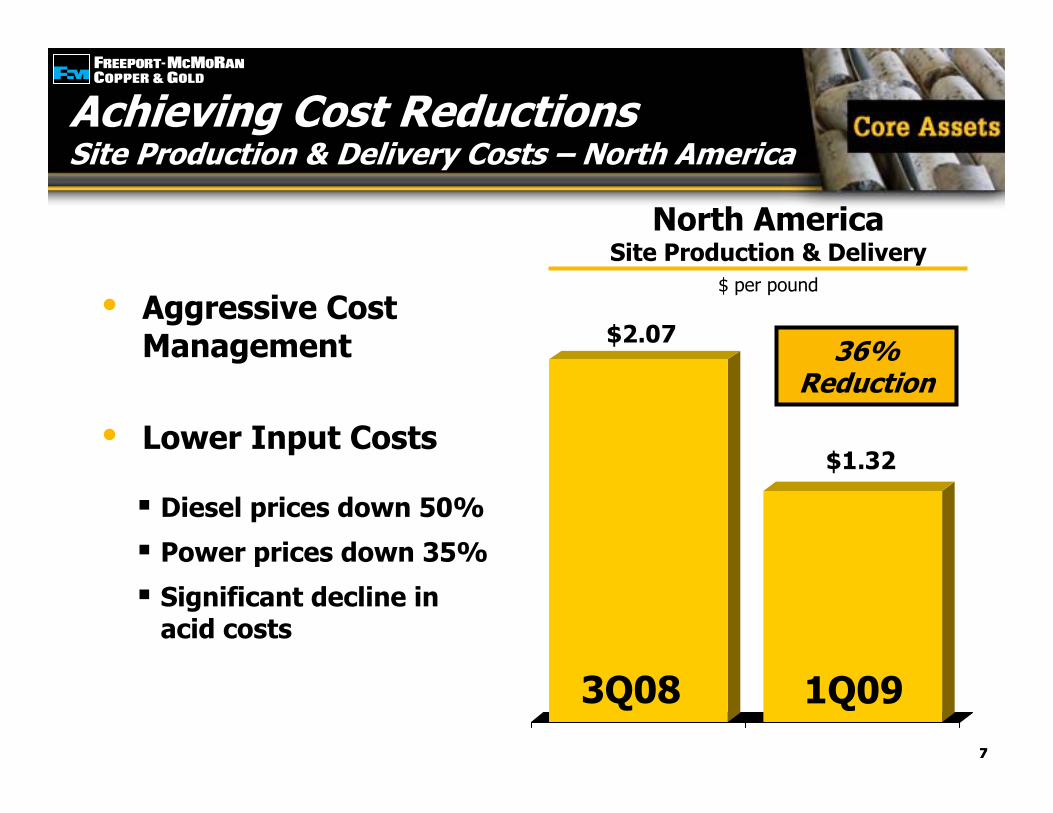
Achieving Cost ReductionsSite Production & Delivery Costs – North AmericaAchieving Cost ReductionsSite Production & Delivery Costs – North America
$2.07
$1.32
Aggressive Cost Management
Lower Input Costs
36%Reduction
Diesel prices down 50%
Power prices down 35%
Significant decline in acid costs
3Q08 1Q09
North AmericaSite Production & Delivery
$ per pound

8
Copper Price & InventoriesCopper Price & Inventories
As of May 29, 2009* LME and Comex, excluding Shanghai stocks, producer, consumer and merchant stocks.
Cen
ts Per P
oun
d0
00
’s M
etri
c To
ns
0
250
500
750
1,000
1,250
1,500
1,750
2,000
Jan-03 Jul-03 Jan-04 Jul-04 Jan-05 Jul-05 Jan-06 Jul-06 Jan-07 Jul-07 Jan-08 Jul-08 Jan-090
50
100
150
200
250
300
350
400
LME & COMEX Exchange Stocks* LME & COMEX Exchange Stocks*
LME Copper Price

9
Copper Market UpdateCopper Market Update
China Has Been Primary Driver in 2009• Stimulus Plan is Focused on Infrastructure
Spending• Scarcity of Scrap has Resulted in Higher
Demand for Cathode• SRB Purchases
Demand in the U.S., Europe and Japan Remains Weak
58%
54%
33%31%
19%
-7%-10%
0%
10%
20%
30%
40%
50%
60%
Copper Lead Tin Zinc Nickel Aluminum
Change in PricesYear-to-Date
Source: Bloomberg as of May 29, 2009
Demand
Involuntary Supply Constraints Continue
Mine Curtailments ~ 5% of Production
LME Inventories Currently ~ 312 kt• Down ~ 28 kt YTD
• Peaked at 548 kt in Late February
• Down ~ 235 kt From Recent High
Supply
10
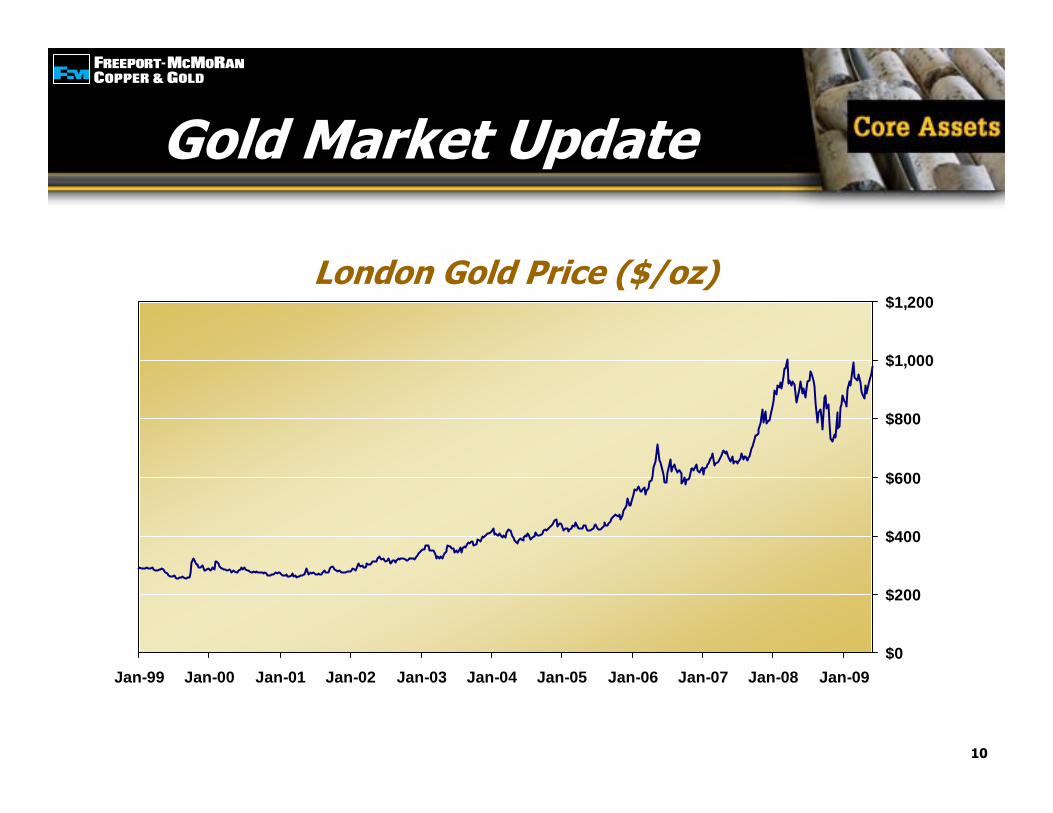
Gold Market UpdateGold Market Update
London Gold Price ($/oz)
$0
$200
$400
$600
$800
$1,000
$1,200
Jan-99 Jan-00 Jan-01 Jan-02 Jan-03 Jan-04 Jan-05 Jan-06 Jan-07 Jan-08 Jan-09

11
Molybdenum Market UpdateMolybdenum Market Update
Molybdenum Price* ($/lb)
$0
$5
$10
$15
$20
$25
$30
$35
$40
Jan-02
Jul-02
Jan-03
Jul-03
Jan-04
Jul-04
Jan-05
Jul-05
Jan-06
Jul-06
Jan-07
Jul-07
Jan-08
Jul-08
Jan-09
* Metals Week – Molybdenum Dealer Oxide Price
2009 Range: $7.825 - $9.50/lb
Current Price: $9.95/lb
Year Ago Price: $33.15/lb
Destocking in Europe Has Been Reduced
Chinese Have Begun to Import
Producers Continue to Reduce Supply
(mm lbs of molybdenum)
2007 2008 1Q09 2Q09e2007 2008 1Q09 2Q09e
Consumption 458.8 458.2 94.0 100.0Supply 467.8 483.0 105.7 102.5Surplus / (Deficit) 9.0 24.8 11.7 2.5
Source: CRU April 8, 2009

1212
Operating Plan OverviewOperating Plan Overview
Reduced rates at Morenci, Safford and Tyrone
Suspended operations at Chino; produce from leach pads
Reduced mining rates in Candelaria/Ojos district
Reduced further with an approximate 40% reduction to Henderson’s annual production, which totaled 40mm lbs in 2008
Adjusted production plans at certain by-product mines, including Cerro Verde which produced 3mm lbs in 2008
Deferred projects & reduced manpower, costs and CAPEX
Continue to refine & optimize plans and aggressively manage costs
North & South America
Molybdenum
All Operations

13
Copper Sales (billion lbs) Gold Sales (million ozs)
Sales Profile 2007 - 2010eSales Profile 2007 - 2010e
____________________Note: Consolidated copper sales include approximately 647 mm lbs in 2007, 699 mm lbs in 2008,
750 mm lbs in 2009e, and 740 mm lbs in 2010e for noncontrolling interest; excludes purchased copper
____________________Note: Consolidated gold sales include approximately 228 k oz in 2007, 134 k oz in 2008,
230 k oz in 2009e, and 210 k oz in 2010e for noncontrolling interest
3.94.1
3.9 3.8
0
1
2
3
4
5
2007 2008 2009e 2010e
2.3
1.3
2.32.1
0
1
2
3
2007 2008 2009e 2010e
69 71
5060
0
20
40
60
80
100
2007 2008 2009e 2010e
Molybdenum Sales (million lbs)
ProForma*
ProForma*
ProForma*
* 2007 includes pre-acquisition sales of 505 mm lbs of copper, 18 k oz of gold and 17 mm lbs of molybdenum e = estimate. Please see Cautionary Statement.

14
Copper Sales (million lbs)
____________________Note: Consolidated copper sales include approximately 174 mm lbs in 1Q09, 175 mm lbs in 2Q09e,
200 mm lbs in 3Q09e and 200 mm lbs in 4Q09e for noncontrolling interest; excludes purchased copper
____________________Note: Consolidated gold sales include approximately 53 k oz in 1Q09, 65 k oz in 2Q09e,
60 k oz in 3Q09e and 50 k oz in 4Q09e for noncontrolling interest
1,020955 960 975
0
250
500
750
1,000
1,250
1Q09 2Q09e 3Q09e 4Q09e
545650 625
480
0
150
300
450
600
1Q09 2Q09e 3Q09e 4Q09e
10 1114 15
0
5
10
15
20
25
1Q09 2Q09e 3Q09e 4Q09e
Molybdenum Sales (million lbs)
2009e Quarterly Payable Metal Sales2009e Quarterly Payable Metal Sales
Gold Sales (thousand ozs)
e = estimate. Please see Cautionary Statement.
15
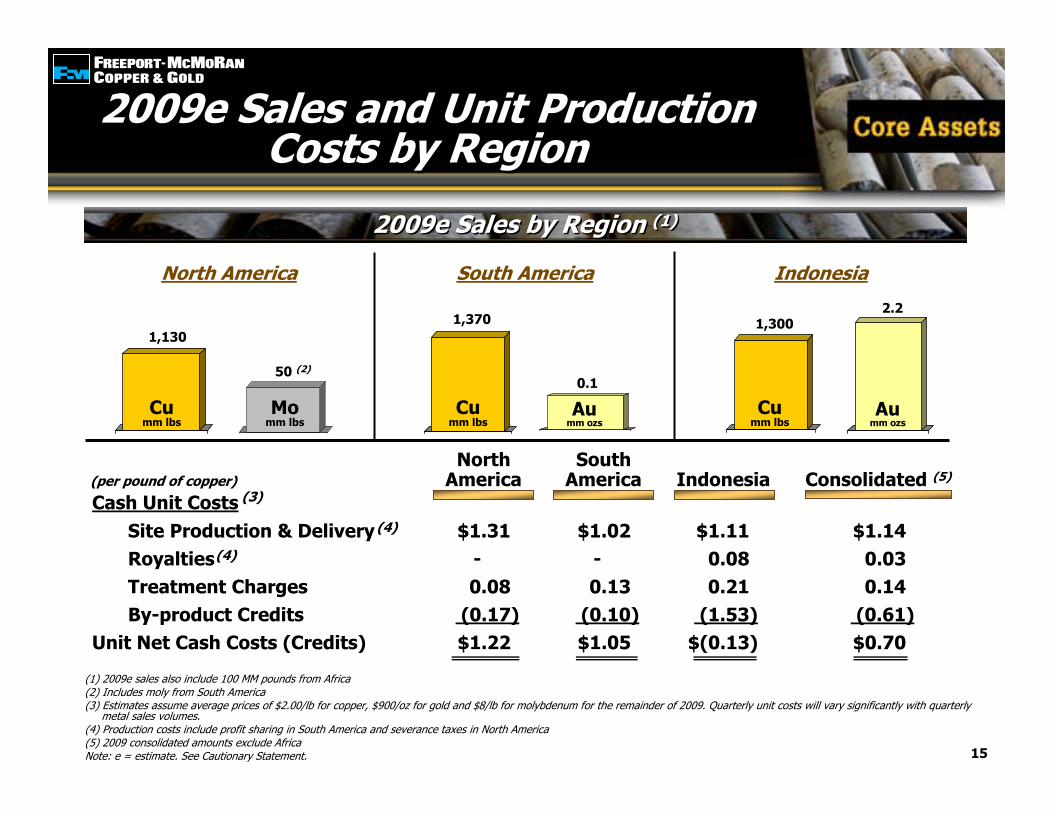
2009e Sales and Unit Production Costs by Region
2009e Sales and Unit Production Costs by Region
(per pound of copper)
2009e Sales by Region (1)2009e Sales by Region (1)
2 0 0 9 e
Cumm lbs
2009e
Momm lbs
1,130
50 (2)
North America South America Indonesia
2 0 0 9 e
Cumm lbs
2009e
Aumm ozs
1,370
0.1
2009e
Cumm lbs
2 0 0 9 e
Aumm ozs
1,3002.2
North SouthAmerica America Indonesia Consolidated (5)
Cash Unit CostsSite Production & Delivery $1.31 $1.02 $1.11 $1.14Royalties - - 0.08 0.03Treatment Charges 0.08 0.13 0.21 0.14By-product Credits (0.17) (0.10) (1.53) (0.61)
Unit Net Cash Costs (Credits) $1.22 $1.05 $(0.13) $0.70
(3)
(4)
(4)
(1) 2009e sales also include 100 MM pounds from Africa(2) Includes moly from South America(3) Estimates assume average prices of $2.00/lb for copper, $900/oz for gold and $8/lb for molybdenum for the remainder of 2009. Quarterly unit costs will vary significantly with quarterly
metal sales volumes.(4) Production costs include profit sharing in South America and severance taxes in North America(5) 2009 consolidated amounts exclude AfricaNote: e = estimate. See Cautionary Statement.
1616
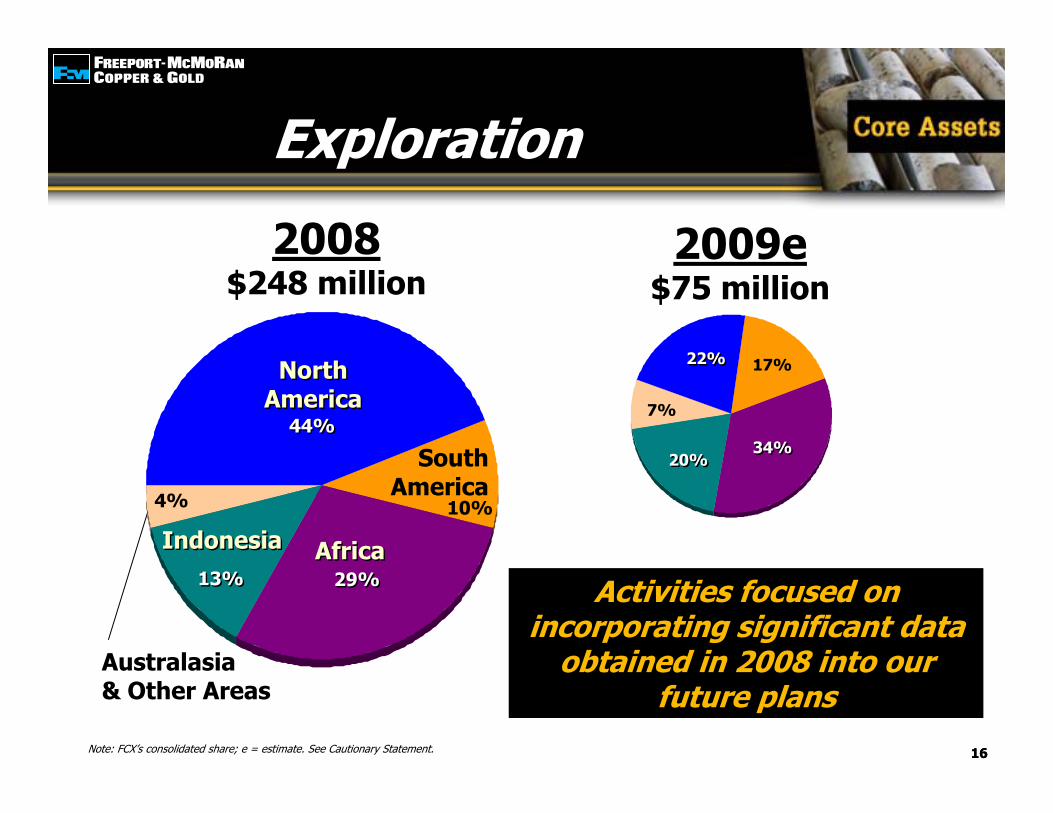
ExplorationExploration
2009e$75 million
2008$248 million
NorthAmericaNorth
America
SouthAmerica
AfricaAfricaIndonesiaIndonesia
Australasia& Other Areas
Activities focused on incorporating significant data
obtained in 2008 into our future plans
44%44%
29%29%13%13%
4% 10%
22%22%
34%34%20%20%
7%
17%
Note: FCX’s consolidated share; e = estimate. See Cautionary Statement.

17
EBITDA and Cash Flow at Various Copper PricesEBITDA and Cash Flow
at Various Copper Prices2009e & 2010e Average Annual EBITDA ($900 Gold & $8 Molybdenum)
2009e & 2010e Average Annual Operating Cash Flow (excluding Working Capital)* ($900 Gold & $8 Molybdenum)
(US$ billions)
$0
$2
$4
$6
$8
Cu $1.50/lb Cu $2.00/lb Cu $2.50/lb
$0
$1
$2
$3
$4
$5
Cu $1.50/lb Cu $2.00/lb Cu $2.50/lb
(US$ billions)
____________________* Excludes working capital changes. 2009e expected to be impacted by negative working capital totaling $600 million (at $2.00 copper) primarily associated with final settlement to
customers on 2008 open pounds. Initiatives to reduce working capital requirements under way.Note: On an annual basis, each $50/oz change in gold approximates $100 million to EBITDA and $60 million to operating cash flow; each $2.00/lb of molybdenum equates to $100 million
to EBITDA and $90 mm to operating cash flow. EBITDA equals operating income plus depreciation, depletion and amortization.e = estimate. See Cautionary Statement
18
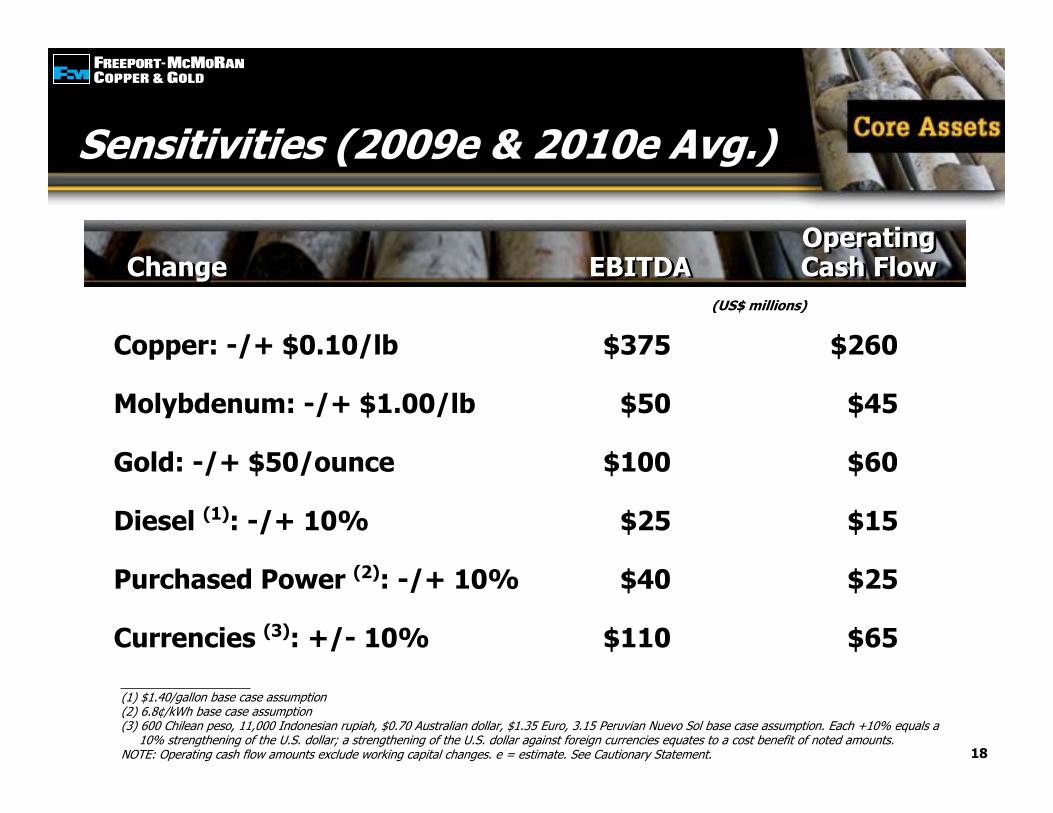
Sensitivities (2009e & 2010e Avg.)Sensitivities (2009e & 2010e Avg.)
OperatingChange EBITDA Cash Flow
OperatingChange EBITDA Cash Flow
Copper: -/+ $0.10/lb $375 $260
Molybdenum: -/+ $1.00/lb $50 $45
Gold: -/+ $50/ounce $100 $60
Diesel (1): -/+ 10% $25 $15
Purchased Power (2): -/+ 10% $40 $25
Currencies (3): +/- 10% $110 $65
(US$ millions)
____________________(1) $1.40/gallon base case assumption(2) 6.8¢/kWh base case assumption(3) 600 Chilean peso, 11,000 Indonesian rupiah, $0.70 Australian dollar, $1.35 Euro, 3.15 Peruvian Nuevo Sol base case assumption. Each +10% equals a
10% strengthening of the U.S. dollar; a strengthening of the U.S. dollar against foreign currencies equates to a cost benefit of noted amounts.NOTE: Operating cash flow amounts exclude working capital changes. e = estimate. See Cautionary Statement.

19
Capital Expenditures (1)Capital Expenditures (1)
(US$ billions)
1.6
1.1
0.7
0.6
0.5
0.5
$0.0
$0.5
$1.0
$1.5
$2.0
$2.5
$3.0
2008 2009e 2010e
All OtherMajor Projects
$2.7
$1.3
(1) Capital expenditure estimates will continue to be reviewed and revised subject to market conditions(2) Includes Tenke development and Grasberg underground development(3) Includes Grasberg underground development and El Abra sulfideNote: Includes capitalized interest. e = estimate. Please see Cautionary Statement.
$1.0
(2) (3)
2020
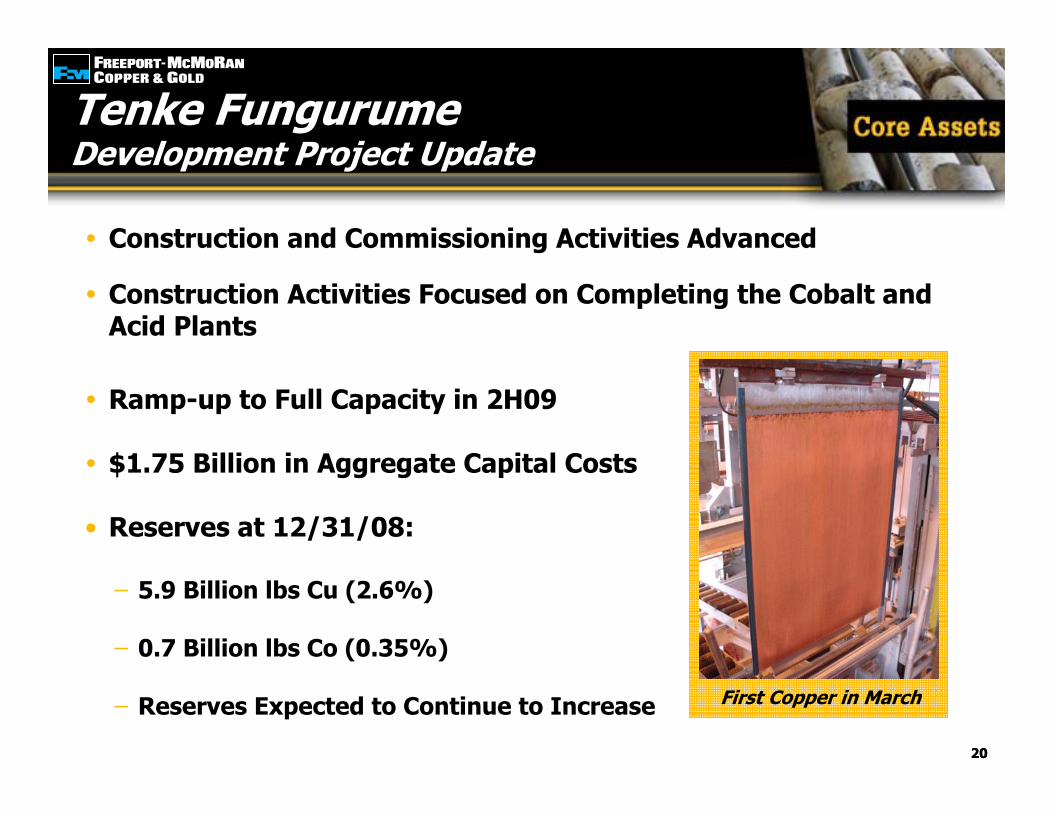
Construction and Commissioning Activities Advanced
Construction Activities Focused on Completing the Cobalt and Acid Plants
First Copper in March
Tenke FungurumeDevelopment Project UpdateTenke FungurumeDevelopment Project Update
Ramp-up to Full Capacity in 2H09
$1.75 Billion in Aggregate Capital Costs
• Reserves at 12/31/08:
5.9 Billion lbs Cu (2.6%)
0.7 Billion lbs Co (0.35%)
Reserves Expected to Continue to Increase

2121
Tenke FungurumeDevelopment Project UpdateTenke FungurumeDevelopment Project Update
Construction Site1Q09
Construction Site1Q09
SAG MillFirst Ore to Mill in MarchSAG MillFirst Ore to Mill in March
Sulphuric Acid PlantConstruction Activities ContinueSulphuric Acid PlantConstruction Activities Continue
EWEW
21
PLSPondsPLS
PondsLeach& CCDLeach& CCD
SXSX
SAGSAG
StockpileStockpile
CobaltPlant
CobaltPlant
AcidPlantAcidPlant
Loaded BlanksReady for Stripping
Loaded BlanksReady for Stripping
Cathodes Ready for Shipment

2222
Tenke FungurumeTenke Fungurume
Largest Investment in DRC
World-class Design & Construction
Significant Infrastructure Upgrades
Expanding Social & Community Programs Workers install a liner for the Tailings Storage Facility
Project Will Provide Important Benefits:
Employment
Local Services
Taxes
Royalties
Dividend PaymentsChildren use one of the additional potable water wells at Fungurume

2323
Underground Mine Development in IndonesiaGrasberg District Ore BodiesUnderground Mine Development in IndonesiaGrasberg District Ore Bodies
DOZDOZ
DMLZDMLZ
GrasbergBlock CaveGrasberg
Block CaveKucing
Liar
Grasbergopen pit
Grasbergopen pit
Portals(at Ridge Camp)
MLA
Common Infrastructure2,500 m elev
GrasbergBC Spur
Kucing Liar Spur
Big Gossan Spur DMLZ Spur
BigGossanBigGossan
23
Amole2,900 m elev
N
Continuing underground development
Big Gossan mine
Grasberg Block Cave
Expansion of the DOZ mine to 80,000 t/d with completion by 2010
~$160MM in aggregate capexfor underground development in 2009
Continuing underground development
Big Gossan mine
Grasberg Block Cave
Expansion of the DOZ mine to 80,000 t/d with completion by 2010
~$160MM in aggregate capexfor underground development in 2009

24
FCX Debt Maturities 3/31/09FCX Debt Maturities 3/31/09
$0
$1,000
$2,000
$3,000
$4,000
$5,000
$6,000
2009 2010 2011 2012 2013 2014 2015 Thereafter
Public Debt All Other Debt
$83 $24$133 $105 $13
(US$ millions)
$2,514
$4,002
$353
8.375% Senior NotesandPD
SeniorNotes
Floating Rate & 8.25% Senior Notes
6.875% Sen. Notes
Total Debt & Cash at 3/31/09
Public Debt $6.9Other Debt 0.3
Total Debt $7.2
Consolidated Cash $0.6
(US$ billions)
25
Maintain Strong Balance Sheet & Liquidity Position
Aggressive Cost Management
Capital Investments Will be Limited in Current Market Environment
Near-Term Focus Will be on Protecting Liquidity While Preserving Large Mineral Resources and Growth Options
Board to Review Financial Policy on an Ongoing Basis
Financial PolicyFinancial Policy
26
FCX Investment SummaryFCX Investment Summary
World’s Premier Publicly Traded Copper Company
World’s Largest Molybdenum Producer & Significant Gold Producer
Long-lived Reserves, Geographically Diverse Operations
Flexible Operating Structure Can Respond to Varying Market Conditions
Significant Reserve Growth


![Service Assurance Market Review Jun09[1]](https://img.pdfslide.us/doc/110x75/5500f03b4a7959995f8b4eb7/service-assurance-market-review-jun091.jpg)