Embed Size (px)
Citation preview

1
Fisher & Paykel Healthcare Goldman Sachs Australasian Investment Forum
London - September 2013
For
per
sona
l use
onl
y

2
Investment Highlights
• A leader in respiratory and OSA treatment devices
• Consistent growth strategy
• Estimated US$5+ billion and growing market opportunity
• High level of innovation
• Global presence
• Strong financial performance
NZSX:FPH, ASX:FPH For
per
sona
l use
onl
y

3
Improve patient care and outcomes
• Increase – effectiveness of care – efficiency of care
• Reduce – intensity of care F
or p
erso
nal u
se o
nly

4
Markets and Products
Revenue by Product Group 12 months to 31 March 2013
• Respiratory & Acute Care (RAC) – Heated Humidification – Respiratory Care – Neonatal Care – Surgery
• Obstructive Sleep Apnea (OSA) – Masks – Flow Generators – Humidifiers
Consumable and accessory products
represent approx. 76% of core product revenue F
or p
erso
nal u
se o
nly
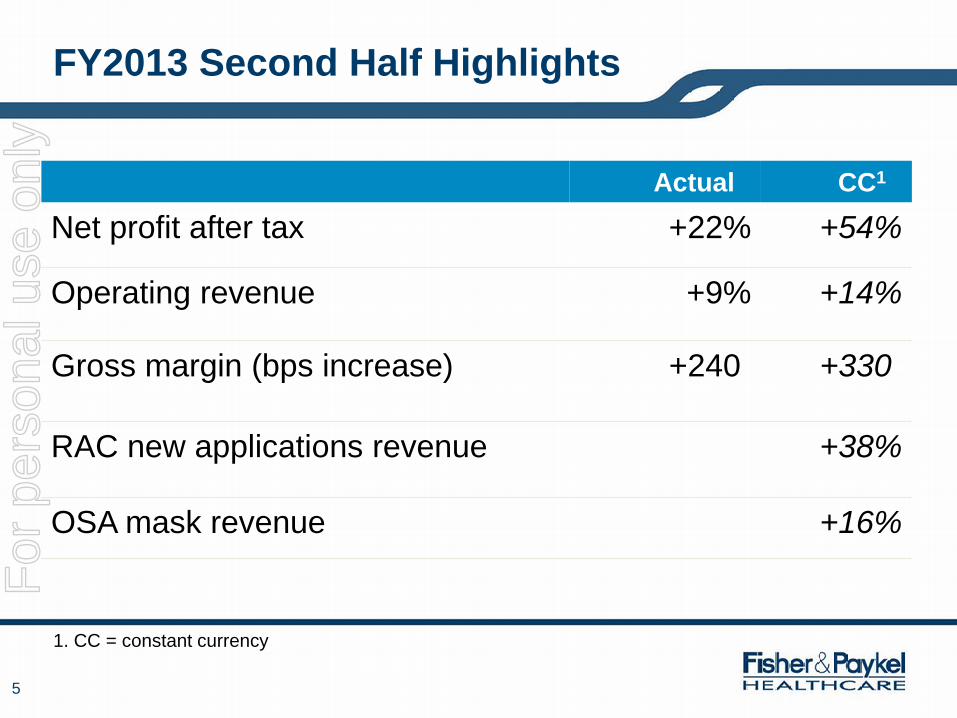
5
1. CC = constant currency
Actual CC1
Net profit after tax +22% +54%
Operating revenue +9% +14%
Gross margin (bps increase) +240- +330-
RAC new applications revenue +38%
OSA mask revenue +16%
FY2013 Second Half Highlights F
or p
erso
nal u
se o
nly

6
FY13 Operating Results NZ$
1. CC = constant currency
%Revenue NZ$M PCP CC1
Operating revenue 100% 556.3 +8% +11% Cost of sales 44.7% 248.4 +3% +5% Gross profit 55.3% 307.8 +12% +18% Other income (R&D grant) 2.4 SG&A 27.3% 151.8 +6% +9% R&D 8.2% 45.7 +9% +9% Total operating expenses 35.5% 197.5 +7% +9% Operating profit 20.3% 112.7 +21% +52% Profit after tax 13.9% 77.1 +20% +55%
FY13 (12 months to 31 March 2013)
For
per
sona
l use
onl
y

7
Dividend
• Final Dividend
– Gross 9.7 NZ cps = 7.0 cps + 2.7 cps imputation credit, NZ residents
– Fully imputed
– 1.235 cps non-resident supplementary dividend
– DRP, 3% discount NZ/AU residents
• Gross dividend yield, 17.2 cps, ~5.5%
For
per
sona
l use
onl
y

8
Outlook FY14
• Expect new products and applications to drive continuation of strong revenue growth
• May
• expected at 0.80 – 0.85 NZD:USD exchange rate:
– Operating revenue NZ$610M - NZ$630M
– Net profit after tax NZ$85M - NZ$90M
• August
• expected at 0.80 NZD:USD exchange rate:
– Operating revenue NZ$625M - NZ$645M
– Net profit after tax NZ$90M - NZ$95M
For
per
sona
l use
onl
y

9
Hospital Cost Breakdown
Source: Massachusetts Hospital Association, “An Update to Hospital Costs in Context Report” July 2010
Utilities, Depreciation
Drugs, Devices, Supplies & Food
Labour
For
per
sona
l use
onl
y

10
Lower Care Intensity = Lower Cost
Source: Anand A Dalal, Laura Christensen, 2 Fang Liu, and Aylin A Riedel. Direct costs of chronic obstructive pulmonary disease among managed care patients. Int J Chron Obstruct Pulmon Dis. 2010; 5: 241-249.
$0
$10,000
$20,000
$30,000
$40,000
$50,000
Outpatient cohort Urgent outpatientcohort
ED cohort Standard admissioncohort
ICU cohort
Mea
n co
st (2
008
US$
) F
or p
erso
nal u
se o
nly

11
Demographics Driving Increases
1. Grayson K. Vincent, Victoria A. Velkoff. The Next Four Decades. The Older Population in the United States: 2010 to 2050. US Census Bureau, 2010.
2. Cynthia L Ogden, Cheryl D Fryar et al. Mean Body Weight, Height, and Body Mass Index (BMI) 1960-2002. US Centers for Disease Control and Prevention, 2004.
4. Franck Le Deu, Rajesh Parekh, Fanging Zhang, Gaobo Zhou. Healthcare in China: Entering uncharted waters. McKinsey & Company, 2012.
3. Berhanu Alemayehu, Kenneth E Warner. The Lifetime Distribution of Health Care Costs. Health Serv Res. 2004 June; 39(3): 627–642
• Population age and weight both increasing
– US pop. 65yrs+ to grow ~80% over next 20 years1, 60% of US healthcare cost is after age 65yrs3
– US males 60 -74 yrs, av. weight increased 0.4kg/yr since 19602
• Developing markets increasing healthcare spending
– China healthcare expenditure increased 19% in 20124, expected to triple by 2020. F
or p
erso
nal u
se o
nly

12
Chronic Obstructive Pulmonary Disease (COPD)
• 6% of US adults have been diagnosed with COPD1
(~15 million people)
• 4% - 10% COPD prevalence worldwide2 (~400 million people)
• 18% of US COPD patients visit ER or admitted to hospital each year1 (~3 million patients)
1. Nicole M Kosacz, Antonello Punturieri et al. Chronic Obstructive Pulmonary Disease Among Adults -United States 2011. US Centers for Disease Control and Prevention, 2012 2. R J Halbert, Sharon Isonaka, Dorothy George, Ahmar Iqbal. Interpreting COPD Prevalence Estimates. Chest. 2003; 123:5 1684 – 1692
For
per
sona
l use
onl
y

13
Obstructive Sleep Apnea (OSA)
• 2% - 7% OSA adult prevalence1
• 70%–80% of those affected remain undiagnosed
• Prevalence increases with age and obesity
• Estimate >50 million people in developed countries
1. Naresh M. Punjabi. The Epidemiology of Adult Obstructive Sleep Apnea. Proceedings of the American Thoracic Society, Vol. 5, No. 2 (2008), pp. 136-143.
For
per
sona
l use
onl
y
14
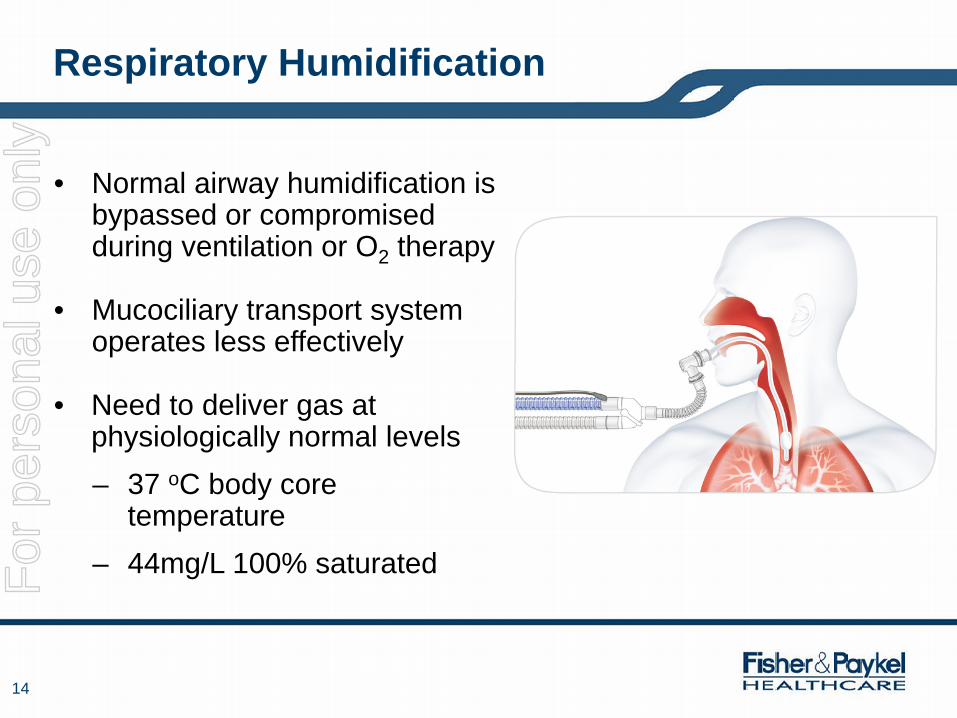
Respiratory Humidification
• Normal airway humidification is bypassed or compromised during ventilation or O2 therapy
• Mucociliary transport system operates less effectively
• Need to deliver gas at physiologically normal levels – 37 oC body core
temperature – 44mg/L 100% saturated F
or p
erso
nal u
se o
nly

15
Respiratory & Acute Care
Invasive Ventilation Non-Invasive Ventilation O2 Therapy Humidity Therapy
For
per
sona
l use
onl
y
16
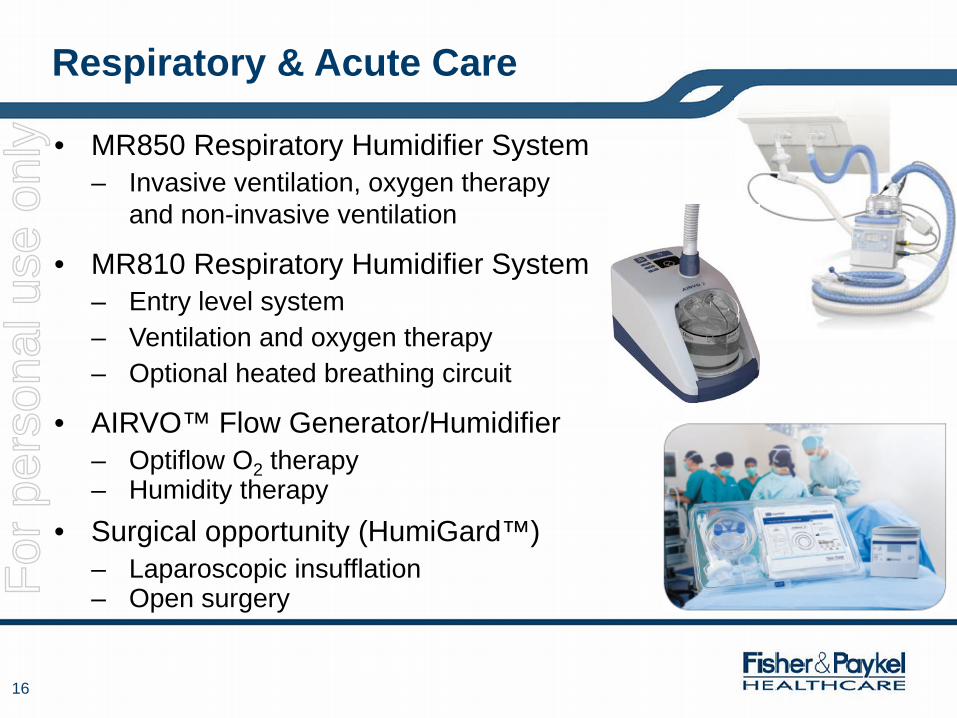
Respiratory & Acute Care
• MR850 Respiratory Humidifier System – Invasive ventilation, oxygen therapy
and non-invasive ventilation
• MR810 Respiratory Humidifier System – Entry level system – Ventilation and oxygen therapy – Optional heated breathing circuit
• AIRVO™ Flow Generator/Humidifier – Optiflow O2 therapy – Humidity therapy
• Surgical opportunity (HumiGard™) – Laparoscopic insufflation – Open surgery F
or p
erso
nal u
se o
nly

17
Single-use Respiratory Care Systems
• Single-use chambers – Patented auto filling MR290
• Single-use breathing circuits – Patented spiral heater wire – Proprietary Evaqua™ expiratory tube – Minimal condensation – Delivery of optimal humidity
• Breathing circuit components – Filters, catheter mount, weaning kit
• Interfaces – NIV masks, tracheostomy, Optiflow™,
O2 therapy • Approx 30 system set-ups used per
controller per year • Consumable growth driving revenue growth F
or p
erso
nal u
se o
nly

18
Respiratory & Acute Care Update
• Operating revenue growth – NZ$ +13% – Constant currency +18%
• New applications consumables revenue growth (NIV, Optiflow™, AIRVO™, Surgical)
– NZ$ +32% – Constant currency +38% – New applications, 38% of RAC consumables
revenue • New products roll-out
– Evaqua™ 2 breathing circuits – Optiflow Junior™ interface – Evatherm™ breathing circuit – AIRVO™ & myAIRVO 2 flow generator/humidifiers
H2 FY2013
For
per
sona
l use
onl
y

19
Obstructive Sleep Apnea
• Temporary closure of airway during sleep
• Can greatly impair quality of sleep, leading to fatigue; also associated with hypertension, stroke and heart attack
• Estimated US$2.5 billion + worldwide market, growing ~ 6-8%
• Potentially 50-60 million affected worldwide
• Most common treatment is CPAP (Continuous Positive Airway Pressure) – Key issue with CPAP is compliance – Humidification provides significant
acceptance and compliance improvements For
per
sona
l use
onl
y

20
Revolutionary New Masks
• Comfortable • Easy to fit • Efficient
• Nasal Pillows – F&P Pilairo™
• Nasal – F&P Eson™
• Full Face – F&P Simplus™ F
or p
erso
nal u
se o
nly

21
• Stylish, Smart + Simplified
• Efficiently integrates with InfoUSB™ and InfoSmart™ Web
• Responsive pressure relief - SensAwake™
• ThermoSmart™ Humidifier Breathing Tube Technology
• Auto-adjusting CPAP
+ F
or p
erso
nal u
se o
nly

22
Efficient Compliance Reporting F
or p
erso
nal u
se o
nly

23
Obstructive Sleep Apnea Update
• Operating revenue growth – NZ$ +6% – Constant currency +10%
• Mask revenue growth – Constant currency +16%
• New products roll-out – F&P Pilairo™ – F&P Eson™ – F&P Simplus™ – F&P ICON™+
H2 FY2013
For
per
sona
l use
onl
y

24
1 at 31 March 2013
Research & Development
• 8.2% of operating revenue, NZ$45.7M1
• Product pipeline includes: – Humidifier controllers – Masks – Respiratory consumables – Flow generators – Compliance monitoring solutions
• 107 US patents, 159 US pending, 442 ROW, 260 ROW pending1
For
per
sona
l use
onl
y

25
• Pilairo™ nasal pillows mask
• Eson™ nasal mask
• Simplus™ full face mask
• ICON™+ flow generator range
• Optiflow™ Junior oxygen therapy
• Evaqua™2 breathing circuits
• AIRVO™2 & myAIRVO™2 flow generator humidifiers
New Products F
or p
erso
nal u
se o
nly

26
Manufacturing & Operations
• Vertically integrated – COGs improvements; Mexico, Lean, supply chain
• Ample capacity to grow
Tijuana, Mexico – 18,000m2/200,000ft2
– Consumables capacity ramping up
Auckland, New Zealand – Two buildings: 51,000m² /
550,000ft² total – 31,000m2 building 3 completed
November 2012 – 100 acres/40ha land F
or p
erso
nal u
se o
nly

27
Global Presence
• Direct/offices – Hospitals, home care dealers – Sales/support offices in North America,
Europe, Asia, South America, Middle East and Australasia, 15 distribution centres
– >550 staff in 30 countries – Ongoing international expansion
• Distributors – 100+ distributors worldwide
• Original Equipment Manufacturers – Supply most leading ventilator
manufacturers – More than 120 countries in total
Revenue by Region 12 months to 31 March 2013
Other
For
per
sona
l use
onl
y

28
Consistent Growth Strategy
• Experts in humidification, respiratory care, and obstructive sleep apnea
• Provide innovative devices which can improve patient care and outcomes
• Continuous product improvement
• More devices for each patient
• Serve more patient groups – Invasive ventilation, NIV, oxygen therapy, COPD, surgery, OSA
• Increase international presence For
per
sona
l use
onl
y