Embed Size (px)
DESCRIPTION
ASEAN Coal Initiation - Jun 2OO8
Citation preview
June 19, 2008 ASEAN: Metals & Mining: Coal
Goldman Sachs Global Investment Research 1
June 19, 2008
ASEAN: Metals & Mining: Coal
Bullish on cycle, earnings momentum; initiate 4 cos, Banpu to CL
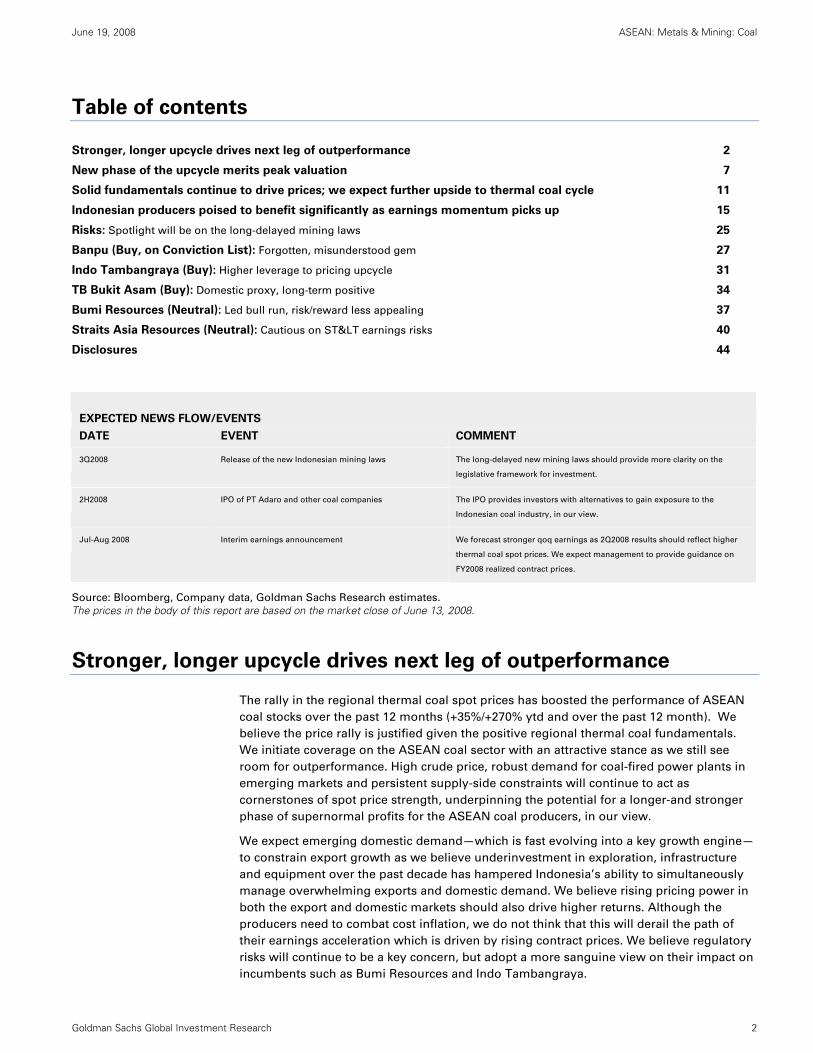
Initiate on ASEAN coal sector with an attractive stance
We believe thermal coal is at the cusp of a stronger and longer upcycle as
continued robust demand from emerging markets, unceasing supply
constraints and relative attractiveness of coal to oil underpin high prices till
2010E/2011E. We initiate coverage on the ASEAN coal sector with an attractive
stance on the back of our bullish outlook for thermal coal. As the largest
exporters of seaborne thermal coal, we believe that Indonesian coal producers
will emerge as major beneficiaries of the thermal coal price rally as they enter a
new phase of unprecedented earnings growth.
Major themes supporting our bullish view
1) We believe that incremental coal supply from Indonesia is likely to be
regimented—given underinvestment in exploration over the past few years,
infrastructure and equipment constraints, and rising domestic demand—
which would support regional prices, 2) At the same time, prices of
Indonesian coal are breaking out from their historical trends given rising
pricing power in the export market and strong demand drivers in the
domestic market, 3) We are positive on the domestic upcycle driven by
higher substitution demand for coal, 4) Strong cost inflation on rising diesel
prices will lift marginal costs of production and provide a floor to regional
prices, in our view, and 5) Valuations of ASEAN coal companies also stack
up favorably as compared with its global peers at 16%-29% discount over its
China and US peers, respectively, on a 12-month forward P/E basis.
Banpu is our top pick, we also like TB Bukit Asam
Yoke Fong Chee is assuming primary coverage of Banpu. We upgrade Banpu
to Buy from Neutral, add it to our Conviction list, and raise our 12-m SOTP-
based TP to Bt745 (from Bt258), implying 48% potential upside. Banpu has
been the sector laggard as its coal exposure has been overlooked, in our view.
We believe Banpu offers cheaper coal exposure via its Indocoal subsidiary
ITMG, which has the highest upside potential to rising coal prices. We initiate
on ITMG with Buy and 12-m TP of Rp49,500 (13X FY09E P/E), implying 46%
potential upside. We initiate on TB Bukit Asam with a Buy (12-m DCF-based TP
of Rp20,500, 40% potential upside) based on its long-term growth prospects
and exposure to the growing domestic sector, and Bumi Resources and Straits
Asia Resources both with Neutral and 12-m TPs of Rp9,700 (18X FY09E P/E)
and S$4.70 (13X FY09E P/E), respectively, on lower relative risk-reward.
Risks: Regulatory risks (new Mining Bill) and decline in coal prices.
Banpu (BANP.BK, TP: Bt745, Buy, on Conviction List)
Key Data CurrentPrice (Bt) 504
Market cap (Bt mn /US$ mn) 136,961.0 / 4,126.0
12/07 12/08E 12/09E 12/10EEPS growth (%) 57.9 79.7 49.5 (13.5)
P/E (X) 12.4 15.3 10.3 11.9
EV/EBITDA (X) 10.9 11.1 5.2 5.7
ROE (%) 17.7 24.5 30.2 22.1
TB Bukit Asam (PTBA.JK, TP: Rp20,500, Buy)
Key Data CurrentPrice (Rp) 14,650
Market cap (Rp bn /US$ mn) 33,755,531.6 / 3,625.7
12/07 12/08E 12/09E 12/10EEPS growth (%) 56 173 76 6
P/E (X) 12.7 16.3 9.2 8.8
EV/EBITDA (X) 7.4 9.9 5.4 4.9
ROE (%) 29.9 56.9 62.9 47.5
PT Indo Tambangraya (ITMG.JK, TP: Rp49,500, Buy)
Key Data CurrentPrice (Rp) 33,800
Market cap (Rp mn /US$ mn) 18,043,792.0/1,938.1
12/07 12/08E 12/09E 12/10EEPS growth (%) -- 81.8 106.2 (13.2)
P/E (X) 19.1 18.6 8.8 10.2
EV/EBITDA (X) 5.9 10.5 5.2 5.7
ROE (%) 19.3 42.5 68.7 47.4
Bumi Resources (BUMI.JK, TP: Rp9,700, Neutral)
Key Data CurrentPrice (Rp) 8,200
Market cap (Rp mn /US$ mn) 159,112,800.0 / 17,090.5
12/07 12/08E 12/09E 12/10EEPS growth (%) 66.8 152.0 38.2 (18.9)
P/E (X) 40.2 21.4 15.1 18.7
EV/EBITDA (X) 26.9 9.2 5.7 7.2
ROE (%) 42.8 57.6 52.5 30.8
Straits Asia Resources (STRL.SI, TP: S$4.70, Neutral)
Key Data CurrentPrice (S$) 3.95
Market cap (S$ mn /US$ mn) 4,309.2,/3122.8
12/07 12/08E 12/09E 12/10EEPS growth (%) (42.6) 355.8 101.8 (7.7)
P/E (X) 68.4 20.9 10.8 11.7
EV/EBITDA (X) 83.6 18.7 8.9 9.4
ROE (%) 16.2 42.5 62.8 45.3
Note: Our target prices are based on a 12-month horizon.
Source: DataStream, Goldman Sachs Research estimates.
Yoke Fong Chee +65-6889-2486 | [email protected] Goldman Sachs (Singapore) Pte
Song Shen +852-2978-1131 | [email protected] Goldman Sachs (Asia) L.L.C.
The Goldman Sachs Group, Inc. does and seeks to do business with companies covered in its research reports. As a result, investors should be aware that the firm may have a conflict of interest that could affect the objectivity of this report. Investors should consider this report as only a single factor in making their investment decision. For Reg AC certification, see the text preceding the disclosures. For other important disclosures go to www.gs.com/research/hedge.html. Analysts employed by non-US affiliates are not required to take the NASD/NYSE analyst exam.
The Goldman Sachs Group, Inc. Global Investment Research
June 19, 2008 ASEAN: Metals & Mining: Coal
Goldman Sachs Global Investment Research 2
Table of contents
Stronger, longer upcycle drives next leg of outperformance 2
New phase of the upcycle merits peak valuation 7
Solid fundamentals continue to drive prices; we expect further upside to thermal coal cycle 11
Indonesian producers poised to benefit significantly as earnings momentum picks up 15
Risks: Spotlight will be on the long-delayed mining laws 25
Banpu (Buy, on Conviction List): Forgotten, misunderstood gem 27
Indo Tambangraya (Buy): Higher leverage to pricing upcycle 31
TB Bukit Asam (Buy): Domestic proxy, long-term positive 34
Bumi Resources (Neutral): Led bull run, risk/reward less appealing 37
Straits Asia Resources (Neutral): Cautious on ST< earnings risks 40
Disclosures 44
EXPECTED NEWS FLOW/EVENTS
DATE EVENT COMMENT
3Q2008 Release of the new Indonesian mining laws The long-delayed new mining laws should provide more clarity on the
legislative framework for investment.
2H2008 IPO of PT Adaro and other coal companies The IPO provides investors with alternatives to gain exposure to the
Indonesian coal industry, in our view.
Jul-Aug 2008 Interim earnings announcement We forecast stronger qoq earnings as 2Q2008 results should reflect higher
thermal coal spot prices. We expect management to provide guidance on
FY2008 realized contract prices.
Source: Bloomberg, Company data, Goldman Sachs Research estimates.
The prices in the body of this report are based on the market close of June 13, 2008.
Stronger, longer upcycle drives next leg of outperformance
The rally in the regional thermal coal spot prices has boosted the performance of ASEAN
coal stocks over the past 12 months (+35%/+270% ytd and over the past 12 month). We
believe the price rally is justified given the positive regional thermal coal fundamentals.
We initiate coverage on the ASEAN coal sector with an attractive stance as we still see
room for outperformance. High crude price, robust demand for coal-fired power plants in
emerging markets and persistent supply-side constraints will continue to act as
cornerstones of spot price strength, underpinning the potential for a longer-and stronger
phase of supernormal profits for the ASEAN coal producers, in our view.
We expect emerging domestic demand—which is fast evolving into a key growth engine—
to constrain export growth as we believe underinvestment in exploration, infrastructure
and equipment over the past decade has hampered Indonesia’s ability to simultaneously
manage overwhelming exports and domestic demand. We believe rising pricing power in
both the export and domestic markets should also drive higher returns. Although the
producers need to combat cost inflation, we do not think that this will derail the path of
their earnings acceleration which is driven by rising contract prices. We believe regulatory
risks will continue to be a key concern, but adopt a more sanguine view on their impact on
incumbents such as Bumi Resources and Indo Tambangraya.
June 19, 2008 ASEAN: Metals & Mining: Coal
Goldman Sachs Global Investment Research 3
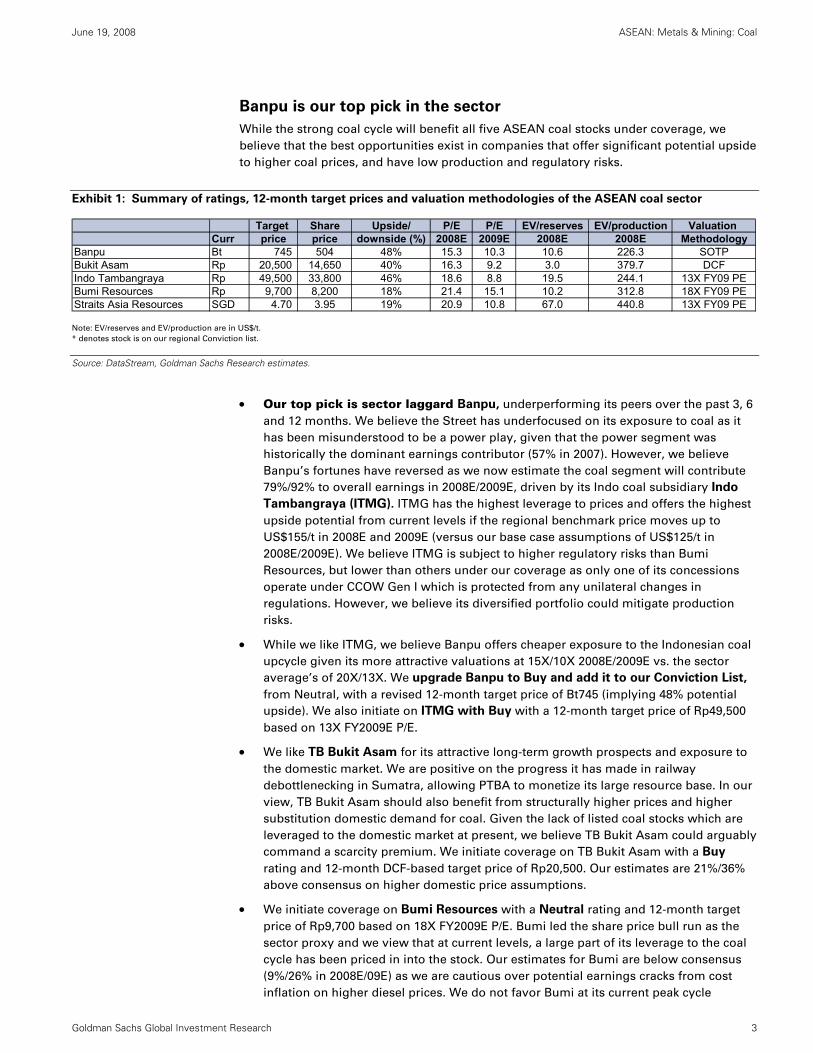
Banpu is our top pick in the sector
While the strong coal cycle will benefit all five ASEAN coal stocks under coverage, we
believe that the best opportunities exist in companies that offer significant potential upside
to higher coal prices, and have low production and regulatory risks.
Exhibit 1: Summary of ratings, 12-month target prices and valuation methodologies of the ASEAN coal sector
Target Share Upside/ P/E P/E EV/reserves EV/production Valuation Curr price price downside (%) 2008E 2009E 2008E 2008E Methodology
Banpu Bt 745 504 48% 15.3 10.3 10.6 226.3 SOTPBukit Asam Rp 20,500 14,650 40% 16.3 9.2 3.0 379.7 DCFIndo Tambangraya Rp 49,500 33,800 46% 18.6 8.8 19.5 244.1 13X FY09 PEBumi Resources Rp 9,700 8,200 18% 21.4 15.1 10.2 312.8 18X FY09 PEStraits Asia Resources SGD 4.70 3.95 19% 20.9 10.8 67.0 440.8 13X FY09 PE
Note: EV/reserves and EV/production are in US$/t.
* denotes stock is on our regional Conviction list.
Source: DataStream, Goldman Sachs Research estimates.
• Our top pick is sector laggard Banpu, underperforming its peers over the past 3, 6
and 12 months. We believe the Street has underfocused on its exposure to coal as it
has been misunderstood to be a power play, given that the power segment was
historically the dominant earnings contributor (57% in 2007). However, we believe
Banpu’s fortunes have reversed as we now estimate the coal segment will contribute
79%/92% to overall earnings in 2008E/2009E, driven by its Indo coal subsidiary Indo
Tambangraya (ITMG). ITMG has the highest leverage to prices and offers the highest
upside potential from current levels if the regional benchmark price moves up to
US$155/t in 2008E and 2009E (versus our base case assumptions of US$125/t in
2008E/2009E). We believe ITMG is subject to higher regulatory risks than Bumi
Resources, but lower than others under our coverage as only one of its concessions
operate under CCOW Gen I which is protected from any unilateral changes in
regulations. However, we believe its diversified portfolio could mitigate production
risks.
• While we like ITMG, we believe Banpu offers cheaper exposure to the Indonesian coal
upcycle given its more attractive valuations at 15X/10X 2008E/2009E vs. the sector
average’s of 20X/13X. We upgrade Banpu to Buy and add it to our Conviction List,
from Neutral, with a revised 12-month target price of Bt745 (implying 48% potential
upside). We also initiate on ITMG with Buy with a 12-month target price of Rp49,500
based on 13X FY2009E P/E.
• We like TB Bukit Asam for its attractive long-term growth prospects and exposure to
the domestic market. We are positive on the progress it has made in railway
debottlenecking in Sumatra, allowing PTBA to monetize its large resource base. In our
view, TB Bukit Asam should also benefit from structurally higher prices and higher
substitution domestic demand for coal. Given the lack of listed coal stocks which are
leveraged to the domestic market at present, we believe TB Bukit Asam could arguably
command a scarcity premium. We initiate coverage on TB Bukit Asam with a Buy
rating and 12-month DCF-based target price of Rp20,500. Our estimates are 21%/36%
above consensus on higher domestic price assumptions.
• We initiate coverage on Bumi Resources with a Neutral rating and 12-month target
price of Rp9,700 based on 18X FY2009E P/E. Bumi led the share price bull run as the
sector proxy and we view that at current levels, a large part of its leverage to the coal
cycle has been priced in into the stock. Our estimates for Bumi are below consensus
(9%/26% in 2008E/09E) as we are cautious over potential earnings cracks from cost
inflation on higher diesel prices. We do not favor Bumi at its current peak cycle
June 19, 2008 ASEAN: Metals & Mining: Coal
Goldman Sachs Global Investment Research 4
valuation given better opportunities elsewhere. Nonetheless, we believe there will be
trading interest in Bumi as a traditional beneficiary leveraged to the Indonesian
thermal coal sector if spot prices continue to climb.
• We initiate on Straits Asia Resources (SAR) with a Neutral rating and 12-month
target price of S$4.70 based on 13X FY2009E P/E. Although SAR has the strongest
volume growth potential among ASEAN coal stocks under our coverage (due mainly
to maiden contribution of Jembayan in 2008E), we are cautious over its short reserve
life and production risks related to the pending regulatory approvals on the extension
of boundary line at the Northern Sebuku concession. Based on our estimates, we
believe that SAR’s 2008 results are likely to disappoint on the back of relatively weaker
realized prices (on an energy-adjusted basis) than its peers. SAR’s large forward coal
sales position (88% of contracts were priced by 1Q2008) may make it vulnerable to
cost inflation, in our view. We are also not convinced that an M&A premium is justified
at this stage, relative to its peers given its higher EV/ton (reserves) of US$67/t versus
recent transacted acquisitions of a maximum EV/ton (reserves) of US$3/t. We note that
SAR also has the weakest balance sheet among the ASEAN coal stocks under our
coverage.
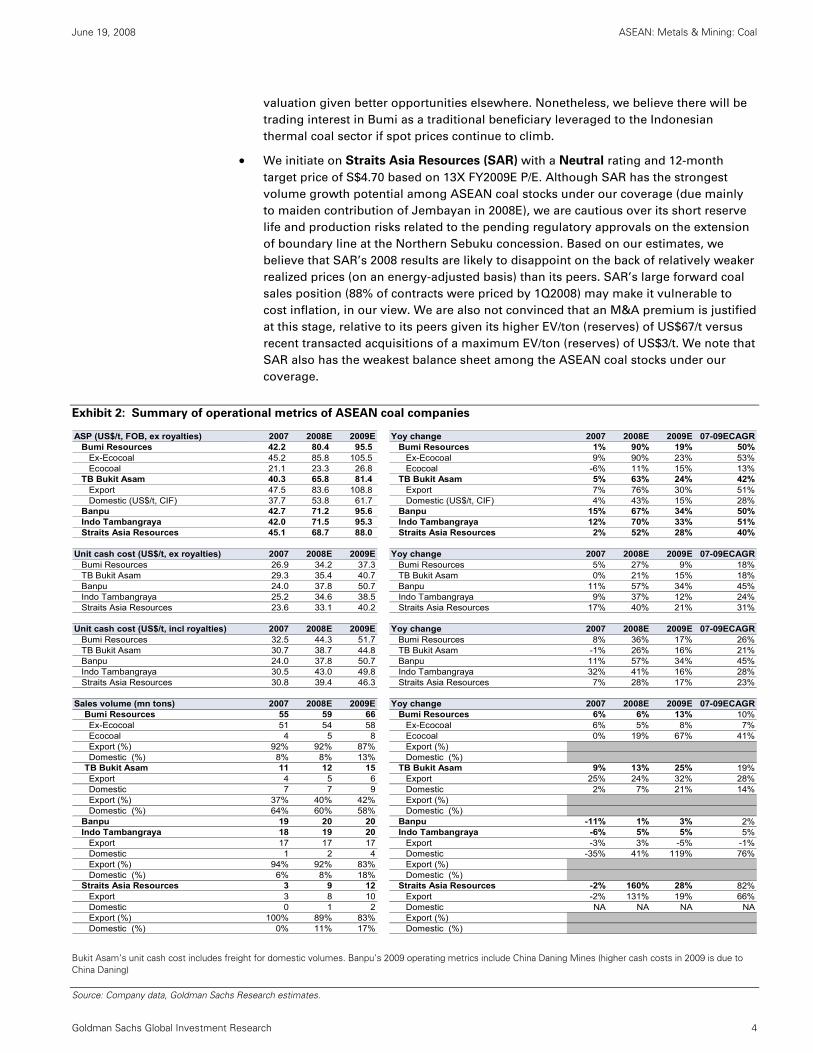
Exhibit 2: Summary of operational metrics of ASEAN coal companies
ASP (US$/t, FOB, ex royalties) 2007 2008E 2009E Yoy change 2007 2008E 2009E 07-09ECAGRBumi Resources 42.2 80.4 95.5 Bumi Resources 1% 90% 19% 50%
Ex-Ecocoal 45.2 85.8 105.5 Ex-Ecocoal 9% 90% 23% 53%Ecocoal 21.1 23.3 26.8 Ecocoal -6% 11% 15% 13%
TB Bukit Asam 40.3 65.8 81.4 TB Bukit Asam 5% 63% 24% 42%Export 47.5 83.6 108.8 Export 7% 76% 30% 51%Domestic (US$/t, CIF) 37.7 53.8 61.7 Domestic (US$/t, CIF) 4% 43% 15% 28%
Banpu 42.7 71.2 95.6 Banpu 15% 67% 34% 50%Indo Tambangraya 42.0 71.5 95.3 Indo Tambangraya 12% 70% 33% 51%Straits Asia Resources 45.1 68.7 88.0 Straits Asia Resources 2% 52% 28% 40%
26.2 34.3 39.2 0.2 Unit cash cost (US$/t, ex royalties) 2007 2008E 2009E Yoy change 2007 2008E 2009E 07-09ECAGR
Bumi Resources 26.9 34.2 37.3 Bumi Resources 5% 27% 9% 18%TB Bukit Asam 29.3 35.4 40.7 TB Bukit Asam 0% 21% 15% 18%Banpu 24.0 37.8 50.7 Banpu 11% 57% 34% 45%Indo Tambangraya 25.2 34.6 38.5 Indo Tambangraya 9% 37% 12% 24%Straits Asia Resources 23.6 33.1 40.2 Straits Asia Resources 17% 40% 21% 31%
Unit cash cost (US$/t, incl royalties) 2007 2008E 2009E Yoy change 2007 2008E 2009E 07-09ECAGRBumi Resources 32.5 44.3 51.7 Bumi Resources 8% 36% 17% 26%TB Bukit Asam 30.7 38.7 44.8 TB Bukit Asam -1% 26% 16% 21%Banpu 24.0 37.8 50.7 Banpu 11% 57% 34% 45%Indo Tambangraya 30.5 43.0 49.8 Indo Tambangraya 32% 41% 16% 28%Straits Asia Resources 30.8 39.4 46.3 Straits Asia Resources 7% 28% 17% 23%
Sales volume (mn tons) 2007 2008E 2009E Yoy change 2007 2008E 2009E 07-09ECAGRBumi Resources 55 59 66 Bumi Resources 6% 6% 13% 10%Ex-Ecocoal 51 54 58 Ex-Ecocoal 6% 5% 8% 7%Ecocoal 4 5 8 Ecocoal 0% 19% 67% 41%Export (%) 92% 92% 87% Export (%)Domestic (%) 8% 8% 13% Domestic (%)
TB Bukit Asam 11 12 15 TB Bukit Asam 9% 13% 25% 19%Export 4 5 6 Export 25% 24% 32% 28%Domestic 7 7 9 Domestic 2% 7% 21% 14%Export (%) 37% 40% 42% Export (%)Domestic (%) 64% 60% 58% Domestic (%)
Banpu 19 20 20 Banpu -11% 1% 3% 2%Indo Tambangraya 18 19 20 Indo Tambangraya -6% 5% 5% 5%
Export 17 17 17 Export -3% 3% -5% -1%Domestic 1 2 4 Domestic -35% 41% 119% 76%Export (%) 94% 92% 83% Export (%)Domestic (%) 6% 8% 18% Domestic (%)
Straits Asia Resources 3 9 12 Straits Asia Resources -2% 160% 28% 82%Export 3 8 10 Export -2% 131% 19% 66%Domestic 0 1 2 Domestic NA NA NA NAExport (%) 100% 89% 83% Export (%)Domestic (%) 0% 11% 17% Domestic (%)
Bukit Asam’s unit cash cost includes freight for domestic volumes. Banpu’s 2009 operating metrics include China Daning Mines (higher cash costs in 2009 is due to China Daning)
Source: Company data, Goldman Sachs Research estimates.
June 19, 2008 ASEAN: Metals & Mining: Coal
Goldman Sachs Global Investment Research 5
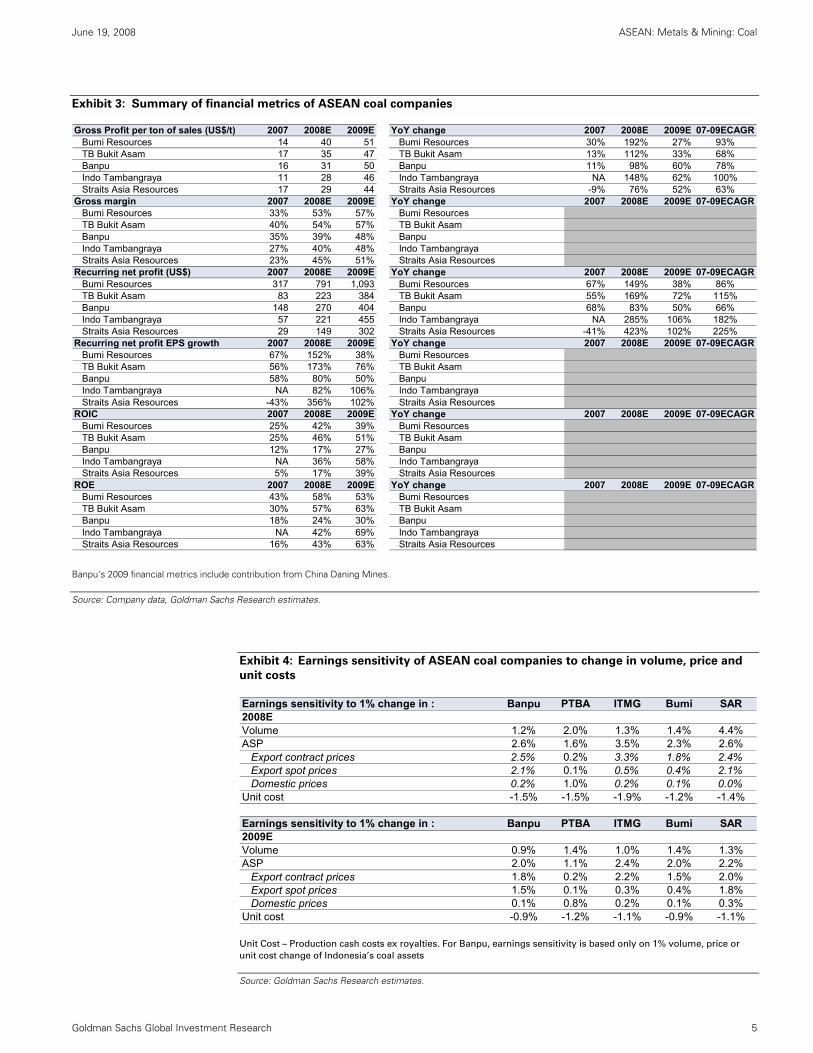
Exhibit 3: Summary of financial metrics of ASEAN coal companies
Gross Profit per ton of sales (US$/t) 2007 2008E 2009E YoY change 2007 2008E 2009E 07-09ECAGRBumi Resources 14 40 51 Bumi Resources 30% 192% 27% 93%TB Bukit Asam 17 35 47 TB Bukit Asam 13% 112% 33% 68%Banpu 16 31 50 Banpu 11% 98% 60% 78%Indo Tambangraya 11 28 46 Indo Tambangraya NA 148% 62% 100%Straits Asia Resources 17 29 44 Straits Asia Resources -9% 76% 52% 63%
Gross margin 2007 2008E 2009E YoY change 2007 2008E 2009E 07-09ECAGRBumi Resources 33% 53% 57% Bumi ResourcesTB Bukit Asam 40% 54% 57% TB Bukit AsamBanpu 35% 39% 48% BanpuIndo Tambangraya 27% 40% 48% Indo TambangrayaStraits Asia Resources 23% 45% 51% Straits Asia Resources
Recurring net profit (US$) 2007 2008E 2009E YoY change 2007 2008E 2009E 07-09ECAGRBumi Resources 317 791 1,093 Bumi Resources 67% 149% 38% 86%TB Bukit Asam 83 223 384 TB Bukit Asam 55% 169% 72% 115%Banpu 148 270 404 Banpu 68% 83% 50% 66%Indo Tambangraya 57 221 455 Indo Tambangraya NA 285% 106% 182%Straits Asia Resources 29 149 302 Straits Asia Resources -41% 423% 102% 225%
Recurring net profit EPS growth 2007 2008E 2009E YoY change 2007 2008E 2009E 07-09ECAGRBumi Resources 67% 152% 38% Bumi ResourcesTB Bukit Asam 56% 173% 76% TB Bukit AsamBanpu 58% 80% 50% BanpuIndo Tambangraya NA 82% 106% Indo TambangrayaStraits Asia Resources -43% 356% 102% Straits Asia Resources
ROIC 2007 2008E 2009E YoY change 2007 2008E 2009E 07-09ECAGRBumi Resources 25% 42% 39% Bumi ResourcesTB Bukit Asam 25% 46% 51% TB Bukit AsamBanpu 12% 17% 27% BanpuIndo Tambangraya NA 36% 58% Indo TambangrayaStraits Asia Resources 5% 17% 39% Straits Asia Resources
ROE 2007 2008E 2009E YoY change 2007 2008E 2009E 07-09ECAGRBumi Resources 43% 58% 53% Bumi ResourcesTB Bukit Asam 30% 57% 63% TB Bukit AsamBanpu 18% 24% 30% BanpuIndo Tambangraya NA 42% 69% Indo TambangrayaStraits Asia Resources 16% 43% 63% Straits Asia Resources
Banpu’s 2009 financial metrics include contribution from China Daning Mines.
Source: Company data, Goldman Sachs Research estimates.
Exhibit 4: Earnings sensitivity of ASEAN coal companies to change in volume, price and
unit costs
Earnings sensitivity to 1% change in : Banpu PTBA ITMG Bumi SAR2008EVolume 1.2% 2.0% 1.3% 1.4% 4.4%ASP 2.6% 1.6% 3.5% 2.3% 2.6%
Export contract prices 2.5% 0.2% 3.3% 1.8% 2.4%Export spot prices 2.1% 0.1% 0.5% 0.4% 2.1%Domestic prices 0.2% 1.0% 0.2% 0.1% 0.0%
Unit cost -1.5% -1.5% -1.9% -1.2% -1.4%
Earnings sensitivity to 1% change in : Banpu PTBA ITMG Bumi SAR2009EVolume 0.9% 1.4% 1.0% 1.4% 1.3%ASP 2.0% 1.1% 2.4% 2.0% 2.2%
Export contract prices 1.8% 0.2% 2.2% 1.5% 2.0%Export spot prices 1.5% 0.1% 0.3% 0.4% 1.8%Domestic prices 0.1% 0.8% 0.2% 0.1% 0.3%
Unit cost -0.9% -1.2% -1.1% -0.9% -1.1%
Unit Cost – Production cash costs ex royalties. For Banpu, earnings sensitivity is based only on 1% volume, price or
unit cost change of Indonesia’s coal assets
Source: Goldman Sachs Research estimates.

June 19, 2008 A
SEAN
: Metals &
Mining: C
oal
Goldm
an Sachs Global Investm
ent Research
6
Exhibit 5: ITMG has the highest potential share price upside if benchmark thermal coal price reaches US$155/t in 2008/2009; Banpu offers the cheaper
option to gain exposure to ITMG
2008E-2009E EPS, P/E and target price sensitivity to changes in thermal coal price assumptions
2009 2009 2009 2009
115 125 135 145 155 115 125 135 145 155 115 125 135 145 155 115 125 135 145 155 115 125 135 145 155
115 17.7 17.7 17.7 17.7 17.7 115 16.8 16.8 16.8 16.8 16.8 115 22.7 22.7 22.7 22.7 22.7 115 23.8 23.8 23.8 23.8 23.8 115 21.0 21.0 21.0 21.0 21.0
125 15.3 15.3 15.3 15.3 15.3 125 16.2 16.2 16.2 16.2 16.2 125 18.6 18.6 18.6 18.6 18.6 125 21.5 21.5 21.5 21.5 21.5 125 20.9 23.9 23.9 23.9 23.9
135 13.5 13.5 13.5 13.5 13.5 135 15.7 15.7 15.7 15.7 15.7 135 15.8 15.8 15.8 15.8 15.8 135 19.1 19.1 19.1 19.1 19.1 135 20.7 20.7 20.7 20.7 20.7
145 12.1 12.1 12.1 12.1 12.1 145 15.2 15.2 15.2 15.2 15.2 145 13.7 13.7 13.7 13.7 13.7 145 17.6 17.6 17.6 17.6 17.6 145 20.7 20.7 20.7 20.7 20.7
155 10.9 10.9 10.9 10.9 10.9 155 14.8 14.8 14.8 14.8 14.8 155 12.1 12.1 12.1 12.1 12.1 155 16.0 16.0 16.0 16.0 16.0 155 20.6 20.6 20.6 20.6 20.6
2009 2009 2009 2009
115 125 135 145 155 115 125 135 145 155 115 125 135 145 155 115 125 135 145 155 115 125 135 145 155
115 12.1 11.2 10.4 9.7 9.1 115 10.2 10.1 8.5 7.9 7.3 115 10.8 9.9 8.9 8.3 7.6 115 18.0 15.7 14.2 12.7 11.5 115 13.0 11.5 10.3 9.4 8.5
125 11.0 10.3 9.6 9.0 8.5 125 10.1 9.2 8.5 7.9 7.3 125 9.7 8.8 8.1 7.6 7.0 125 17.3 15.1 13.5 12.3 11.2 125 12.2 10.8 9.7 8.9 8.1
135 10.2 9.5 8.9 8.4 7.9 135 10.1 9.2 8.5 7.9 7.3 135 8.7 8.1 7.4 7.0 6.5 135 16.3 14.4 13.1 11.8 10.8 135 11.5 9.7 9.3 8.5 7.8
145 9.4 8.8 8.3 7.9 7.5 145 10.0 9.2 8.5 7.8 7.3 145 8.0 7.4 6.8 6.5 6.0 145 15.7 13.9 12.5 11.5 10.5 145 10.9 8.9 8.9 8.2 7.5
155 8.8 8.5 7.9 7.5 7.1 155 9.9 9.1 8.4 7.8 7.3 155 7.3 7.0 6.5 6.0 5.7 155 14.9 13.5 12.2 11.1 10.3 155 10.4 8.1 8.5 7.9 7.3
2009 2009 2009 2009
115 125 135 145 155 115 125 135 145 155 115 125 135 145 155 115 125 135 145 155 115 125 135 145 155
115 647 687 739 779 832 115 18602 18653 22240 24059 25877 115 40755 44460 49400 53105 58045 115 8208 9405 10431 11628 12825 115 3.95 4.46 4.98 5.49 6.01
125 697 745 792 832 885 125 18653 20500 22227 24020 25800 125 45448 49500 54340 58045 62985 125 8550 9700 10944 11970 13167 125 4.22 4.70 5.27 5.80 6.33
135 750 792 845 885 937 135 18757 20511 22265 24033 25787 135 50351 54340 59280 62985 67925 135 9063 10260 11286 12483 13680 135 4.46 5.27 5.53 6.04 6.57
145 802 845 898 937 990 145 18886 20627 22356 24084 25813 145 55254 59280 64220 67925 72865 145 9405 10602 11799 12825 14022 145 4.72 5.80 5.77 6.30 6.81
155 854 885 937 990 1038 155 19053 20756 22472 24175 25890 155 60169 62985 67925 72865 77397 155 9918 10944 12141 13338 14364 155 4.96 6.33 6.01 6.54 7.00
2009 2009 2009 2009 2009
115 125 135 145 155 115 125 135 145 155 115 125 135 145 155 115 125 135 145 155 115 125 135 145 155
115 28% 36% 47% 55% 65% 115 27% 27% 52% 64% 77% 115 21% 32% 46% 57% 72% 115 0% 15% 27% 42% 56% 115 0% 13% 26% 39% 52%
125 38% 48% 57% 65% 76% 125 27% 40% 52% 64% 76% 125 34% 46% 61% 72% 86% 125 4% 18% 33% 46% 61% 125 7% 19% 33% 47% 60%
135 49% 57% 68% 76% 86% 135 28% 40% 52% 64% 76% 135 49% 61% 75% 86% 101% 135 11% 25% 38% 52% 67% 135 13% 33% 40% 53% 66%
145 59% 68% 78% 86% 96% 145 29% 41% 53% 64% 76% 145 63% 75% 90% 101% 116% 145 15% 29% 44% 56% 71% 145 19% 47% 46% 59% 72%
155 70% 76% 86% 96% 106% 155 30% 42% 53% 65% 77% 155 78% 86% 101% 116% 129% 155 21% 33% 48% 63% 75% 155 26% 60% 52% 66% 77%
Valuation sensitvity to benchmark contract
price
2008
Upside (%) from current share price
2008
Upside (%) from current share price
2008
Valuation sensitvity to benchmark contract
price
2008
Valuation sensitvity to benchmark contract
price
2008
Upside (%) from current share price
2008
Upside (%) from current share price
2008
Upside (%) from current share price
2008
2009 P/E sensitvity to benchmark contract
price
2008
Valuation sensitvity to benchmark contract
price
2008
Straits Asia Resources
2008
2008 P/E sensitvity to benchmark contract
price (US$/t)
2008
2009 2008 P/E sensitvity to benchmark contract
price (US$/t)
Bumi Resources
2009 P/E sensitvity to benchmark contract
price
2008
2008
2008 P/E sensitvity to benchmark contract
price (US$/t)
2008
2009 P/E sensitvity to benchmark contract
price
2008
Banpu
Valuation sensitvity to benchmark contract
price
2008 P/E sensitvity to benchmark contract
price (US$/t)
2008
TB Bukit Asam
2008 P/E sensitvity to contract price (US$/t)
2008
Indo Tambangraya
2009
2009
2009 P/E sensitvity to benchmark contract
price
2008
2008
2009 P/E sensitvity to benchmark contract
price
Source: DataStream, Goldman Sachs Research estimates.
June 19, 2008 ASEAN: Metals & Mining: Coal
Goldman Sachs Global Investment Research 7
New phase of the upcycle merits peak valuation
While ASEAN coal equities have outperformed the broader market, we believe that
the upcycle could last longer and be stronger than expected, underpinning another
leg of out-performance. GSJBW Commodities Research team has recently raised
long-term price assumptions for thermal coal, which we view as positive for ASEAN
coal stocks that trade in tight correlation with regional spot pricing. We believe that
the positive coal fundamentals and improved pricing in the export and domestic
markets have placed ASEAN coal companies at the cusp of an earnings acceleration
cycle. Given good earnings visibility, we have used the P/E methodology as the
primary valuation metric for pure coal companies (i.e. excluding Banpu), except for PT
Bukit Asam where we use DCF methodology to capture its strong long-term growth
prospects. We value ASEAN coal equities using peak-cycle earnings multiples in
2009E, which is when we expect the Indonesian coal cycle to peak.
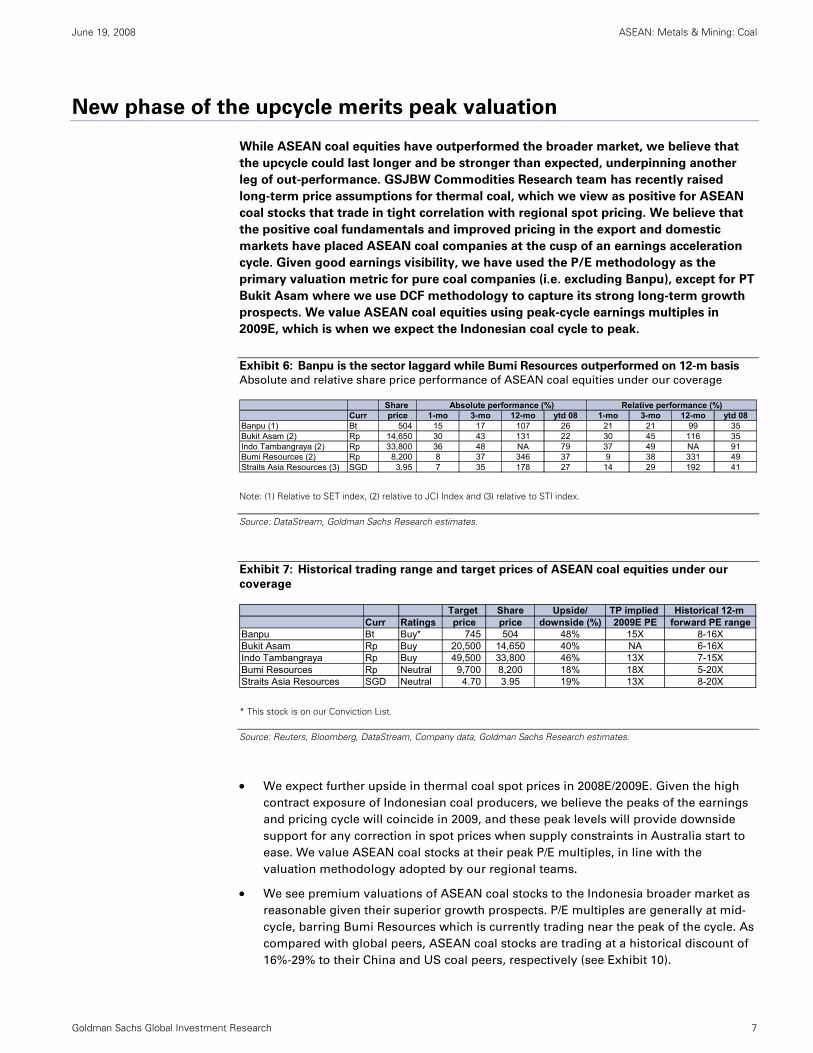
Exhibit 6: Banpu is the sector laggard while Bumi Resources outperformed on 12-m basis
Absolute and relative share price performance of ASEAN coal equities under our coverage
Share Curr price 1-mo 3-mo 12-mo ytd 08 1-mo 3-mo 12-mo ytd 08
Banpu (1) Bt 504 15 17 107 26 21 21 99 35Bukit Asam (2) Rp 14,650 30 43 131 22 30 45 116 35Indo Tambangraya (2) Rp 33,800 36 48 NA 79 37 49 NA 91Bumi Resources (2) Rp 8,200 8 37 346 37 9 38 331 49Straits Asia Resources (3) SGD 3.95 7 35 178 27 14 29 192 41
Absolute performance (%) Relative performance (%)
Note: (1) Relative to SET index, (2) relative to JCI Index and (3) relative to STI index.
Source: DataStream, Goldman Sachs Research estimates.
Exhibit 7: Historical trading range and target prices of ASEAN coal equities under our
coverage
Target Share Upside/ TP implied Historical 12-m Curr Ratings price price downside (%) 2009E PE forward PE range
Banpu Bt Buy* 745 504 48% 15X 8-16XBukit Asam Rp Buy 20,500 14,650 40% NA 6-16XIndo Tambangraya Rp Buy 49,500 33,800 46% 13X 7-15XBumi Resources Rp Neutral 9,700 8,200 18% 18X 5-20XStraits Asia Resources SGD Neutral 4.70 3.95 19% 13X 8-20X
* This stock is on our Conviction List.
Source: Reuters, Bloomberg, DataStream, Company data, Goldman Sachs Research estimates.
• We expect further upside in thermal coal spot prices in 2008E/2009E. Given the high
contract exposure of Indonesian coal producers, we believe the peaks of the earnings
and pricing cycle will coincide in 2009, and these peak levels will provide downside
support for any correction in spot prices when supply constraints in Australia start to
ease. We value ASEAN coal stocks at their peak P/E multiples, in line with the
valuation methodology adopted by our regional teams.
• We see premium valuations of ASEAN coal stocks to the Indonesia broader market as
reasonable given their superior growth prospects. P/E multiples are generally at mid-
cycle, barring Bumi Resources which is currently trading near the peak of the cycle. As
compared with global peers, ASEAN coal stocks are trading at a historical discount of
16%-29% to their China and US coal peers, respectively (see Exhibit 10).
June 19, 2008 ASEAN: Metals & Mining: Coal
Goldman Sachs Global Investment Research 8
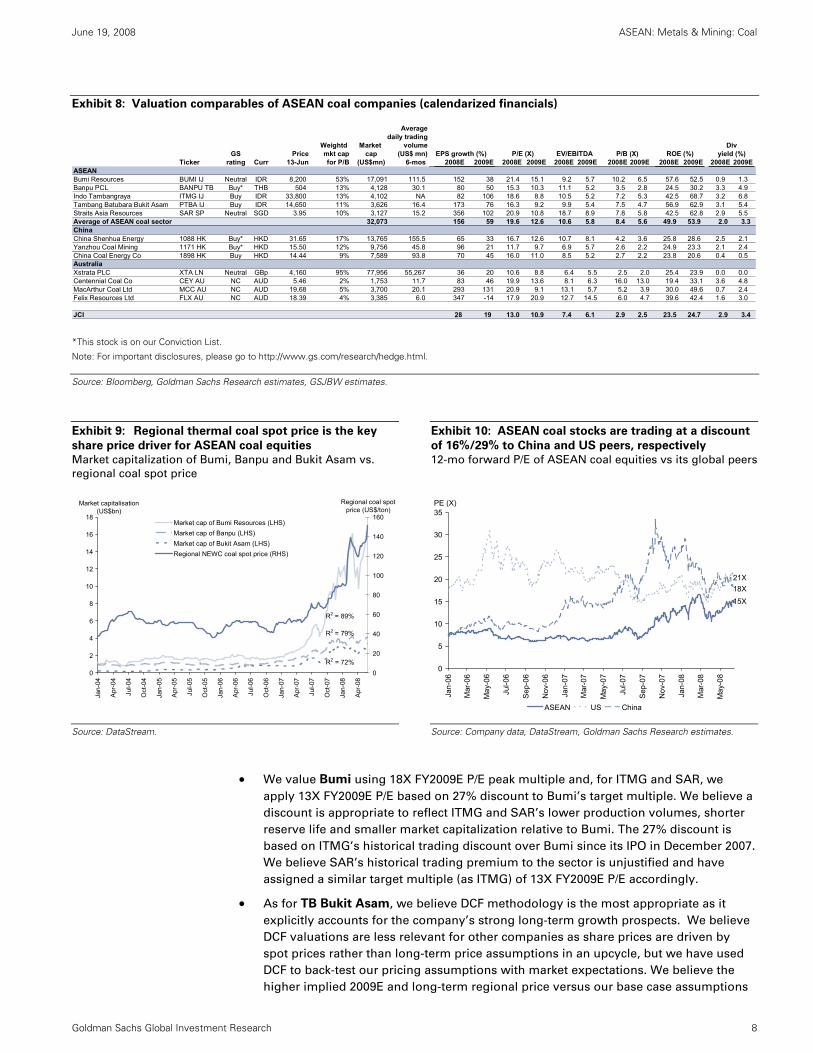
Exhibit 8: Valuation comparables of ASEAN coal companies (calendarized financials)
Averagedaily trading
Weightd Market volumeGS Price mkt cap cap (US$ mn) EPS growth (%)
Ticker rating Curr 13-Jun for P/B (US$mn) 6-mos 2008E 2009E 2008E 2009E 2008E 2009E 2008E 2009E 2008E 2009E 2008E 2009EASEANBumi Resources BUMI IJ Neutral IDR 8,200 53% 17,091 111.5 152 38 21.4 15.1 9.2 5.7 10.2 6.5 57.6 52.5 0.9 1.3Banpu PCL BANPU TB Buy* THB 504 13% 4,128 30.1 80 50 15.3 10.3 11.1 5.2 3.5 2.8 24.5 30.2 3.3 4.9Indo Tambangraya ITMG IJ Buy IDR 33,800 13% 4,102 NA 82 106 18.6 8.8 10.5 5.2 7.2 5.3 42.5 68.7 3.2 6.8Tambang Batubara Bukit Asam PTBA IJ Buy IDR 14,650 11% 3,626 16.4 173 76 16.3 9.2 9.9 5.4 7.5 4.7 56.9 62.9 3.1 5.4Straits Asia Resources SAR SP Neutral SGD 3.95 10% 3,127 15.2 356 102 20.9 10.8 18.7 8.9 7.8 5.8 42.5 62.8 2.9 5.5Average of ASEAN coal sector 32,073 156 59 19.6 12.6 10.6 5.8 8.4 5.6 49.9 53.9 2.0 3.3 ChinaChina Shenhua Energy 1088 HK Buy* HKD 31.65 17% 13,765 155.5 65 33 16.7 12.6 10.7 8.1 4.2 3.6 25.8 28.6 2.5 2.1Yanzhou Coal Mining 1171 HK Buy* HKD 15.50 12% 9,756 45.8 96 21 11.7 9.7 6.9 5.7 2.6 2.2 24.9 23.3 2.1 2.4China Coal Energy Co 1898 HK Buy HKD 14.44 9% 7,589 93.8 70 45 16.0 11.0 8.5 5.2 2.7 2.2 23.8 20.6 0.4 0.5AustraliaXstrata PLC XTA LN Neutral GBp 4,160 95% 77,956 55,267 36 20 10.6 8.8 6.4 5.5 2.5 2.0 25.4 23.9 0.0 0.0Centennial Coal Co CEY AU NC AUD 5.46 2% 1,753 11.7 83 46 19.9 13.6 8.1 6.3 16.0 13.0 19.4 33.1 3.6 4.8MacArthur Coal Ltd MCC AU NC AUD 19.68 5% 3,700 20.1 293 131 20.9 9.1 13.1 5.7 5.2 3.9 30.0 49.6 0.7 2.4Felix Resources Ltd FLX AU NC AUD 18.39 4% 3,385 6.0 347 -14 17.9 20.9 12.7 14.5 6.0 4.7 39.6 42.4 1.6 3.0
JCI 28 19 13.0 10.9 7.4 6.1 2.9 2.5 23.5 24.7 2.9 3.4
ROE (%) yield (%)Div
P/E (X) P/B (X) EV/EBITDA
*This stock is on our Conviction List.
Note: For important disclosures, please go to http://www.gs.com/research/hedge.html.
Source: Bloomberg, Goldman Sachs Research estimates, GSJBW estimates.
Exhibit 9: Regional thermal coal spot price is the key
share price driver for ASEAN coal equities
Market capitalization of Bumi, Banpu and Bukit Asam vs.
regional coal spot price
Exhibit 10: ASEAN coal stocks are trading at a discount
of 16%/29% to China and US peers, respectively
12-mo forward P/E of ASEAN coal equities vs its global peers
0
2
4
6
8
10
12
14
16
18
Jan-
04
Apr
-04
Jul-0
4
Oct
-04
Jan-
05
Apr
-05
Jul-0
5
Oct
-05
Jan-
06
Apr
-06
Jul-0
6
Oct
-06
Jan-
07
Apr
-07
Jul-0
7
Oct
-07
Jan-
08
Apr
-08
Market capitalisation (US$bn)
0
20
40
60
80
100
120
140
160
Regional coal spot price (US$/ton)
Market cap of Bumi Resources (LHS) Market cap of Banpu (LHS)Market cap of Bukit Asam (LHS)Regional NEWC coal spot price (RHS)
R2 = 89%
R2 = 79%
R2 = 72%
0
5
10
15
20
25
30
35
Jan-
06
Mar
-06
May
-06
Jul-0
6
Sep
-06
Nov
-06
Jan-
07
Mar
-07
May
-07
Jul-0
7
Sep
-07
Nov
-07
Jan-
08
Mar
-08
May
-08
PE (X)
ASEAN US China
15X
21X18X
Source: DataStream.
Source: Company data, DataStream, Goldman Sachs Research estimates.
• We value Bumi using 18X FY2009E P/E peak multiple and, for ITMG and SAR, we
apply 13X FY2009E P/E based on 27% discount to Bumi’s target multiple. We believe a
discount is appropriate to reflect ITMG and SAR’s lower production volumes, shorter
reserve life and smaller market capitalization relative to Bumi. The 27% discount is
based on ITMG’s historical trading discount over Bumi since its IPO in December 2007.
We believe SAR’s historical trading premium to the sector is unjustified and have
assigned a similar target multiple (as ITMG) of 13X FY2009E P/E accordingly.
• As for TB Bukit Asam, we believe DCF methodology is the most appropriate as it
explicitly accounts for the company’s strong long-term growth prospects. We believe
DCF valuations are less relevant for other companies as share prices are driven by
spot prices rather than long-term price assumptions in an upcycle, but we have used
DCF to back-test our pricing assumptions with market expectations. We believe the
higher implied 2009E and long-term regional price versus our base case assumptions
June 19, 2008 ASEAN: Metals & Mining: Coal
Goldman Sachs Global Investment Research 9
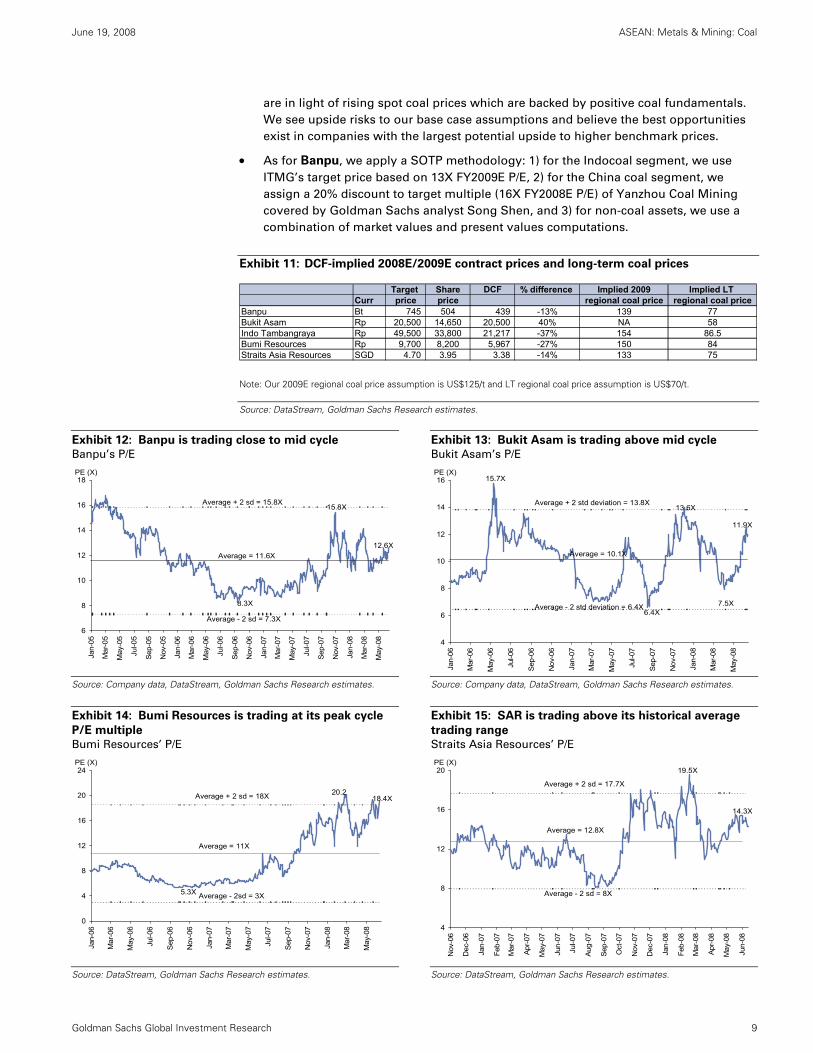
are in light of rising spot coal prices which are backed by positive coal fundamentals.
We see upside risks to our base case assumptions and believe the best opportunities
exist in companies with the largest potential upside to higher benchmark prices.
• As for Banpu, we apply a SOTP methodology: 1) for the Indocoal segment, we use
ITMG’s target price based on 13X FY2009E P/E, 2) for the China coal segment, we
assign a 20% discount to target multiple (16X FY2008E P/E) of Yanzhou Coal Mining
covered by Goldman Sachs analyst Song Shen, and 3) for non-coal assets, we use a
combination of market values and present values computations.
Exhibit 11: DCF-implied 2008E/2009E contract prices and long-term coal prices
Target Share DCF % difference Implied 2009 Implied LT Curr price price regional coal price regional coal price
Banpu Bt 745 504 439 -13% 139 77Bukit Asam Rp 20,500 14,650 20,500 40% NA 58Indo Tambangraya Rp 49,500 33,800 21,217 -37% 154 86.5Bumi Resources Rp 9,700 8,200 5,967 -27% 150 84Straits Asia Resources SGD 4.70 3.95 3.38 -14% 133 75
Note: Our 2009E regional coal price assumption is US$125/t and LT regional coal price assumption is US$70/t.
Source: DataStream, Goldman Sachs Research estimates.
Exhibit 12: Banpu is trading close to mid cycle
Banpu’s P/E
Exhibit 13: Bukit Asam is trading above mid cycle
Bukit Asam’s P/E
6
8
10
12
14
16
18
Jan-
05
Mar
-05
May
-05
Jul-0
5
Sep-
05
Nov
-05
Jan-
06
Mar
-06
May
-06
Jul-0
6
Sep-
06
Nov
-06
Jan-
07
Mar
-07
May
-07
Jul-0
7
Sep-
07
Nov
-07
Jan-
08
Mar
-08
May
-08
PE (X)
12.6X
15.8X
8.3X
Average = 11.6X
Average - 2 sd = 7.3X
Average + 2 sd = 15.8X
4
6
8
10
12
14
16
Jan-
06
Mar
-06
May
-06
Jul-0
6
Sep-
06
Nov
-06
Jan-
07
Mar
-07
May
-07
Jul-0
7
Sep-
07
Nov
-07
Jan-
08
Mar
-08
May
-08
PE (X)
11.9X
6.4X
15.7X
13.6X
7.5X
Average = 10.1X
Average + 2 std deviation = 13.8X
Average - 2 std deviation = 6.4X
Source: Company data, DataStream, Goldman Sachs Research estimates. Source: Company data, DataStream, Goldman Sachs Research estimates.
Exhibit 14: Bumi Resources is trading at its peak cycle
P/E multiple
Bumi Resources’ P/E
Exhibit 15: SAR is trading above its historical average
trading range
Straits Asia Resources’ P/E
0
4
8
12
16
20
24
Jan-
06
Mar
-06
May
-06
Jul-0
6
Sep
-06
Nov
-06
Jan-
07
Mar
-07
May
-07
Jul-0
7
Sep
-07
Nov
-07
Jan-
08
Mar
-08
May
-08
PE (X)
5.3X
20.218.4X
Average = 11X
Average + 2 sd = 18X
Average - 2sd = 3X
4
8
12
16
20
Nov
-06
Dec
-06
Jan-
07
Feb-
07
Mar
-07
Apr-0
7
May
-07
Jun-
07
Jul-0
7
Aug-
07
Sep-
07
Oct
-07
Nov
-07
Dec
-07
Jan-
08
Feb-
08
Mar
-08
Apr-0
8
May
-08
Jun-
08
PE (X)19.5X
14.3X
Average = 12.8X
Average + 2 sd = 17.7X
Average - 2 sd = 8X
Source: DataStream, Goldman Sachs Research estimates. Source: DataStream, Goldman Sachs Research estimates.
June 19, 2008 ASEAN: Metals & Mining: Coal
Goldman Sachs Global Investment Research 10
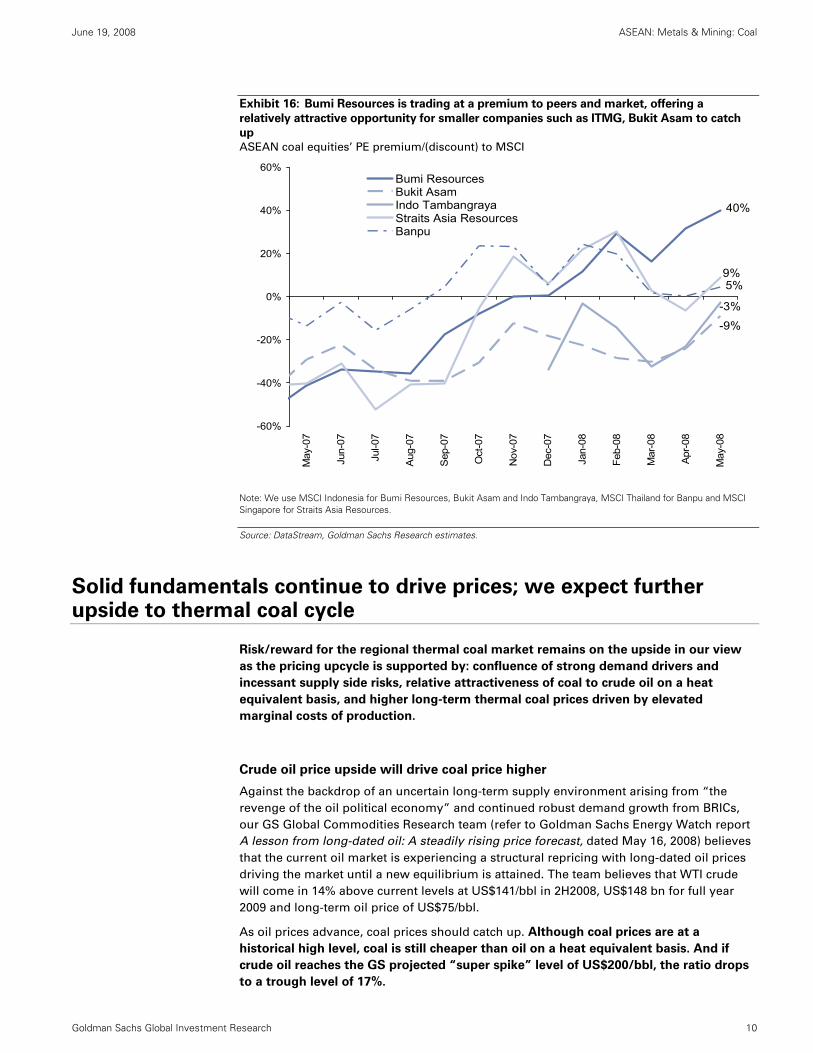
Exhibit 16: Bumi Resources is trading at a premium to peers and market, offering a
relatively attractive opportunity for smaller companies such as ITMG, Bukit Asam to catch
up
ASEAN coal equities’ PE premium/(discount) to MSCI
-60%
-40%
-20%
0%
20%
40%
60%
May
-07
Jun-
07
Jul-0
7
Aug
-07
Sep
-07
Oct
-07
Nov
-07
Dec
-07
Jan-
08
Feb-
08
Mar
-08
Apr-0
8
May
-08
Bumi ResourcesBukit AsamIndo TambangrayaStraits Asia ResourcesBanpu
5%
40%
9%
-9%
-3%
Note: We use MSCI Indonesia for Bumi Resources, Bukit Asam and Indo Tambangraya, MSCI Thailand for Banpu and MSCI Singapore for Straits Asia Resources.
Source: DataStream, Goldman Sachs Research estimates.
Solid fundamentals continue to drive prices; we expect further upside to thermal coal cycle
Risk/reward for the regional thermal coal market remains on the upside in our view
as the pricing upcycle is supported by: confluence of strong demand drivers and
incessant supply side risks, relative attractiveness of coal to crude oil on a heat
equivalent basis, and higher long-term thermal coal prices driven by elevated
marginal costs of production.
Crude oil price upside will drive coal price higher
Against the backdrop of an uncertain long-term supply environment arising from “the
revenge of the oil political economy” and continued robust demand growth from BRICs,
our GS Global Commodities Research team (refer to Goldman Sachs Energy Watch report
A lesson from long-dated oil: A steadily rising price forecast, dated May 16, 2008) believes
that the current oil market is experiencing a structural repricing with long-dated oil prices
driving the market until a new equilibrium is attained. The team believes that WTI crude
will come in 14% above current levels at US$141/bbl in 2H2008, US$148 bn for full year
2009 and long-term oil price of US$75/bbl.
As oil prices advance, coal prices should catch up. Although coal prices are at a
historical high level, coal is still cheaper than oil on a heat equivalent basis. And if
crude oil reaches the GS projected “super spike” level of US$200/bbl, the ratio drops
to a trough level of 17%.
June 19, 2008 ASEAN: Metals & Mining: Coal
Goldman Sachs Global Investment Research 11
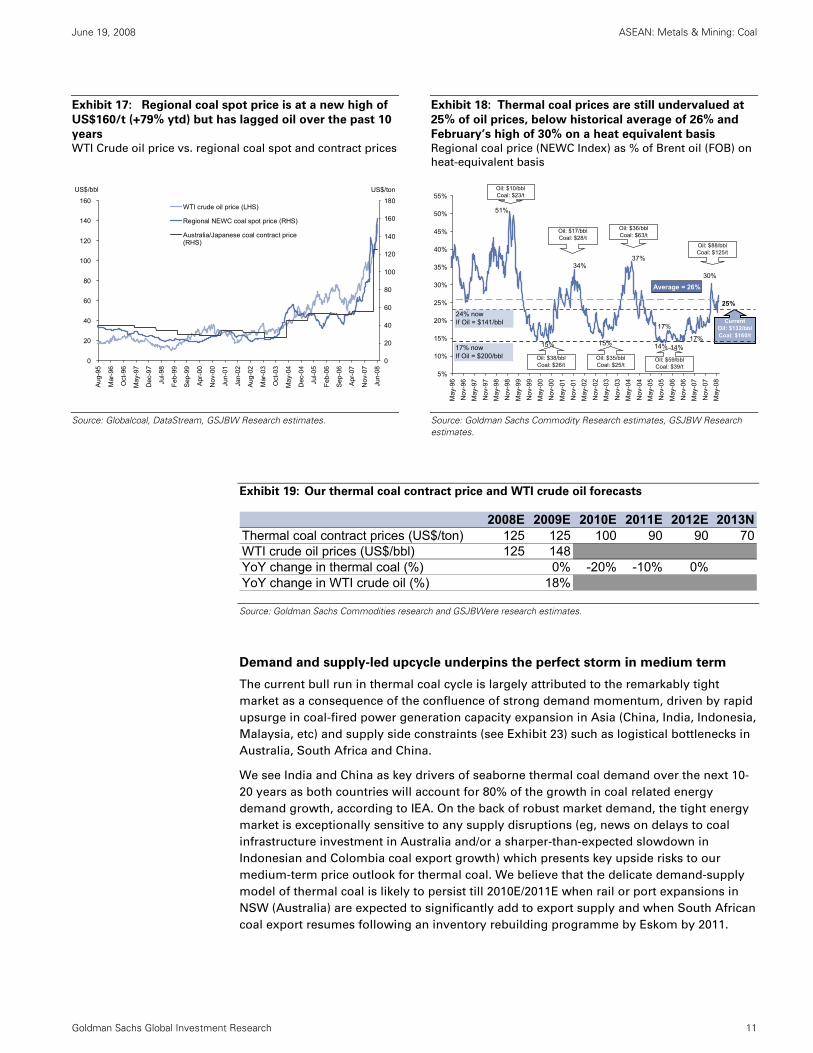
Exhibit 17: Regional coal spot price is at a new high of
US$160/t (+79% ytd) but has lagged oil over the past 10
years
WTI Crude oil price vs. regional coal spot and contract prices
Exhibit 18: Thermal coal prices are still undervalued at
25% of oil prices, below historical average of 26% and
February’s high of 30% on a heat equivalent basis
Regional coal price (NEWC Index) as % of Brent oil (FOB) on
heat-equivalent basis
0
20
40
60
80
100
120
140
160
Aug
-95
Mar
-96
Oct
-96
May
-97
Dec
-97
Jul-9
8
Feb-
99
Sep
-99
Apr
-00
Nov
-00
Jun-
01
Jan-
02
Aug
-02
Mar
-03
Oct
-03
May
-04
Dec
-04
Jul-0
5
Feb-
06
Sep
-06
Apr
-07
Nov
-07
Jun-
08
US$/bbl
0
20
40
60
80
100
120
140
160
180
US$/ton
WTI crude oil price (LHS)
Regional NEWC coal spot price (RHS)
Australia/Japanese coal contract price(RHS)
37%
15%
34%
51%
15%
17%
14% 14%17%
30%
25%
Average = 26%
5%
10%
15%
20%
25%
30%
35%
40%
45%
50%
55%
May
-96
Nov
-96
May
-97
Nov
-97
May
-98
Nov
-98
May
-99
Nov
-99
May
-00
Nov
-00
May
-01
Nov
-01
May
-02
Nov
-02
May
-03
Nov
-03
May
-04
Nov
-04
May
-05
Nov
-05
May
-06
Nov
-06
May
-07
Nov
-07
May
-08
CurrentOil: $132/bblCoal: $160/t
Oil: $36/bblCoal: $63/t
Oil: $17/bblCoal: $28/t
Oil: $35/bblCoal: $25/t
Oil: $38/bblCoal: $26/t
Oil: $88/bblCoal: $125/t
Oil: $59/bblCoal: $39/t
Oil: $10/bblCoal: $23/t
17% nowIf Oil = $200/bbl
24% nowIf Oil = $141/bbl
Source: Globalcoal, DataStream, GSJBW Research estimates.
Source: Goldman Sachs Commodity Research estimates, GSJBW Research estimates.
Exhibit 19: Our thermal coal contract price and WTI crude oil forecasts
2008E 2009E 2010E 2011E 2012E 2013NThermal coal contract prices (US$/ton) 125 125 100 90 90 70WTI crude oil prices (US$/bbl) 125 148YoY change in thermal coal (%) 0% -20% -10% 0%YoY change in WTI crude oil (%) 18%
Source: Goldman Sachs Commodities research and GSJBWere research estimates.
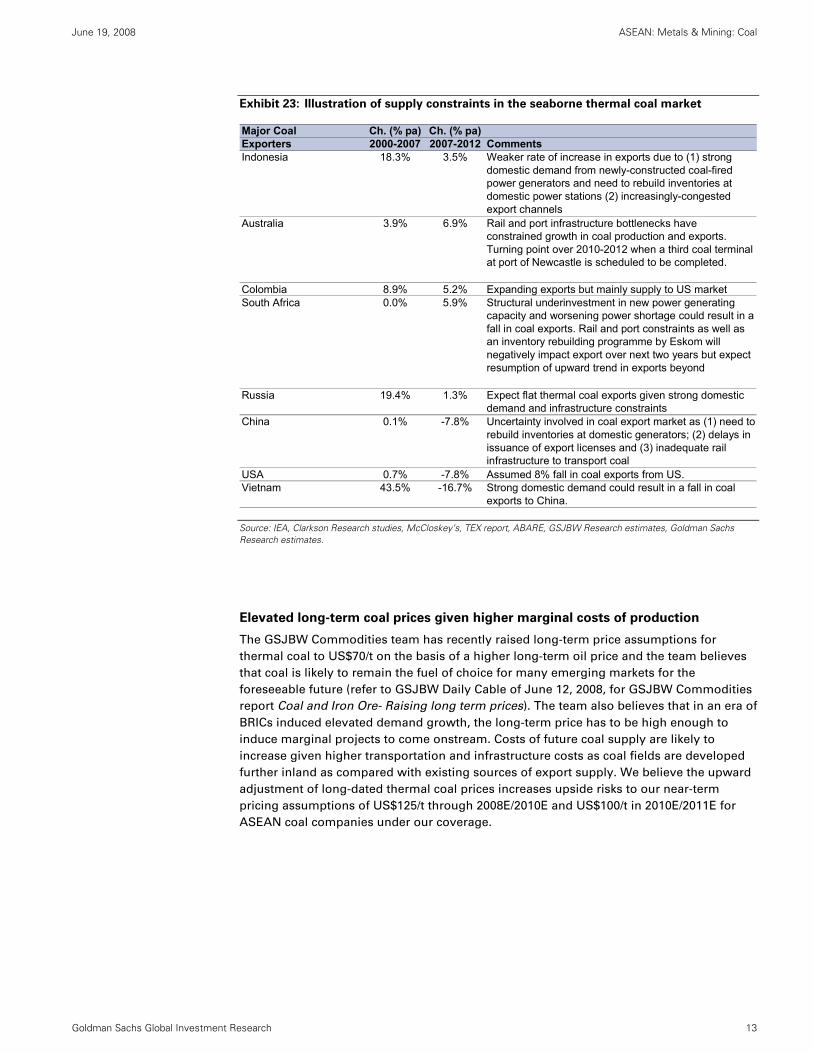
Demand and supply-led upcycle underpins the perfect storm in medium term
The current bull run in thermal coal cycle is largely attributed to the remarkably tight
market as a consequence of the confluence of strong demand momentum, driven by rapid
upsurge in coal-fired power generation capacity expansion in Asia (China, India, Indonesia,
Malaysia, etc) and supply side constraints (see Exhibit 23) such as logistical bottlenecks in
Australia, South Africa and China.
We see India and China as key drivers of seaborne thermal coal demand over the next 10-
20 years as both countries will account for 80% of the growth in coal related energy
demand growth, according to IEA. On the back of robust market demand, the tight energy
market is exceptionally sensitive to any supply disruptions (eg, news on delays to coal
infrastructure investment in Australia and/or a sharper-than-expected slowdown in
Indonesian and Colombia coal export growth) which presents key upside risks to our
medium-term price outlook for thermal coal. We believe that the delicate demand-supply
model of thermal coal is likely to persist till 2010E/2011E when rail or port expansions in
NSW (Australia) are expected to significantly add to export supply and when South African
coal export resumes following an inventory rebuilding programme by Eskom by 2011.
June 19, 2008 ASEAN: Metals & Mining: Coal
Goldman Sachs Global Investment Research 12
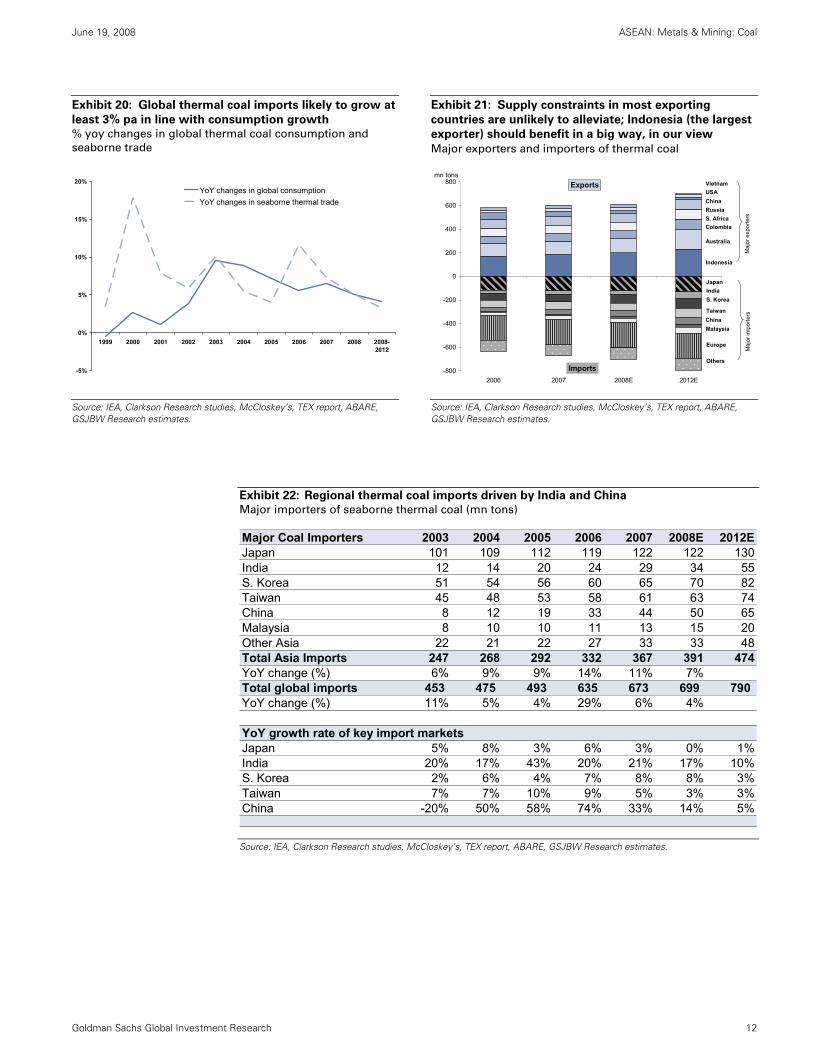
Exhibit 20: Global thermal coal imports likely to grow at
least 3% pa in line with consumption growth
% yoy changes in global thermal coal consumption and
seaborne trade
Exhibit 21: Supply constraints in most exporting
countries are unlikely to alleviate; Indonesia (the largest
exporter) should benefit in a big way, in our view
Major exporters and importers of thermal coal
-5%
0%
5%
10%
15%
20%
1999 2000 2001 2002 2003 2004 2005 2006 2007 2008 2008-2012
YoY changes in global consumptionYoY changes in seaborne thermal trade
-800
-600
-400
-200
0
200
400
600
800
2006 2007 2008E 2012E
Indonesia
Colombia
USA
Australia
S. AfricaRussiaChina
VietnamExports
Imports
Maj
or e
xpor
ters
Others
India
Europe
MalaysiaChina
S. Korea
Japan
Taiwan
Maj
or im
porte
rs
mn tons
Source: IEA, Clarkson Research studies, McCloskey’s, TEX report, ABARE, GSJBW Research estimates.
Source: IEA, Clarkson Research studies, McCloskey’s, TEX report, ABARE, GSJBW Research estimates.
Exhibit 22: Regional thermal coal imports driven by India and China
Major importers of seaborne thermal coal (mn tons)
Major Coal Importers 2003 2004 2005 2006 2007 2008E 2012EJapan 101 109 112 119 122 122 130India 12 14 20 24 29 34 55S. Korea 51 54 56 60 65 70 82Taiwan 45 48 53 58 61 63 74China 8 12 19 33 44 50 65Malaysia 8 10 10 11 13 15 20Other Asia 22 21 22 27 33 33 48Total Asia Imports 247 268 292 332 367 391 474YoY change (%) 6% 9% 9% 14% 11% 7%Total global imports 453 475 493 635 673 699 790 YoY change (%) 11% 5% 4% 29% 6% 4%
YoY growth rate of key import marketsJapan 5% 8% 3% 6% 3% 0% 1%India 20% 17% 43% 20% 21% 17% 10%S. Korea 2% 6% 4% 7% 8% 8% 3%Taiwan 7% 7% 10% 9% 5% 3% 3%China -20% 50% 58% 74% 33% 14% 5%
Source: IEA, Clarkson Research studies, McCloskey’s, TEX report, ABARE, GSJBW Research estimates.
June 19, 2008 ASEAN: Metals & Mining: Coal
Goldman Sachs Global Investment Research 13
Exhibit 23: Illustration of supply constraints in the seaborne thermal coal market
Major Coal Ch. (% pa) Ch. (% pa)Exporters 2000-2007 2007-2012 CommentsIndonesia 18.3% 3.5% Weaker rate of increase in exports due to (1) strong
domestic demand from newly-constructed coal-fired power generators and need to rebuild inventories at domestic power stations (2) increasingly-congested export channels
Australia 3.9% 6.9% Rail and port infrastructure bottlenecks have constrained growth in coal production and exports. Turning point over 2010-2012 when a third coal terminal at port of Newcastle is scheduled to be completed.
Colombia 8.9% 5.2% Expanding exports but mainly supply to US marketSouth Africa 0.0% 5.9% Structural underinvestment in new power generating
capacity and worsening power shortage could result in a fall in coal exports. Rail and port constraints as well as an inventory rebuilding programme by Eskom will negatively impact export over next two years but expect resumption of upward trend in exports beyond
Russia 19.4% 1.3% Expect flat thermal coal exports given strong domestic demand and infrastructure constraints
China 0.1% -7.8% Uncertainty involved in coal export market as (1) need to rebuild inventories at domestic generators; (2) delays in issuance of export licenses and (3) inadequate rail infrastructure to transport coal
USA 0.7% -7.8% Assumed 8% fall in coal exports from US. Vietnam 43.5% -16.7% Strong domestic demand could result in a fall in coal
exports to China.
Source: IEA, Clarkson Research studies, McCloskey’s, TEX report, ABARE, GSJBW Research estimates, Goldman Sachs Research estimates.
Elevated long-term coal prices given higher marginal costs of production
The GSJBW Commodities team has recently raised long-term price assumptions for
thermal coal to US$70/t on the basis of a higher long-term oil price and the team believes
that coal is likely to remain the fuel of choice for many emerging markets for the
foreseeable future (refer to GSJBW Daily Cable of June 12, 2008, for GSJBW Commodities
report Coal and Iron Ore- Raising long term prices). The team also believes that in an era of
BRICs induced elevated demand growth, the long-term price has to be high enough to
induce marginal projects to come onstream. Costs of future coal supply are likely to
increase given higher transportation and infrastructure costs as coal fields are developed
further inland as compared with existing sources of export supply. We believe the upward
adjustment of long-dated thermal coal prices increases upside risks to our near-term
pricing assumptions of US$125/t through 2008E/2010E and US$100/t in 2010E/2011E for
ASEAN coal companies under our coverage.
June 19, 2008 ASEAN: Metals & Mining: Coal
Goldman Sachs Global Investment Research 14
Indonesian producers poised to benefit significantly as earnings momentum picks up
We believe the environment is conducive for a stronger and longer Indonesian
thermal coal cycle. Our constructive view of Indonesian thermal coal is predicated on
a positive view of the regional seaborne thermal coal sector as 74% of Indonesia’s
production is for the export markets. We believe incremental coal supply from
Indonesia is likely to be regimented on rising domestic demand, and infrastructure
and regulatory constraints, which add to support high regional thermal coal spot
prices. At the same time, we believe that prices of Indonesian coal are breaking out
from historical trends given rising negotiation power in the export market and strong
demand drivers in the domestic market. We believe that the stronger-than-expected
increase in realized prices will be more than sufficient to offset the elevated
production costs in line with higher diesel prices, bringing about significantly higher
returns in the industry. Regulatory risks remain a key concern but we adopt a more
sanguine view on export controls and actual impact of any regulatory changes
introduced by the new Mining Law on the existing big Indonesian coal producers.
Investment theme #1: Constrained export growth will keep regional prices up
Given the very tight thermal coal seaborne market, growth in Indonesian exports will be
critical in satisfying global import demand over the next few years. We believe a ramp-up
in export volumes is unlikely given underinvestment in exploration over the past few years,
infrastructure and equipment constraints and rising domestic demand. We estimate
Indonesian exports to witness a 6% CAGR over 2007-2010E from 167 mt to 199 mt in 2010E.
Regulatory uncertainty has discouraged large-scale greenfield exploration which is
essential to drive growth. Despite Indonesia’s rich resource base which presents
significant commercial opportunities to the global resource players, the less robust
regulatory framework has hampered prospects for major new investments. Although
small-scale projects have been awarded to existing industry players over the past few
years, they are unlikely to contribute to significant growth as substantial capital is required
for developments of new coal fields which are located further inland.
June 19, 2008 ASEAN: Metals & Mining: Coal
Goldman Sachs Global Investment Research 15
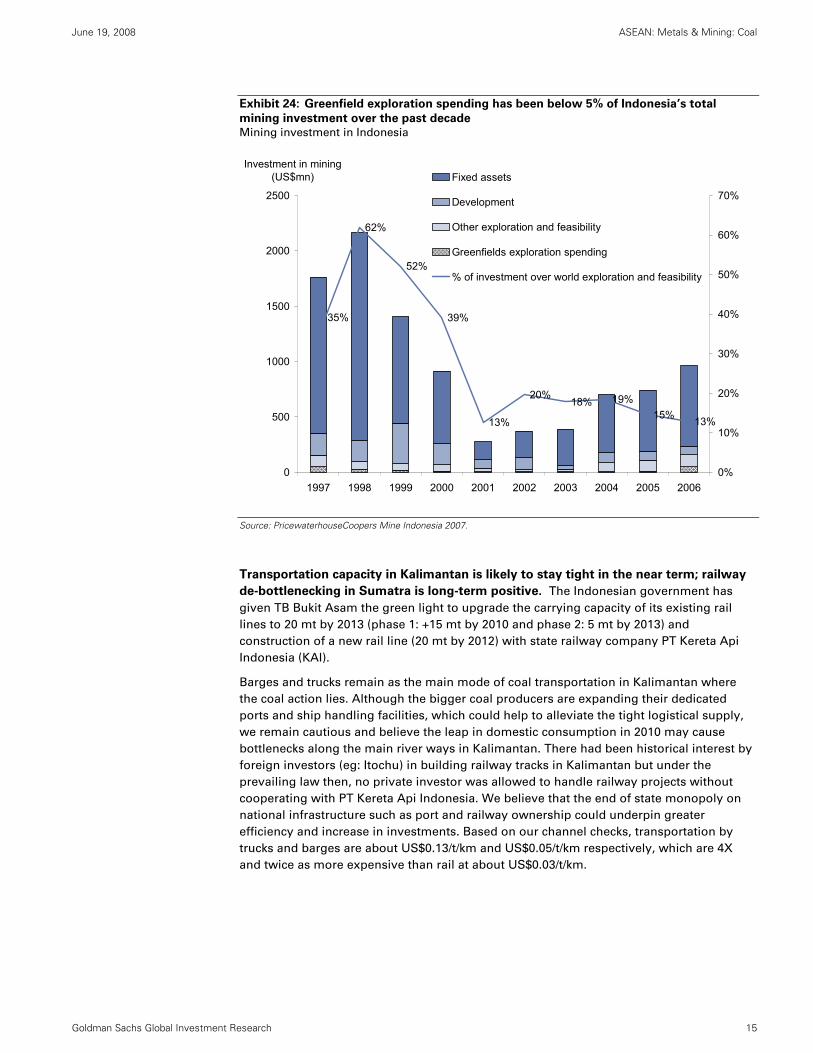
Exhibit 24: Greenfield exploration spending has been below 5% of Indonesia’s total
mining investment over the past decade
Mining investment in Indonesia
62%
52%
39%
13%
20%18% 19%
15% 13%
35%
0
500
1000
1500
2000
2500
1997 1998 1999 2000 2001 2002 2003 2004 2005 2006
Investment in mining (US$mn)
0%
10%
20%
30%
40%
50%
60%
70%
Fixed assets
Development
Other exploration and feasibility
Greenfields exploration spending
% of investment over world exploration and feasibility
Source: PricewaterhouseCoopers Mine Indonesia 2007.
Transportation capacity in Kalimantan is likely to stay tight in the near term; railway
de-bottlenecking in Sumatra is long-term positive. The Indonesian government has
given TB Bukit Asam the green light to upgrade the carrying capacity of its existing rail
lines to 20 mt by 2013 (phase 1: +15 mt by 2010 and phase 2: 5 mt by 2013) and
construction of a new rail line (20 mt by 2012) with state railway company PT Kereta Api
Indonesia (KAI).
Barges and trucks remain as the main mode of coal transportation in Kalimantan where
the coal action lies. Although the bigger coal producers are expanding their dedicated
ports and ship handling facilities, which could help to alleviate the tight logistical supply,
we remain cautious and believe the leap in domestic consumption in 2010 may cause
bottlenecks along the main river ways in Kalimantan. There had been historical interest by
foreign investors (eg: Itochu) in building railway tracks in Kalimantan but under the
prevailing law then, no private investor was allowed to handle railway projects without
cooperating with PT Kereta Api Indonesia. We believe that the end of state monopoly on
national infrastructure such as port and railway ownership could underpin greater
efficiency and increase in investments. Based on our channel checks, transportation by
trucks and barges are about US$0.13/t/km and US$0.05/t/km respectively, which are 4X
and twice as more expensive than rail at about US$0.03/t/km.
June 19, 2008 ASEAN: Metals & Mining: Coal
Goldman Sachs Global Investment Research 16
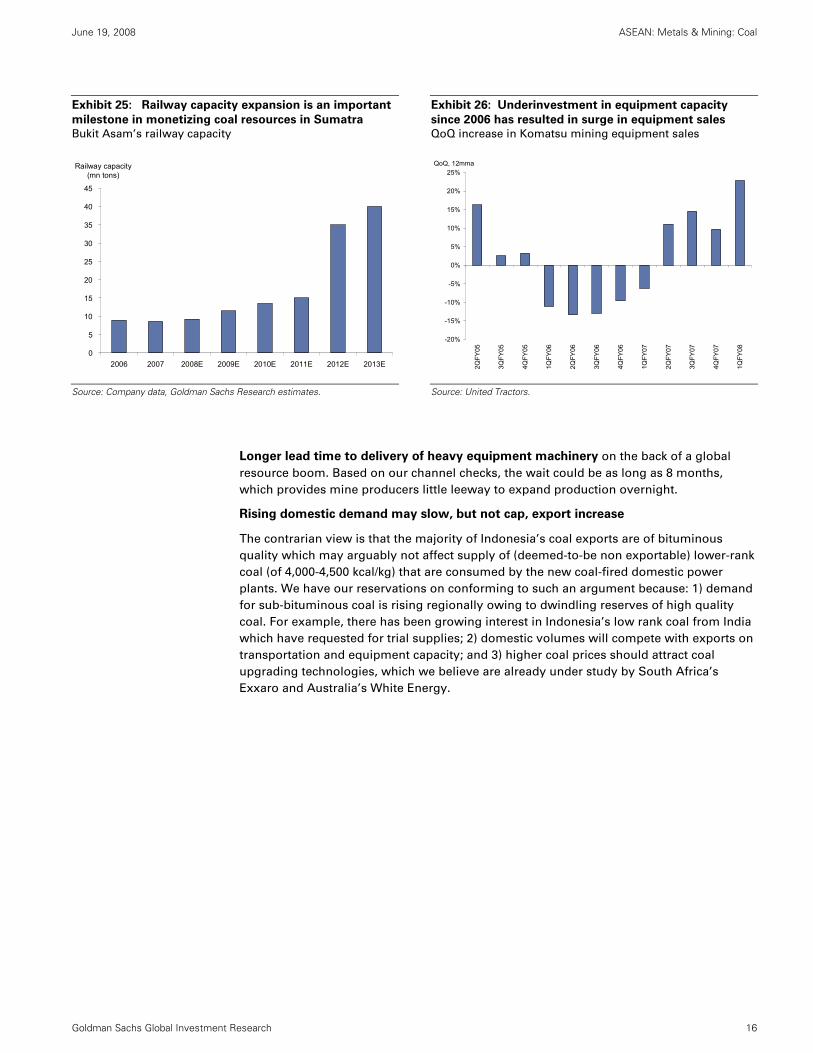
Exhibit 25: Railway capacity expansion is an important
milestone in monetizing coal resources in Sumatra
Bukit Asam’s railway capacity
Exhibit 26: Underinvestment in equipment capacity
since 2006 has resulted in surge in equipment sales
QoQ increase in Komatsu mining equipment sales
0
5
10
15
20
25
30
35
40
45
2006 2007 2008E 2009E 2010E 2011E 2012E 2013E
Railway capacity (mn tons)
-20%
-15%
-10%
-5%
0%
5%
10%
15%
20%
25%
2QFY
05
3QFY
05
4QFY
05
1QFY
06
2QFY
06
3QFY
06
4QFY
06
1QFY
07
2QFY
07
3QFY
07
4QFY
07
1QFY
08
QoQ, 12mma
Source: Company data, Goldman Sachs Research estimates.
Source: United Tractors.
Longer lead time to delivery of heavy equipment machinery on the back of a global
resource boom. Based on our channel checks, the wait could be as long as 8 months,
which provides mine producers little leeway to expand production overnight.
Rising domestic demand may slow, but not cap, export increase
The contrarian view is that the majority of Indonesia’s coal exports are of bituminous
quality which may arguably not affect supply of (deemed-to-be non exportable) lower-rank
coal (of 4,000-4,500 kcal/kg) that are consumed by the new coal-fired domestic power
plants. We have our reservations on conforming to such an argument because: 1) demand
for sub-bituminous coal is rising regionally owing to dwindling reserves of high quality
coal. For example, there has been growing interest in Indonesia’s low rank coal from India
which have requested for trial supplies; 2) domestic volumes will compete with exports on
transportation and equipment capacity; and 3) higher coal prices should attract coal
upgrading technologies, which we believe are already under study by South Africa’s
Exxaro and Australia’s White Energy.
June 19, 2008 ASEAN: Metals & Mining: Coal
Goldman Sachs Global Investment Research 17
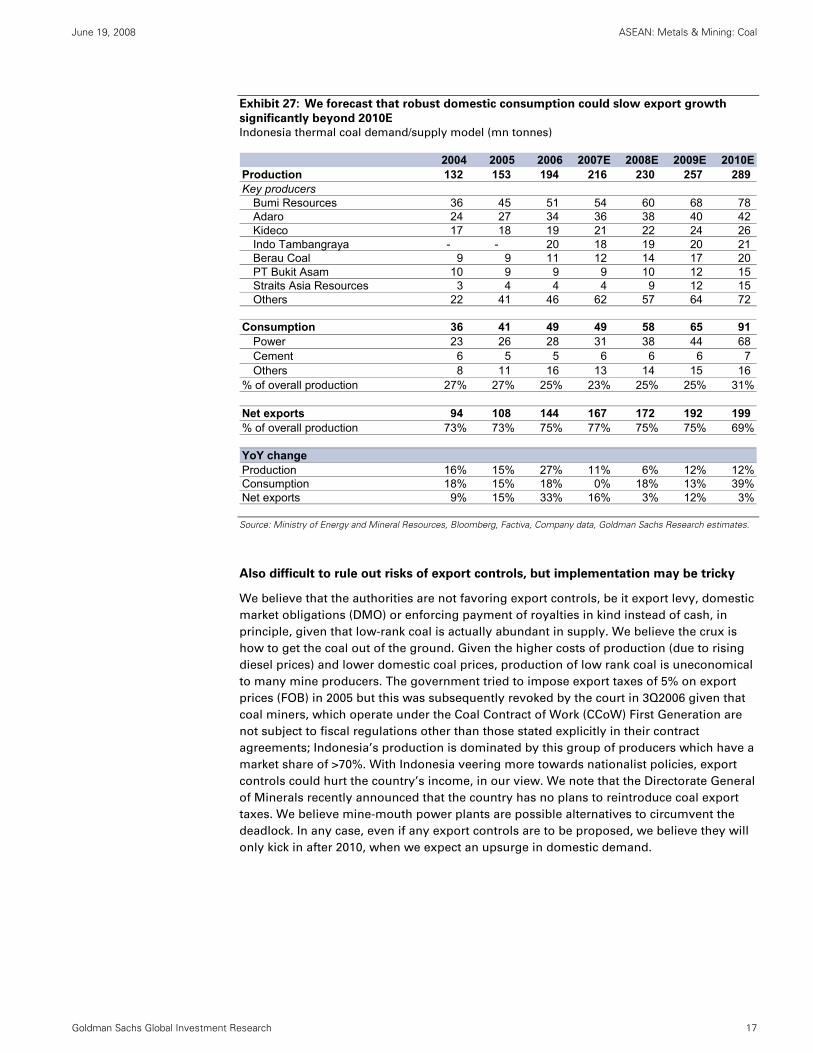
Exhibit 27: We forecast that robust domestic consumption could slow export growth
significantly beyond 2010E
Indonesia thermal coal demand/supply model (mn tonnes)
2004 2005 2006 2007E 2008E 2009E 2010EProduction 132 153 194 216 230 257 289 Key producers 11
Bumi Resources 36 45 51 54 60 68 78 Adaro 24 27 34 36 38 40 42 Kideco 17 18 19 21 22 24 26 Indo Tambangraya - - 20 18 19 20 21 Berau Coal 9 9 11 12 14 17 20 PT Bukit Asam 10 9 9 9 10 12 15 Straits Asia Resources 3 4 4 4 9 12 15 Others 22 41 46 62 57 64 72
Consumption 36 41 49 49 58 65 91 Power 23 26 28 31 38 44 68 Cement 6 5 5 6 6 6 7 Others 8 11 16 13 14 15 16
% of overall production 27% 27% 25% 23% 25% 25% 31%
Net exports 94 108 144 167 172 192 199 % of overall production 73% 73% 75% 77% 75% 75% 69%
YoY change Production 16% 15% 27% 11% 6% 12% 12%Consumption 18% 15% 18% 0% 18% 13% 39%Net exports 9% 15% 33% 16% 3% 12% 3%
Source: Ministry of Energy and Mineral Resources, Bloomberg, Factiva, Company data, Goldman Sachs Research estimates.
Also difficult to rule out risks of export controls, but implementation may be tricky
We believe that the authorities are not favoring export controls, be it export levy, domestic
market obligations (DMO) or enforcing payment of royalties in kind instead of cash, in
principle, given that low-rank coal is actually abundant in supply. We believe the crux is
how to get the coal out of the ground. Given the higher costs of production (due to rising
diesel prices) and lower domestic coal prices, production of low rank coal is uneconomical
to many mine producers. The government tried to impose export taxes of 5% on export
prices (FOB) in 2005 but this was subsequently revoked by the court in 3Q2006 given that
coal miners, which operate under the Coal Contract of Work (CCoW) First Generation are
not subject to fiscal regulations other than those stated explicitly in their contract
agreements; Indonesia’s production is dominated by this group of producers which have a
market share of >70%. With Indonesia veering more towards nationalist policies, export
controls could hurt the country’s income, in our view. We note that the Directorate General
of Minerals recently announced that the country has no plans to reintroduce coal export
taxes. We believe mine-mouth power plants are possible alternatives to circumvent the
deadlock. In any case, even if any export controls are to be proposed, we believe they will
only kick in after 2010, when we expect an upsurge in domestic demand.
June 19, 2008 ASEAN: Metals & Mining: Coal
Goldman Sachs Global Investment Research 18
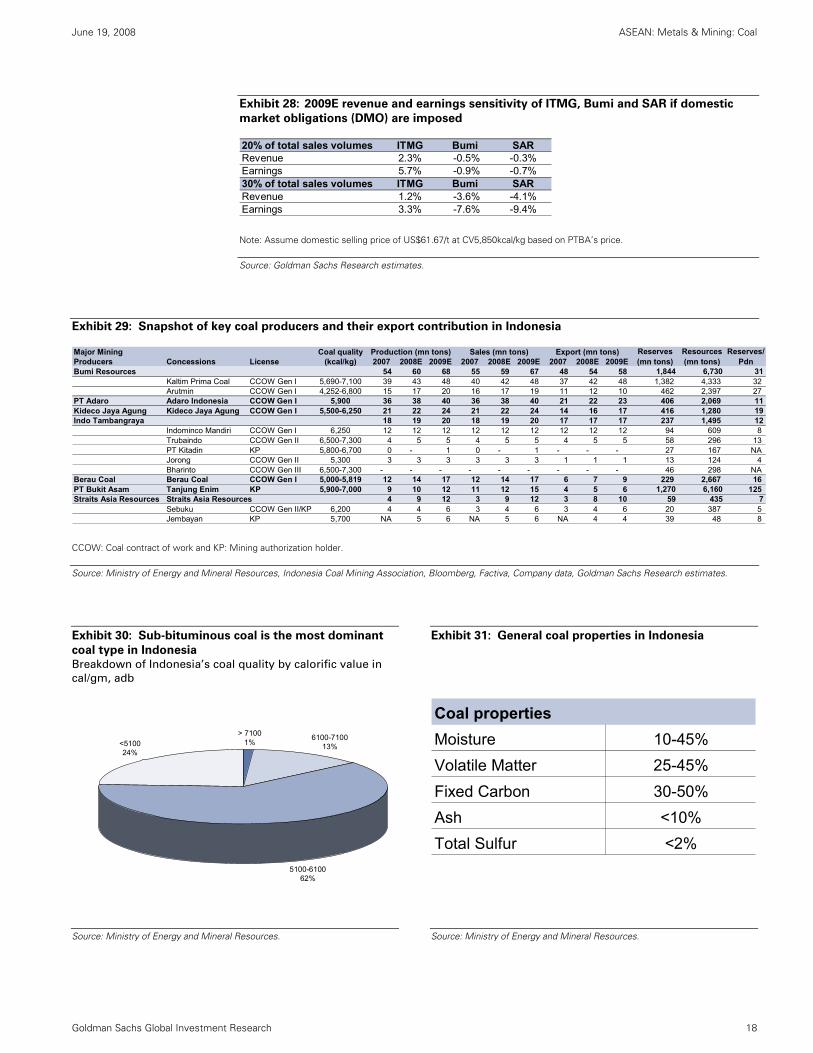
Exhibit 28: 2009E revenue and earnings sensitivity of ITMG, Bumi and SAR if domestic
market obligations (DMO) are imposed
20% of total sales volumes ITMG Bumi SARRevenue 2.3% -0.5% -0.3%Earnings 5.7% -0.9% -0.7%30% of total sales volumes ITMG Bumi SARRevenue 1.2% -3.6% -4.1%Earnings 3.3% -7.6% -9.4%
Note: Assume domestic selling price of US$61.67/t at CV5,850kcal/kg based on PTBA’s price.
Source: Goldman Sachs Research estimates.
Exhibit 29: Snapshot of key coal producers and their export contribution in Indonesia
Major Mining Coal qualityProducers Concessions License (kcal/kg) 2007 2008E 2009E 2007 2008E 2009E 2007 2008E 2009EBumi Resources 54 60 68 55 59 67 48 54 58 1,844 6,730 31
Kaltim Prima Coal CCOW Gen I 5,690-7,100 39 43 48 40 42 48 37 42 48 1,382 4,333 32 Arutmin CCOW Gen I 4,252-6,800 15 17 20 16 17 19 11 12 10 462 2,397 27
PT Adaro Adaro Indonesia CCOW Gen I 5,900 36 38 40 36 38 40 21 22 23 406 2,069 11 Kideco Jaya Agung Kideco Jaya Agung CCOW Gen I 5,500-6,250 21 22 24 21 22 24 14 16 17 416 1,280 19 Indo Tambangraya 18 19 20 18 19 20 17 17 17 237 1,495 12
Indominco Mandiri CCOW Gen I 6,250 12 12 12 12 12 12 12 12 12 94 609 8 Trubaindo CCOW Gen II 6,500-7,300 4 5 5 4 5 5 4 5 5 58 296 13 PT Kitadin KP 5,800-6,700 0 - 1 0 - 1 - - - 27 167 NAJorong CCOW Gen II 5,300 3 3 3 3 3 3 1 1 1 13 124 4 Bharinto CCOW Gen III 6,500-7,300 - - - - - - - - - 46 298 NA
Berau Coal Berau Coal CCOW Gen I 5,000-5,819 12 14 17 12 14 17 6 7 9 229 2,667 16 PT Bukit Asam Tanjung Enim KP 5,900-7,000 9 10 12 11 12 15 4 5 6 1,270 6,160 125 Straits Asia Resources Straits Asia Resources 4 9 12 3 9 12 3 8 10 59 435 7
Sebuku CCOW Gen II/KP 6,200 4 4 6 3 4 6 3 4 6 20 387 5 Jembayan KP 5,700 NA 5 6 NA 5 6 NA 4 4 39 48 8
Reserves/Pdn
Production (mn tons) Export (mn tons) Reserves (mn tons)
Resources (mn tons)
Sales (mn tons)
CCOW: Coal contract of work and KP: Mining authorization holder.
Source: Ministry of Energy and Mineral Resources, Indonesia Coal Mining Association, Bloomberg, Factiva, Company data, Goldman Sachs Research estimates.
Exhibit 30: Sub-bituminous coal is the most dominant
coal type in Indonesia
Breakdown of Indonesia’s coal quality by calorific value in
cal/gm, adb
Exhibit 31: General coal properties in Indonesia
> 71001%
5100-610062%
<510024%
6100-710013%
Coal propertiesMoisture 10-45%Volatile Matter 25-45%Fixed Carbon 30-50%Ash <10%Total Sulfur <2%
Source: Ministry of Energy and Mineral Resources.
Source: Ministry of Energy and Mineral Resources.
June 19, 2008 A
SEAN
: Metals &
Mining: C
oal
Goldm
an Sachs Global Investm
ent Research
19
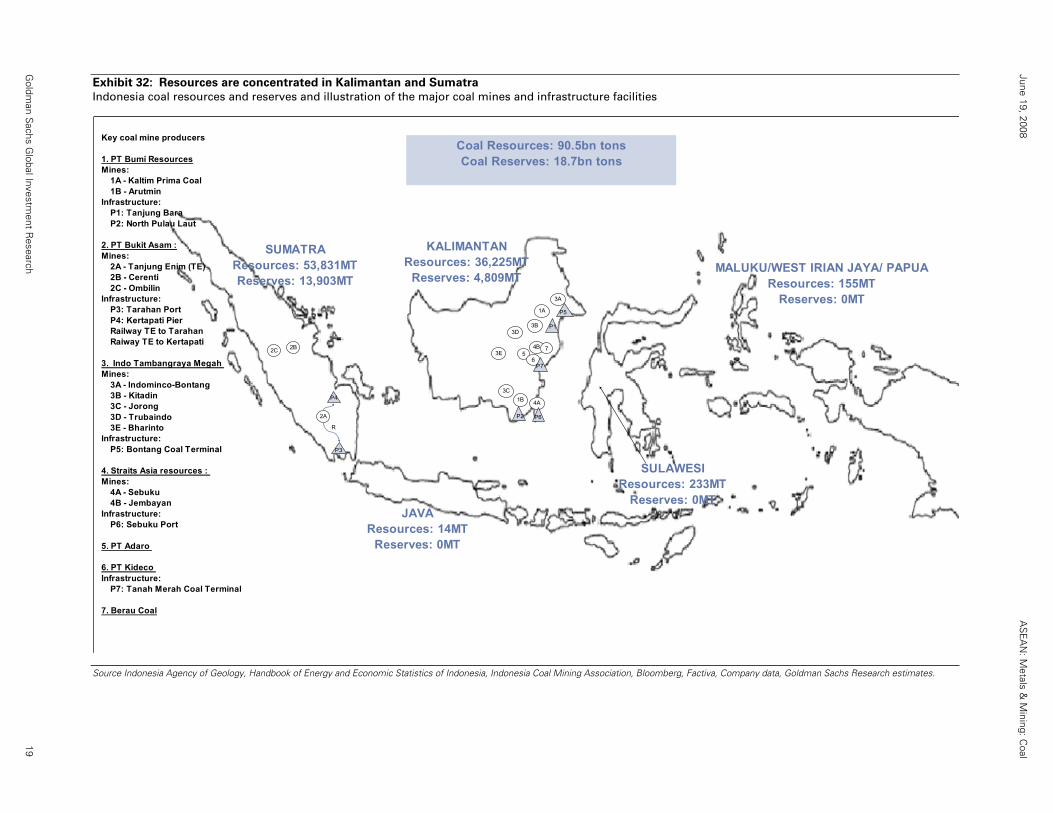
Exhibit 32: Resources are concentrated in Kalimantan and Sumatra
Indonesia coal resources and reserves and illustration of the major coal mines and infrastructure facilities
3D
1A
1B
2B
2A
4A
4B
SUMATRAResources: 53,831MTReserves: 13,903MT
KALIMANTAN Resources: 36,225MT
Reserves: 4,809MT
SULAWESIResources: 233MT
Reserves: 0MT
2C
JAVAResources: 14MT
Reserves: 0MT
MALUKU/WEST IRIAN JAYA/ PAPUAResources: 155MT
Reserves: 0MT
Coal Resources: 90.5bn tonsCoal Reserves: 18.7bn tons
P5
P2
3C
3E
3B
3A
P1
5
P3
P4
R
P6
6P7
7
Key coal mine producers
1. PT Bumi ResourcesMines: 1A - Kaltim Prima Coal 1B - ArutminInfrastructure: P1: Tanjung Bara P2: North Pulau Laut
2. PT Bukit Asam :Mines: 2A - Tanjung Enim (TE) 2B - Cerenti 2C - OmbilinInfrastructure: P3: Tarahan Port P4: Kertapati Pier Railway TE to Tarahan Raiway TE to Kertapati
3. Indo Tambangraya Megah Mines: 3A - Indominco-Bontang 3B - Kitadin 3C - Jorong 3D - Trubaindo 3E - BharintoInfrastructure: P5: Bontang Coal Terminal
4. Straits Asia resources : Mines: 4A - Sebuku 4B - JembayanInfrastructure: P6: Sebuku Port
5. PT Adaro
6. PT Kideco Infrastructure: P7: Tanah Merah Coal Terminal
7. Berau Coal
Source Indonesia Agency of Geology, Handbook of Energy and Economic Statistics of Indonesia, Indonesia Coal Mining Association, Bloomberg, Factiva, Company data, Goldman Sachs Research estimates.
June 19, 2008 ASEAN: Metals & Mining: Coal
Goldman Sachs Global Investment Research 20
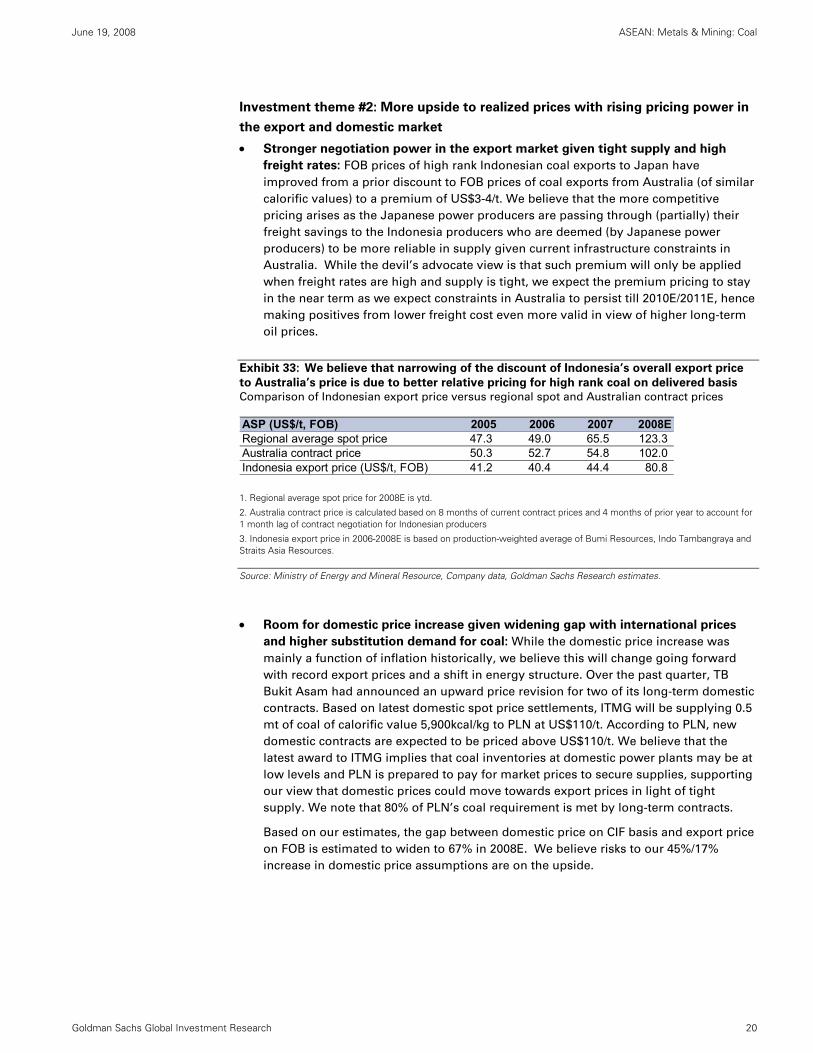
Investment theme #2: More upside to realized prices with rising pricing power in
the export and domestic market
• Stronger negotiation power in the export market given tight supply and high
freight rates: FOB prices of high rank Indonesian coal exports to Japan have
improved from a prior discount to FOB prices of coal exports from Australia (of similar
calorific values) to a premium of US$3-4/t. We believe that the more competitive
pricing arises as the Japanese power producers are passing through (partially) their
freight savings to the Indonesia producers who are deemed (by Japanese power
producers) to be more reliable in supply given current infrastructure constraints in
Australia. While the devil’s advocate view is that such premium will only be applied
when freight rates are high and supply is tight, we expect the premium pricing to stay
in the near term as we expect constraints in Australia to persist till 2010E/2011E, hence
making positives from lower freight cost even more valid in view of higher long-term
oil prices.
Exhibit 33: We believe that narrowing of the discount of Indonesia’s overall export price
to Australia’s price is due to better relative pricing for high rank coal on delivered basis
Comparison of Indonesian export price versus regional spot and Australian contract prices
ASP (US$/t, FOB) 2005 2006 2007 2008ERegional average spot price 47.3 49.0 65.5 123.3 Australia contract price 50.3 52.7 54.8 102.0 Indonesia export price (US$/t, FOB) 41.2 40.4 44.4 80.8
1. Regional average spot price for 2008E is ytd.
2. Australia contract price is calculated based on 8 months of current contract prices and 4 months of prior year to account for 1 month lag of contract negotiation for Indonesian producers
3. Indonesia export price in 2006-2008E is based on production-weighted average of Bumi Resources, Indo Tambangraya and Straits Asia Resources.
Source: Ministry of Energy and Mineral Resource, Company data, Goldman Sachs Research estimates.
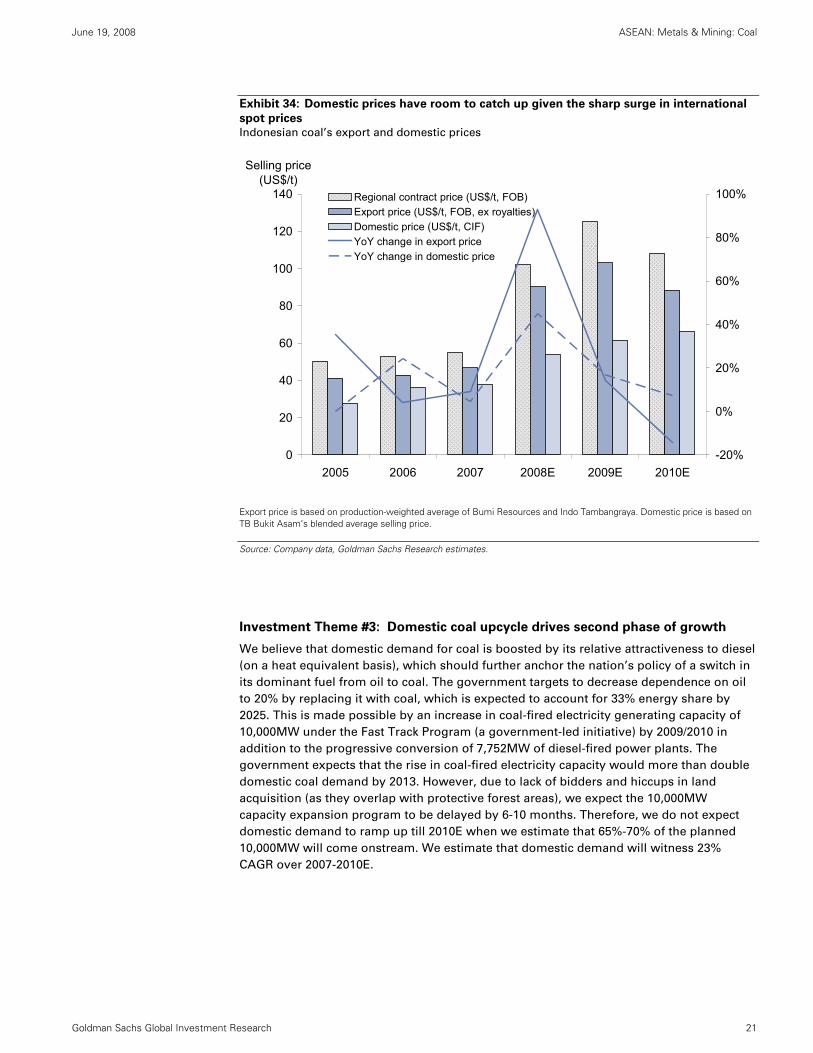
• Room for domestic price increase given widening gap with international prices
and higher substitution demand for coal: While the domestic price increase was
mainly a function of inflation historically, we believe this will change going forward
with record export prices and a shift in energy structure. Over the past quarter, TB
Bukit Asam had announced an upward price revision for two of its long-term domestic
contracts. Based on latest domestic spot price settlements, ITMG will be supplying 0.5
mt of coal of calorific value 5,900kcal/kg to PLN at US$110/t. According to PLN, new
domestic contracts are expected to be priced above US$110/t. We believe that the
latest award to ITMG implies that coal inventories at domestic power plants may be at
low levels and PLN is prepared to pay for market prices to secure supplies, supporting
our view that domestic prices could move towards export prices in light of tight
supply. We note that 80% of PLN’s coal requirement is met by long-term contracts.
Based on our estimates, the gap between domestic price on CIF basis and export price
on FOB is estimated to widen to 67% in 2008E. We believe risks to our 45%/17%
increase in domestic price assumptions are on the upside.
June 19, 2008 ASEAN: Metals & Mining: Coal
Goldman Sachs Global Investment Research 21
Exhibit 34: Domestic prices have room to catch up given the sharp surge in international
spot prices
Indonesian coal’s export and domestic prices
0
20
40
60
80
100
120
140
2005 2006 2007 2008E 2009E 2010E
Selling price (US$/t)
-20%
0%
20%
40%
60%
80%
100%Regional contract price (US$/t, FOB)Export price (US$/t, FOB, ex royalties)Domestic price (US$/t, CIF)YoY change in export price YoY change in domestic price
Export price is based on production-weighted average of Bumi Resources and Indo Tambangraya. Domestic price is based on TB Bukit Asam’s blended average selling price.
Source: Company data, Goldman Sachs Research estimates.
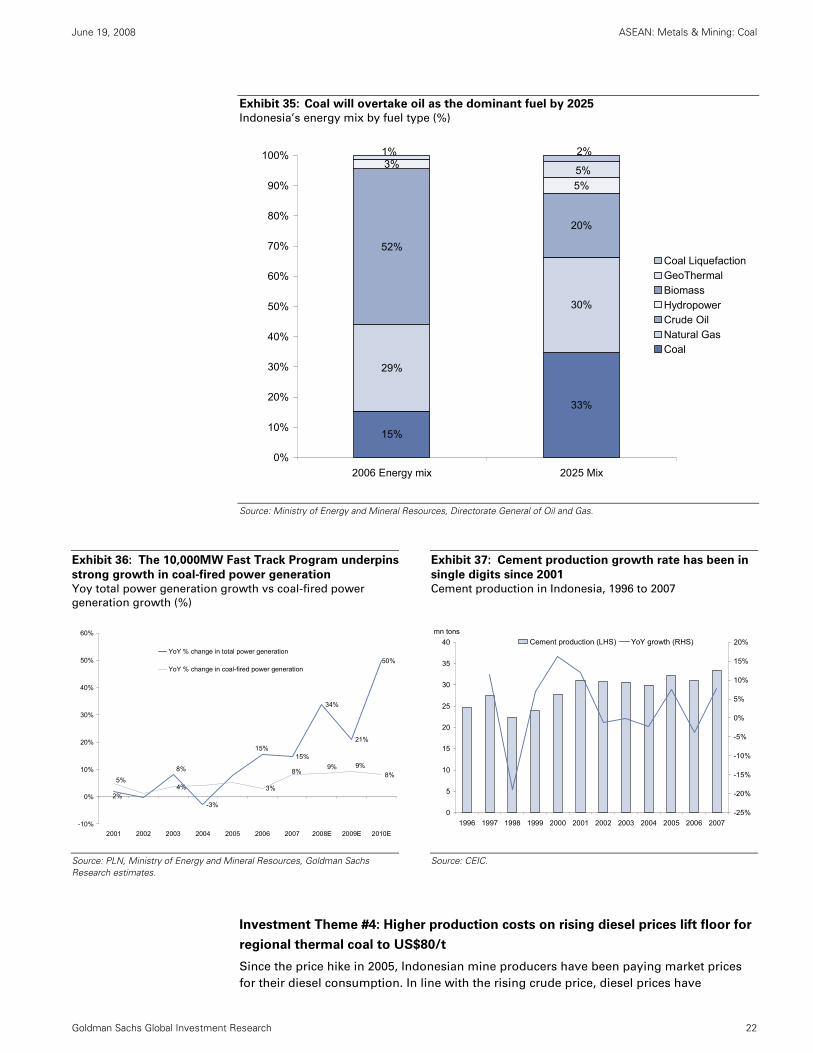
Investment Theme #3: Domestic coal upcycle drives second phase of growth
We believe that domestic demand for coal is boosted by its relative attractiveness to diesel
(on a heat equivalent basis), which should further anchor the nation’s policy of a switch in
its dominant fuel from oil to coal. The government targets to decrease dependence on oil
to 20% by replacing it with coal, which is expected to account for 33% energy share by
2025. This is made possible by an increase in coal-fired electricity generating capacity of
10,000MW under the Fast Track Program (a government-led initiative) by 2009/2010 in
addition to the progressive conversion of 7,752MW of diesel-fired power plants. The
government expects that the rise in coal-fired electricity capacity would more than double
domestic coal demand by 2013. However, due to lack of bidders and hiccups in land
acquisition (as they overlap with protective forest areas), we expect the 10,000MW
capacity expansion program to be delayed by 6-10 months. Therefore, we do not expect
domestic demand to ramp up till 2010E when we estimate that 65%-70% of the planned
10,000MW will come onstream. We estimate that domestic demand will witness 23%
CAGR over 2007-2010E.
June 19, 2008 ASEAN: Metals & Mining: Coal
Goldman Sachs Global Investment Research 22
Exhibit 35: Coal will overtake oil as the dominant fuel by 2025
Indonesia’s energy mix by fuel type (%)
15%
33%
29%
30%
52%
20%
3%
5%5%
1% 2%
0%
10%
20%
30%
40%
50%
60%
70%
80%
90%
100%
2006 Energy mix 2025 Mix
Coal LiquefactionGeoThermalBiomassHydropowerCrude OilNatural GasCoal
Source: Ministry of Energy and Mineral Resources, Directorate General of Oil and Gas.
Exhibit 36: The 10,000MW Fast Track Program underpins
strong growth in coal-fired power generation
Yoy total power generation growth vs coal-fired power
generation growth (%)
Exhibit 37: Cement production growth rate has been in
single digits since 2001
Cement production in Indonesia, 1996 to 2007
-3%
15%
34%
21%
50%
4% 3%
8%
2%
15%
8% 9%9%8%
5%
-10%
0%
10%
20%
30%
40%
50%
60%
2001 2002 2003 2004 2005 2006 2007 2008E 2009E 2010E
YoY % change in total power generation
YoY % change in coal-fired power generation
0
5
10
15
20
25
30
35
40
1996 1997 1998 1999 2000 2001 2002 2003 2004 2005 2006 2007
mn tons
-25%
-20%
-15%
-10%
-5%
0%
5%
10%
15%
20%Cement production (LHS) YoY growth (RHS)
Source: PLN, Ministry of Energy and Mineral Resources, Goldman Sachs Research estimates.
Source: CEIC.
Investment Theme #4: Higher production costs on rising diesel prices lift floor for
regional thermal coal to US$80/t
Since the price hike in 2005, Indonesian mine producers have been paying market prices
for their diesel consumption. In line with the rising crude price, diesel prices have
June 19, 2008 ASEAN: Metals & Mining: Coal
Goldman Sachs Global Investment Research 23
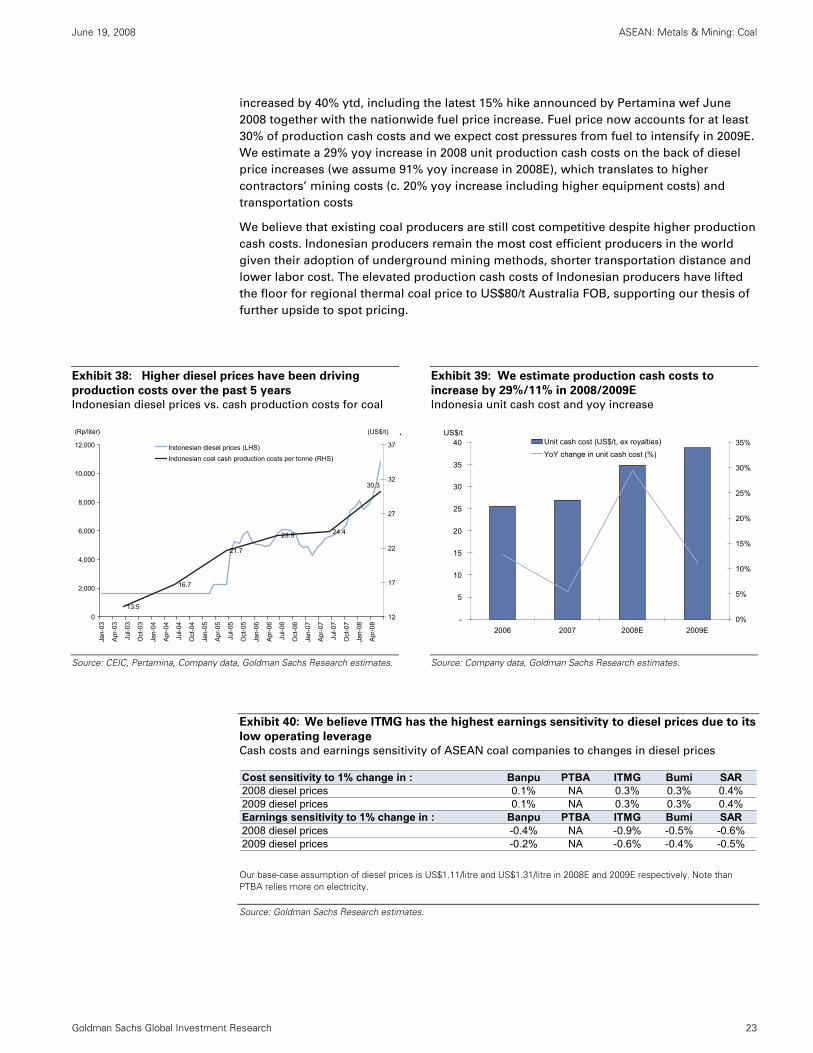
increased by 40% ytd, including the latest 15% hike announced by Pertamina wef June
2008 together with the nationwide fuel price increase. Fuel price now accounts for at least
30% of production cash costs and we expect cost pressures from fuel to intensify in 2009E.
We estimate a 29% yoy increase in 2008 unit production cash costs on the back of diesel
price increases (we assume 91% yoy increase in 2008E), which translates to higher
contractors’ mining costs (c. 20% yoy increase including higher equipment costs) and
transportation costs
We believe that existing coal producers are still cost competitive despite higher production
cash costs. Indonesian producers remain the most cost efficient producers in the world
given their adoption of underground mining methods, shorter transportation distance and
lower labor cost. The elevated production cash costs of Indonesian producers have lifted
the floor for regional thermal coal price to US$80/t Australia FOB, supporting our thesis of
further upside to spot pricing.
Exhibit 38: Higher diesel prices have been driving
production costs over the past 5 years
Indonesian diesel prices vs. cash production costs for coal
Exhibit 39: We estimate production cash costs to
increase by 29%/11% in 2008/2009E
Indonesia unit cash cost and yoy increase
13.5
16.7
21.7
23.9 24.4
30.3
0
2,000
4,000
6,000
8,000
10,000
12,000
Jan-
03
Apr
-03
Jul-0
3
Oct
-03
Jan-
04
Apr
-04
Jul-0
4
Oct
-04
Jan-
05
Apr
-05
Jul-0
5
Oct
-05
Jan-
06
Apr
-06
Jul-0
6
Oct
-06
Jan-
07
Apr
-07
Jul-0
7
Oct
-07
Jan-
08
Apr
-08
(Rp/liter)
12
17
22
27
32
37
(US$/t)
Indonesian diesel prices (LHS)Indonesian coal cash production costs per tonne (RHS)
.
-
5
10
15
20
25
30
35
40
2006 2007 2008E 2009E
US$/t
0%
5%
10%
15%
20%
25%
30%
35%Unit cash cost (US$/t, ex royalties)YoY change in unit cash cost (%)
Source: CEIC, Pertamina, Company data, Goldman Sachs Research estimates.
Source: Company data, Goldman Sachs Research estimates.
Exhibit 40: We believe ITMG has the highest earnings sensitivity to diesel prices due to its
low operating leverage
Cash costs and earnings sensitivity of ASEAN coal companies to changes in diesel prices
Cost sensitivity to 1% change in : Banpu PTBA ITMG Bumi SAR2008 diesel prices 0.1% NA 0.3% 0.3% 0.4%2009 diesel prices 0.1% NA 0.3% 0.3% 0.4%Earnings sensitivity to 1% change in : Banpu PTBA ITMG Bumi SAR2008 diesel prices -0.4% NA -0.9% -0.5% -0.6%2009 diesel prices -0.2% NA -0.6% -0.4% -0.5%
Our base-case assumption of diesel prices is US$1.11/litre and US$1.31/litre in 2008E and 2009E respectively. Note than PTBA relies more on electricity.
Source: Goldman Sachs Research estimates.
June 19, 2008 ASEAN: Metals & Mining: Coal
Goldman Sachs Global Investment Research 24
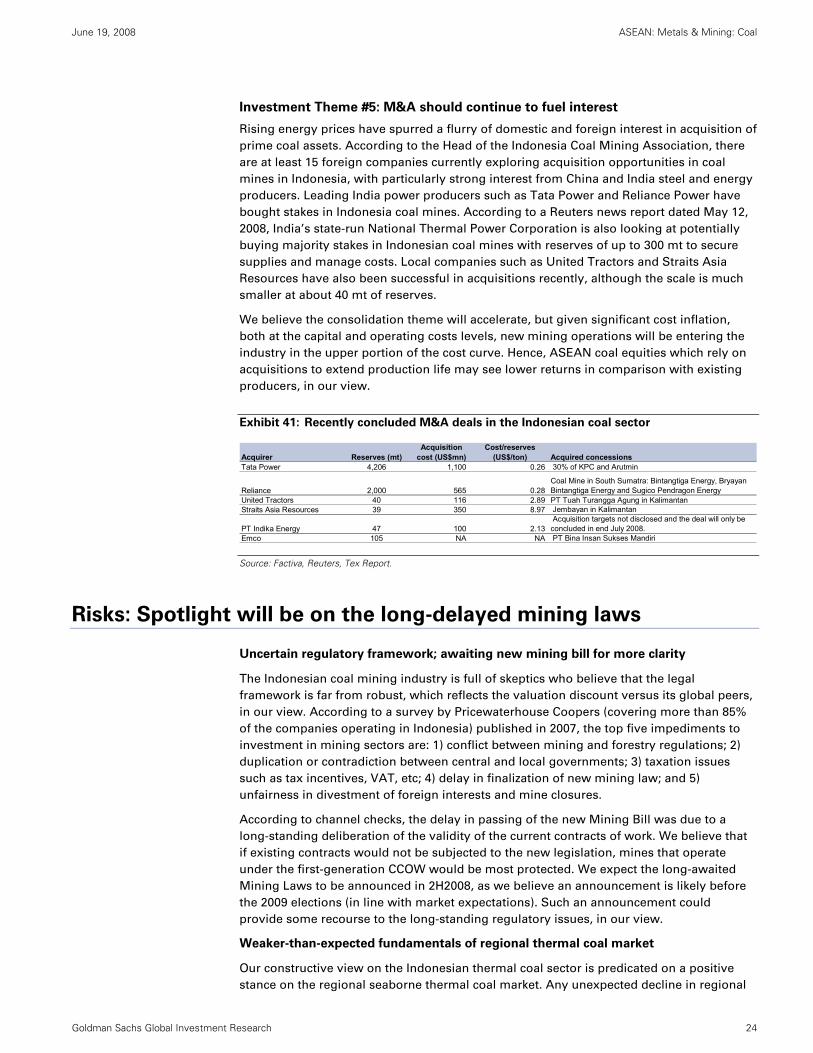
Investment Theme #5: M&A should continue to fuel interest
Rising energy prices have spurred a flurry of domestic and foreign interest in acquisition of
prime coal assets. According to the Head of the Indonesia Coal Mining Association, there
are at least 15 foreign companies currently exploring acquisition opportunities in coal
mines in Indonesia, with particularly strong interest from China and India steel and energy
producers. Leading India power producers such as Tata Power and Reliance Power have
bought stakes in Indonesia coal mines. According to a Reuters news report dated May 12,
2008, India’s state-run National Thermal Power Corporation is also looking at potentially
buying majority stakes in Indonesian coal mines with reserves of up to 300 mt to secure
supplies and manage costs. Local companies such as United Tractors and Straits Asia
Resources have also been successful in acquisitions recently, although the scale is much
smaller at about 40 mt of reserves.
We believe the consolidation theme will accelerate, but given significant cost inflation,
both at the capital and operating costs levels, new mining operations will be entering the
industry in the upper portion of the cost curve. Hence, ASEAN coal equities which rely on
acquisitions to extend production life may see lower returns in comparison with existing
producers, in our view.
Exhibit 41: Recently concluded M&A deals in the Indonesian coal sector
Acquirer Reserves (mt)Acquisition
cost (US$mn)Cost/reserves
(US$/ton) Acquired concessionsTata Power 4,206 1,100 0.26 30% of KPC and Arutmin
Reliance 2,000 565 0.28 Coal Mine in South Sumatra: Bintangtiga Energy, Bryayan Bintangtiga Energy and Sugico Pendragon Energy
United Tractors 40 116 2.89 PT Tuah Turangga Agung in KalimantanStraits Asia Resources 39 350 8.97 Jembayan in Kalimantan
PT Indika Energy 47 100 2.13 Acquisition targets not disclosed and the deal will only be concluded in end July 2008.
Emco 105 NA NA PT Bina Insan Sukses Mandiri
Source: Factiva, Reuters, Tex Report.
Risks: Spotlight will be on the long-delayed mining laws
Uncertain regulatory framework; awaiting new mining bill for more clarity
The Indonesian coal mining industry is full of skeptics who believe that the legal
framework is far from robust, which reflects the valuation discount versus its global peers,
in our view. According to a survey by Pricewaterhouse Coopers (covering more than 85%
of the companies operating in Indonesia) published in 2007, the top five impediments to
investment in mining sectors are: 1) conflict between mining and forestry regulations; 2)
duplication or contradiction between central and local governments; 3) taxation issues
such as tax incentives, VAT, etc; 4) delay in finalization of new mining law; and 5)
unfairness in divestment of foreign interests and mine closures.
According to channel checks, the delay in passing of the new Mining Bill was due to a
long-standing deliberation of the validity of the current contracts of work. We believe that
if existing contracts would not be subjected to the new legislation, mines that operate
under the first-generation CCOW would be most protected. We expect the long-awaited
Mining Laws to be announced in 2H2008, as we believe an announcement is likely before
the 2009 elections (in line with market expectations). Such an announcement could
provide some recourse to the long-standing regulatory issues, in our view.
Weaker-than-expected fundamentals of regional thermal coal market
Our constructive view on the Indonesian thermal coal sector is predicated on a positive
stance on the regional seaborne thermal coal market. Any unexpected decline in regional
June 19, 2008 ASEAN: Metals & Mining: Coal
Goldman Sachs Global Investment Research 25
demand (for example due to environmental (carbon controls) and technological influences
(such as advanced combustion technologies)) or earlier-than-expected recovery in supply
constraints could derail our positive outlook.
Unpredictable weather can disrupt production
The rainy season in Indonesia typically runs from October/November through
February/March. Normal production can decrease by 5%-30% depending on the mine’s
topography, supporting infrastructure, and mining machinery and equipment.
Heavy rainfall in the coal producing region of Kalimantan had affected production for some
coal mines such as PT Kideco and PT Adaro in 1H2008 and in 2H2007, whereas Indo
Tambangraya and Straits Resources had to declare force majuear on their shipments.
Given unexpected weather conditions, we believe that producers with diversified mine
locations are better protected against weather-related risks.
Proliferation of illegal mining
Inconsistent legislative interpretations at the regional and central government levels have
resulted in an increase in the issue of illegitimate permits issued by the local governments.
Holders of these illegal KPs (mining permits) account for c. 20 mt of illegal coal exports
every year. The government is reviewing the licensing structure in Indonesia and the new
Mining Bill should seek to address this issue, in our view.
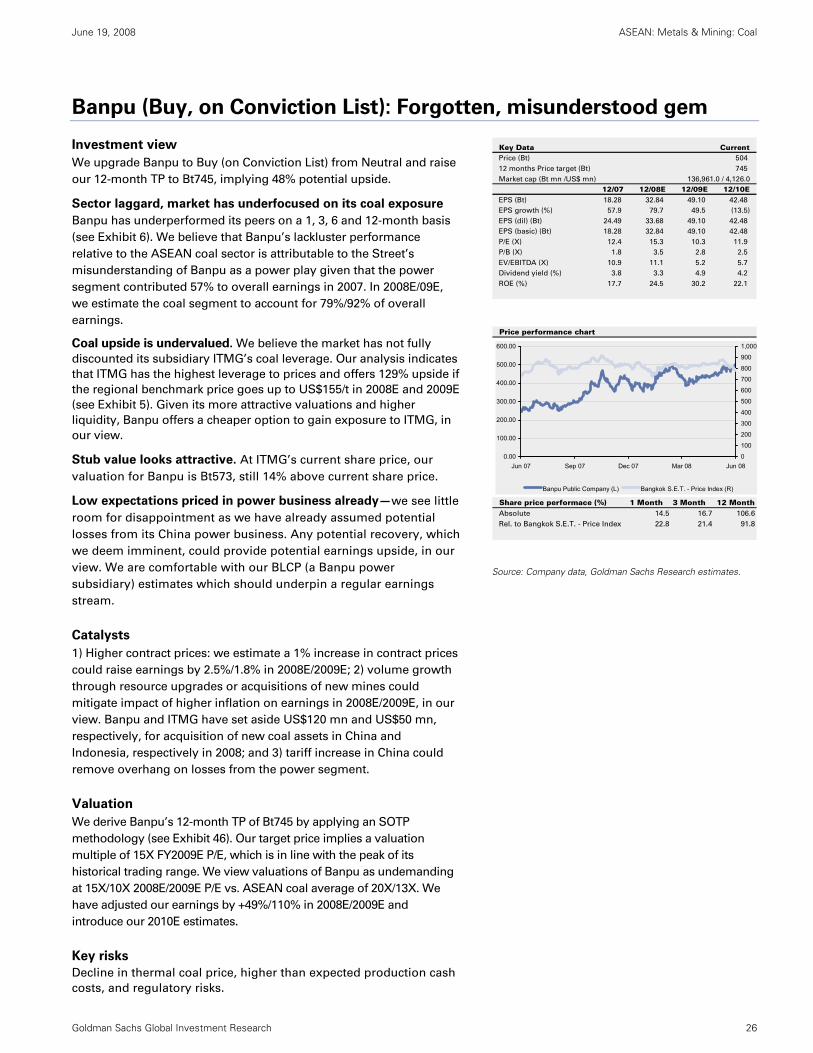
June 19, 2008 ASEAN: Metals & Mining: Coal
Goldman Sachs Global Investment Research 26
Banpu (Buy, on Conviction List): Forgotten, misunderstood gem
Investment view
We upgrade Banpu to Buy (on Conviction List) from Neutral and raise
our 12-month TP to Bt745, implying 48% potential upside.
Sector laggard, market has underfocused on its coal exposure
Banpu has underperformed its peers on a 1, 3, 6 and 12-month basis
(see Exhibit 6). We believe that Banpu’s lackluster performance
relative to the ASEAN coal sector is attributable to the Street’s
misunderstanding of Banpu as a power play given that the power
segment contributed 57% to overall earnings in 2007. In 2008E/09E,
we estimate the coal segment to account for 79%/92% of overall
earnings.
Coal upside is undervalued. We believe the market has not fully
discounted its subsidiary ITMG’s coal leverage. Our analysis indicates
that ITMG has the highest leverage to prices and offers 129% upside if
the regional benchmark price goes up to US$155/t in 2008E and 2009E
(see Exhibit 5). Given its more attractive valuations and higher
liquidity, Banpu offers a cheaper option to gain exposure to ITMG, in
our view.
Stub value looks attractive. At ITMG’s current share price, our
valuation for Banpu is Bt573, still 14% above current share price.
Low expectations priced in power business already—we see little
room for disappointment as we have already assumed potential
losses from its China power business. Any potential recovery, which
we deem imminent, could provide potential earnings upside, in our
view. We are comfortable with our BLCP (a Banpu power
subsidiary) estimates which should underpin a regular earnings
stream.
Catalysts
1) Higher contract prices: we estimate a 1% increase in contract prices
could raise earnings by 2.5%/1.8% in 2008E/2009E; 2) volume growth
through resource upgrades or acquisitions of new mines could
mitigate impact of higher inflation on earnings in 2008E/2009E, in our
view. Banpu and ITMG have set aside US$120 mn and US$50 mn,
respectively, for acquisition of new coal assets in China and
Indonesia, respectively in 2008; and 3) tariff increase in China could
remove overhang on losses from the power segment.
Valuation
We derive Banpu’s 12-month TP of Bt745 by applying an SOTP
methodology (see Exhibit 46). Our target price implies a valuation
multiple of 15X FY2009E P/E, which is in line with the peak of its
historical trading range. We view valuations of Banpu as undemanding
at 15X/10X 2008E/2009E P/E vs. ASEAN coal average of 20X/13X. We
have adjusted our earnings by +49%/110% in 2008E/2009E and
introduce our 2010E estimates.
Key risks
Decline in thermal coal price, higher than expected production cash
costs, and regulatory risks.
Key Data CurrentPrice (Bt) 504
12 months Price target (Bt) 745
Market cap (Bt mn /US$ mn) 136,961.0 / 4,126.0
12/07 12/08E 12/09E 12/10EEPS (Bt) 18.28 32.84 49.10 42.48
EPS growth (%) 57.9 79.7 49.5 (13.5)
EPS (dil) (Bt) 24.49 33.68 49.10 42.48
EPS (basic) (Bt) 18.28 32.84 49.10 42.48
P/E (X) 12.4 15.3 10.3 11.9
P/B (X) 1.8 3.5 2.8 2.5
EV/EBITDA (X) 10.9 11.1 5.2 5.7
Dividend yield (%) 3.8 3.3 4.9 4.2
ROE (%) 17.7 24.5 30.2 22.1
Price performance chart
Share price performace (%) 1 Month 3 Month 12 MonthAbsolute 14.5 16.7 106.6
Rel. to Bangkok S.E.T. - Price Index 22.8 21.4 91.8
0.00
100.00
200.00
300.00
400.00
500.00
600.00
Jun 07 Sep 07 Dec 07 Mar 08 Jun 080
100
200
300
400
500
600
700
800
900
1,000
Banpu Public Company (L) Bangkok S.E.T. - Price Index (R)
Source: Company data, Goldman Sachs Research estimates.
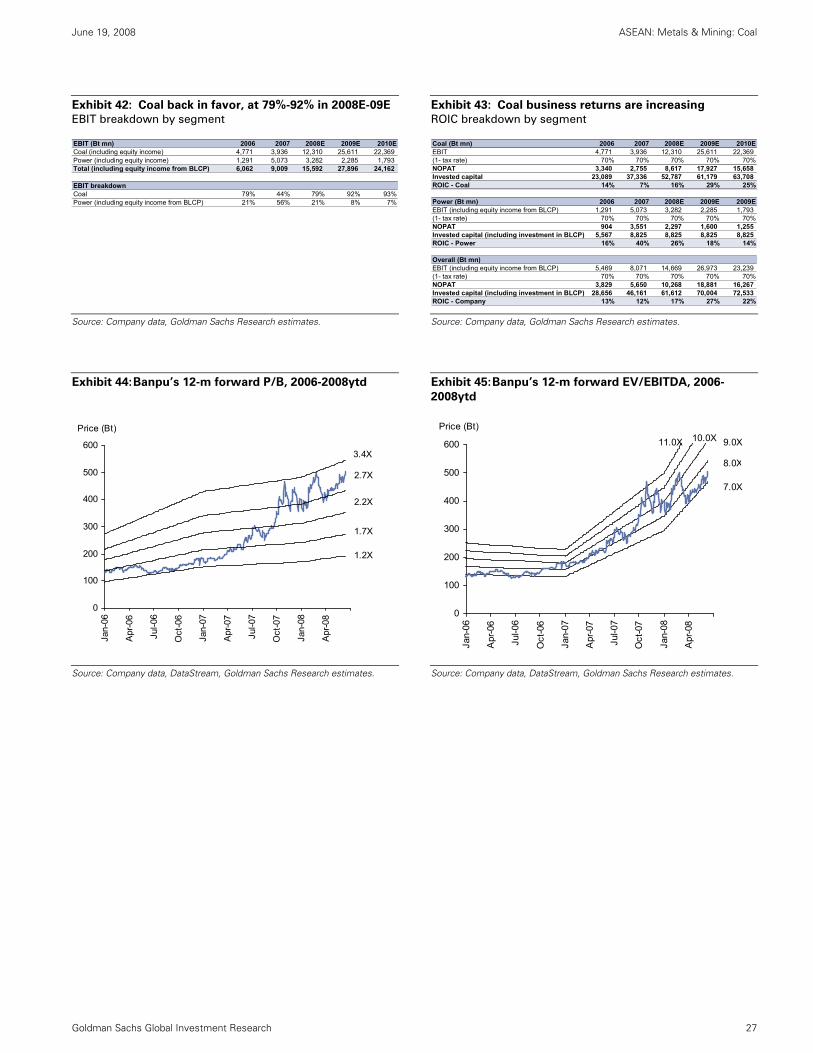
June 19, 2008 ASEAN: Metals & Mining: Coal
Goldman Sachs Global Investment Research 27
Exhibit 42: Coal back in favor, at 79%-92% in 2008E-09E
EBIT breakdown by segment
Exhibit 43: Coal business returns are increasing
ROIC breakdown by segment
EBIT (Bt mn) 2006 2007 2008E 2009E 2010ECoal (including equity income) 4,771 3,936 12,310 25,611 22,369 Power (including equity income) 1,291 5,073 3,282 2,285 1,793 Total (including equity income from BLCP) 6,062 9,009 15,592 27,896 24,162
593 938 923 923 923
EBIT breakdownCoal 79% 44% 79% 92% 93%Power (including equity income from BLCP) 21% 56% 21% 8% 7%
Coal (Bt mn) 2006 2007 2008E 2009E 2010EEBIT 4,771 3,936 12,310 25,611 22,369 (1- tax rate) 70% 70% 70% 70% 70%NOPAT 3,340 2,755 8,617 17,927 15,658 Invested capital 23,089 37,336 52,787 61,179 63,708 ROIC - Coal 14% 7% 16% 29% 25%
Power (Bt mn) 2006 2007 2008E 2009E 2009EEBIT (including equity income from BLCP) 1,291 5,073 3,282 2,285 1,793 (1- tax rate) 70% 70% 70% 70% 70%NOPAT 904 3,551 2,297 1,600 1,255 Invested capital (including investment in BLCP) 5,567 8,825 8,825 8,825 8,825 ROIC - Power 16% 40% 26% 18% 14%
Overall (Bt mn)EBIT (including equity income from BLCP) 5,469 8,071 14,669 26,973 23,239 (1- tax rate) 70% 70% 70% 70% 70%NOPAT 3,829 5,650 10,268 18,881 16,267 Invested capital (including investment in BLCP) 28,656 46,161 61,612 70,004 72,533 ROIC - Company 13% 12% 17% 27% 22%
Source: Company data, Goldman Sachs Research estimates.
Source: Company data, Goldman Sachs Research estimates.
Exhibit 44: Banpu’s 12-m forward P/B, 2006-2008ytd
Exhibit 45: Banpu’s 12-m forward EV/EBITDA, 2006-
2008ytd
0
100
200
300
400
500
600
Jan-
06
Apr
-06
Jul-0
6
Oct
-06
Jan-
07
Apr
-07
Jul-0
7
Oct
-07
Jan-
08
Apr
-08
Price (Bt)
1.2X
3.4X
2.7X
2.2X
1.7X
0
100
200
300
400
500
600
Jan-
06
Apr
-06
Jul-0
6
Oct
-06
Jan-
07
Apr
-07
Jul-0
7
Oct
-07
Jan-
08
Apr
-08
8.0X
Price (Bt)10.0X11.0X 9.0X
7.0X
Source: Company data, DataStream, Goldman Sachs Research estimates.
Source: Company data, DataStream, Goldman Sachs Research estimates.
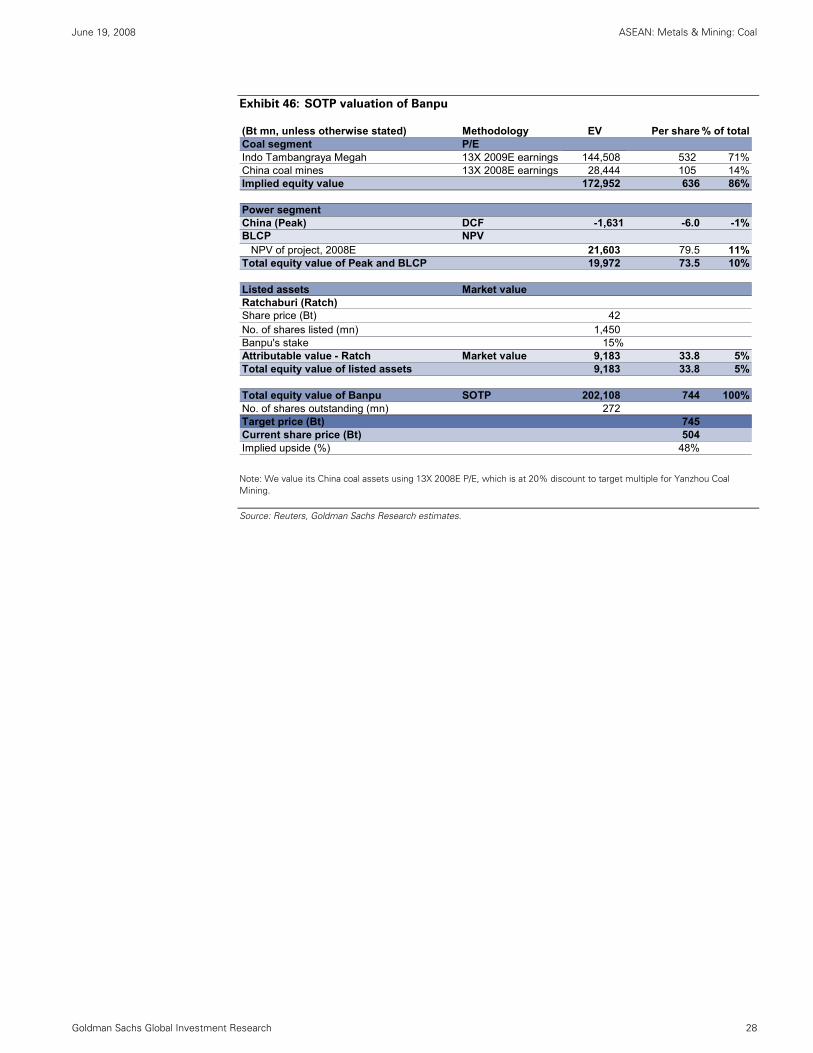
June 19, 2008 ASEAN: Metals & Mining: Coal
Goldman Sachs Global Investment Research 28
Exhibit 46: SOTP valuation of Banpu
(Bt mn, unless otherwise stated) Methodology EV Per share % of totalCoal segment P/EIndo Tambangraya Megah 13X 2009E earnings 144,508 532 71%China coal mines 13X 2008E earnings 28,444 105 14%Implied equity value 172,952 636 86%
Power segmentChina (Peak) DCF -1,631 -6.0 -1%BLCP NPV
NPV of project, 2008E 21,603 79.5 11%Total equity value of Peak and BLCP 19,972 73.5 10%
Listed assets Market valueRatchaburi (Ratch)Share price (Bt) 42No. of shares listed (mn) 1,450Banpu's stake 15%Attributable value - Ratch Market value 9,183 33.8 5%Total equity value of listed assets 9,183 33.8 5%
Total equity value of Banpu SOTP 202,108 744 100%No. of shares outstanding (mn) 272Target price (Bt) 745Current share price (Bt) 504Implied upside (%) 48%
Note: We value its China coal assets using 13X 2008E P/E, which is at 20% discount to target multiple for Yanzhou Coal Mining.
Source: Reuters, Goldman Sachs Research estimates.
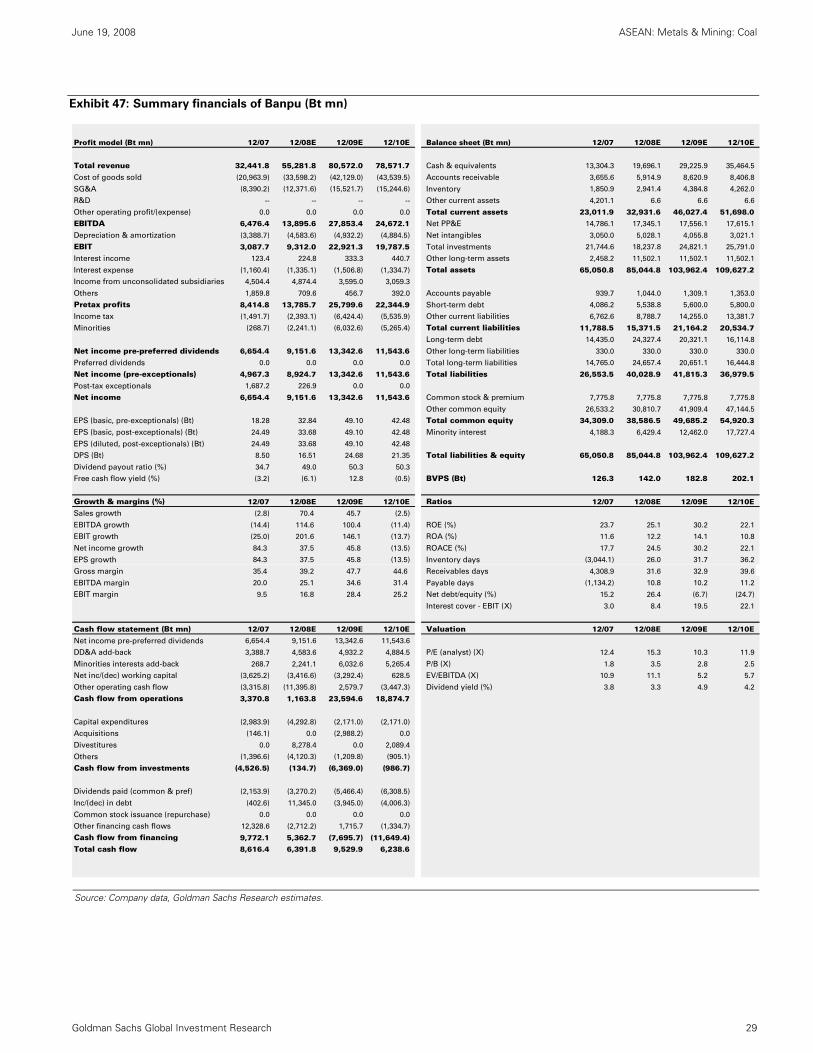
June 19, 2008 ASEAN: Metals & Mining: Coal
Goldman Sachs Global Investment Research 29
Exhibit 47: Summary financials of Banpu (Bt mn)
Profit model (Bt mn) 12/07 12/08E 12/09E 12/10E Balance sheet (Bt mn) 12/07 12/08E 12/09E 12/10E
Total revenue 32,441.8 55,281.8 80,572.0 78,571.7 Cash & equivalents 13,304.3 19,696.1 29,225.9 35,464.5
Cost of goods sold (20,963.9) (33,598.2) (42,129.0) (43,539.5) Accounts receivable 3,655.6 5,914.9 8,620.9 8,406.8
SG&A (8,390.2) (12,371.6) (15,521.7) (15,244.6) Inventory 1,850.9 2,941.4 4,384.8 4,262.0
R&D -- -- -- -- Other current assets 4,201.1 6.6 6.6 6.6
Other operating profit/(expense) 0.0 0.0 0.0 0.0 Total current assets 23,011.9 32,931.6 46,027.4 51,698.0
EBITDA 6,476.4 13,895.6 27,853.4 24,672.1 Net PP&E 14,786.1 17,345.1 17,556.1 17,615.1
Depreciation & amortization (3,388.7) (4,583.6) (4,932.2) (4,884.5) Net intangibles 3,050.0 5,028.1 4,055.8 3,021.1
EBIT 3,087.7 9,312.0 22,921.3 19,787.5 Total investments 21,744.6 18,237.8 24,821.1 25,791.0
Interest income 123.4 224.8 333.3 440.7 Other long-term assets 2,458.2 11,502.1 11,502.1 11,502.1
Interest expense (1,160.4) (1,335.1) (1,506.8) (1,334.7) Total assets 65,050.8 85,044.8 103,962.4 109,627.2
Income from unconsolidated subsidiaries 4,504.4 4,874.4 3,595.0 3,059.3
Others 1,859.8 709.6 456.7 392.0 Accounts payable 939.7 1,044.0 1,309.1 1,353.0
Pretax profits 8,414.8 13,785.7 25,799.6 22,344.9 Short-term debt 4,086.2 5,538.8 5,600.0 5,800.0
Income tax (1,491.7) (2,393.1) (6,424.4) (5,535.9) Other current liabilities 6,762.6 8,788.7 14,255.0 13,381.7
Minorities (268.7) (2,241.1) (6,032.6) (5,265.4) Total current liabilities 11,788.5 15,371.5 21,164.2 20,534.7
Long-term debt 14,435.0 24,327.4 20,321.1 16,114.8
Net income pre-preferred dividends 6,654.4 9,151.6 13,342.6 11,543.6 Other long-term liabilities 330.0 330.0 330.0 330.0
Preferred dividends 0.0 0.0 0.0 0.0 Total long-term liabilities 14,765.0 24,657.4 20,651.1 16,444.8
Net income (pre-exceptionals) 4,967.3 8,924.7 13,342.6 11,543.6 Total liabilities 26,553.5 40,028.9 41,815.3 36,979.5
Post-tax exceptionals 1,687.2 226.9 0.0 0.0
Net income 6,654.4 9,151.6 13,342.6 11,543.6 Common stock & premium 7,775.8 7,775.8 7,775.8 7,775.8
Other common equity 26,533.2 30,810.7 41,909.4 47,144.5
EPS (basic, pre-exceptionals) (Bt) 18.28 32.84 49.10 42.48 Total common equity 34,309.0 38,586.5 49,685.2 54,920.3
EPS (basic, post-exceptionals) (Bt) 24.49 33.68 49.10 42.48 Minority interest 4,188.3 6,429.4 12,462.0 17,727.4
EPS (diluted, post-exceptionals) (Bt) 24.49 33.68 49.10 42.48
DPS (Bt) 8.50 16.51 24.68 21.35 Total liabilities & equity 65,050.8 85,044.8 103,962.4 109,627.2
Dividend payout ratio (%) 34.7 49.0 50.3 50.3
Free cash flow yield (%) (3.2) (6.1) 12.8 (0.5) BVPS (Bt) 126.3 142.0 182.8 202.1
Growth & margins (%) 12/07 12/08E 12/09E 12/10E Ratios 12/07 12/08E 12/09E 12/10E
Sales growth (2.8) 70.4 45.7 (2.5)
EBITDA growth (14.4) 114.6 100.4 (11.4) ROE (%) 23.7 25.1 30.2 22.1
EBIT growth (25.0) 201.6 146.1 (13.7) ROA (%) 11.6 12.2 14.1 10.8
Net income growth 84.3 37.5 45.8 (13.5) ROACE (%) 17.7 24.5 30.2 22.1
EPS growth 84.3 37.5 45.8 (13.5) Inventory days (3,044.1) 26.0 31.7 36.2
Gross margin 35.4 39.2 47.7 44.6 Receivables days 4,308.9 31.6 32.9 39.6
EBITDA margin 20.0 25.1 34.6 31.4 Payable days (1,134.2) 10.8 10.2 11.2
EBIT margin 9.5 16.8 28.4 25.2 Net debt/equity (%) 15.2 26.4 (6.7) (24.7)
Interest cover - EBIT (X) 3.0 8.4 19.5 22.1
Cash flow statement (Bt mn) 12/07 12/08E 12/09E 12/10E Valuation 12/07 12/08E 12/09E 12/10E
Net income pre-preferred dividends 6,654.4 9,151.6 13,342.6 11,543.6
DD&A add-back 3,388.7 4,583.6 4,932.2 4,884.5 P/E (analyst) (X) 12.4 15.3 10.3 11.9
Minorities interests add-back 268.7 2,241.1 6,032.6 5,265.4 P/B (X) 1.8 3.5 2.8 2.5
Net inc/(dec) working capital (3,625.2) (3,416.6) (3,292.4) 628.5 EV/EBITDA (X) 10.9 11.1 5.2 5.7
Other operating cash flow (3,315.8) (11,395.8) 2,579.7 (3,447.3) Dividend yield (%) 3.8 3.3 4.9 4.2
Cash flow from operations 3,370.8 1,163.8 23,594.6 18,874.7
Capital expenditures (2,983.9) (4,292.8) (2,171.0) (2,171.0)
Acquisitions (146.1) 0.0 (2,988.2) 0.0
Divestitures 0.0 8,278.4 0.0 2,089.4
Others (1,396.6) (4,120.3) (1,209.8) (905.1)
Cash flow from investments (4,526.5) (134.7) (6,369.0) (986.7)
Dividends paid (common & pref) (2,153.9) (3,270.2) (5,466.4) (6,308.5)
Inc/(dec) in debt (402.6) 11,345.0 (3,945.0) (4,006.3)
Common stock issuance (repurchase) 0.0 0.0 0.0 0.0
Other financing cash flows 12,328.6 (2,712.2) 1,715.7 (1,334.7)
Cash flow from financing 9,772.1 5,362.7 (7,695.7) (11,649.4)
Total cash flow 8,616.4 6,391.8 9,529.9 6,238.6
Source: Company data, Goldman Sachs Research estimates.
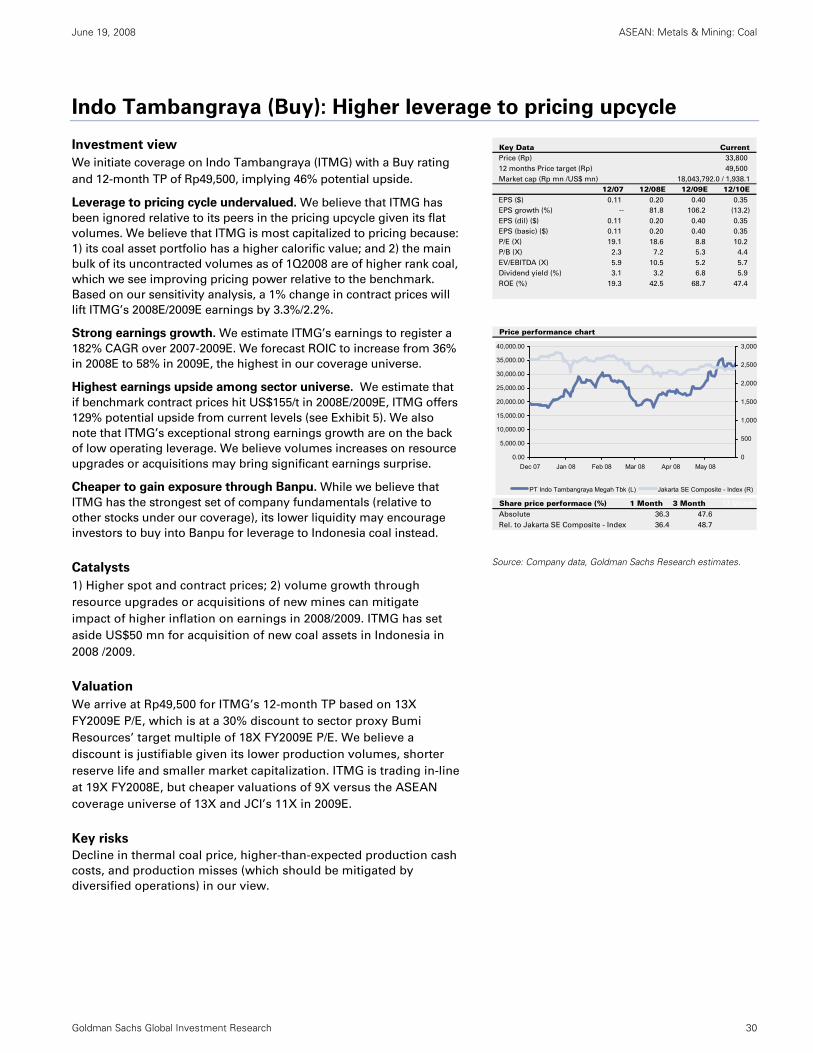
June 19, 2008 ASEAN: Metals & Mining: Coal
Goldman Sachs Global Investment Research 30
Indo Tambangraya (Buy): Higher leverage to pricing upcycle
Investment view
We initiate coverage on Indo Tambangraya (ITMG) with a Buy rating
and 12-month TP of Rp49,500, implying 46% potential upside.
Leverage to pricing cycle undervalued. We believe that ITMG has
been ignored relative to its peers in the pricing upcycle given its flat
volumes. We believe that ITMG is most capitalized to pricing because:
1) its coal asset portfolio has a higher calorific value; and 2) the main
bulk of its uncontracted volumes as of 1Q2008 are of higher rank coal,
which we see improving pricing power relative to the benchmark.
Based on our sensitivity analysis, a 1% change in contract prices will
lift ITMG’s 2008E/2009E earnings by 3.3%/2.2%.
Strong earnings growth. We estimate ITMG’s earnings to register a
182% CAGR over 2007-2009E. We forecast ROIC to increase from 36%
in 2008E to 58% in 2009E, the highest in our coverage universe.
Highest earnings upside among sector universe. We estimate that
if benchmark contract prices hit US$155/t in 2008E/2009E, ITMG offers
129% potential upside from current levels (see Exhibit 5). We also
note that ITMG’s exceptional strong earnings growth are on the back
of low operating leverage. We believe volumes increases on resource
upgrades or acquisitions may bring significant earnings surprise.
Cheaper to gain exposure through Banpu. While we believe that
ITMG has the strongest set of company fundamentals (relative to
other stocks under our coverage), its lower liquidity may encourage
investors to buy into Banpu for leverage to Indonesia coal instead.
Catalysts
1) Higher spot and contract prices; 2) volume growth through
resource upgrades or acquisitions of new mines can mitigate
impact of higher inflation on earnings in 2008/2009. ITMG has set
aside US$50 mn for acquisition of new coal assets in Indonesia in
2008 /2009.
Valuation
We arrive at Rp49,500 for ITMG’s 12-month TP based on 13X
FY2009E P/E, which is at a 30% discount to sector proxy Bumi
Resources’ target multiple of 18X FY2009E P/E. We believe a
discount is justifiable given its lower production volumes, shorter
reserve life and smaller market capitalization. ITMG is trading in-line
at 19X FY2008E, but cheaper valuations of 9X versus the ASEAN
coverage universe of 13X and JCI’s 11X in 2009E.
Key risks
Decline in thermal coal price, higher-than-expected production cash
costs, and production misses (which should be mitigated by
diversified operations) in our view.
Key Data CurrentPrice (Rp) 33,800
12 months Price target (Rp) 49,500
Market cap (Rp mn /US$ mn) 18,043,792.0 / 1,938.1
12/07 12/08E 12/09E 12/10EEPS ($) 0.11 0.20 0.40 0.35
EPS growth (%) -- 81.8 106.2 (13.2)
EPS (dil) ($) 0.11 0.20 0.40 0.35
EPS (basic) ($) 0.11 0.20 0.40 0.35
P/E (X) 19.1 18.6 8.8 10.2
P/B (X) 2.3 7.2 5.3 4.4
EV/EBITDA (X) 5.9 10.5 5.2 5.7
Dividend yield (%) 3.1 3.2 6.8 5.9
ROE (%) 19.3 42.5 68.7 47.4
Price performance chart
Share price performace (%) 1 Month 3 Month 12 Month
Absolute 36.3 47.6
Rel. to Jakarta SE Composite - Index 36.4 48.7
0.00
5,000.00
10,000.00
15,000.00
20,000.00
25,000.00
30,000.00
35,000.00
40,000.00
Dec 07 Jan 08 Feb 08 Mar 08 Apr 08 May 080
500
1,000
1,500
2,000
2,500
3,000
PT Indo Tambangraya Megah Tbk (L) Jakarta SE Composite - Index (R)
Source: Company data, Goldman Sachs Research estimates.
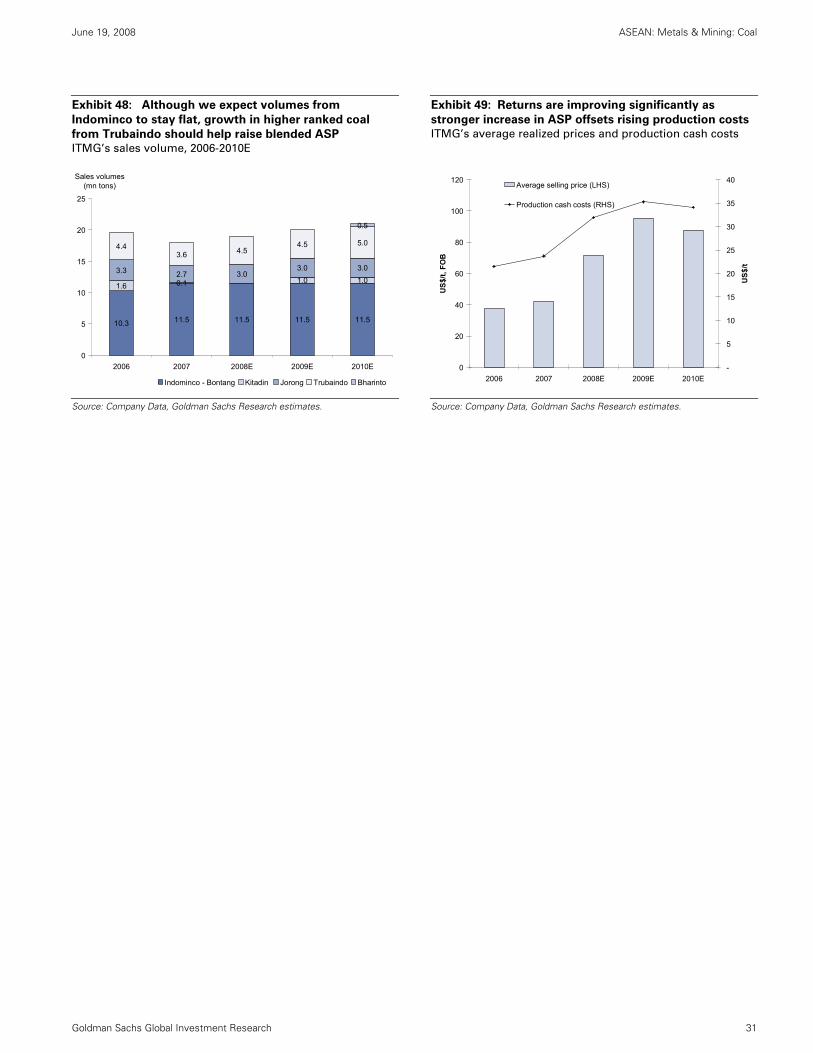
June 19, 2008 ASEAN: Metals & Mining: Coal
Goldman Sachs Global Investment Research 31
Exhibit 48: Although we expect volumes from
Indominco to stay flat, growth in higher ranked coal
from Trubaindo should help raise blended ASP
ITMG’s sales volume, 2006-2010E
Exhibit 49: Returns are improving significantly as
stronger increase in ASP offsets rising production costs
ITMG’s average realized prices and production cash costs
10.3 11.5 11.5 11.5 11.5
1.6 0.1 1.0 1.03.3 2.7 3.0
3.0 3.0
4.43.6 4.5
4.5 5.0
0.5
0
5
10
15
20
25
2006 2007 2008E 2009E 2010E
Sales volumes (mn tons)
Indominco - Bontang Kitadin Jorong Trubaindo Bharinto
0
20
40
60
80
100
120
2006 2007 2008E 2009E 2010E
US$
/t, F
OB
-
5
10
15
20
25
30
35
40
US$
/t
Average selling price (LHS)
Production cash costs (RHS)
Source: Company Data, Goldman Sachs Research estimates.
Source: Company Data, Goldman Sachs Research estimates.
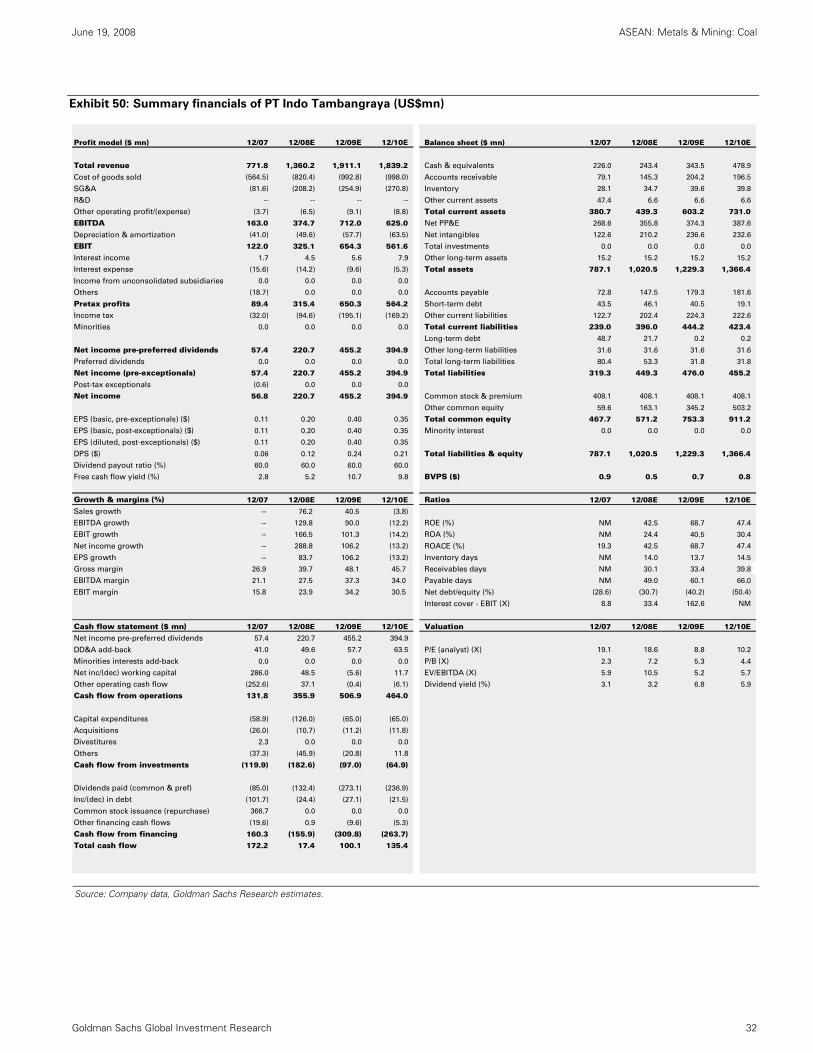
June 19, 2008 ASEAN: Metals & Mining: Coal
Goldman Sachs Global Investment Research 32
Exhibit 50: Summary financials of PT Indo Tambangraya (US$mn)
Profit model ($ mn) 12/07 12/08E 12/09E 12/10E Balance sheet ($ mn) 12/07 12/08E 12/09E 12/10E
Total revenue 771.8 1,360.2 1,911.1 1,839.2 Cash & equivalents 226.0 243.4 343.5 478.9
Cost of goods sold (564.5) (820.4) (992.8) (998.0) Accounts receivable 79.1 145.3 204.2 196.5
SG&A (81.6) (208.2) (254.9) (270.8) Inventory 28.1 34.7 39.6 39.8
R&D -- -- -- -- Other current assets 47.4 6.6 6.6 6.6
Other operating profit/(expense) (3.7) (6.5) (9.1) (8.8) Total current assets 380.7 439.3 603.2 731.0
EBITDA 163.0 374.7 712.0 625.0 Net PP&E 268.6 355.8 374.3 387.6
Depreciation & amortization (41.0) (49.6) (57.7) (63.5) Net intangibles 122.6 210.2 236.6 232.6
EBIT 122.0 325.1 654.3 561.6 Total investments 0.0 0.0 0.0 0.0
Interest income 1.7 4.5 5.6 7.9 Other long-term assets 15.2 15.2 15.2 15.2
Interest expense (15.6) (14.2) (9.6) (5.3) Total assets 787.1 1,020.5 1,229.3 1,366.4
Income from unconsolidated subsidiaries 0.0 0.0 0.0 0.0
Others (18.7) 0.0 0.0 0.0 Accounts payable 72.8 147.5 179.3 181.6
Pretax profits 89.4 315.4 650.3 564.2 Short-term debt 43.5 46.1 40.5 19.1
Income tax (32.0) (94.6) (195.1) (169.2) Other current liabilities 122.7 202.4 224.3 222.6
Minorities 0.0 0.0 0.0 0.0 Total current liabilities 239.0 396.0 444.2 423.4
Long-term debt 48.7 21.7 0.2 0.2
Net income pre-preferred dividends 57.4 220.7 455.2 394.9 Other long-term liabilities 31.6 31.6 31.6 31.6
Preferred dividends 0.0 0.0 0.0 0.0 Total long-term liabilities 80.4 53.3 31.8 31.8
Net income (pre-exceptionals) 57.4 220.7 455.2 394.9 Total liabilities 319.3 449.3 476.0 455.2
Post-tax exceptionals (0.6) 0.0 0.0 0.0
Net income 56.8 220.7 455.2 394.9 Common stock & premium 408.1 408.1 408.1 408.1
Other common equity 59.6 163.1 345.2 503.2
EPS (basic, pre-exceptionals) ($) 0.11 0.20 0.40 0.35 Total common equity 467.7 571.2 753.3 911.2
EPS (basic, post-exceptionals) ($) 0.11 0.20 0.40 0.35 Minority interest 0.0 0.0 0.0 0.0
EPS (diluted, post-exceptionals) ($) 0.11 0.20 0.40 0.35
DPS ($) 0.06 0.12 0.24 0.21 Total liabilities & equity 787.1 1,020.5 1,229.3 1,366.4
Dividend payout ratio (%) 60.0 60.0 60.0 60.0
Free cash flow yield (%) 2.8 5.2 10.7 9.8 BVPS ($) 0.9 0.5 0.7 0.8
Growth & margins (%) 12/07 12/08E 12/09E 12/10E Ratios 12/07 12/08E 12/09E 12/10E
Sales growth -- 76.2 40.5 (3.8)
EBITDA growth -- 129.8 90.0 (12.2) ROE (%) NM 42.5 68.7 47.4
EBIT growth -- 166.5 101.3 (14.2) ROA (%) NM 24.4 40.5 30.4
Net income growth -- 288.8 106.2 (13.2) ROACE (%) 19.3 42.5 68.7 47.4
EPS growth -- 83.7 106.2 (13.2) Inventory days NM 14.0 13.7 14.5
Gross margin 26.9 39.7 48.1 45.7 Receivables days NM 30.1 33.4 39.8
EBITDA margin 21.1 27.5 37.3 34.0 Payable days NM 49.0 60.1 66.0
EBIT margin 15.8 23.9 34.2 30.5 Net debt/equity (%) (28.6) (30.7) (40.2) (50.4)
Interest cover - EBIT (X) 8.8 33.4 162.6 NM
Cash flow statement ($ mn) 12/07 12/08E 12/09E 12/10E Valuation 12/07 12/08E 12/09E 12/10E
Net income pre-preferred dividends 57.4 220.7 455.2 394.9
DD&A add-back 41.0 49.6 57.7 63.5 P/E (analyst) (X) 19.1 18.6 8.8 10.2
Minorities interests add-back 0.0 0.0 0.0 0.0 P/B (X) 2.3 7.2 5.3 4.4
Net inc/(dec) working capital 286.0 48.5 (5.6) 11.7 EV/EBITDA (X) 5.9 10.5 5.2 5.7
Other operating cash flow (252.6) 37.1 (0.4) (6.1) Dividend yield (%) 3.1 3.2 6.8 5.9
Cash flow from operations 131.8 355.9 506.9 464.0
Capital expenditures (58.9) (126.0) (65.0) (65.0)
Acquisitions (26.0) (10.7) (11.2) (11.8)
Divestitures 2.3 0.0 0.0 0.0
Others (37.3) (45.9) (20.8) 11.8
Cash flow from investments (119.9) (182.6) (97.0) (64.9)
Dividends paid (common & pref) (85.0) (132.4) (273.1) (236.9)
Inc/(dec) in debt (101.7) (24.4) (27.1) (21.5)
Common stock issuance (repurchase) 366.7 0.0 0.0 0.0
Other financing cash flows (19.6) 0.9 (9.6) (5.3)
Cash flow from financing 160.3 (155.9) (309.8) (263.7)
Total cash flow 172.2 17.4 100.1 135.4
Source: Company data, Goldman Sachs Research estimates.
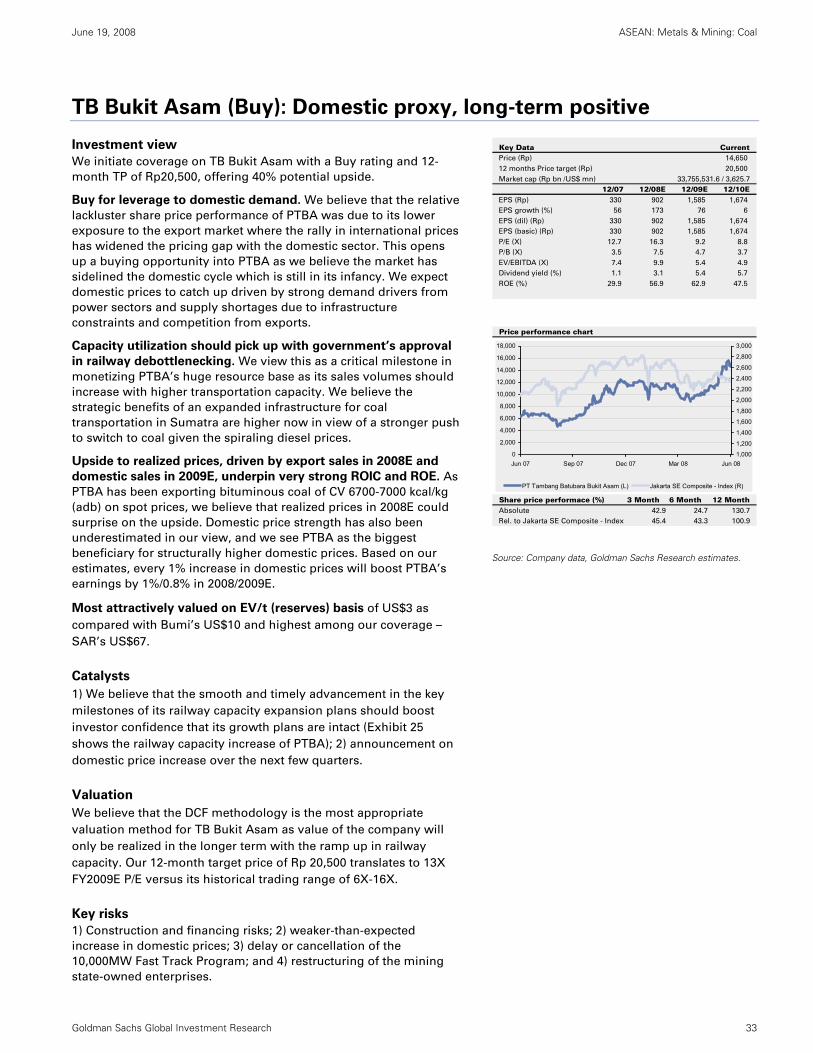
June 19, 2008 ASEAN: Metals & Mining: Coal
Goldman Sachs Global Investment Research 33
TB Bukit Asam (Buy): Domestic proxy, long-term positive
Investment view
We initiate coverage on TB Bukit Asam with a Buy rating and 12-
month TP of Rp20,500, offering 40% potential upside.
Buy for leverage to domestic demand. We believe that the relative
lackluster share price performance of PTBA was due to its lower
exposure to the export market where the rally in international prices
has widened the pricing gap with the domestic sector. This opens
up a buying opportunity into PTBA as we believe the market has
sidelined the domestic cycle which is still in its infancy. We expect
domestic prices to catch up driven by strong demand drivers from
power sectors and supply shortages due to infrastructure
constraints and competition from exports.
Capacity utilization should pick up with government’s approval
in railway debottlenecking. We view this as a critical milestone in
monetizing PTBA’s huge resource base as its sales volumes should
increase with higher transportation capacity. We believe the
strategic benefits of an expanded infrastructure for coal
transportation in Sumatra are higher now in view of a stronger push
to switch to coal given the spiraling diesel prices.
Upside to realized prices, driven by export sales in 2008E and
domestic sales in 2009E, underpin very strong ROIC and ROE. As
PTBA has been exporting bituminous coal of CV 6700-7000 kcal/kg
(adb) on spot prices, we believe that realized prices in 2008E could
surprise on the upside. Domestic price strength has also been
underestimated in our view, and we see PTBA as the biggest
beneficiary for structurally higher domestic prices. Based on our
estimates, every 1% increase in domestic prices will boost PTBA’s
earnings by 1%/0.8% in 2008/2009E.
Most attractively valued on EV/t (reserves) basis of US$3 as
compared with Bumi’s US$10 and highest among our coverage –
SAR’s US$67.
Catalysts
1) We believe that the smooth and timely advancement in the key
milestones of its railway capacity expansion plans should boost
investor confidence that its growth plans are intact (Exhibit 25
shows the railway capacity increase of PTBA); 2) announcement on
domestic price increase over the next few quarters.
Valuation
We believe that the DCF methodology is the most appropriate
valuation method for TB Bukit Asam as value of the company will
only be realized in the longer term with the ramp up in railway
capacity. Our 12-month target price of Rp 20,500 translates to 13X
FY2009E P/E versus its historical trading range of 6X-16X.
Key risks
1) Construction and financing risks; 2) weaker-than-expected
increase in domestic prices; 3) delay or cancellation of the
10,000MW Fast Track Program; and 4) restructuring of the mining
state-owned enterprises.
Key Data CurrentPrice (Rp) 14,650
12 months Price target (Rp) 20,500
Market cap (Rp bn /US$ mn) 33,755,531.6 / 3,625.7
12/07 12/08E 12/09E 12/10EEPS (Rp) 330 902 1,585 1,674
EPS growth (%) 56 173 76 6
EPS (dil) (Rp) 330 902 1,585 1,674
EPS (basic) (Rp) 330 902 1,585 1,674
P/E (X) 12.7 16.3 9.2 8.8
P/B (X) 3.5 7.5 4.7 3.7
EV/EBITDA (X) 7.4 9.9 5.4 4.9
Dividend yield (%) 1.1 3.1 5.4 5.7
ROE (%) 29.9 56.9 62.9 47.5
Price performance chart
Share price performace (%) 3 Month 6 Month 12 MonthAbsolute 42.9 24.7 130.7
Rel. to Jakarta SE Composite - Index 45.4 43.3 100.9
0
2,000
4,000
6,000
8,000
10,000
12,000
14,000
16,000
18,000
Jun 07 Sep 07 Dec 07 Mar 08 Jun 081,000
1,200
1,400
1,600
1,800
2,000
2,200
2,400
2,600
2,800
3,000
PT Tambang Batubara Bukit Asam (L) Jakarta SE Composite - Index (R)
Source: Company data, Goldman Sachs Research estimates.
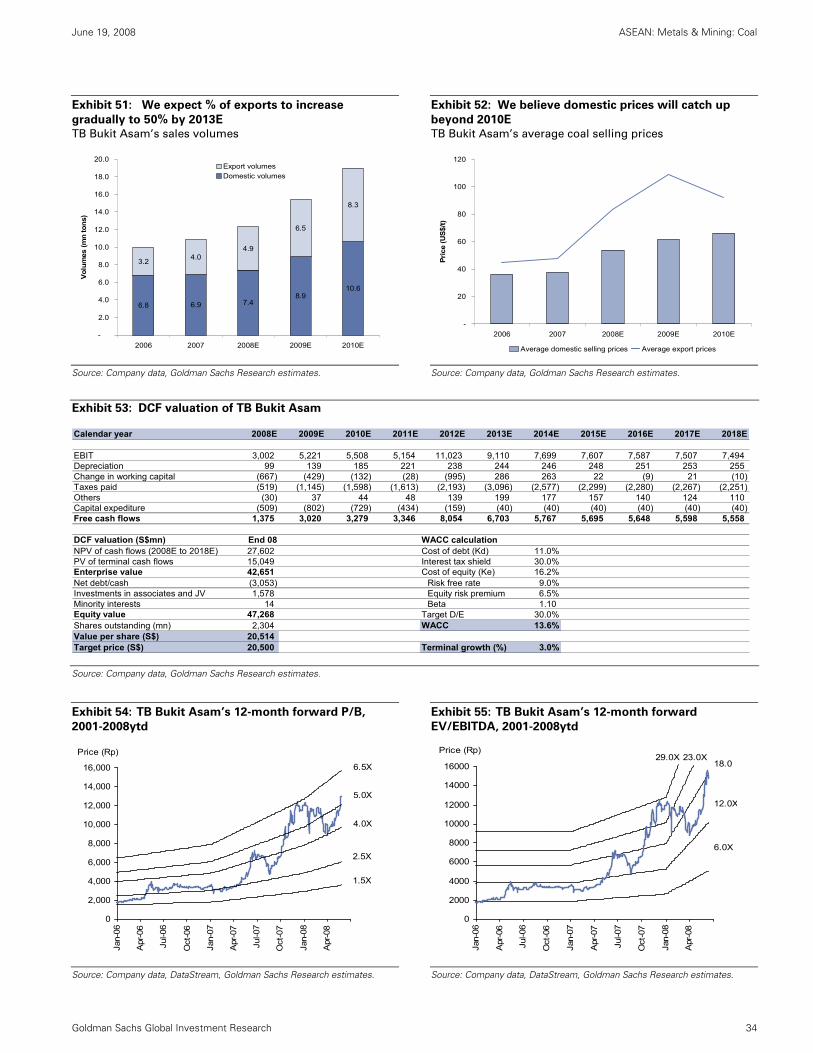
June 19, 2008 ASEAN: Metals & Mining: Coal
Goldman Sachs Global Investment Research 34
Exhibit 51: We expect % of exports to increase
gradually to 50% by 2013E
TB Bukit Asam’s sales volumes
Exhibit 52: We believe domestic prices will catch up
beyond 2010E
TB Bukit Asam’s average coal selling prices
6.8 6.9 7.48.9
10.6
3.2 4.04.9
6.5
8.3
-
2.0
4.0
6.0
8.0
10.0
12.0
14.0
16.0
18.0
20.0
2006 2007 2008E 2009E 2010E
Volu
mes
(mn
tons
)
Export volumesDomestic volumes
-
20
40
60
80
100
120
2006 2007 2008E 2009E 2010E
Pric
e (U
S$/t)
Average domestic selling prices Average export prices
Source: Company data, Goldman Sachs Research estimates.
Source: Company data, Goldman Sachs Research estimates.
Exhibit 53: DCF valuation of TB Bukit Asam
Calendar year 2008E 2009E 2010E 2011E 2012E 2013E 2014E 2015E 2016E 2017E 2018E0 1 2 3 4 5 6 7 8 9 10
EBIT 3,002 5,221 5,508 5,154 11,023 9,110 7,699 7,607 7,587 7,507 7,494 Depreciation 99 139 185 221 238 244 246 248 251 253 255 Change in working capital (667) (429) (132) (28) (995) 286 263 22 (9) 21 (10) Taxes paid (519) (1,145) (1,598) (1,613) (2,193) (3,096) (2,577) (2,299) (2,280) (2,267) (2,251) Others (30) 37 44 48 139 199 177 157 140 124 110 Capital expediture (509) (802) (729) (434) (159) (40) (40) (40) (40) (40) (40) Free cash flows 1,375 3,020 3,279 3,346 8,054 6,703 5,767 5,695 5,648 5,598 5,558
1 3DCF valuation (S$mn) End 08 WACC calculation NPV of cash flows (2008E to 2018E) 27,602 Cost of debt (Kd) 11.0%PV of terminal cash flows 15,049 Interest tax shield 30.0%Enterprise value 42,651 Cost of equity (Ke) 16.2%Net debt/cash (3,053) Risk free rate 9.0%Investments in associates and JV 1,578 Equity risk premium 6.5%Minority interests 14 Beta 1.10 Equity value 47,268 Target D/E 30.0%Shares outstanding (mn) 2,304 WACC 13.6%Value per share (S$) 20,514 Target price (S$) 20,500 Terminal growth (%) 3.0%
Source: Company data, Goldman Sachs Research estimates.
Exhibit 54: TB Bukit Asam’s 12-month forward P/B,
2001-2008ytd
Exhibit 55: TB Bukit Asam’s 12-month forward
EV/EBITDA, 2001-2008ytd
0
2,000
4,000
6,000
8,000
10,000
12,000
14,000
16,000
Jan-
06
Apr
-06
Jul-0
6
Oct
-06
Jan-
07
Apr
-07
Jul-0
7
Oct
-07
Jan-
08
Apr
-08
Price (Rp)
1.5X
6.5X
5.0X
4.0X
2.5X
0
2000
4000
6000
8000
10000
12000
14000
16000
Jan-
06
Apr
-06
Jul-0
6
Oct
-06
Jan-
07
Apr
-07
Jul-0
7
Oct
-07
Jan-
08
Apr
-08
12.0X
Price (Rp)23.0X29.0X
18.0
6.0X
Source: Company data, DataStream, Goldman Sachs Research estimates.
Source: Company data, DataStream, Goldman Sachs Research estimates.
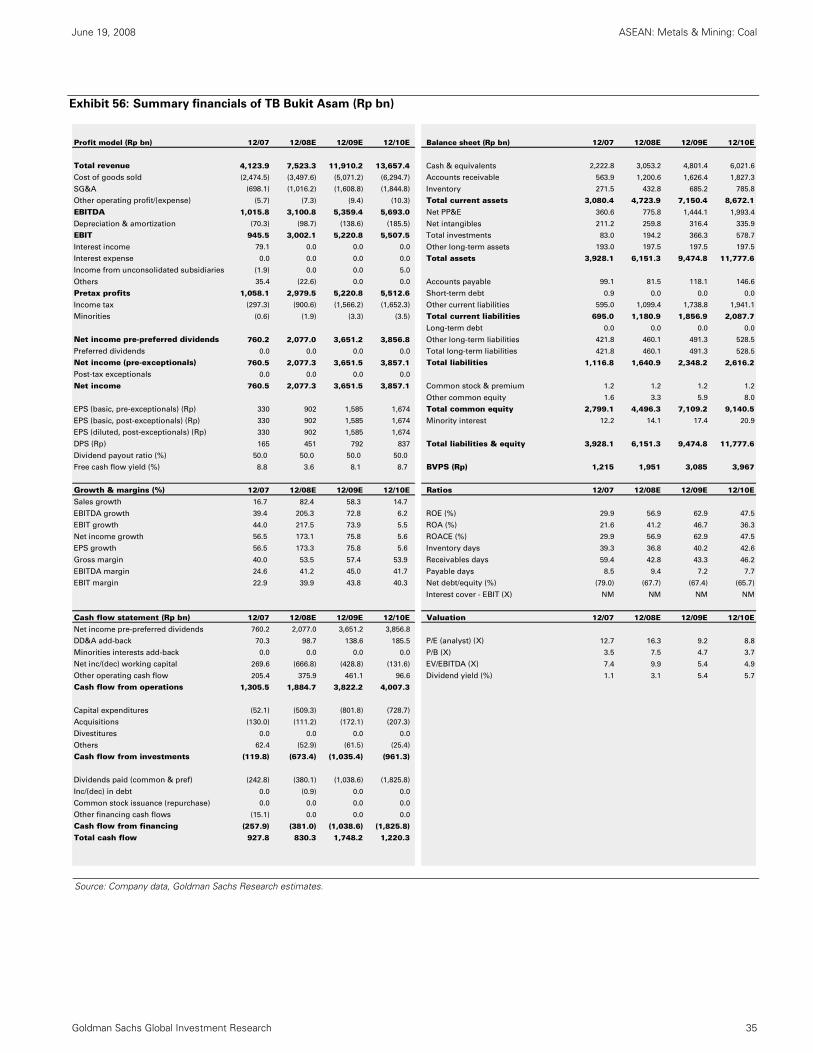
June 19, 2008 ASEAN: Metals & Mining: Coal
Goldman Sachs Global Investment Research 35
Exhibit 56: Summary financials of TB Bukit Asam (Rp bn)
Profit model (Rp bn) 12/07 12/08E 12/09E 12/10E Balance sheet (Rp bn) 12/07 12/08E 12/09E 12/10E
Total revenue 4,123.9 7,523.3 11,910.2 13,657.4 Cash & equivalents 2,222.8 3,053.2 4,801.4 6,021.6
Cost of goods sold (2,474.5) (3,497.6) (5,071.2) (6,294.7) Accounts receivable 563.9 1,200.6 1,626.4 1,827.3
SG&A (698.1) (1,016.2) (1,608.8) (1,844.8) Inventory 271.5 432.8 685.2 785.8
Other operating profit/(expense) (5.7) (7.3) (9.4) (10.3) Total current assets 3,080.4 4,723.9 7,150.4 8,672.1
EBITDA 1,015.8 3,100.8 5,359.4 5,693.0 Net PP&E 360.6 775.8 1,444.1 1,993.4
Depreciation & amortization (70.3) (98.7) (138.6) (185.5) Net intangibles 211.2 259.8 316.4 335.9
EBIT 945.5 3,002.1 5,220.8 5,507.5 Total investments 83.0 194.2 366.3 578.7
Interest income 79.1 0.0 0.0 0.0 Other long-term assets 193.0 197.5 197.5 197.5
Interest expense 0.0 0.0 0.0 0.0 Total assets 3,928.1 6,151.3 9,474.8 11,777.6
Income from unconsolidated subsidiaries (1.9) 0.0 0.0 5.0
Others 35.4 (22.6) 0.0 0.0 Accounts payable 99.1 81.5 118.1 146.6
Pretax profits 1,058.1 2,979.5 5,220.8 5,512.6 Short-term debt 0.9 0.0 0.0 0.0
Income tax (297.3) (900.6) (1,566.2) (1,652.3) Other current liabilities 595.0 1,099.4 1,738.8 1,941.1
Minorities (0.6) (1.9) (3.3) (3.5) Total current liabilities 695.0 1,180.9 1,856.9 2,087.7
Long-term debt 0.0 0.0 0.0 0.0
Net income pre-preferred dividends 760.2 2,077.0 3,651.2 3,856.8 Other long-term liabilities 421.8 460.1 491.3 528.5
Preferred dividends 0.0 0.0 0.0 0.0 Total long-term liabilities 421.8 460.1 491.3 528.5
Net income (pre-exceptionals) 760.5 2,077.3 3,651.5 3,857.1 Total liabilities 1,116.8 1,640.9 2,348.2 2,616.2
Post-tax exceptionals 0.0 0.0 0.0 0.0
Net income 760.5 2,077.3 3,651.5 3,857.1 Common stock & premium 1.2 1.2 1.2 1.2
Other common equity 1.6 3.3 5.9 8.0
EPS (basic, pre-exceptionals) (Rp) 330 902 1,585 1,674 Total common equity 2,799.1 4,496.3 7,109.2 9,140.5
EPS (basic, post-exceptionals) (Rp) 330 902 1,585 1,674 Minority interest 12.2 14.1 17.4 20.9
EPS (diluted, post-exceptionals) (Rp) 330 902 1,585 1,674
DPS (Rp) 165 451 792 837 Total liabilities & equity 3,928.1 6,151.3 9,474.8 11,777.6
Dividend payout ratio (%) 50.0 50.0 50.0 50.0
Free cash flow yield (%) 8.8 3.6 8.1 8.7 BVPS (Rp) 1,215 1,951 3,085 3,967
Growth & margins (%) 12/07 12/08E 12/09E 12/10E Ratios 12/07 12/08E 12/09E 12/10E
Sales growth 16.7 82.4 58.3 14.7
EBITDA growth 39.4 205.3 72.8 6.2 ROE (%) 29.9 56.9 62.9 47.5
EBIT growth 44.0 217.5 73.9 5.5 ROA (%) 21.6 41.2 46.7 36.3
Net income growth 56.5 173.1 75.8 5.6 ROACE (%) 29.9 56.9 62.9 47.5
EPS growth 56.5 173.3 75.8 5.6 Inventory days 39.3 36.8 40.2 42.6
Gross margin 40.0 53.5 57.4 53.9 Receivables days 59.4 42.8 43.3 46.2
EBITDA margin 24.6 41.2 45.0 41.7 Payable days 8.5 9.4 7.2 7.7
EBIT margin 22.9 39.9 43.8 40.3 Net debt/equity (%) (79.0) (67.7) (67.4) (65.7)
Interest cover - EBIT (X) NM NM NM NM
Cash flow statement (Rp bn) 12/07 12/08E 12/09E 12/10E Valuation 12/07 12/08E 12/09E 12/10E
Net income pre-preferred dividends 760.2 2,077.0 3,651.2 3,856.8
DD&A add-back 70.3 98.7 138.6 185.5 P/E (analyst) (X) 12.7 16.3 9.2 8.8
Minorities interests add-back 0.0 0.0 0.0 0.0 P/B (X) 3.5 7.5 4.7 3.7
Net inc/(dec) working capital 269.6 (666.8) (428.8) (131.6) EV/EBITDA (X) 7.4 9.9 5.4 4.9
Other operating cash flow 205.4 375.9 461.1 96.6 Dividend yield (%) 1.1 3.1 5.4 5.7
Cash flow from operations 1,305.5 1,884.7 3,822.2 4,007.3
Capital expenditures (52.1) (509.3) (801.8) (728.7)
Acquisitions (130.0) (111.2) (172.1) (207.3)
Divestitures 0.0 0.0 0.0 0.0
Others 62.4 (52.9) (61.5) (25.4)
Cash flow from investments (119.8) (673.4) (1,035.4) (961.3)
Dividends paid (common & pref) (242.8) (380.1) (1,038.6) (1,825.8)
Inc/(dec) in debt 0.0 (0.9) 0.0 0.0
Common stock issuance (repurchase) 0.0 0.0 0.0 0.0
Other financing cash flows (15.1) 0.0 0.0 0.0
Cash flow from financing (257.9) (381.0) (1,038.6) (1,825.8)
Total cash flow 927.8 830.3 1,748.2 1,220.3
Source: Company data, Goldman Sachs Research estimates.
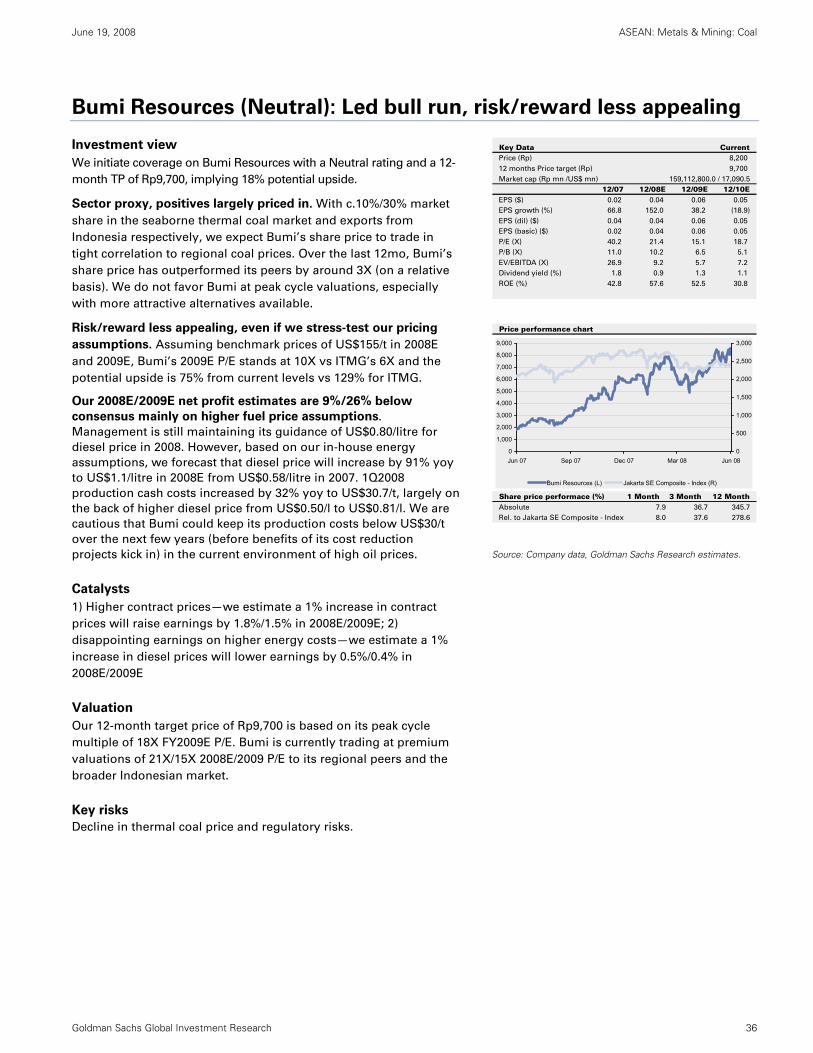
June 19, 2008 ASEAN: Metals & Mining: Coal
Goldman Sachs Global Investment Research 36
Bumi Resources (Neutral): Led bull run, risk/reward less appealing
Investment view
We initiate coverage on Bumi Resources with a Neutral rating and a 12-
month TP of Rp9,700, implying 18% potential upside.
Sector proxy, positives largely priced in. With c.10%/30% market
share in the seaborne thermal coal market and exports from
Indonesia respectively, we expect Bumi’s share price to trade in
tight correlation to regional coal prices. Over the last 12mo, Bumi’s
share price has outperformed its peers by around 3X (on a relative
basis). We do not favor Bumi at peak cycle valuations, especially
with more attractive alternatives available.
Risk/reward less appealing, even if we stress-test our pricing
assumptions. Assuming benchmark prices of US$155/t in 2008E
and 2009E, Bumi’s 2009E P/E stands at 10X vs ITMG’s 6X and the
potential upside is 75% from current levels vs 129% for ITMG.
Our 2008E/2009E net profit estimates are 9%/26% below
consensus mainly on higher fuel price assumptions.
Management is still maintaining its guidance of US$0.80/litre for
diesel price in 2008. However, based on our in-house energy
assumptions, we forecast that diesel price will increase by 91% yoy
to US$1.1/litre in 2008E from US$0.58/litre in 2007. 1Q2008
production cash costs increased by 32% yoy to US$30.7/t, largely on
the back of higher diesel price from US$0.50/l to US$0.81/l. We are
cautious that Bumi could keep its production costs below US$30/t
over the next few years (before benefits of its cost reduction
projects kick in) in the current environment of high oil prices.
Catalysts
1) Higher contract prices—we estimate a 1% increase in contract
prices will raise earnings by 1.8%/1.5% in 2008E/2009E; 2)
disappointing earnings on higher energy costs—we estimate a 1%
increase in diesel prices will lower earnings by 0.5%/0.4% in
2008E/2009E
Valuation
Our 12-month target price of Rp9,700 is based on its peak cycle
multiple of 18X FY2009E P/E. Bumi is currently trading at premium
valuations of 21X/15X 2008E/2009 P/E to its regional peers and the
broader Indonesian market.
Key risks
Decline in thermal coal price and regulatory risks.
Key Data CurrentPrice (Rp) 8,200
12 months Price target (Rp) 9,700
Market cap (Rp mn /US$ mn) 159,112,800.0 / 17,090.5
12/07 12/08E 12/09E 12/10EEPS ($) 0.02 0.04 0.06 0.05
EPS growth (%) 66.8 152.0 38.2 (18.9)
EPS (dil) ($) 0.04 0.04 0.06 0.05
EPS (basic) ($) 0.02 0.04 0.06 0.05
P/E (X) 40.2 21.4 15.1 18.7
P/B (X) 11.0 10.2 6.5 5.1
EV/EBITDA (X) 26.9 9.2 5.7 7.2
Dividend yield (%) 1.8 0.9 1.3 1.1
ROE (%) 42.8 57.6 52.5 30.8
Price performance chart
Share price performace (%) 1 Month 3 Month 12 MonthAbsolute 7.9 36.7 345.7
Rel. to Jakarta SE Composite - Index 8.0 37.6 278.6
0
1,000
2,000
3,000
4,000
5,000
6,000
7,000
8,000
9,000
Jun 07 Sep 07 Dec 07 Mar 08 Jun 080
500
1,000
1,500
2,000
2,500
3,000
Bumi Resources (L) Jakarta SE Composite - Index (R)
Source: Company data, Goldman Sachs Research estimates.
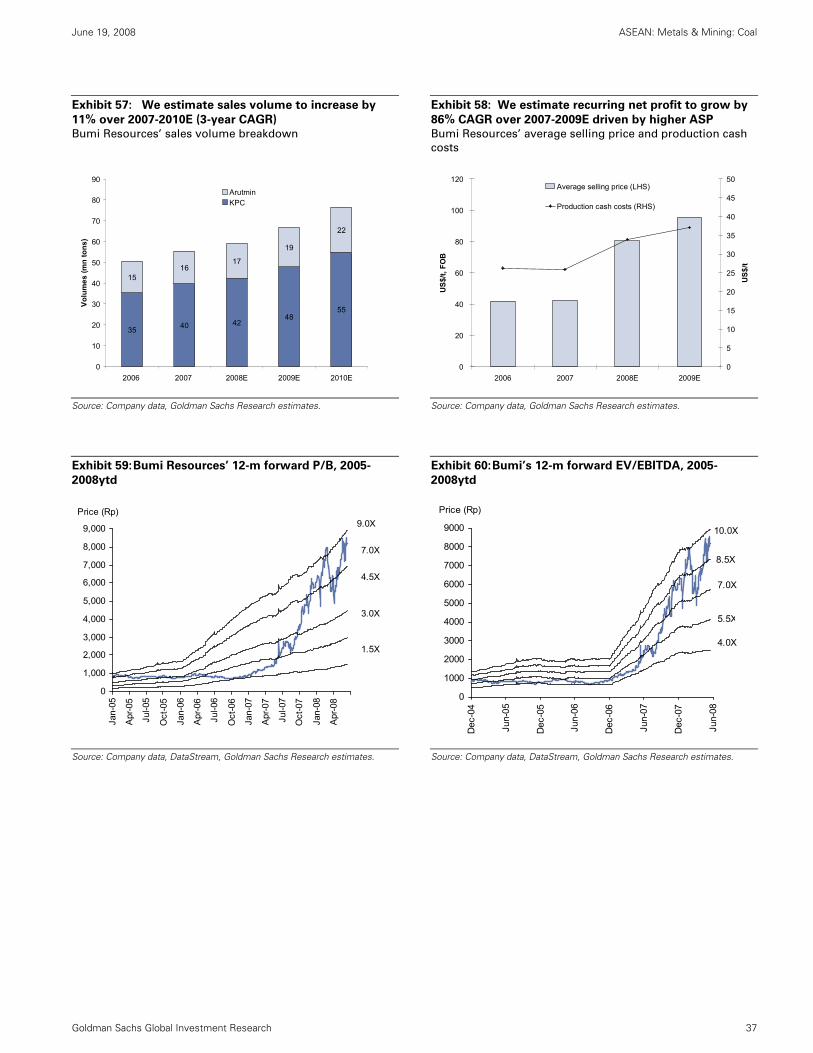
June 19, 2008 ASEAN: Metals & Mining: Coal
Goldman Sachs Global Investment Research 37
Exhibit 57: We estimate sales volume to increase by
11% over 2007-2010E (3-year CAGR)
Bumi Resources’ sales volume breakdown
Exhibit 58: We estimate recurring net profit to grow by
86% CAGR over 2007-2009E driven by higher ASP
Bumi Resources’ average selling price and production cash
costs
35 40 4248
55
1516
17
19
22
0
10
20
30
40
50
60
70
80
90
2006 2007 2008E 2009E 2010E
Volu
mes
(mn
tons
)
ArutminKPC
0
20
40
60
80
100
120
2006 2007 2008E 2009E
US$
/t, F
OB
0
5
10
15
20
25
30
35
40
45
50
US$
/t
Average selling price (LHS)
Production cash costs (RHS)
Source: Company data, Goldman Sachs Research estimates.
Source: Company data, Goldman Sachs Research estimates.
Exhibit 59: Bumi Resources’ 12-m forward P/B, 2005-
2008ytd
Exhibit 60: Bumi’s 12-m forward EV/EBITDA, 2005-
2008ytd
0
1,000
2,000
3,000
4,000
5,000
6,000
7,000
8,000
9,000
Jan-
05
Apr
-05
Jul-0
5
Oct
-05
Jan-
06
Apr
-06
Jul-0
6
Oct
-06
Jan-
07
Apr
-07
Jul-0
7
Oct
-07
Jan-
08
Apr
-08
Price (Rp)
1.5X
9.0X
7.0X
4.5X
3.0X
0
1000
2000
3000
4000
5000
6000
7000
8000
9000
Dec
-04
Jun-
05
Dec
-05
Jun-
06
Dec
-06
Jun-
07
Dec
-07
Jun-
08
5.5X
Price (Rp)
8.5X
10.0X
7.0X
4.0X
Source: Company data, DataStream, Goldman Sachs Research estimates.
Source: Company data, DataStream, Goldman Sachs Research estimates.
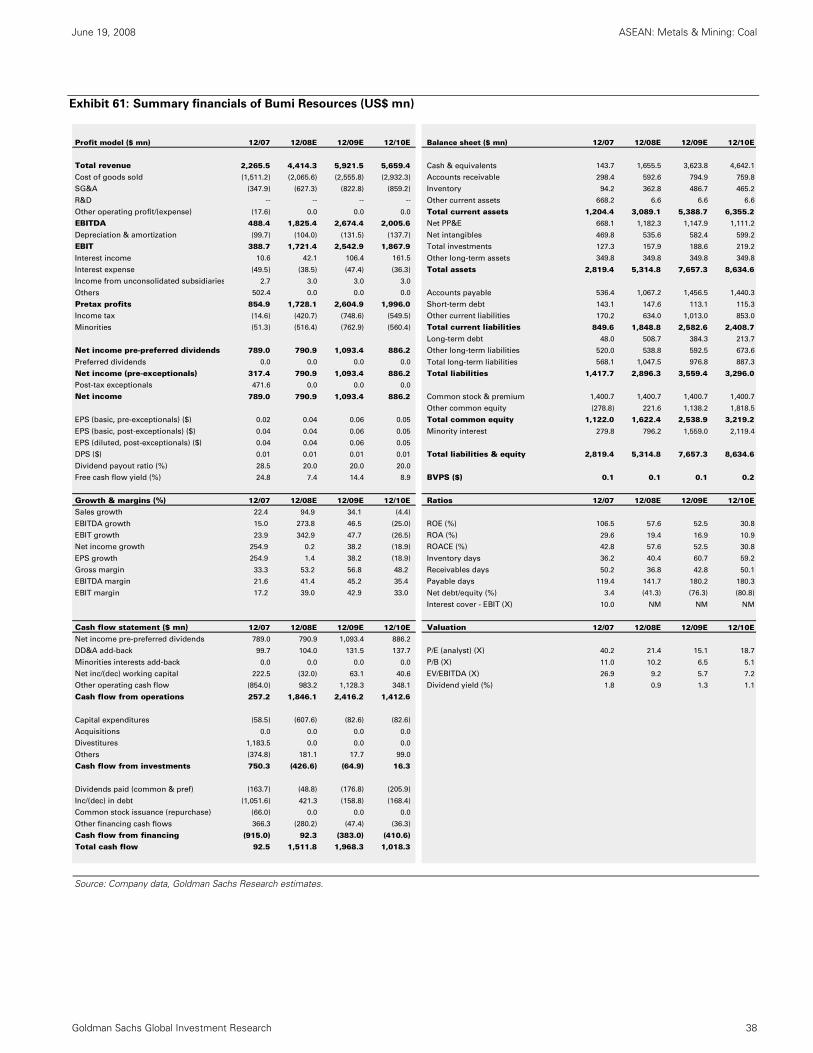
June 19, 2008 ASEAN: Metals & Mining: Coal
Goldman Sachs Global Investment Research 38
Exhibit 61: Summary financials of Bumi Resources (US$ mn)
Profit model ($ mn) 12/07 12/08E 12/09E 12/10E Balance sheet ($ mn) 12/07 12/08E 12/09E 12/10E
Total revenue 2,265.5 4,414.3 5,921.5 5,659.4 Cash & equivalents 143.7 1,655.5 3,623.8 4,642.1
Cost of goods sold (1,511.2) (2,065.6) (2,555.8) (2,932.3) Accounts receivable 298.4 592.6 794.9 759.8
SG&A (347.9) (627.3) (822.8) (859.2) Inventory 94.2 362.8 486.7 465.2
R&D -- -- -- -- Other current assets 668.2 6.6 6.6 6.6
Other operating profit/(expense) (17.6) 0.0 0.0 0.0 Total current assets 1,204.4 3,089.1 5,388.7 6,355.2
EBITDA 488.4 1,825.4 2,674.4 2,005.6 Net PP&E 668.1 1,182.3 1,147.9 1,111.2
Depreciation & amortization (99.7) (104.0) (131.5) (137.7) Net intangibles 469.8 535.6 582.4 599.2
EBIT 388.7 1,721.4 2,542.9 1,867.9 Total investments 127.3 157.9 188.6 219.2
Interest income 10.6 42.1 106.4 161.5 Other long-term assets 349.8 349.8 349.8 349.8
Interest expense (49.5) (38.5) (47.4) (36.3) Total assets 2,819.4 5,314.8 7,657.3 8,634.6
Income from unconsolidated subsidiaries 2.7 3.0 3.0 3.0
Others 502.4 0.0 0.0 0.0 Accounts payable 536.4 1,067.2 1,456.5 1,440.3
Pretax profits 854.9 1,728.1 2,604.9 1,996.0 Short-term debt 143.1 147.6 113.1 115.3
Income tax (14.6) (420.7) (748.6) (549.5) Other current liabilities 170.2 634.0 1,013.0 853.0
Minorities (51.3) (516.4) (762.9) (560.4) Total current liabilities 849.6 1,848.8 2,582.6 2,408.7
Long-term debt 48.0 508.7 384.3 213.7
Net income pre-preferred dividends 789.0 790.9 1,093.4 886.2 Other long-term liabilities 520.0 538.8 592.5 673.6
Preferred dividends 0.0 0.0 0.0 0.0 Total long-term liabilities 568.1 1,047.5 976.8 887.3
Net income (pre-exceptionals) 317.4 790.9 1,093.4 886.2 Total liabilities 1,417.7 2,896.3 3,559.4 3,296.0
Post-tax exceptionals 471.6 0.0 0.0 0.0
Net income 789.0 790.9 1,093.4 886.2 Common stock & premium 1,400.7 1,400.7 1,400.7 1,400.7
Other common equity (278.8) 221.6 1,138.2 1,818.5
EPS (basic, pre-exceptionals) ($) 0.02 0.04 0.06 0.05 Total common equity 1,122.0 1,622.4 2,538.9 3,219.2
EPS (basic, post-exceptionals) ($) 0.04 0.04 0.06 0.05 Minority interest 279.8 796.2 1,559.0 2,119.4
EPS (diluted, post-exceptionals) ($) 0.04 0.04 0.06 0.05
DPS ($) 0.01 0.01 0.01 0.01 Total liabilities & equity 2,819.4 5,314.8 7,657.3 8,634.6
Dividend payout ratio (%) 28.5 20.0 20.0 20.0
Free cash flow yield (%) 24.8 7.4 14.4 8.9 BVPS ($) 0.1 0.1 0.1 0.2
Growth & margins (%) 12/07 12/08E 12/09E 12/10E Ratios 12/07 12/08E 12/09E 12/10E
Sales growth 22.4 94.9 34.1 (4.4)
EBITDA growth 15.0 273.8 46.5 (25.0) ROE (%) 106.5 57.6 52.5 30.8
EBIT growth 23.9 342.9 47.7 (26.5) ROA (%) 29.6 19.4 16.9 10.9
Net income growth 254.9 0.2 38.2 (18.9) ROACE (%) 42.8 57.6 52.5 30.8
EPS growth 254.9 1.4 38.2 (18.9) Inventory days 36.2 40.4 60.7 59.2
Gross margin 33.3 53.2 56.8 48.2 Receivables days 50.2 36.8 42.8 50.1
EBITDA margin 21.6 41.4 45.2 35.4 Payable days 119.4 141.7 180.2 180.3
EBIT margin 17.2 39.0 42.9 33.0 Net debt/equity (%) 3.4 (41.3) (76.3) (80.8)
Interest cover - EBIT (X) 10.0 NM NM NM
Cash flow statement ($ mn) 12/07 12/08E 12/09E 12/10E Valuation 12/07 12/08E 12/09E 12/10E
Net income pre-preferred dividends 789.0 790.9 1,093.4 886.2
DD&A add-back 99.7 104.0 131.5 137.7 P/E (analyst) (X) 40.2 21.4 15.1 18.7
Minorities interests add-back 0.0 0.0 0.0 0.0 P/B (X) 11.0 10.2 6.5 5.1
Net inc/(dec) working capital 222.5 (32.0) 63.1 40.6 EV/EBITDA (X) 26.9 9.2 5.7 7.2
Other operating cash flow (854.0) 983.2 1,128.3 348.1 Dividend yield (%) 1.8 0.9 1.3 1.1
Cash flow from operations 257.2 1,846.1 2,416.2 1,412.6
Capital expenditures (58.5) (607.6) (82.6) (82.6)
Acquisitions 0.0 0.0 0.0 0.0
Divestitures 1,183.5 0.0 0.0 0.0
Others (374.8) 181.1 17.7 99.0
Cash flow from investments 750.3 (426.6) (64.9) 16.3
Dividends paid (common & pref) (163.7) (48.8) (176.8) (205.9)
Inc/(dec) in debt (1,051.6) 421.3 (158.8) (168.4)
Common stock issuance (repurchase) (66.0) 0.0 0.0 0.0
Other financing cash flows 366.3 (280.2) (47.4) (36.3)
Cash flow from financing (915.0) 92.3 (383.0) (410.6)
Total cash flow 92.5 1,511.8 1,968.3 1,018.3
Source: Company data, Goldman Sachs Research estimates.
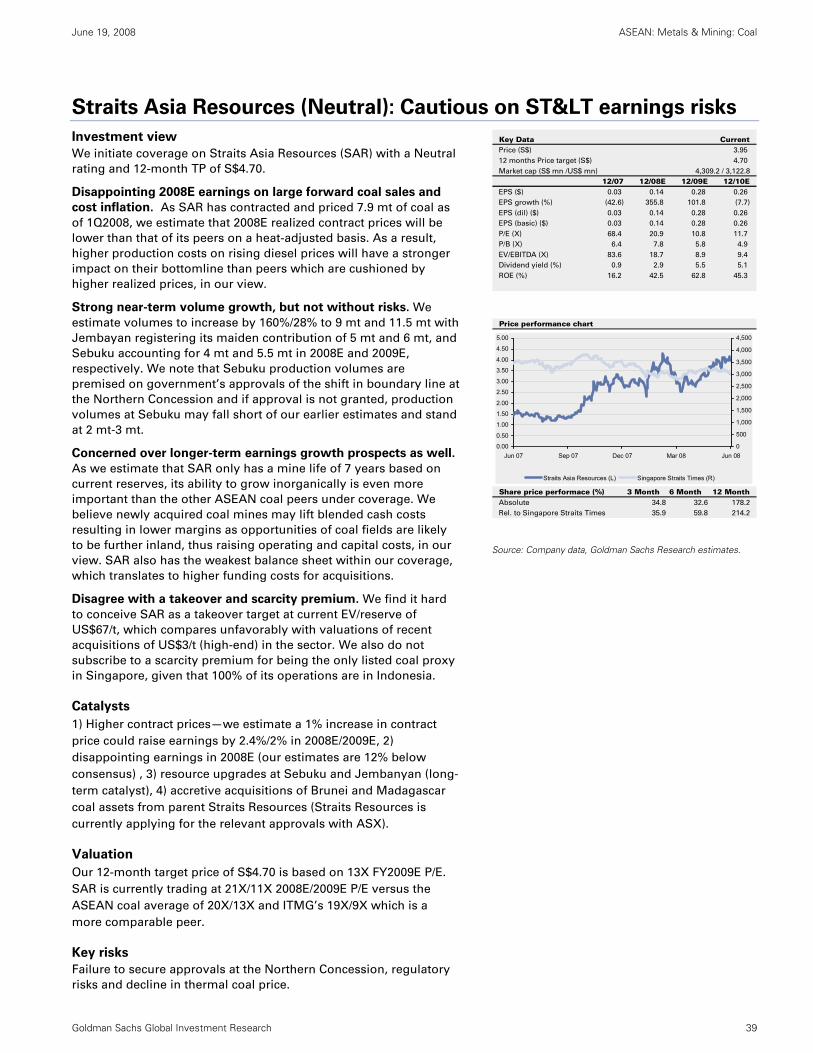
June 19, 2008 ASEAN: Metals & Mining: Coal
Goldman Sachs Global Investment Research 39
Straits Asia Resources (Neutral): Cautious on ST< earnings risks
Investment view
We initiate coverage on Straits Asia Resources (SAR) with a Neutral
rating and 12-month TP of S$4.70.
Disappointing 2008E earnings on large forward coal sales and
cost inflation. As SAR has contracted and priced 7.9 mt of coal as
of 1Q2008, we estimate that 2008E realized contract prices will be
lower than that of its peers on a heat-adjusted basis. As a result,
higher production costs on rising diesel prices will have a stronger
impact on their bottomline than peers which are cushioned by
higher realized prices, in our view.
Strong near-term volume growth, but not without risks. We
estimate volumes to increase by 160%/28% to 9 mt and 11.5 mt with
Jembayan registering its maiden contribution of 5 mt and 6 mt, and
Sebuku accounting for 4 mt and 5.5 mt in 2008E and 2009E,
respectively. We note that Sebuku production volumes are
premised on government’s approvals of the shift in boundary line at
the Northern Concession and if approval is not granted, production
volumes at Sebuku may fall short of our earlier estimates and stand
at 2 mt-3 mt.
Concerned over longer-term earnings growth prospects as well.
As we estimate that SAR only has a mine life of 7 years based on
current reserves, its ability to grow inorganically is even more
important than the other ASEAN coal peers under coverage. We
believe newly acquired coal mines may lift blended cash costs
resulting in lower margins as opportunities of coal fields are likely
to be further inland, thus raising operating and capital costs, in our
view. SAR also has the weakest balance sheet within our coverage,
which translates to higher funding costs for acquisitions.
Disagree with a takeover and scarcity premium. We find it hard
to conceive SAR as a takeover target at current EV/reserve of
US$67/t, which compares unfavorably with valuations of recent
acquisitions of US$3/t (high-end) in the sector. We also do not
subscribe to a scarcity premium for being the only listed coal proxy
in Singapore, given that 100% of its operations are in Indonesia.
Catalysts
1) Higher contract prices—we estimate a 1% increase in contract
price could raise earnings by 2.4%/2% in 2008E/2009E, 2)
disappointing earnings in 2008E (our estimates are 12% below
consensus) , 3) resource upgrades at Sebuku and Jembanyan (long-
term catalyst), 4) accretive acquisitions of Brunei and Madagascar
coal assets from parent Straits Resources (Straits Resources is
currently applying for the relevant approvals with ASX).
Valuation
Our 12-month target price of S$4.70 is based on 13X FY2009E P/E.
SAR is currently trading at 21X/11X 2008E/2009E P/E versus the
ASEAN coal average of 20X/13X and ITMG’s 19X/9X which is a
more comparable peer.
Key risks
Failure to secure approvals at the Northern Concession, regulatory
risks and decline in thermal coal price.
Key Data CurrentPrice (S$) 3.95
12 months Price target (S$) 4.70
Market cap (S$ mn /US$ mn) 4,309.2 / 3,122.8
12/07 12/08E 12/09E 12/10EEPS ($) 0.03 0.14 0.28 0.26
EPS growth (%) (42.6) 355.8 101.8 (7.7)
EPS (dil) ($) 0.03 0.14 0.28 0.26
EPS (basic) ($) 0.03 0.14 0.28 0.26
P/E (X) 68.4 20.9 10.8 11.7
P/B (X) 6.4 7.8 5.8 4.9
EV/EBITDA (X) 83.6 18.7 8.9 9.4
Dividend yield (%) 0.9 2.9 5.5 5.1
ROE (%) 16.2 42.5 62.8 45.3
Price performance chart
Share price performace (%) 3 Month 6 Month 12 MonthAbsolute 34.8 32.6 178.2
Rel. to Singapore Straits Times 35.9 59.8 214.2
0.00
0.50
1.00
1.50
2.00
2.50
3.00
3.50
4.00
4.50
5.00
Jun 07 Sep 07 Dec 07 Mar 08 Jun 080
500
1,000
1,500
2,000
2,500
3,000
3,500
4,000
4,500
Straits Asia Resources (L) Singapore Straits Times (R)
Source: Company data, Goldman Sachs Research estimates.
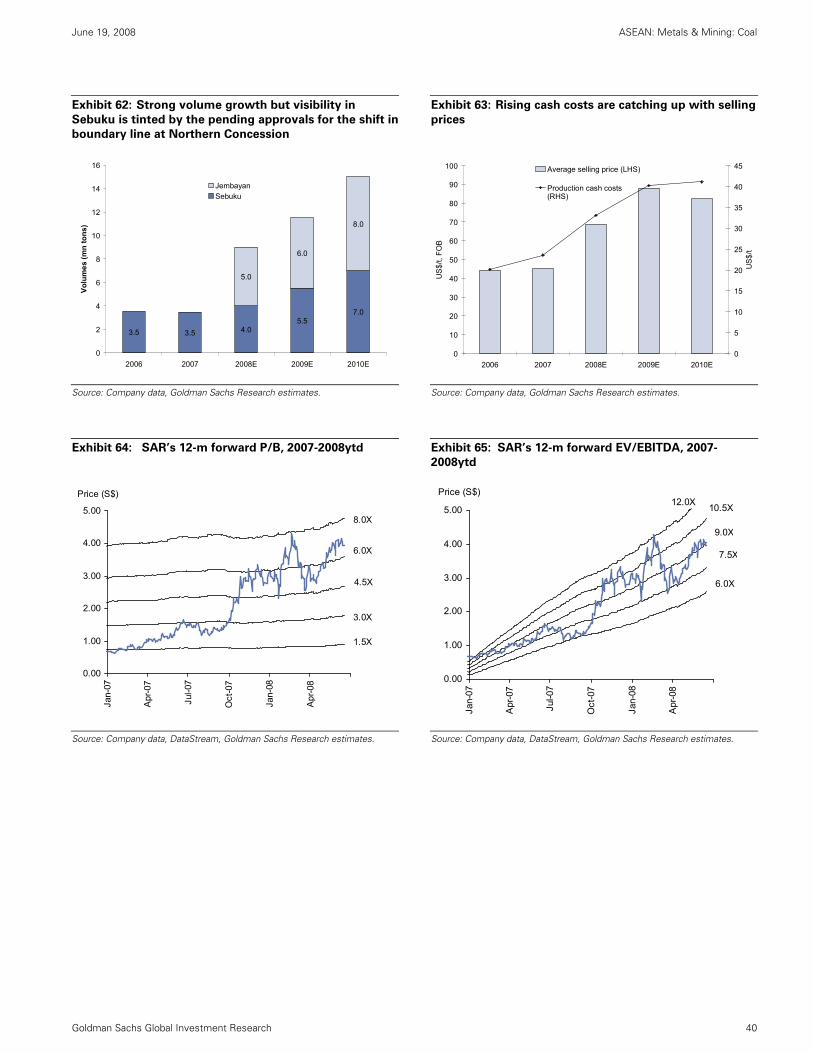
June 19, 2008 ASEAN: Metals & Mining: Coal
Goldman Sachs Global Investment Research 40
Exhibit 62: Strong volume growth but visibility in
Sebuku is tinted by the pending approvals for the shift in
boundary line at Northern Concession
Exhibit 63: Rising cash costs are catching up with selling
prices
3.5 3.5 4.05.5
7.0
5.0
6.0
8.0
0
2
4
6
8
10
12
14
16
2006 2007 2008E 2009E 2010E
Volu
mes
(mn
tons
)
JembayanSebuku
0
10
20
30
40
50
60
70
80
90
100
2006 2007 2008E 2009E 2010E
US
$/t,
FOB
0
5
10
15
20
25
30
35
40
45
US
$/t
Average selling price (LHS)
Production cash costs(RHS)
Source: Company data, Goldman Sachs Research estimates.
Source: Company data, Goldman Sachs Research estimates.
Exhibit 64: SAR’s 12-m forward P/B, 2007-2008ytd Exhibit 65: SAR’s 12-m forward EV/EBITDA, 2007-
2008ytd
0.00
1.00
2.00
3.00
4.00
5.00
Jan-
07
Apr
-07
Jul-0
7
Oct
-07
Jan-
08
Apr
-08
Price (S$)
1.5X
8.0X
6.0X
4.5X
3.0X
0.00
1.00
2.00
3.00
4.00
5.00
Jan-
07
Apr
-07
Jul-0
7
Oct
-07
Jan-
08
Apr
-08
7.5X
Price (S$)
10.5X12.0X
9.0X
6.0X
Source: Company data, DataStream, Goldman Sachs Research estimates.
Source: Company data, DataStream, Goldman Sachs Research estimates.
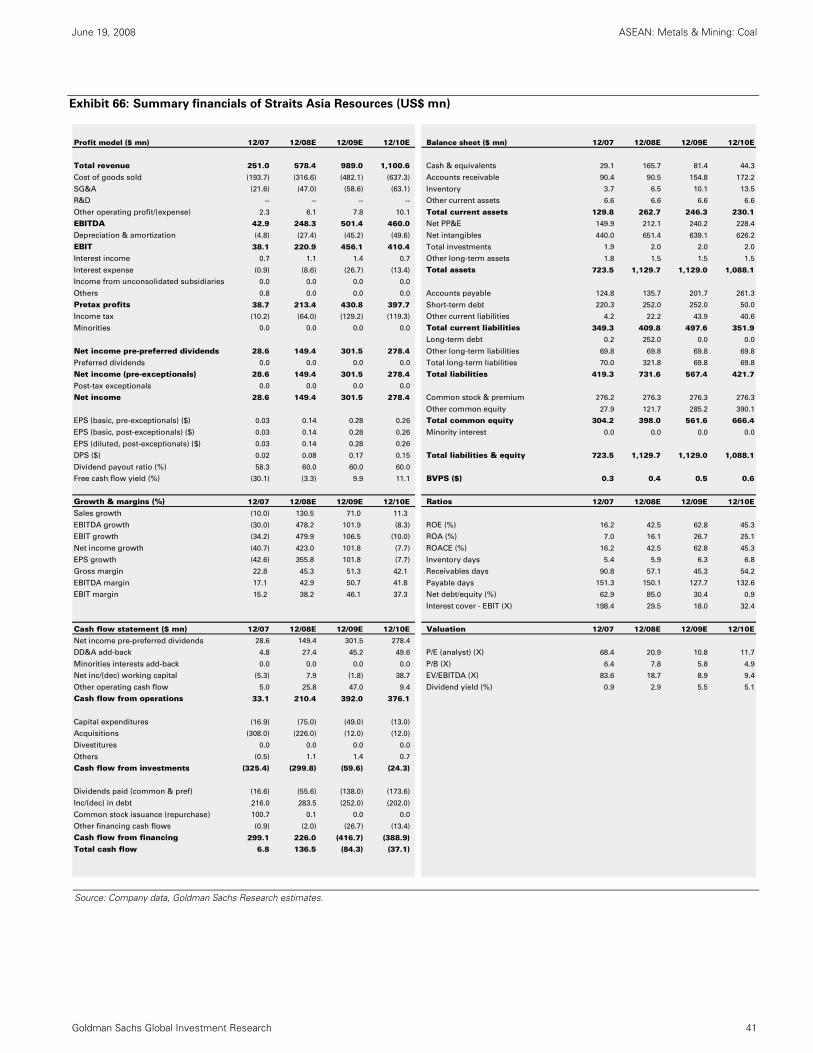
June 19, 2008 ASEAN: Metals & Mining: Coal
Goldman Sachs Global Investment Research 41
Exhibit 66: Summary financials of Straits Asia Resources (US$ mn)
Profit model ($ mn) 12/07 12/08E 12/09E 12/10E Balance sheet ($ mn) 12/07 12/08E 12/09E 12/10E
Total revenue 251.0 578.4 989.0 1,100.6 Cash & equivalents 29.1 165.7 81.4 44.3
Cost of goods sold (193.7) (316.6) (482.1) (637.3) Accounts receivable 90.4 90.5 154.8 172.2
SG&A (21.6) (47.0) (58.6) (63.1) Inventory 3.7 6.5 10.1 13.5
R&D -- -- -- -- Other current assets 6.6 6.6 6.6 6.6
Other operating profit/(expense) 2.3 6.1 7.8 10.1 Total current assets 129.8 262.7 246.3 230.1
EBITDA 42.9 248.3 501.4 460.0 Net PP&E 149.9 212.1 240.2 228.4
Depreciation & amortization (4.8) (27.4) (45.2) (49.6) Net intangibles 440.0 651.4 639.1 626.2
EBIT 38.1 220.9 456.1 410.4 Total investments 1.9 2.0 2.0 2.0
Interest income 0.7 1.1 1.4 0.7 Other long-term assets 1.8 1.5 1.5 1.5
Interest expense (0.9) (8.6) (26.7) (13.4) Total assets 723.5 1,129.7 1,129.0 1,088.1
Income from unconsolidated subsidiaries 0.0 0.0 0.0 0.0
Others 0.8 0.0 0.0 0.0 Accounts payable 124.8 135.7 201.7 261.3
Pretax profits 38.7 213.4 430.8 397.7 Short-term debt 220.3 252.0 252.0 50.0
Income tax (10.2) (64.0) (129.2) (119.3) Other current liabilities 4.2 22.2 43.9 40.6
Minorities 0.0 0.0 0.0 0.0 Total current liabilities 349.3 409.8 497.6 351.9
Long-term debt 0.2 252.0 0.0 0.0
Net income pre-preferred dividends 28.6 149.4 301.5 278.4 Other long-term liabilities 69.8 69.8 69.8 69.8
Preferred dividends 0.0 0.0 0.0 0.0 Total long-term liabilities 70.0 321.8 69.8 69.8
Net income (pre-exceptionals) 28.6 149.4 301.5 278.4 Total liabilities 419.3 731.6 567.4 421.7
Post-tax exceptionals 0.0 0.0 0.0 0.0
Net income 28.6 149.4 301.5 278.4 Common stock & premium 276.2 276.3 276.3 276.3
Other common equity 27.9 121.7 285.2 390.1
EPS (basic, pre-exceptionals) ($) 0.03 0.14 0.28 0.26 Total common equity 304.2 398.0 561.6 666.4
EPS (basic, post-exceptionals) ($) 0.03 0.14 0.28 0.26 Minority interest 0.0 0.0 0.0 0.0
EPS (diluted, post-exceptionals) ($) 0.03 0.14 0.28 0.26
DPS ($) 0.02 0.08 0.17 0.15 Total liabilities & equity 723.5 1,129.7 1,129.0 1,088.1
Dividend payout ratio (%) 58.3 60.0 60.0 60.0
Free cash flow yield (%) (30.1) (3.3) 9.9 11.1 BVPS ($) 0.3 0.4 0.5 0.6
Growth & margins (%) 12/07 12/08E 12/09E 12/10E Ratios 12/07 12/08E 12/09E 12/10E
Sales growth (10.0) 130.5 71.0 11.3
EBITDA growth (30.0) 478.2 101.9 (8.3) ROE (%) 16.2 42.5 62.8 45.3
EBIT growth (34.2) 479.9 106.5 (10.0) ROA (%) 7.0 16.1 26.7 25.1
Net income growth (40.7) 423.0 101.8 (7.7) ROACE (%) 16.2 42.5 62.8 45.3
EPS growth (42.6) 355.8 101.8 (7.7) Inventory days 5.4 5.9 6.3 6.8
Gross margin 22.8 45.3 51.3 42.1 Receivables days 90.8 57.1 45.3 54.2
EBITDA margin 17.1 42.9 50.7 41.8 Payable days 151.3 150.1 127.7 132.6
EBIT margin 15.2 38.2 46.1 37.3 Net debt/equity (%) 62.9 85.0 30.4 0.9
Interest cover - EBIT (X) 198.4 29.5 18.0 32.4
Cash flow statement ($ mn) 12/07 12/08E 12/09E 12/10E Valuation 12/07 12/08E 12/09E 12/10E
Net income pre-preferred dividends 28.6 149.4 301.5 278.4
DD&A add-back 4.8 27.4 45.2 49.6 P/E (analyst) (X) 68.4 20.9 10.8 11.7
Minorities interests add-back 0.0 0.0 0.0 0.0 P/B (X) 6.4 7.8 5.8 4.9
Net inc/(dec) working capital (5.3) 7.9 (1.8) 38.7 EV/EBITDA (X) 83.6 18.7 8.9 9.4
Other operating cash flow 5.0 25.8 47.0 9.4 Dividend yield (%) 0.9 2.9 5.5 5.1
Cash flow from operations 33.1 210.4 392.0 376.1
Capital expenditures (16.9) (75.0) (49.0) (13.0)
Acquisitions (308.0) (226.0) (12.0) (12.0)
Divestitures 0.0 0.0 0.0 0.0
Others (0.5) 1.1 1.4 0.7
Cash flow from investments (325.4) (299.8) (59.6) (24.3)
Dividends paid (common & pref) (16.6) (55.6) (138.0) (173.6)
Inc/(dec) in debt 216.0 283.5 (252.0) (202.0)
Common stock issuance (repurchase) 100.7 0.1 0.0 0.0
Other financing cash flows (0.9) (2.0) (26.7) (13.4)
Cash flow from financing 299.1 226.0 (416.7) (388.9)
Total cash flow 6.8 136.5 (84.3) (37.1)
Source: Company data, Goldman Sachs Research estimates.
June 19, 2008 ASEAN: Metals & Mining: Coal
Goldman Sachs Global Investment Research 42
Other disclosures
Clarkson Research Services Limited (CRSL) have not reviewed the context of any of the
statistics or information contained in the commentaries and all statistics and information
were obtained by Goldman Sachs & Co. from standard CRSL published sources.
Furthermore, CRSL have not carried out any form of due diligence exercise on the
information, as would be the case with finance raising documentation such as Initial Public
Offerings (IPOs) or Bond Placements. Therefore reliance on the statistics and information
contained within the commentaries will be for the risk of the party relying on the
information and CRSL does not accept any liability whatsoever for relying on the statistics
or information.
Insofar as the statistical and graphical market information comes from CRSL, CRSL points
out that such information is drawn from the CRSL database and other sources. CRSL has
advised that: (i) some information in CRSL’s database is derived from estimates or
subjective judgments; and (ii) the information in the database of other maritime data
collection agencies may differ from the information in CRSL’s database; and (iii) whilst
CRSL has taken reasonable care in the compilation of that statistical and graphical
information and believes it to be accurate and correct, data compilation is subject to
limited audit and validation procedures and may accordingly contain errors; and (iv) CRSL,
its agents, officers and employees do not accept liability for any loss suffered in
consequence of reliance on such information or in any other manner; and (v) the provision
of such information does not obviate any need to make appropriate further enquiries; and
(vi) the provision of such information is not an endorsement of any commercial policies
and/or any conclusions by CRSL; and (vii) shipping is a variable and cyclical business and
any forecasting concerning it cannot be very accurate.
June 19, 2008 ASEAN: Metals & Mining: Coal
Goldman Sachs Global Investment Research 43
Reg AC
I, Yoke Fong Chee, hereby certify that all of the views expressed in this report accurately reflect my personal views about the subject company or
companies and its or their securities. I also certify that no part of my compensation was, is or will be, directly or indirectly, related to the specific
recommendations or views expressed in this report.
Investment profile
The Goldman Sachs Investment Profile provides investment context for a security by comparing key attributes of that security to its peer group and
market. The four key attributes depicted are: growth, returns, multiple and volatility. Growth, returns and multiple are indexed based on composites
of several methodologies to determine the stocks percentile ranking within the region's coverage universe.
The precise calculation of each metric may vary depending on the fiscal year, industry and region but the standard approach is as follows:
Growth is a composite of next year's estimate over current year's estimate, e.g. EPS, EBITDA, Revenue. Return is a year one prospective aggregate
of various return on capital measures, e.g. CROCI, ROACE, and ROE. Multiple is a composite of one-year forward valuation ratios, e.g. P/E, dividend
yield, EV/FCF, EV/EBITDA, EV/DACF, Price/Book. Volatility is measured as trailing twelve-month volatility adjusted for dividends.
Quantum
Quantum is Goldman Sachs' proprietary database providing access to detailed financial statement histories, forecasts and ratios. It can be used for
in-depth analysis of a single company, or to make comparisons between companies in different sectors and markets.
Disclosures
Coverage group(s) of stocks by primary analyst(s)
Yoke Fong Chee: ASEAN, Asia Commodities Companies.
ASEAN: Asiatic Development, Astra Agro Lestari, Astra International, Bangkok Expressway, Bumi Resources, ComfortDelGro, Ezra Holdings, Genting,
Genting International, Holcim Indonesia, Hong Leong Asia, Indocement Tunggal Prakarsa, Indofood Agri Resources, IOI Corporation, Jardine Cycle &
Carriage, Keppel Corp, KNM Group, KS Energy Services, Kuala Lumpur Kepong, London Sumatra Indonesia, PLUS Expressways Berhad, PT Indo
Tambangraya Megah Tbk, PT Indofood, PT Tambang Batubara Bukit Asam, Resorts World Bhd, SapuraCrest Petroleum, Sembcorp Industries,
Sembcorp Marine, Semen Gresik (Persero), Siam Cement, Siam Cement (foreign), Siam City Cement, Sime Darby Bhd, SMRT Corporation, Straits
Asia Resources, Tat Hong Holdings, Wah Seong, Wilmar International, Yongnam Holdings.
Asia Commodities Companies: Aluminum Corporation of China (A), Aluminum Corporation of China (H), Angang Steel (A), Angang Steel (H), Anhui
Conch Cement (A), Anhui Conch Cement (H), Banpu Public Company, Baoshan Iron & Steel, China Coal Energy (A), China Coal Energy (H), China
National Building Material, China Shenhua Energy (A), China Shenhua Energy (H), Hindalco Industries, Hindustan Zinc, Hunan Nonferrous Metals,
Jiangxi Copper (A), Jiangxi Copper (H), Lingbao Gold, Maanshan Iron & Steel (A), Maanshan Iron & Steel (H), National Aluminium Company, Sterlite
Industries (India), Wuhan Iron and Steel, Yanzhou Coal Mining (A), Yanzhou Coal Mining (H), Zhaojin Mining Industry, Zhejiang Glass, Zhongjin Gold,
Zijin Mining.
Company-specific regulatory disclosures
The following disclosures relate to relationships between The Goldman Sachs Group, Inc. (with its affiliates, "Goldman Sachs") and companies
covered by the Global Investment Research Division of Goldman Sachs and referred to in this research.
Goldman Sachs has received compensation for non-investment banking services during the past 12 months: Banpu Public Company (Bt532.00)
Goldman Sachs had a non-investment banking securities-related services client relationship during the past 12 months with: Banpu Public Company
(Bt532.00)
Goldman Sachs had a non-securities services client relationship during the past 12 months with: Banpu Public Company (Bt532.00)
There are no company-specific disclosures for: Bumi Resources (Rp8,050), PT Indo Tambangraya Megah Tbk (Rp33,050), PT Tambang Batubara Bukit
Asam (Rp15,500) and Straits Asia Resources (S$3.76)
Distribution of ratings/investment banking relationships
Goldman Sachs Investment Research global coverage universe
Rating Distribution Investment Banking Relationships
Buy Hold Sell Buy Hold Sell
Global 28% 57% 15% 51% 44% 41%
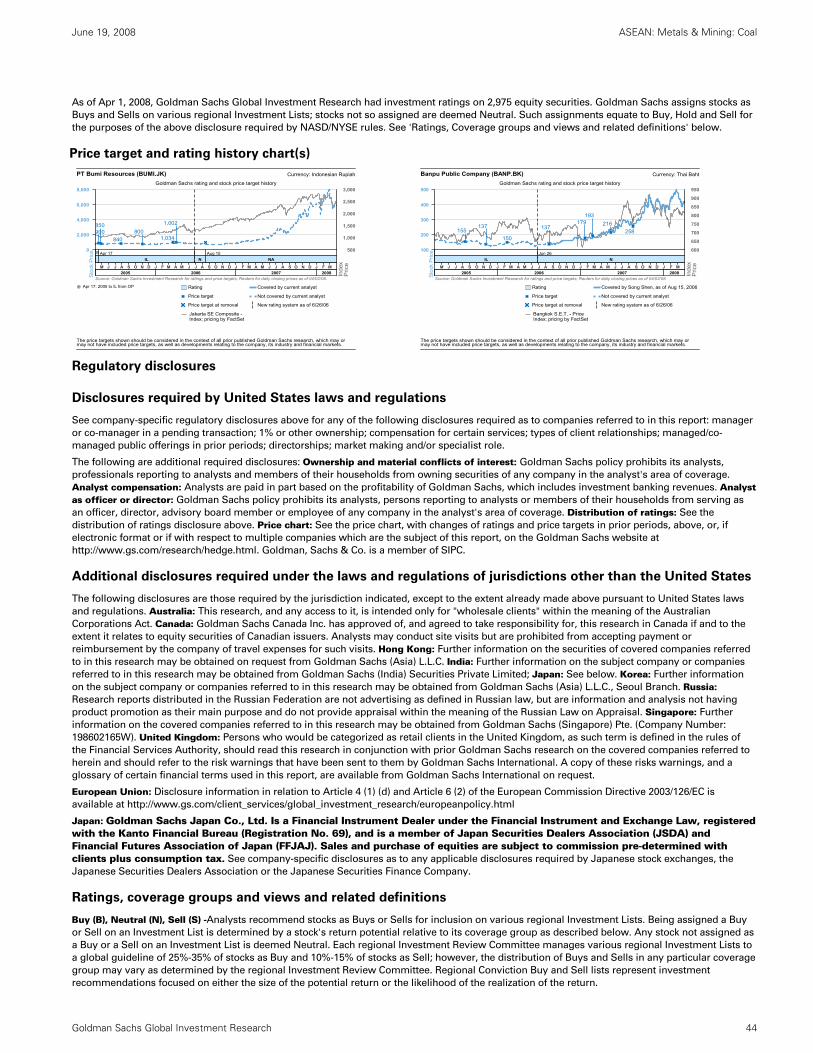
June 19, 2008 ASEAN: Metals & Mining: Coal
Goldman Sachs Global Investment Research 44
As of Apr 1, 2008, Goldman Sachs Global Investment Research had investment ratings on 2,975 equity securities. Goldman Sachs assigns stocks as
Buys and Sells on various regional Investment Lists; stocks not so assigned are deemed Neutral. Such assignments equate to Buy, Hold and Sell for
the purposes of the above disclosure required by NASD/NYSE rules. See 'Ratings, Coverage groups and views and related definitions' below.
Price target and rating history chart(s)
Regulatory disclosures
Disclosures required by United States laws and regulations
See company-specific regulatory disclosures above for any of the following disclosures required as to companies referred to in this report: manager
or co-manager in a pending transaction; 1% or other ownership; compensation for certain services; types of client relationships; managed/co-
managed public offerings in prior periods; directorships; market making and/or specialist role.
The following are additional required disclosures: Ownership and material conflicts of interest: Goldman Sachs policy prohibits its analysts,
professionals reporting to analysts and members of their households from owning securities of any company in the analyst's area of coverage.
Analyst compensation: Analysts are paid in part based on the profitability of Goldman Sachs, which includes investment banking revenues. Analyst as officer or director: Goldman Sachs policy prohibits its analysts, persons reporting to analysts or members of their households from serving as
an officer, director, advisory board member or employee of any company in the analyst's area of coverage. Distribution of ratings: See the
distribution of ratings disclosure above. Price chart: See the price chart, with changes of ratings and price targets in prior periods, above, or, if
electronic format or if with respect to multiple companies which are the subject of this report, on the Goldman Sachs website at
http://www.gs.com/research/hedge.html. Goldman, Sachs & Co. is a member of SIPC.
Additional disclosures required under the laws and regulations of jurisdictions other than the United States
The following disclosures are those required by the jurisdiction indicated, except to the extent already made above pursuant to United States laws
and regulations. Australia: This research, and any access to it, is intended only for "wholesale clients" within the meaning of the Australian
Corporations Act. Canada: Goldman Sachs Canada Inc. has approved of, and agreed to take responsibility for, this research in Canada if and to the
extent it relates to equity securities of Canadian issuers. Analysts may conduct site visits but are prohibited from accepting payment or
reimbursement by the company of travel expenses for such visits. Hong Kong: Further information on the securities of covered companies referred
to in this research may be obtained on request from Goldman Sachs (Asia) L.L.C. India: Further information on the subject company or companies
referred to in this research may be obtained from Goldman Sachs (India) Securities Private Limited; Japan: See below. Korea: Further information
on the subject company or companies referred to in this research may be obtained from Goldman Sachs (Asia) L.L.C., Seoul Branch. Russia: Research reports distributed in the Russian Federation are not advertising as defined in Russian law, but are information and analysis not having
product promotion as their main purpose and do not provide appraisal within the meaning of the Russian Law on Appraisal. Singapore: Further
information on the covered companies referred to in this research may be obtained from Goldman Sachs (Singapore) Pte. (Company Number:
198602165W). United Kingdom: Persons who would be categorized as retail clients in the United Kingdom, as such term is defined in the rules of
the Financial Services Authority, should read this research in conjunction with prior Goldman Sachs research on the covered companies referred to
herein and should refer to the risk warnings that have been sent to them by Goldman Sachs International. A copy of these risks warnings, and a
glossary of certain financial terms used in this report, are available from Goldman Sachs International on request.
European Union: Disclosure information in relation to Article 4 (1) (d) and Article 6 (2) of the European Commission Directive 2003/126/EC is
available at http://www.gs.com/client_services/global_investment_research/europeanpolicy.html
Japan: Goldman Sachs Japan Co., Ltd. Is a Financial Instrument Dealer under the Financial Instrument and Exchange Law, registered with the Kanto Financial Bureau (Registration No. 69), and is a member of Japan Securities Dealers Association (JSDA) and Financial Futures Association of Japan (FFJAJ). Sales and purchase of equities are subject to commission pre-determined with clients plus consumption tax. See company-specific disclosures as to any applicable disclosures required by Japanese stock exchanges, the
Japanese Securities Dealers Association or the Japanese Securities Finance Company.
Ratings, coverage groups and views and related definitions
Buy (B), Neutral (N), Sell (S) -Analysts recommend stocks as Buys or Sells for inclusion on various regional Investment Lists. Being assigned a Buy
or Sell on an Investment List is determined by a stock's return potential relative to its coverage group as described below. Any stock not assigned as
a Buy or a Sell on an Investment List is deemed Neutral. Each regional Investment Review Committee manages various regional Investment Lists to
a global guideline of 25%-35% of stocks as Buy and 10%-15% of stocks as Sell; however, the distribution of Buys and Sells in any particular coverage
group may vary as determined by the regional Investment Review Committee. Regional Conviction Buy and Sell lists represent investment
recommendations focused on either the size of the potential return or the likelihood of the realization of the return.
M J J A S O N D J F M A M J J A S O N D J F M A M J J A S O N D J F M2005 2006 2007 2008
0
2,000
4,000
6,000
8,000
500
1,000
1,500
2,000
2,500
3,000
Apr 17, 2005 to IL from OP
ILApr 17
N NAAug 15
PT Bumi Resources (BUMI.JK)Goldman Sachs rating and stock price target history
Currency: Indonesian Rupiah
Source: Goldman Sachs Investment Research for ratings and price targets; Reuters for daily closing prices as of 04/02/08.
Rating
Price target
Price target at removal
Jakarta SE Composite -Index; pricing by FactSet
Covered by current analyst
Not covered by current analyst
New rating system as of 6/26/06
900850
840800
1,034
1,002
Sto
ck P
rice
Inde
xP
rice
The price targets shown should be considered in the context of all prior published Goldman Sachs research, which may ormay not have included price targets, as well as developments relating to the company, its industry and financial markets.
M J J A S O N D J F M A M J J A S O N D J F M A M J J A S O N D J F M2005 2006 2007 2008
100
200
300
400
500
600
650
700
750
800
850
900
950
IL NJun 26
Banpu Public Company (BANP.BK)Goldman Sachs rating and stock price target history
Currency: Thai Baht
Source: Goldman Sachs Investment Research for ratings and price targets; Reuters for daily closing prices as of 04/02/08.
Rating
Price target
Price target at removal
Bangkok S.E.T. - PriceIndex; pricing by FactSet
Covered by Song Shen, as of Aug 15, 2006
Not covered by current analyst
New rating system as of 6/26/06
155137
150
137179
193216
258
Sto
ck P
rice
Inde
xP
rice
The price targets shown should be considered in the context of all prior published Goldman Sachs research, which may ormay not have included price targets, as well as developments relating to the company, its industry and financial markets.
June 19, 2008 ASEAN: Metals & Mining: Coal
Goldman Sachs Global Investment Research 45
Return potential represents the price differential between the current share price and the price target expected during the time horizon associated
with the price target. Price targets are required for all covered stocks. The return potential, price target and associated time horizon are stated in
each report adding or reiterating an Investment List membership.
Coverage groups and views: A list of all stocks in each coverage group is available by primary analyst, stock and coverage group at
http://www.gs.com/research/hedge.html. The analyst assigns one of the following coverage views which represents the analyst's investment outlook
on the coverage group relative to the group's historical fundamentals and/or valuation. Attractive (A). The investment outlook over the following 12
months is favorable relative to the coverage group's historical fundamentals and/or valuation. Neutral (N). The investment outlook over the
following 12 months is neutral relative to the coverage group's historical fundamentals and/or valuation. Cautious (C). The investment outlook over
the following 12 months is unfavorable relative to the coverage group's historical fundamentals and/or valuation.
Not Rated (NR). The investment rating and target price, if any, have been removed pursuant to Goldman Sachs policy when Goldman Sachs is
acting in an advisory capacity in a merger or strategic transaction involving this company and in certain other circumstances. Rating Suspended (RS). Goldman Sachs Research has suspended the investment rating and price target, if any, for this stock, because there is not a sufficient
fundamental basis for determining an investment rating or target. The previous investment rating and price target, if any, are no longer in effect for
this stock and should not be relied upon. Coverage Suspended (CS). Goldman Sachs has suspended coverage of this company. Not Covered (NC). Goldman Sachs does not cover this company. Not Available or Not Applicable (NA). The information is not available for display or is not applicable.
Not Meaningful (NM). The information is not meaningful and is therefore excluded.
Ratings, coverage views and related definitions prior to June 26, 2006
Our rating system requires that analysts rank order the stocks in their coverage groups and assign one of three investment ratings (see definitions
below) within a ratings distribution guideline of no more than 25% of the stocks should be rated Outperform and no fewer than 10% rated
Underperform. The analyst assigns one of three coverage views (see definitions below), which represents the analyst's investment outlook on the
coverage group relative to the group's historical fundamentals and valuation. Each coverage group, listing all stocks covered in that group, is
available by primary analyst, stock and coverage group at http://www.gs.com/research/hedge.html.
Definitions
Outperform (OP). We expect this stock to outperform the median total return for the analyst's coverage universe over the next 12 months. In-Line (IL). We expect this stock to perform in line with the median total return for the analyst's coverage universe over the next 12 months. Underperform (U). We expect this stock to underperform the median total return for the analyst's coverage universe over the next 12 months.
Coverage views: Attractive (A). The investment outlook over the following 12 months is favorable relative to the coverage group's historical
fundamentals and/or valuation. Neutral (N). The investment outlook over the following 12 months is neutral relative to the coverage group's
historical fundamentals and/or valuation. Cautious (C). The investment outlook over the following 12 months is unfavorable relative to the coverage
group's historical fundamentals and/or valuation.
Current Investment List (CIL). We expect stocks on this list to provide an absolute total return of approximately 15%-20% over the next 12 months.
We only assign this designation to stocks rated Outperform. We require a 12-month price target for stocks with this designation. Each stock on the
CIL will automatically come off the list after 90 days unless renewed by the covering analyst and the relevant Regional Investment Review
Committee.
Global product; distributing entities
The Global Investment Research Division of Goldman Sachs produces and distributes research products for clients of Goldman Sachs, and pursuant
to certain contractual arrangements, on a global basis. Analysts based in Goldman Sachs offices around the world produce equity research on
industries and companies, and research on macroeconomics, currencies, commodities and portfolio strategy.
This research is disseminated in Australia by Goldman Sachs JBWere Pty Ltd (ABN 21 006 797 897) on behalf of Goldman Sachs; in Canada by
Goldman Sachs Canada Inc. regarding Canadian equities and by Goldman Sachs & Co. (all other research); in Germany by Goldman Sachs & Co.
oHG; in Hong Kong by Goldman Sachs (Asia) L.L.C.; in India by Goldman Sachs (India) Securities Private Ltd.; in Japan by Goldman Sachs Japan Co.,
Ltd.; in the Republic of Korea by Goldman Sachs (Asia) L.L.C., Seoul Branch; in New Zealand by Goldman Sachs JBWere (NZ) Limited on behalf of
Goldman Sachs; in Singapore by Goldman Sachs (Singapore) Pte. (Company Number: 198602165W); and in the United States of America by
Goldman, Sachs & Co. Goldman Sachs International has approved this research in connection with its distribution in the United Kingdom and
European Union.
European Union: Goldman Sachs International, authorised and regulated by the Financial Services Authority, has approved this research in
connection with its distribution in the European Union and United Kingdom; Goldman, Sachs & Co. oHG, regulated by the Bundesanstalt für
Finanzdienstleistungsaufsicht, may also be distributing research in Germany.
General disclosures in addition to specific disclosures required by certain jurisdictions
This research is for our clients only. Other than disclosures relating to Goldman Sachs, this research is based on current public information that we
consider reliable, but we do not represent it is accurate or complete, and it should not be relied on as such. We seek to update our research as
appropriate, but various regulations may prevent us from doing so. Other than certain industry reports published on a periodic basis, the large
majority of reports are published at irregular intervals as appropriate in the analyst's judgment.
Goldman Sachs conducts a global full-service, integrated investment banking, investment management, and brokerage business. We have
investment banking and other business relationships with a substantial percentage of the companies covered by our Global Investment Research
Division.
Our salespeople, traders, and other professionals may provide oral or written market commentary or trading strategies to our clients and our
proprietary trading desks that reflect opinions that are contrary to the opinions expressed in this research. Our asset management area, our
proprietary trading desks and investing businesses may make investment decisions that are inconsistent with the recommendations or views
expressed in this research.
We and our affiliates, officers, directors, and employees, excluding equity analysts, will from time to time have long or short positions in, act as
principal in, and buy or sell, the securities or derivatives (including options and warrants) thereof of covered companies referred to in this research.
June 19, 2008 ASEAN: Metals & Mining: Coal
Goldman Sachs Global Investment Research 46
This research is not an offer to sell or the solicitation of an offer to buy any security in any jurisdiction where such an offer or solicitation would be
illegal. It does not constitute a personal recommendation or take into account the particular investment objectives, financial situations, or needs of
individual clients. Clients should consider whether any advice or recommendation in this research is suitable for their particular circumstances and,
if appropriate, seek professional advice, including tax advice. The price and value of the investments referred to in this research and the income from
them may fluctuate. Past performance is not a guide to future performance, future returns are not guaranteed, and a loss of original capital may
occur. Certain transactions, including those involving futures, options, and other derivatives, give rise to substantial risk and are not suitable for all
investors.
Current options disclosure documents are available from Goldman Sachs sales representatives or at
http://www.theocc.com/publications/risks/riskchap1.jsp. Fluctuations in exchange rates could have adverse effects on the value or price of, or income
derived from, certain investments.
Our research is disseminated primarily electronically, and, in some cases, in printed form. Electronic research is simultaneously available to all
clients.
Disclosure information is also available at http://www.gs.com/research/hedge.html or from Research Compliance, One New York Plaza, New York,
NY 10004.
Copyright 2008 The Goldman Sachs Group, Inc.
No part of this material may be (i) copied, photocopied or duplicated in any form by any means or (ii) redistributed without the prior written consent of The Goldman Sachs Group, Inc.