Embed Size (px)
Citation preview

Golden Dragon Hong Kong
Operations Finance
Customer Migration Capital Investment
High ARPU
Company Orientation

Urgent Issues Analysis Strategies Implementation Financial Projections
Objectives
EBITDA 10.0% CAGR
ARPU HK$112 159
Urgent Issues Analysis Strategies Implementation Financial Projections
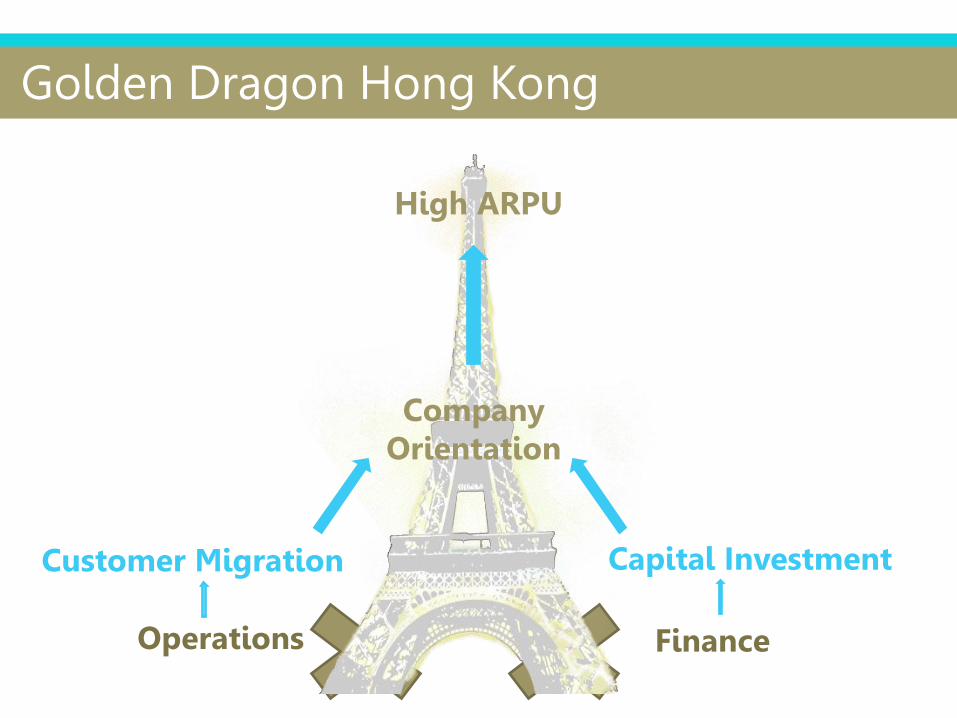
Urgent Issue 1: Ethical Scenario
Steven Chai (Executive Director)
– Insider Dealing
“Connected with a corporation”, “dealings in listed securities” Securities and Future Ordinance
Steven Chai & co-conspirators
– Corruption (bribery)
“Offer and accept a reward” Prevention of Bribery Ordinance
David Chan (CGDM CFO, CPA)
– Remained silent
“intentionally mislead (include mislead by remaining silent)” Code of Ethics for Professional Accountants

Urgent Issues Analysis Strategies Implementation Financial Projections
Urgent Issue 1: Ethical Scenario
Approach David Chan (CGDM CFO, direct superior)
Inform Michael Yip (CEO)
Speak to Board Members

Urgent Issues Analysis Strategies Implementation Financial Projections
Urgent Issue 2: Deficit in 30 Days
Financing Need:
• Deficit of HK$397mn in 30 days
Considerations:
• Bank deposits insufficient
• Involve interests
Solution:
• Immediate loan of HK$500mn
Projected Cash Position (GDHK) (HK$mn)
Cash (1 Jan) 118
Revenue 2400
Operating Cost -1500
Dividend -480
Tax -280
Capex -410
Lower Acct Payable -190
Advertising -40
Fine -15
Balance (30 June) -397

Urgent Issues Analysis Strategies Implementation Financial Projections
Position of GDHK: Laggard of the Competition
112
184
244 249
0
50
100
150
200
250
300
GDHK Competitors
GDHK lags the average ARPU by 43% HK$
Average: HK$197
Operations:
• Failure in low ARPU customer migration
Finance:
• Failure in utilizing debt to improve cash position
* Competitors: Data from the annual reports of HK Telecom (left), Hutchison (middle) and SmarTone (right)

Urgent Issues Analysis Strategies Implementation Financial Projections
Operations: Low Postpaid Subscribers Reduce ARPU
3.1%
13.8%
17.0%
6.3%
0%
5%
10%
15%
20%
Low receivables • Fewer postpaid • More prepaid
10x lower ARPU
Receivables as a % of revenue
Failed to migrate low-tier customers to high ARPU plans
(% of subscribers)
Competitors
3G Postpaid 65% 49% 71%
2G Postpaid 1.4% 14% -
Prepaid 34% 37% 29%
* Competitors: Data from the annual reports of HK Telecom (left), Hutchison (middle) and SmarTone (right)
GDHK Competitors

Urgent Issues Analysis Strategies Implementation Financial Projections
Operations: Failed to Respond to Smartphone Trend
Market share of smartphone OS
• Android & iPhone OS > 80% share
• Price of smartphone > HK$2500
• 3G & ARPU not accelerated by low-priced handsets
Smartphone trend in Hong Kong
Response of GDHK
Produces low-priced handsets
Unpopular, failed to raise ARPU
Response of Competitors
Partner with popular brands, launch high-tier plans
Welcomed by market, ARPU raised
51%
31%
18% Android
iPhone OS
Others

Urgent Issues Analysis Strategies Implementation Financial Projections
Operations: Slow Mobile Data Products Development
(Products) GDHK Competitors
Mobile Gaming Considering
Mobile TV Considering
Mobile Music App ×
4G LTE Service ×
* Competitors: Data from the annual reports of HK Telecom, Hutchison , SmarTone
• Competitors: LTE and products Capture demand for data
• GDHK: lacks data-driving products Should develop 3G/4G
Growing demand for data products

Urgent Issues Analysis Strategies Implementation Financial Projections
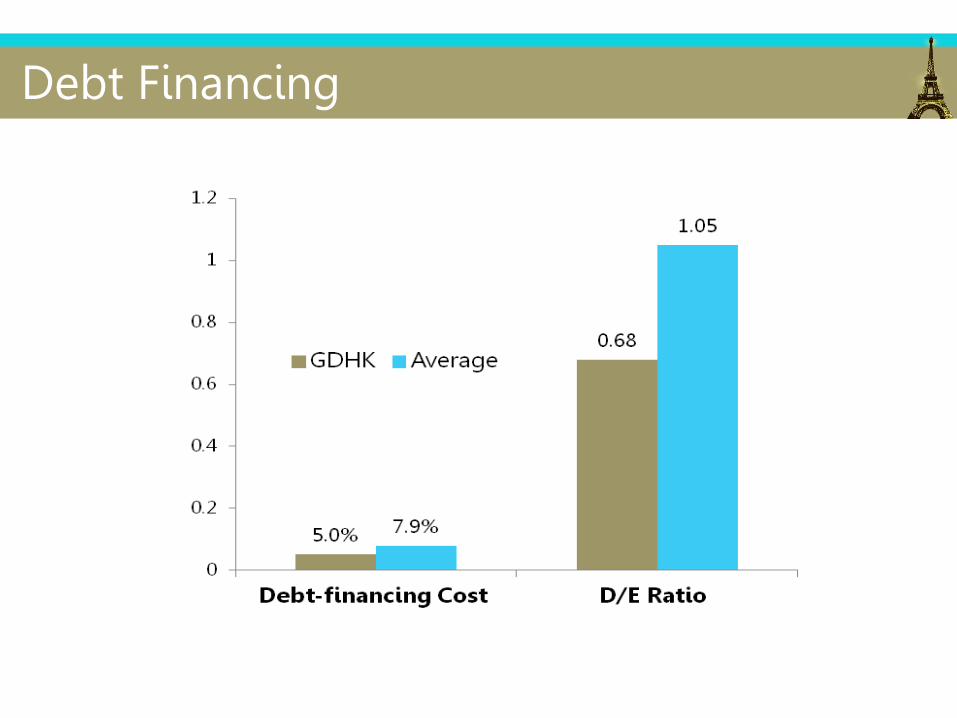
Finance: Illiquid and Debt Financing Capacity Idled
High profit margin, but low liquidity ratios 31.96% 0.35
0.31
0.06 9.11%
0.65
0.57
0.17
0
0.1
0.2
0.3
0.4
0.5
0.6
0.7
Profit Margin Current Ratio Quick Ratio Cash Ratio
GDHK
Average
Low interest cost & D/E ratio Capacity of debt financing for capital investment

Urgent Issues Analysis Strategies Implementation Financial Projections
Grand Strategy
Operations Finance
Customer Migration Capital Investment
High ARPU
Company Orientation

Urgent Issues Analysis Strategies Implementation Financial Projections
Operations: Migrate Customers to Higher ARPU Plans
1. Partner with Apple & Samsung
∵ - Customers prefer smartphones
- Handsets: NOT core competency
2. Cheaper data plan trials
Entice trials & attract subscribers of other operators
3. Better and new mobile products
Monthly Fee $150 $200 $300 $400
Discounted Fee $90 $120 $180 $250
Voice (mins)
Basic 1000 1000 1500 2000
Intra 200 500 1000 1500
Local Data Usage
200MB
300MB
800MB
Unlimited Thereafter charge $10/30MB
and monthly capped at $250
Services included
• Intra SMS • 10 intra MMS • Voice mail, call forwarding, caller
number display, call waiting and conference call
Urgent Issues Analysis Strategies Implementation Financial Projections
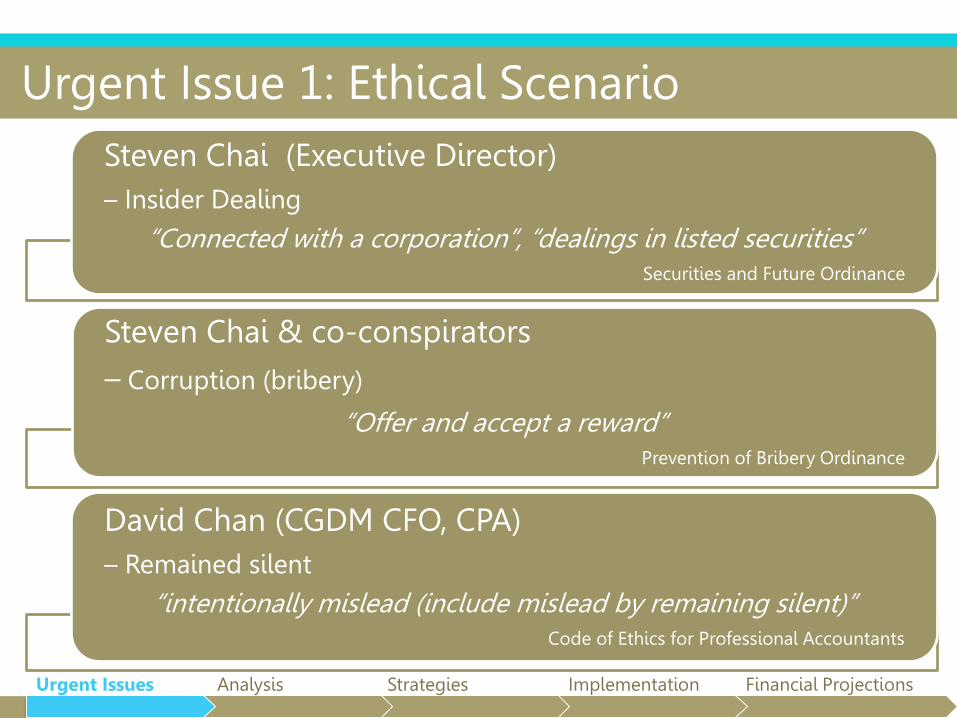
Finance: Debts to Finance Capital Investment
• Develop 3G/4G & data business
Raise ARPU
0
500
1000
1500
2000
2500
3000
2011 2012 2013 2014 2015 2016
HK$ mn
Net Capex
1. Borrow HK$500mn annually in 2014-16
CAPEX: HK$1bn to HK$2.5bn
Switch to debt-financed structure
2. Divestiture of Tiger Handsets
Generate HK$800mn cash
Improve liquidity position
How to finance?

Urgent Issues Analysis Strategies Implementation Financial Projections
Implementation Schedule 2012 2013 2014 2015 2016
Q3 Q4 Q1 Q2 Q3 Q4 H1 H2 H1 H2 H1 H2
Customer Migration
Partnership with popular mobile brands
Negotiate with Apple for its iPhone 5, Samsung's S4
Partner with other popular smartphone brands
Lower cost data plan trials
New mobile data products
Improvement of 3G services
Explore possibility of LTE/4G
Capital Investment
Spin-off Tiger Handsets
Improve cash position by loans

Urgent Issues Analysis Strategies Implementation Financial Projections
Financials: Debt-financing Improves Efficiency
Non-current loans
• HK$420mn 1900mn
D/E Ratio
• 0.68 0.77
Cost of Financing
• Debt: 5%
• Equity: 23%
Financing Efficiency
Investment: CAPEX / Liquidity
Customer Migration & ARPU
Profitability & Revenue
Growth
60% 57%
40% 44%
2011 2016
Debt
Equity

Urgent Issues Analysis Strategies Implementation Financial Projections
Financials: Improved Liquidity and CAPEX
Cash Reserves:
• HK$110mn 709mn
Cash Ratio:
• 0.06 0.36
Financing Efficiency
Investment: CAPEX / Liquidity
Customer Migration & ARPU
Profitability & Revenue
Growth
Capital Expenditure:
• 23% 35% of Sales
CAPEX-to-Income Ratio:
• 0.61 1.23
Cash Flow Projections
CAPEX-to-Income Ratio

Urgent Issues Analysis Strategies Implementation Financial Projections
Financials: Customer Migration & ARPU Uplift
ARPU: HK$112 159 by 2016 Financing Efficiency
Investment: CAPEX / Liquidity
Customer Migration & ARPU
Profitability & Revenue
Growth
112
159
0
20
40
60
80
100
120
140
160
180
2011 2016
Receivable Days: 7.6 20
0.33
0.67
0.72
0.28
Prepaid Postpaid
2011
2016

Urgent Issues Analysis Strategies Implementation Financial Projections
Segment Growth
GDHK Industry
Fee CAGR 2.60% -1.70%
VAS CAGR 22.60% 12.90%
Financials: Revenue Restructuring & Growth
• VAS boosted to take same proportion of revenue as Fee
Financing Efficiency
Investment: CAPEX / Liquidity
Customer Migration & ARPU
Profitability & Revenue
Growth
Growth Benchmarks - Overall
Industry Expectation 4.9%
Revenue CAGR 9.8%
EBITDA CAGR 10.0%
67%
28%
5%
FeeValue-added ServiceOther
47% 48%
5%

Urgent Issues Analysis Strategies Implementation Financial Projections
Summary
EBITDA 10.0% CAGR
ARPU HK$112 159
Customer Migration Capital Investment

Appendices Company Background
• Structure and History
• Mission and Values
• Domestic Market
• Income Statement
• Balance Sheet
• Cash Flow Statement
• CGDM Management
• GDHK Management
Ethical Scenario
• Staff Involved
• Securities and Futures Ordinance
• Prevention of Bribery Ordinance
• Code of Ethics for Professional Accountants
• ICAC Insider Dealing Case
• Amendment to Code of Ethics
Cash Deficit
• Projected Cash Position
Environmental Analysis
• SWOT Analysis
• PEST Analysis
• Porter’s Five Forces Model
• Competitor Technology and Product Comparison
• Market Share of Operating System
• Increase of Net Profit of Operators
Financial Analysis
• Financial Ratios
• ARPU Comparison
• Debt Financing
• Receivables Structure
Customer Migration Strategy
• Partnership with Smartphone Brands
• Lower Cost Data Plan Trials
• Special Package (1)
• Special Package (2): Mix & Match
• Upgrade and develop new mobile products
Capital Investment Strategy
• Valuation of Tiger Handsets
• Pricing of Tiger Handsets
• Increase in CAPEX
Implementation
• Implementation Schedule
Financial Projections
• Pro Forma Income Statement
• Pro Forma Cash Flow Statement
• Pro Forma Balance Sheet
• Sensitivity Analysis
• Projected Ratios
• Revenue and VAS Growth

Structure and History
• China Golden Dragon Mobile Limited (CGDM)
• Listed on HKEx and NYSE
• State-owned
• Largest mobile telecommunications provider in China – 31 provinces
• Golden Dragon Mobile Hong Kong Company Limited (GDHK)
• Established 1996, first Personal Communications Service provider
• Under brand “Dragon Magic Mobiles”
• Services: mobile voice, international direct dialing, roaming, wireless data
• Original Equipment Manufacturer acquirement:
• Tiger Handsets Company Limited, based in Guangdong
• Some manufacturing of DMM falls under GDHK
• Caring Company since 2000, Quality Tourism Service since 2003

Mission and Values
• Mission Statement:
“Dragon Magic – placing the magic of mobile technology at your fingertips.”
• Company Values:
Value Incorporates
Responsibility Safe products, responsible product development and R&D, social and corporate
responsibility, environmental responsibility, fiscal responsibility, responsible staffing
policies adhering to established national and international standards
Innovation Leading the market in new products and innovations, being first with value-added
mobile products, leveraging and improving upon existing mobile technologies,
anticipating customer needs and wants
Value Value for money products, price leading, value for shareholders, value for employees,
value of contribution to local and global communications industry, correct pricing,
cost leadership
Entrepreneurship Seizing opportunities in the market to increase existing market shares, looking for
new strategies to build markets and products, free-thinking and “big picture”
management, consider risk-takers
Quality Product safety, high quality product, low to no manufacturing and parts faults,
providing quality innovative mobile technologies, innovation with the aim to produce
safe, high quality new products and systems, “perfecting” products taken to market

Domestic Market
• Fixed line density: 52%, highest in Asia
• Market penetration rate 2011: 170%
• Restructuring & launch of new products
• Four mobile operators:
32%
27%
23%
18%
Market Share of Providers
Dragon Magic Mobiles
Vodatele
Tele Hong Kong
Lifestyle Phones

Income Statement HKD Million 2011 2010 Operating Revenue
Fees 3,062 2,789 Value-added Services 1,257 1,084 Handset sales 155 153 Other 95 101
Total operating revenue 4,569 4,127
Operating Expenses Leased Lines 30 26 Interconnection 245 230 Depreciation 680 619 Personnel 293 252 Handset manufacture 336 285 Other Operating Expenses 1,226 1,037
Total Operating Expenses 2,810 2,449
Profit from operations 1,759 1,678 Interest Income 11 13 Financing costs (21) (22) Profit before tax 1,749 1,669 Tax (16.5%) (289) (275) Profit after tax 1,460 1,394
Number of shares (Mil) 20 20 Earnings per share (HK$) 73 69.7

Balance Sheet
HKD Million 2011 2010 2011 2010
Current Assets Current Liabilities
Inventories 74 56 Accounts Payable 760 695
Accounts Receivables 94 69 Deferred Revenue 356 327
Prepayments and other CA 136 124 Accrued expenses and other payables
683 568
Deposits with Banks 233 199 Current taxation 92 112
Cash & Cash Equivalents 118 110 1891 1702
655 558 Non-current Liabilities
Non-current Assets Interest-bearing borrowings 420 420
Property, Plant, Equipment 4319 3932 Deferred revenue 5 4
Construction in progress 451 340 425 424
Goodwill 238 238 Equity
Deferred tax assets 75 66 Share capital 200 200
5083 4576 Reserves 3222 2808
Total Assets 5738 5134 3422 3008
Total Equity and Liabilities 5738 5134
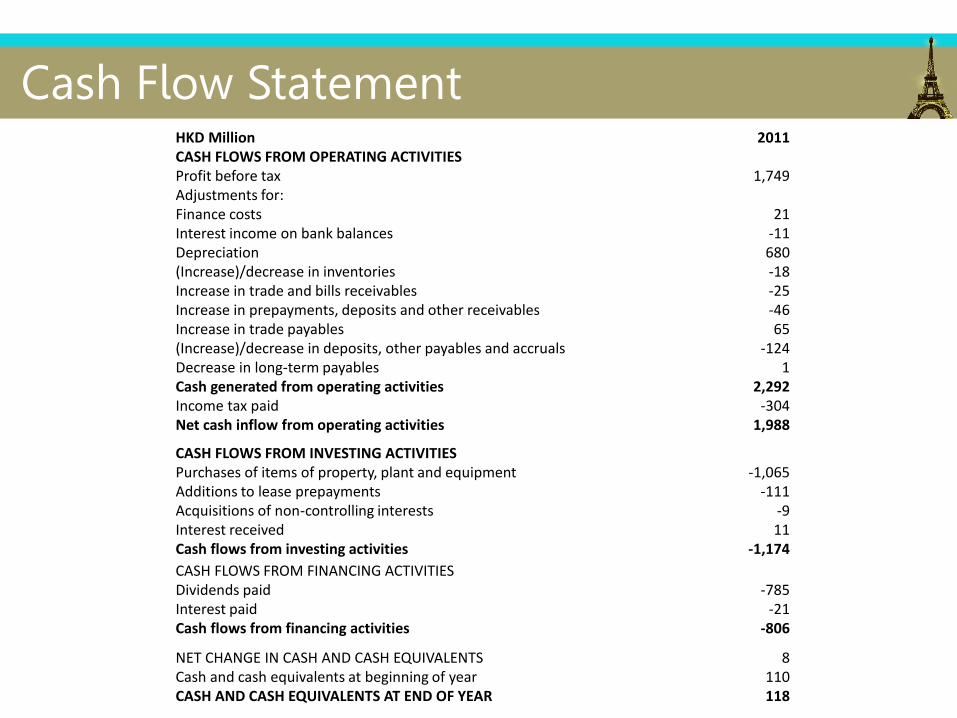
Cash Flow Statement HKD Million 2011 CASH FLOWS FROM OPERATING ACTIVITIES Profit before tax 1,749 Adjustments for: Finance costs 21 Interest income on bank balances -11 Depreciation 680 (Increase)/decrease in inventories -18 Increase in trade and bills receivables -25 Increase in prepayments, deposits and other receivables -46 Increase in trade payables 65 (Increase)/decrease in deposits, other payables and accruals -124 Decrease in long-term payables 1 Cash generated from operating activities 2,292 Income tax paid -304 Net cash inflow from operating activities 1,988
CASH FLOWS FROM INVESTING ACTIVITIES Purchases of items of property, plant and equipment -1,065 Additions to lease prepayments -111 Acquisitions of non-controlling interests -9 Interest received 11 Cash flows from investing activities -1,174
CASH FLOWS FROM FINANCING ACTIVITIES Dividends paid -785 Interest paid -21 Cash flows from financing activities -806
NET CHANGE IN CASH AND CASH EQUIVALENTS 8 Cash and cash equivalents at beginning of year 110 CASH AND CASH EQUIVALENTS AT END OF YEAR 118

CGDM Management
Selection of the Board of Directors
• Michael Yip, 55 – Executive Director, Chairman and CEO
• Michael Yip has been Chairman of the Board since 2002 and has been with the company for 20 years. He is highly respected in the Chinese and global telecommunications industry. He has an economics degree from Oxford and a Master of Business Administration (MBA) from London Business School.
• Moses Wong, 46 – Executive Director and Chief Operations Officer
• Moses Wong has been an executive director since 2002 and is seen as the next Chairman of the Board. He joined the company as a fresh university graduate and is an ambitious and extremely competent director and employee.
• Steven Chai, 39 – Executive Director
• Steven Chai is the youngest member of the Board of which he has been a director since 2008. He is a high-flyer in the telecommunications industry and holds an MBA from the Harvard Business School. He is a member of the audit committee.
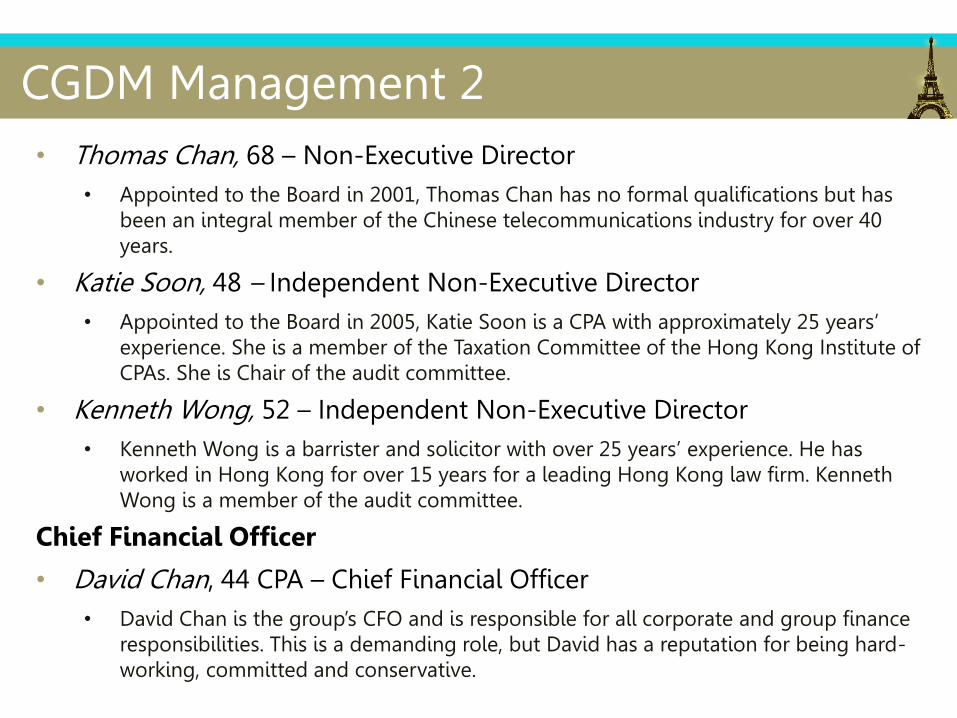
CGDM Management 2
• Thomas Chan, 68 – Non-Executive Director
• Appointed to the Board in 2001, Thomas Chan has no formal qualifications but has been an integral member of the Chinese telecommunications industry for over 40 years.
• Katie Soon, 48 – Independent Non-Executive Director
• Appointed to the Board in 2005, Katie Soon is a CPA with approximately 25 years’ experience. She is a member of the Taxation Committee of the Hong Kong Institute of CPAs. She is Chair of the audit committee.
• Kenneth Wong, 52 – Independent Non-Executive Director
• Kenneth Wong is a barrister and solicitor with over 25 years’ experience. He has worked in Hong Kong for over 15 years for a leading Hong Kong law firm. Kenneth Wong is a member of the audit committee.
Chief Financial Officer
• David Chan, 44 CPA – Chief Financial Officer
• David Chan is the group’s CFO and is responsible for all corporate and group finance responsibilities. This is a demanding role, but David has a reputation for being hard-working, committed and conservative.

GDHK Management
• Matthew Xu, 52 – Chief Executive Officer
• Matthew Xu is the company’s CEO and reports to the China Golden Dragon Mobile board. He has been in telecommunications since 1992 and with the company since 1997. He has no formal qualifications but is an astute and well-connected entrepreneur.
• Penny Wong, 55 – CPA & Chief Financial Officer
• Penny Wong is responsible for all accounting, IT, finance and administration for the GDHK subsidiary and must report to the group CFO. She has been with the company since 2008 and has previously worked in large accounting firms.
• Jenny Wang, 48 – Sales and Marketing Manager
• Jenny Wang is widely regarded as the best sales manager in telecommunications in Hong Kong and is now responsible for the sales and marketing of both voice and value-added business.
• Alison Cheng, 36 – General Manager
• Alison Cheng has worked for GDHK since it began operations in 1996. She is responsible for the overall operations of the Hong Kong head office and all of the retail subsidiaries.

Staff Involved
• Steven Chai, 39 – Executive Director
• Steven Chai is the youngest member of the Board of which he has been a director since 2008. He is a high-flyer in the telecomm industry and holds an MBA from the Harvard Business School. He is a member of the audit committee.
• Michael Yip, 55 – Executive Director, Chairman and CEO
• Michael Yip has been Chairman of the Board since 2002 and has been with the company for 20 years. He is highly respected in the Chinese and global telecommunications industry. He has an economics degree from Oxford and a Master of Business Administration (MBA) from London Business School.
• David Chan, 44 CPA – Chief Financial Officer
• The group’s CFO, and is responsible for all corporate and group finance responsibilities. This is a demanding role, but David has a reputation for being hard-working, committed and conservative.

Staff Involved 2
• Penny Wong, 55 – CPA & Chief Financial Officer
• Penny Wong is responsible for all accounting, IT, finance and administration for the GDHK subsidiary and must report to the group CFO. She has been with the company since 2008 and has previously worked in large accounting firms.
• Holly Lee, 28 – Fund Manager at ABC Funds Management
• Holly Lee is the number one Fund Manager for ABC Funds Management based in Hong Kong. She has a Master in Economics from Oxford and is viewed as a rising star in the Hong Kong funds management industry. She is extremely talented and ambitious, and has a reputation for taking large risks to facilitate large returns.

Securities and Futures Ordinance
• Cap 571
Section 247
Section 249

Securities and Futures Ordinance 2
• Cap 571
Section 249
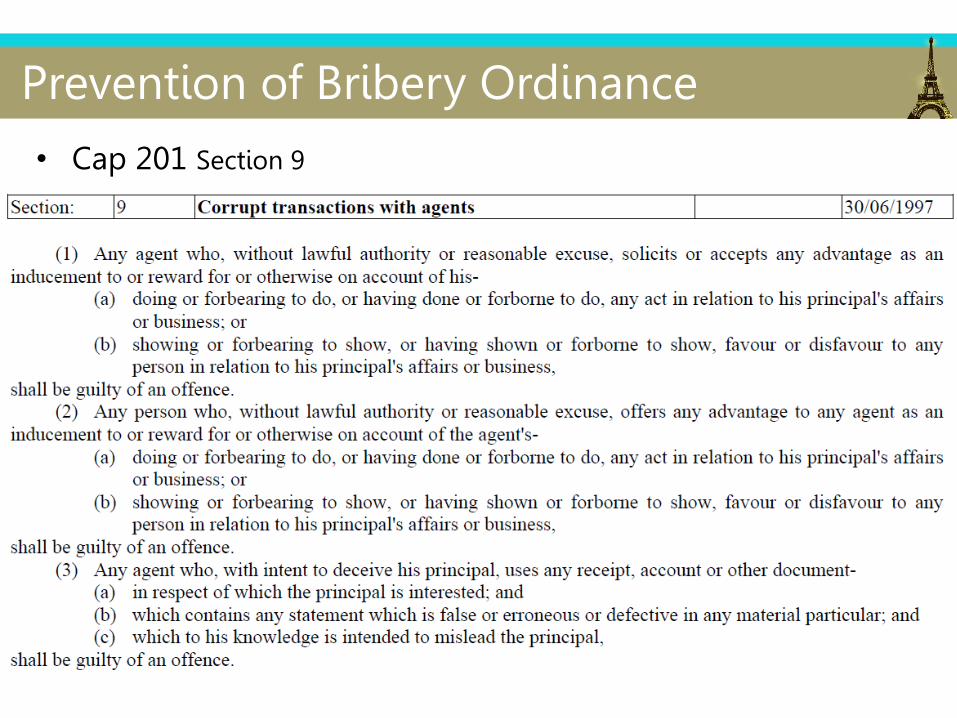
Prevention of Bribery Ordinance
• Cap 201 Section 9

Code of Ethics for Professional Accountants (Jan 2011)
• Related parts: (Section 310 Potential Conflicts)
• Penalty (Preface)
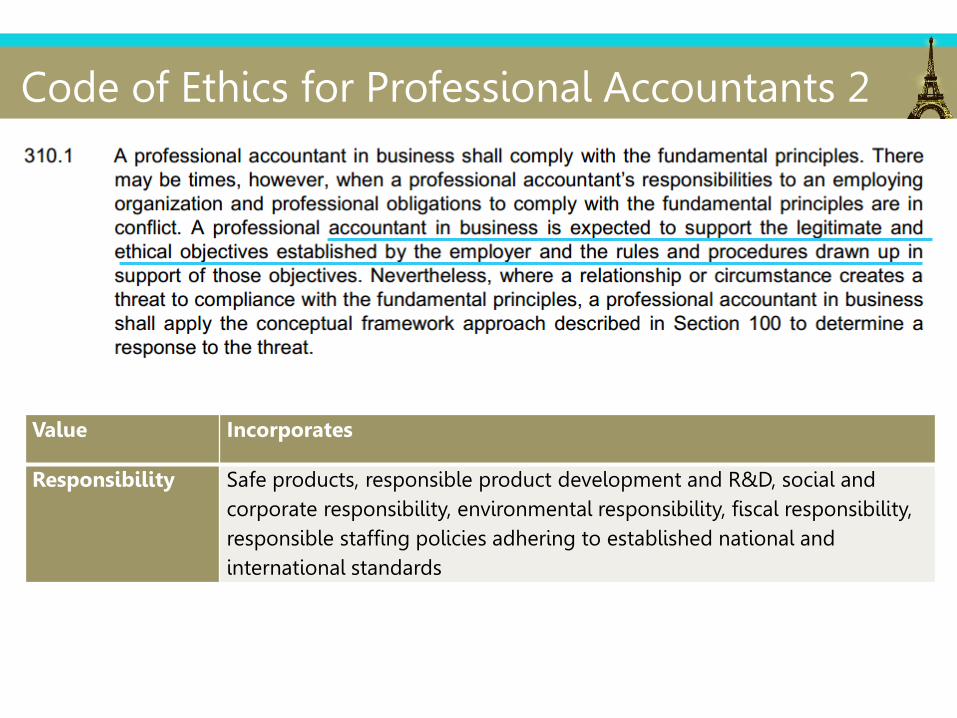
Value Incorporates
Responsibility Safe products, responsible product development and R&D, social and
corporate responsibility, environmental responsibility, fiscal responsibility,
responsible staffing policies adhering to established national and
international standards
Code of Ethics for Professional Accountants 2

ICAC Insider Dealing Case
The trial judge, in sentencing, reckoned that the "insider dealings" case presented investigators with immense difficulties. To preserve market integrity, the judge ruled that penalties of sufficient deterrence had to be meted out.
ICAC Post, Jun 2007

Amendment to Code of Ethics • Proposed amendment to the code of ethics IESBA exposure draft on
Responding to a Suspected Illegal Act
• Background
The International Ethics Standards Board for Accountants (IESBA) issued an Exposure Draft on Responding to a Suspected Illegal Act on 22 Aug 2012. (Local Invitation to Comment with comments requested by 31 Oct 2012)
• New requirements to accountants in public practice and in business
• Address responsibilities in disclosing suspected illegal acts committed by clients or employers to an appropriate authority.
• Effects
• Far-reaching implications on accountants' courses of action in discharging their professional responsibilities
• Change the existing interaction between professional accountants and their clients as well as between employers and employees being accountants in organizations.
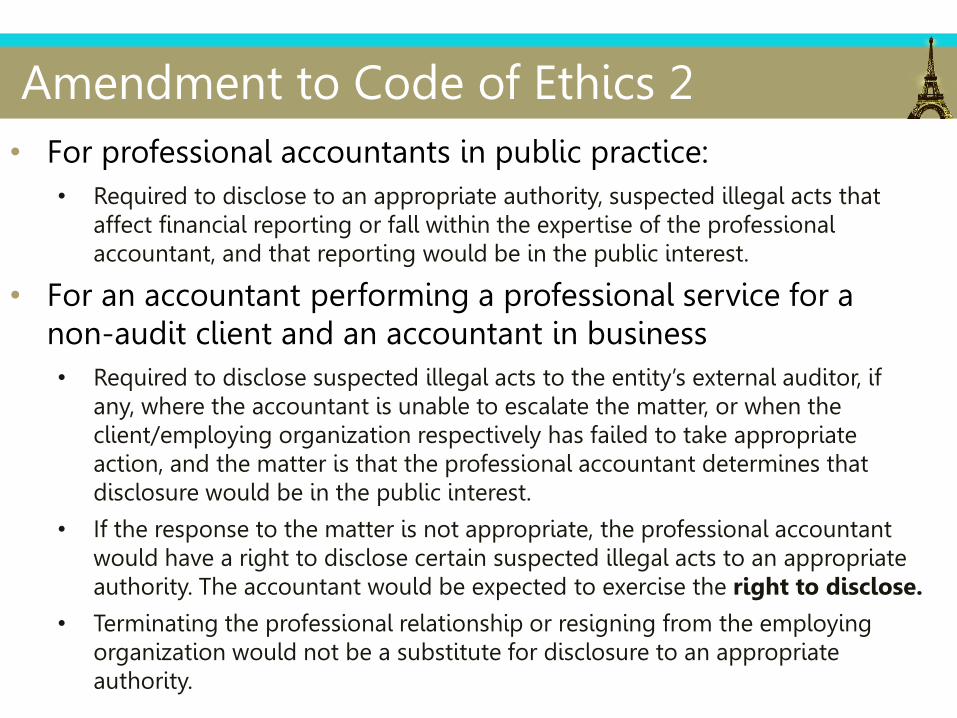
Amendment to Code of Ethics 2
• For professional accountants in public practice:
• Required to disclose to an appropriate authority, suspected illegal acts that affect financial reporting or fall within the expertise of the professional accountant, and that reporting would be in the public interest.
• For an accountant performing a professional service for a non-audit client and an accountant in business
• Required to disclose suspected illegal acts to the entity’s external auditor, if any, where the accountant is unable to escalate the matter, or when the client/employing organization respectively has failed to take appropriate action, and the matter is that the professional accountant determines that disclosure would be in the public interest.
• If the response to the matter is not appropriate, the professional accountant would have a right to disclose certain suspected illegal acts to an appropriate authority. The accountant would be expected to exercise the right to disclose.
• Terminating the professional relationship or resigning from the employing organization would not be a substitute for disclosure to an appropriate authority.

Projected Cash position
Projected Cash Position (GDHK) (HK$mn)
Cash (1 Jan) 118
Revenue 2400
Operating Cost -1500
Dividend -480
Tax -280
Capex -410
Lower Acct Payable -190
Advertising -40
Fine -15
Balance (30 June) -397

SWOT Analysis
Strength:
1. Largest subscriber base
2.Highly profitable
3. Low cost leadership
4. Low costs in debt-financing
Weakness:
1. Low ARPU
2. Weak cash flow and low liquidty
3. Failure in migrating minutes to bytes
4. Failure in recognizing the importance of high end smartphones
5. Lack of service variety and R&D
6. Low proportion of postpaid customers
Opportunity:
1. Growing 3G market and greater demand for mobile data services
2. Growing 4G market
3. Mobile data growth
Threat:
1. Competitors are investing intensively in 3G network upgrade and 4G development
2. Competitors are partnering with high end smartphones brands
3. Relationship with the authority being ceased
4. Voice growth stagnates

PEST Analysis
Political: Relationship with the government
being ceased
Economic: The industry performed strongly
despite global economic downturn
Social: Increasing demand for
smartphones and mobile data usage
Technological: Mobile
operators are innovating mobile data products and network quality

Porter’s Five Forces Model
High-ARPU
Competitors: 1. Right customer focus
2. Branded handset subsidy
3. Services can meet demand
Customers: Growing demand on smartphones and mobile data
services
Entrants:
High entry barriers as new entrants have to obtain licence from
government to operate
Substitutes: It is difficult to
substitute the operators
Suppliers: Spectrum is invited by OFCA for the bid of the
15-year licence Supply cost is relatively
stable

Competitor Technology and Product Comparison
(Products) GDHK Competitors
Mobile Gaming Considering
Mobile TV Considering
Mobile Music App ×
4G LTE Service ×
Competitors Product
SmarTone • Cloud Storage Manager • X-Power
Hong Kong Telecom • NPC Mobile Payment
Hutchison • 3tv • 3Books

Market Share of Operating Systems

Increase in Net Profits of Operators
1460
1271 1261
765
1394
972 900
255
0
200
400
600
800
1000
1200
1400
1600
GDHK
Operators booked increase in net profit
2011
2010
(HK$ mn)
Other Competitors*
* Other Competitors: Data from the annual reports of HK Telecom (2nd), Hutchison (3rd) and SmarTone (4th)

Financial Ratios
GDHK Other Competitors Liquidity
Current Ratio 0.35 1.19 0.27 0.80
Quick Ratio 0.31 1.04 0.23 0.70
Cash Ratio 0.06 0.32 0.02 0.27
Solvency
Debt Ratio 0.40 0.52 0.48 0.60
D/E 0.68 1.10 0.93 1.49
LT Debt Ratio 0.11 0.47 0.10 0.31
Times Interest Earned 84.29 2.07 11.6 10.2
Asset Management
Receivables Turnover 56.06 8.54 8.17 20.0
Total Asset Turnover 0.80 0.30 0.67 0.92
Fixed Asset Turnover 0.90 0.35 0.75 1.38
Profitability (%)
Profit Margin 31.96 6.41 9.41 11.5
ROA 25.45 1.95 6.28 10.6
ROE 42.68 4.11 12.1 26.3

ARPU Comparison
* Other Competitors: Data from the annual reports of HK Telecom (left), Hutchison (middle) and SmarTone (right)
112
184
244 249
0
50
100
150
200
250
300
GDHK Competitors
Average: HK$197
HK$
Debt Financing

Receivables Structure
Receivable as a % of Revenue
GDHK 3.1%
Other Competitors*
13.8%
17.0%
6.3%
* Other Competitors: Data from the annual reports of HK Telecom (left/top), Hutchison (middle) and SmarTone (right/bottom)
GDHK Other Competitors*

Partnership with Smartphone Brands
• Partner with Apple, Samsung, HTC, Sony etc.
• Leverage on:
• Huge subscriber base;
• Long-established operating model;
• Connection with CGDM
• Reasons:
• Increase no. of customers buy smartphones via GDHK use more costly plans raise ARPU;
• Producing handsets is out of GDHK core competency
• Partners and their new handsets
• Apple launches iPhone on 5 Sept 2012 (main contributor to 27-fold increase in data usage from 2008-2011)
• Samsung Galaxy launches S4 in Feb 2013

Producer Model/Series
Apple iPhone 5
Samsung S4
Sony Xperia
HTC HTC One
RIM BlackBerry 10
Nokia Nokia Lumia
Partnership with Smartphone Brands 2

Lower Cost Data Plan Trials
Monthly Fee $150 $200 $300 $400
Discounted Fee $90 $120 $180 $250
Voice (mins)
Basic 1000 1000 1500 2000
Intra 200 500 1000 1500
Local Data Usage
200MB 300MB 800MB
Unlimited Thereafter charge $10/30MB and monthly capped at $250
Services included
• Intra SMS • 10 intra MMS • Voice mail, call forwarding, caller number
display, call waiting and conference call

Special Package (1)
Handset
Monthly Fee $150
Monthly Fee $250
Monthly Fee $300
Samsung S3 (16GB) $3,200 $1,800 $0
Samsung S3 (32GB) $3,500 $2,100 $0
iPhone 5 (16GB) $3,600 $1,100 $450
iPhone 5 (32GB) $4,500 $2,000 $1,300
iPhone 5 (64GB) $5,300 $2,800 $1,700

Special Package (2): Mix & Match
Monthly Fee $100
Basic min 2000 1000
Intra min 1000 600
Intra SMS Unlimited Unlimited
Data Usage - 100MB
Self selected Value-added services
Free to pick one item: • 30MB local data • Mobile Reading • Mobile Gambling • Mobile “Weibo” • Mobile Music • Call Guard
$10 for each item: • Mobile Reading • Mobile Gambling • Mobile “Weibo” • Mobile Music • Call Guard
Services included Voice mail, call forwarding, caller number display, call waiting and conference call

Upgrade and develop new mobile products
• Upgrade existing mobile products:
• Mobile Gaming: partner with local mobile gaming companies e.g. LazyBug Studio expand on current game variety
• Mobile Gambling: partner with the Hong Kong Jockey Club to provide mobile services
• Mobile Reading: provided by almost all competitors and very popular among smartphone users provide unlimited access to e-books, comics and magazines

Upgrade and develop new mobile products 2
• Upgrade existing mobile products:
• 3G Dual number service plan: work with CGDM to provide the service in Hong Kong and Mainland China enjoy voice, message and data services
• Call Guard: operate on a cloud-based platform to avoid disturbance and report nuisance callers
• Other value-added services: International data roaming, Mobile Music (free access to KKBOX) and Mobile “Weibo” (partner with Xinlang Wang)

Valuation of Tiger Handsets
Valuation of Tiger Handset (HK$mn)
Current Situation Scenario IF all handsets are purchased instead of gifted
Sales 155 Sales 420
Cost of Sales 124 Cost of Sales 336
Profit 31 Profit 84
Assumptions:
Profit roughly equals Free Cash Flow
WACC = 10% Profitability remains same (20%)
Perpetuity Growth = 0% Operating Years = 20
NPV of Tiger Handset: 799.14
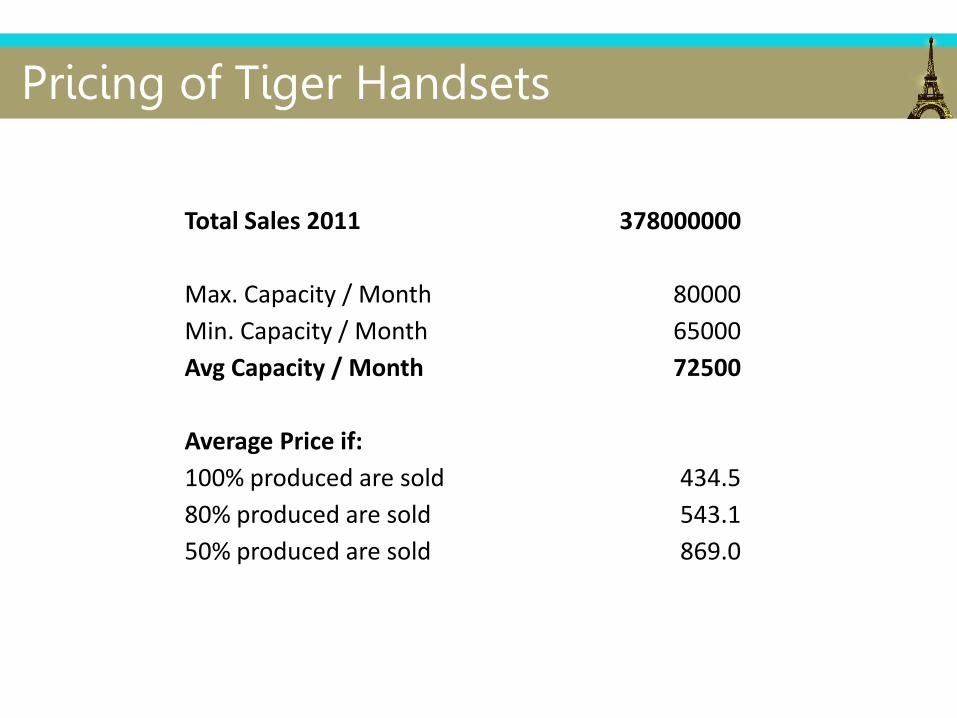
Pricing of Tiger Handsets
Total Sales 2011 378000000
Max. Capacity / Month 80000
Min. Capacity / Month 65000
Avg Capacity / Month 72500
Average Price if:
100% produced are sold 434.5
80% produced are sold 543.1
50% produced are sold 869.0

Increase in CAPEX CAPEX
2010 2011 2012 2013 2014 2015 2016
Net PPE projections
BoP 3,932 4,319 4,473 4,194 4,913 5,772
Net Capex 1,065 1,273 778 1,952 2,344 2,556
Depreciation -678 -1,118 -1,058 -1,233 -1,485 -1,781
EoP 3,932 4,319 4,473 4,194 4,913 5,772 6,547
Capex projections
Gross Capex 0 -1,065
Less disposals 0 0
Net Capex 0 -1,065 -1,273 -778 -1,952 -2,344 -2,556
% of sales 0.0% 23.3% 25.0% 28.0% 32.0% 35.0% 35.0%
Depreciation projections
Existing assets -864 -648 -432 -216
Capex in 2011 -255 -255 -255 -255 -255
Capex in 2012 -156 -156 -156 -156
Capex in 2013 -390 -390 -390
Capex in 2014 -469 -469
Capex in 2015 -511
Total depreciation -619 -680 -1,118 -1,058 -1,233 -1,485 -1,781

Implementation Schedule
2012 2013 2014 2015 2016
Q3 Q4 Q1 Q2 Q3 Q4 H1 H2 H1 H2 H1 H2
Customer Migration
Partnership with popular mobile brands
Negotiate with Apple for its iPhone 5, Samsung's S4
Partner with other popular smartphone brands
Lower cost data plan trials
New mobile data products
Improvement of 3G services
Explore possibility of LTE/4G
Capital Investment
Spin-off Tiger Handsets
Improve cash position by loans

Pro Forma Income Statement
HKD Million 2012 2013 2014 2015 2016
REVENUE 5,091 5,637 6,101 6,696 7,303
Cost of inventories sold -374 -415 -449 -492 -537
Staff costs -322 -355 -390 -429 -472
Depreciation and amortisation -1,118 -1,058 -1,233 -1,485 -1,781
Rental expenses -35 -40 -46 -52 -60
Fuel and utility expenses -257 -270 -284 -298 -313
Other operating expenses -1,374 -1,522 -1,647 -1,808 -1,972
Finance costs -46 -21 -46 -71 -96
PROFIT BEFORE TAX 1,563 1,957 2,007 2,060 2,073
Income tax expense -258 -323 -332 -340 -342
PROFIT FOR THE YEAR 1,305 1,634 1,676 1,720 1,730

Pro Forma Cash Flow Statement HKD Million 2012 2013 2014 2015 2016
CASH FLOWS FROM OPERATING ACTIVITIES
Profit before tax 1,563 1,957 2,007 2,060 2,073
Adjustments for:
Finance costs 46 21 46 71 96
Depreciation 1,118 1,058 1,233 1,485 1,781
(Increase)/decrease in inventories -8 -9 -7 -10 -10
Increase in trade and bills receivables -45 -46 -65 -80 -70
Increase in trade payables -190 61 52 67 68
Cash generated from operating activities 2,484 3,043 3,265 3,594 3,938
Income tax paid -258 -323 -332 -340 -342
Net cash inflow from operating activities 2,226 2,719 2,933 3,254 3,595
CASH FLOWS FROM INVESTING ACTIVITIES -1,273 -778 -1,952 -2,344 -2,556
CASH FLOWS FROM FINANCING ACTIVITIES
New bank loans 500 0 500 500 500
Repayment of bank loans 0 -500 0 0 0
Dividends paid -1044.4 -1307.31 -1340.88 -1376.27 -1384.49
Interest paid -46 -21 -46 -71 -96
Cash flows from financing activities -590 -1,828 -887 -947 -980
NET CHANGE IN CASH AND CASH EQUIVALENTS 363 113 94 -37 59
Cash and cash equivalents at beginning of year 118 481 594 688 651
CASH AND CASH EQUIVALENTS AT END OF YEAR 481 594 688 651 709

Pro Forma Balance Sheet HKD Million 2010 2011 2012 2013 2014 2015 2016
NON-CURRENT ASSETS
Property, plant and equipment 3,932 4,319 4,473 4,194 4,913 5,772 6,547
Construction in progress 340 451 452 452 452 452 452
Intangible assets 238 238 238 238 238 238 238
Deferred tax assets 66 75 75 75 75 75 75
4,576 5,083 5,238 4,959 5,678 6,537 7,312
CURRENT ASSETS
Inventories 56 74 81 90 97 107 117
Trade receivables 69 94 139 185 251 330 400
Prepayments, deposits and other receivables 323 369 369 369 369 369 369
Cash and cash equivalents 110 118 481 594 688 651 709
558 655 1,071 1,238 1,405 1,457 1,595
TOTAL ASSETS 5,134 5,738 6,309 6,197 7,083 7,994 8,907
CURRENT LIABILITIES
Bank loans 0 0 500 0 0 0 0
Trade payables 695 760 570 631 683 750 818
Deposits, other payables and accruals 568 683 683 683 683 683 683
Deferred Revenue 327 356 356 356 356 356 356
Tax payable 112 92 92 92 92 92 92
1,702 1,891 2,201 1,762 1,814 1,881 1,949
NON-CURRENT LIABILITIES
Bank loans 420 420 420 420 920 1,420 1,920
Long-term payables 4 5 5 5 5 5 5
424 425 425 425 925 1,425 1,925
TOTAL LIABILITIES 2,126 2,316 2,626 2,187 2,739 3,306 3,874
EQUITY
Issued capital 200 200 200 200 200 200 200
Reserves 2,808 3,222 3,483 3,809 4,144 4,487 4,833
TOTAL EQUITY 3,008 3,422 3,683 4,009 4,344 4,687 5,033

Sensitivity Analysis
Scenario 2012 Fee Drop by 10% No VAS Growth 2013 Fee Drop by 10% No VAS Growth
HKD Million # % # % # % # % # % # %
REVENUE 5,091 100% 4769 94% 4740 93% 5,637 100% 5303 94% 5238 93%
Cost of inventories sold 374 7% 374 7% 374 7% 415 7% 415 7% 415 7%
Staff costs 322 6% 322 6% 322 6% 355 6% 355 6% 355 6%
Depreciation and amortisation 1,118 22% 1118 22% 1118 22% 1,058 19% 1058 19% 1058 19%
Rental expenses 35 1% 35 1% 35 1% 40 1% 40 1% 40 1%
Fuel and utility expenses 257 5% 257 5% 257 5% 270 5% 270 5% 270 5%
Other operating expenses 1,374 27% 1374 27% 1374 27% 1,522 27% 1522 27% 1522 27%
Finance costs 46 1% 46 1% 46 1% 21 0% 21 0% 21 0%
PROFIT BEFORE TAX 1,563 31% 1242 24% 1213 24% 1,957 35% 1623 29% 1558 28%
Income tax expense 258 5% 205 4% 200 4% 323 6% 268 5% 258 5%
PROFIT FOR THE YEAR 1,305 26% 1037 20% 1013 20% 1,634 29% 1355 24% 1301 23%

Projected Ratios Liquidity 2016 2011 2010
Current Ratio 0.82 0.35 0.33
Quick Ratio 0.76 0.31 0.29
Cash Ratio 0.36 0.06 0.06
NWC to TA -0.04 -0.22 -0.22
Interval Measure 113.37 85.08 83.16
Solvency
Total Debt Ratio 0.43 0.40 0.41
Debt Equity Ratio 0.77 0.68 0.71
Equity Multiplier 1.77 1.68 1.71
Long term Debt Ratio 0.28 0.11 0.12
Times interest earned ratio 22.58 84.29 76.86
Cash Coverage ratio 41.14 116.67 105
Asset Management
Receivable Days 20.00 7.59 6.10
Total Asset Turnover 0.82 0.80 0.8
Fixed Asset Turnover 1.00 0.90 0.9
Profitability (%)
Profit Margin 23.69 31.96 33.77
ROA 19.42 25.45 27.14
ROE 34.38 42.68 46.33
ROS 29.69 38.50 40.66

Revenue and VAS Growth
FEE 2010 2011 2012 2013 2014 2015 2016
% growth 9.8% 5.0% 4.0% 2.0% 1.0% 1.0%
Total Fee 2,789 3,062 3,215 3,344 3,411 3,445 3,479
Value-add
Value-added services 1,084 1,257 1,608 2,006 2,387 2,928 3,479
% of total fee 38.9% 41.1% 50.0% 60.0% 70.0% 85.0% 100.0%
Other revenue
Handset 153 155 173 192 208 229 250
Others 101 95 95 95 95 95 95
Total other revenue 254 250 268 287 303 324 345
Total Revenue
Fee 2,789 3,062 3,215 3,344 3,411 3,445 3,479
Value-added Service 1,084 1,257 1,608 2,006 2,387 2,928 3,479
Other 254 250 268 287 303 324 345
Total 4,127 4,569 5,091 5,637 6,101 6,696 7,303