Embed Size (px)
Citation preview
Gold Nanoparticle-Enhanced Detection of Single
Nucleotide Polymorphisms in the
NanoBioArray Chip
by
Abootaleb Sedighi
M.Sc., Shahid Beheshti University, 2007 B.Sc. Yasuj University, 2004
Thesis Submitted in Partial Fulfillment of the
Requirements for the Degree of
Doctor of Philosophy
in the
Department of Chemistry
Faculty of Science
Abootaleb Sedighi 2015
SIMON FRASER UNIVERSITY
Spring 2015

ii
Approval
Name: Abootaleb Sedighi
Degree: Doctor of Philosophy
Title: Gold Nanoparticle-Enhanced Detection of Single Nucleotide Polymorphisms in the NanoBioArray Chip
Examining Committee: Chair: Krzysztof Starosta
Associate Professor, Chemistry
Dr. Paul C. H. Li Senior Supervisor Professor
Dr. Byron D. Gates
Supervisor Associate Professor
Dr. Dipankar Sen
Supervisor Professor
Dr. Gary W Leach
Internal Examiner Associate Professor Department of Chemistry
Dr. X. Chris Le
External Examiner Professor, Department of Medicine and Pathology University of Alberta
Date Defended/Approved: April 16, 2015
iii
Partial Copyright Licence
iv
Abstract
In this thesis, we report the use of gold nanoparticles (AuNPs) to enhance the
detection of single nucleotide polymorphism (SNPs) in the NanoBioArray (NBA) chip. A
combination of gold nanoparticles (AuNPs) and nucleic acids has recently been used in
many biosensing applications. However, there is a poor fundamental understanding of
how gold nanoparticle surfaces influence the DNA hybridization process. Our kinetic
analysis shows that in the presence of AuNP-ssDNA interactions, mechanisms of DNA
hybridization and dehybridization are altered. Our proposed mechanisms include a shift
of the rate-limiting step of hybridization from mismatch-insensitive to the mismatch-
sensitive zipping step. Furthermore, the binding of gold nanoparticles to the single-
stranded DNA segments (commonly known as bubbles) in the mismatched (MM) duplex
DNAs, destabilize the duplexes and accelerates the dehybridization process.
We employ these alterations in mechanisms, both of which disfavor the formation
of MM duplexes, to enhance the detection of SNPs in the NBA chip. In this technique,
we load the target DNAs on the surface of AuNPs (i.e. AuNP targets) and then introduce
them to the surface-immobilized probes for DNA hybridization. Our results show that
AuNP targets, in contrast to the targets free in the solution (free targets), were able to
discriminate between the perfectly matched (PM) probes and the mismatched (MM)
ones. Using AuNP targets, we developed a room-temperature method for detection of
SNPs in the KRAS gene codon 12 in the NBA chip.
Then, a novel wash method based on AuNPs was developed to preserve the
DNA hybridization signals in CD-NBA chip while discriminating MM duplexes from PM
duplexes. In this method, AuNPs are suspended in the wash buffers to preferentially
destabilize the MM duplexes, in presence of the PM duplexes. Enjoying this targeted
mechanism, AuNP wash method enhances specificity without compromising signal
intensity. This method is simple and compatible with multiplexed DNA hybridization
settings.
The findings in this thesis can be used to enhance the reliability of DNA
biosensors (e.g. DNA microarrays) and might lead to new applications in DNA
biosensing.

v
Keywords: Single Nucleotide Polymorphism (SNP); Gold nanoparticle (AuNP);
NanoBioArray (NBA) chip; DNA hybridization; Specificity; DNA microarray

vi
Dedication
I would like to dedicate this thesis to my parents and my wife Masoumeh, without whom
it would never have been accomplished.

vii
Acknowledgements
I would like to thank my senior supervisor, Dr. Paul C. H. Li for his support and
guidance throughout my research. I am deeply grateful for the great science I learned
from him, his continuous support and encouragement, and his remarkable patience in
supervising the group. I would never forget the wonderful moments that I experienced in
Dr. Li’s lab during the past few years.
I deeply appreciate the inspiration and valuable advices from my committee
supervisors- Dr. Byron Gates and Dr. Dipankar Sen. Their comments on various aspects
of my thesis have kept me thinking critically on the experimental design and results.
They also kindly allowed me to use their own lab resources.
I would like to thank Dr. Lin Wang and Mr. Janathan Li for training me on chip fabrication
and surface functionalization. I am also grateful to Dr. Naveed Gulzar for his helps on
SPR measurements, Jason Grigg for his help on gel electrophoresis experiments, and
Idah Pekcevic for her helps on obtaining the TEM images.
I also would like to thank past and present members of Dr. Li’s research group, without
their help much of this work wouldn’t have been possible.
viii
Table of Contents
Approval ............................................................................................................................... ii Partial Copyright Licence .................................................................................................... iii Abstract ............................................................................................................................... iv Dedication ........................................................................................................................... vi Acknowledgements ............................................................................................................ vii Table of Contents .............................................................................................................. viii List of Tables ........................................................................................................................ x List of Figures...................................................................................................................... xi List of Acronyms ................................................................................................................ xx List of Symbols ................................................................................................................ xxiii
Chapter 1. Introduction ..................................................................................................1 1.1. Detection of Single nucleotide polymorphisms (SNPs) .............................................1 1.2. DNA hybridization: ......................................................................................................3
1.2.1. Kinetics and thermodynamics of DNA hybridization .....................................4 1.2.2. The effect of a mismatched base-pair on kinetics of DNA
hybridization ............................................................................................... 10 1.3. Surface DNA hybridization....................................................................................... 11 1.4. DNA microarrays ...................................................................................................... 12
1.4.1. Challenges of DNA microarray technology ................................................ 14 1.4.2. Reliability of microarray data- the connection of specificity ....................... 15
1.5. Gold nanoparticle-based DNA sensing ................................................................... 20 1.6. DNA hybridization in NanoBioArray (NBA) chip ...................................................... 23 1.7. Research outline: ..................................................................................................... 27
Chapter 2. Experimental Section ............................................................................... 31 2.1. Materials ................................................................................................................... 31 2.2. Apparatus and equipment........................................................................................ 34 2.3. Microchip fabrication in the NanoBioArray chip ...................................................... 35
2.3.1. Fabrication of PDMS microchips ................................................................ 39 2.3.2. Surface modification of glass chip: ............................................................ 42 2.3.3. Probe array printing: ................................................................................... 43
2.4. DNA amplification and hybridization ........................................................................ 46 2.4.1. DNA Amplification and purification ............................................................. 46 2.4.2. Preparation of AuNP-loaded target strands ............................................... 47 2.4.3. DNA hybridization: ...................................................................................... 48 2.4.4. AuNP wash in CD-NBA chip. ..................................................................... 50 2.4.5. Fluorescence detection and data analysis................................................. 51
2.5. Surface plasmon resonance (SPR) spectroscopy .................................................. 52 2.6. DNA melting temperature measurement using absorbance spectroscopy ............ 57 2.7. Dynamic light scattering (DLS) measurements ....................................................... 57 2.8. Fluorescence quenching experiments to study the kinetics of DNA
adsorption on AuNPs ............................................................................................... 58
ix
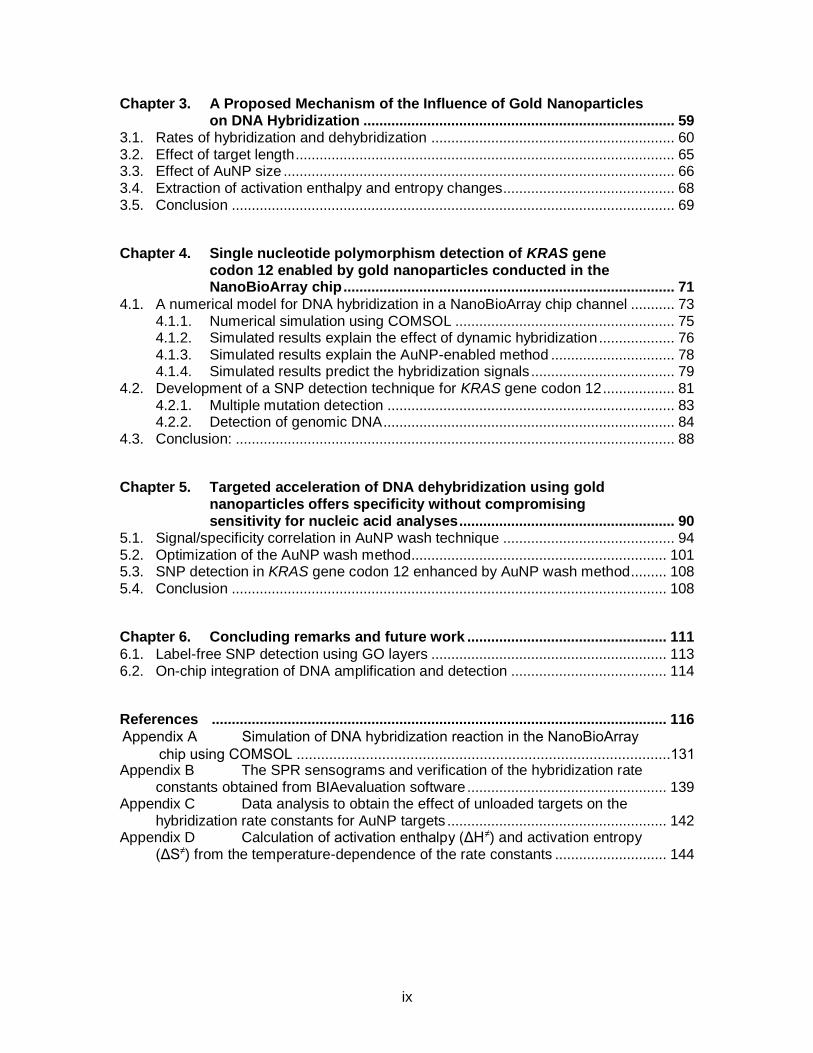
Chapter 3. A Proposed Mechanism of the Influence of Gold Nanoparticles on DNA Hybridization .............................................................................. 59
3.1. Rates of hybridization and dehybridization ............................................................. 60 3.2. Effect of target length ............................................................................................... 65 3.3. Effect of AuNP size .................................................................................................. 66 3.4. Extraction of activation enthalpy and entropy changes........................................... 68 3.5. Conclusion ............................................................................................................... 69
Chapter 4. Single nucleotide polymorphism detection of KRAS gene codon 12 enabled by gold nanoparticles conducted in the NanoBioArray chip ................................................................................... 71
4.1. A numerical model for DNA hybridization in a NanoBioArray chip channel ........... 73 4.1.1. Numerical simulation using COMSOL ....................................................... 75 4.1.2. Simulated results explain the effect of dynamic hybridization ................... 76 4.1.3. Simulated results explain the AuNP-enabled method ............................... 78 4.1.4. Simulated results predict the hybridization signals .................................... 79
4.2. Development of a SNP detection technique for KRAS gene codon 12 .................. 81 4.2.1. Multiple mutation detection ........................................................................ 83 4.2.2. Detection of genomic DNA ......................................................................... 84
4.3. Conclusion: .............................................................................................................. 88
Chapter 5. Targeted acceleration of DNA dehybridization using gold nanoparticles offers specificity without compromising sensitivity for nucleic acid analyses ...................................................... 90
5.1. Signal/specificity correlation in AuNP wash technique ........................................... 94 5.2. Optimization of the AuNP wash method................................................................ 101 5.3. SNP detection in KRAS gene codon 12 enhanced by AuNP wash method......... 108 5.4. Conclusion ............................................................................................................. 108
Chapter 6. Concluding remarks and future work .................................................. 111 6.1. Label-free SNP detection using GO layers ........................................................... 113 6.2. On-chip integration of DNA amplification and detection ....................................... 114
References .................................................................................................................. 116
Appendix B The SPR sensograms and verification of the hybridization rate constants obtained from BIAevaluation software .................................................. 139
Appendix C Data analysis to obtain the effect of unloaded targets on the hybridization rate constants for AuNP targets ....................................................... 142
Appendix D Calculation of activation enthalpy (ΔH≠) and activation entropy (ΔS≠) from the temperature-dependence of the rate constants ............................ 144
Appendix A Simulation of DNA hybridization reaction in the NanoBioArray chip using COMSOL ............................................................................................131
x
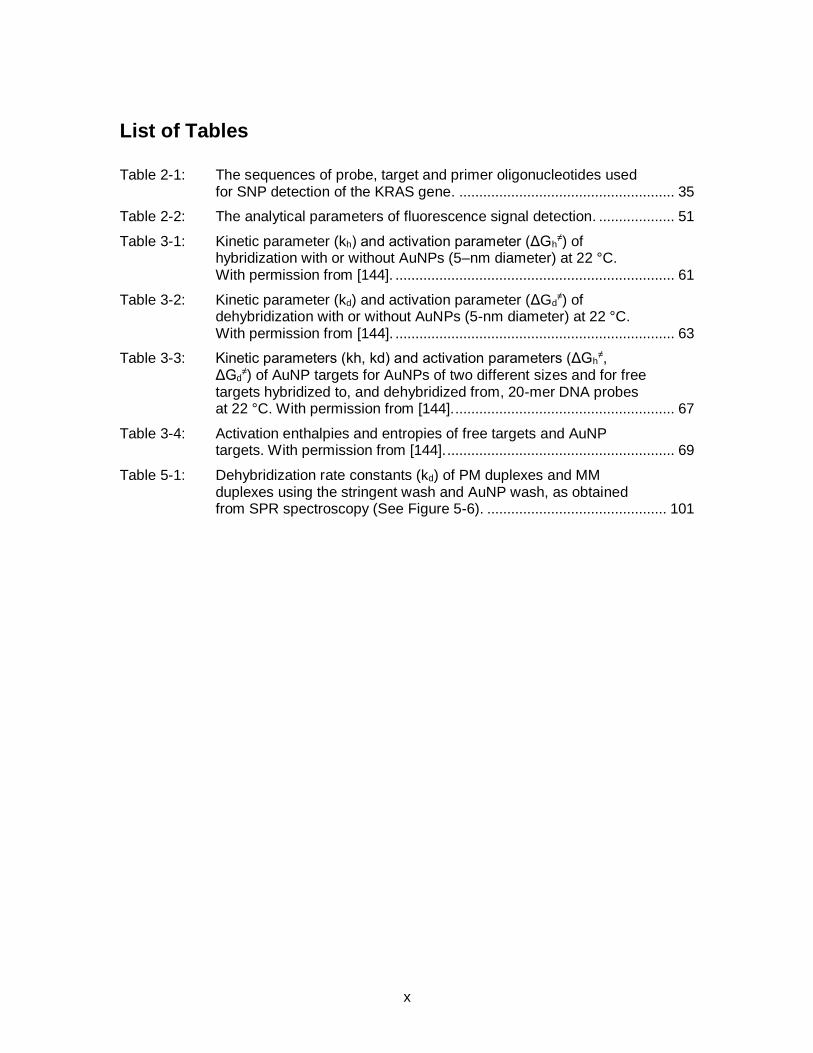
List of Tables
Table 2-1: The sequences of probe, target and primer oligonucleotides used for SNP detection of the KRAS gene. ...................................................... 35
Table 2-2: The analytical parameters of fluorescence signal detection. ................... 51
Table 3-1: Kinetic parameter (kh) and activation parameter (ΔGh≠) of
hybridization with or without AuNPs (5–nm diameter) at 22 °C. With permission from [144]. ...................................................................... 61
Table 3-2: Kinetic parameter (kd) and activation parameter (ΔGd≠) of
dehybridization with or without AuNPs (5-nm diameter) at 22 °C. With permission from [144]. ...................................................................... 63
Table 3-3: Kinetic parameters (kh, kd) and activation parameters (ΔGh≠,
ΔGd≠) of AuNP targets for AuNPs of two different sizes and for free
targets hybridized to, and dehybridized from, 20-mer DNA probes at 22 °C. With permission from [144]. ....................................................... 67
Table 3-4: Activation enthalpies and entropies of free targets and AuNP targets. With permission from [144]. ......................................................... 69
Table 5-1: Dehybridization rate constants (kd) of PM duplexes and MM duplexes using the stringent wash and AuNP wash, as obtained from SPR spectroscopy (See Figure 5-6). ............................................. 101
xi
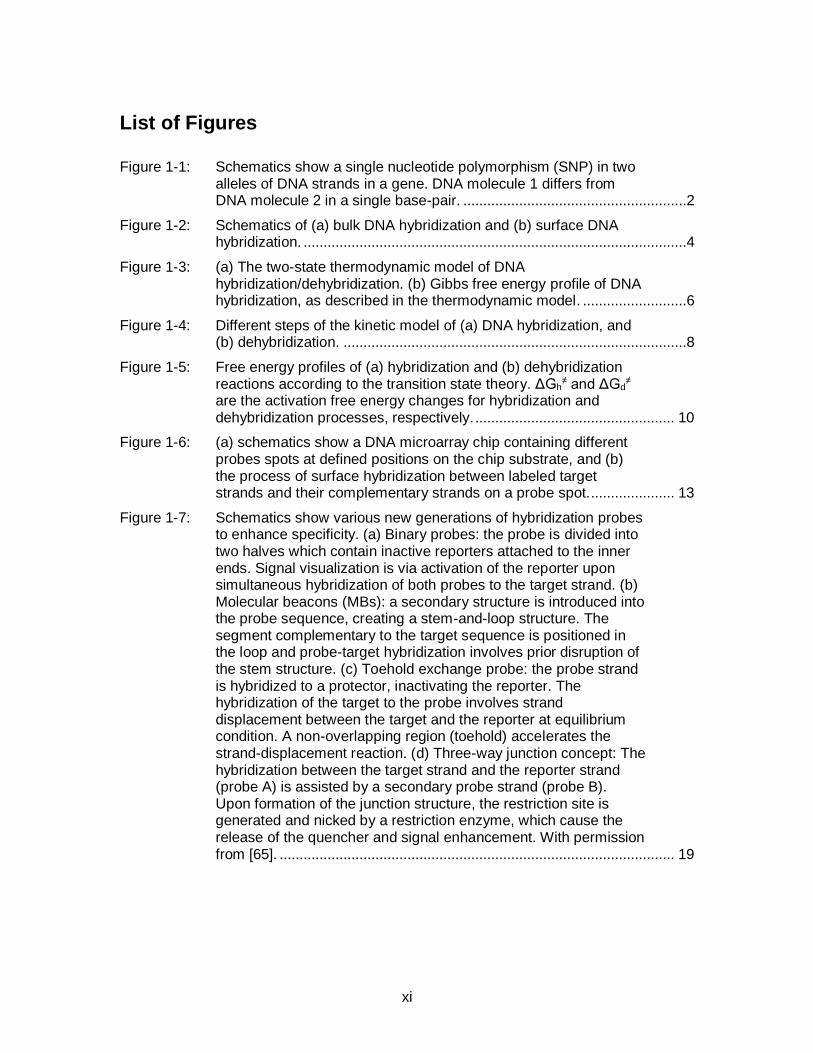
List of Figures
Figure 1-1: Schematics show a single nucleotide polymorphism (SNP) in two alleles of DNA strands in a gene. DNA molecule 1 differs from DNA molecule 2 in a single base-pair. ........................................................2
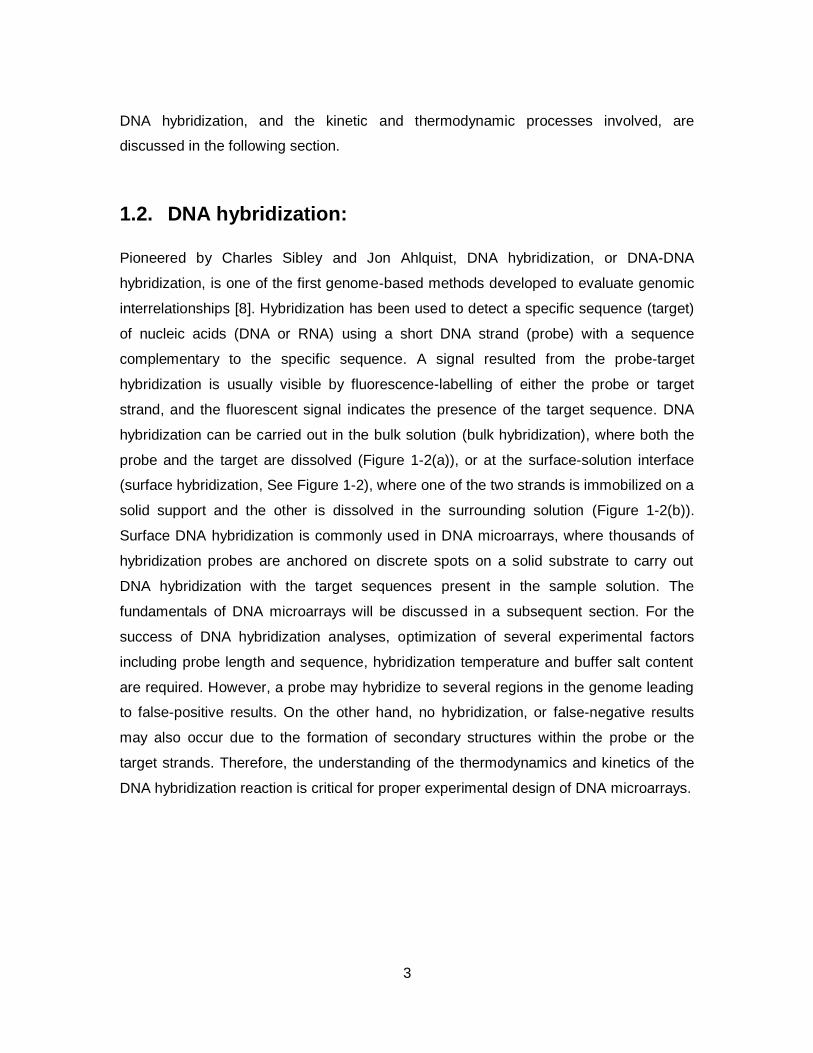
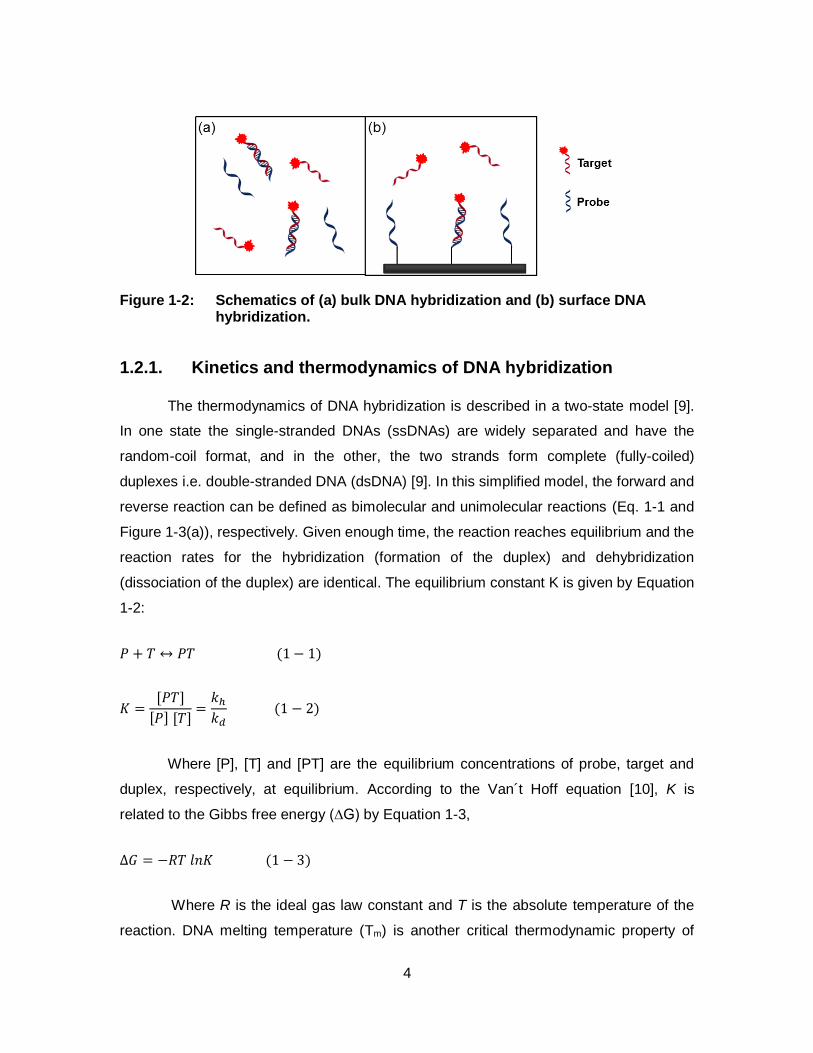
Figure 1-2: Schematics of (a) bulk DNA hybridization and (b) surface DNA hybridization. ................................................................................................4
Figure 1-3: (a) The two-state thermodynamic model of DNA hybridization/dehybridization. (b) Gibbs free energy profile of DNA hybridization, as described in the thermodynamic model. ..........................6
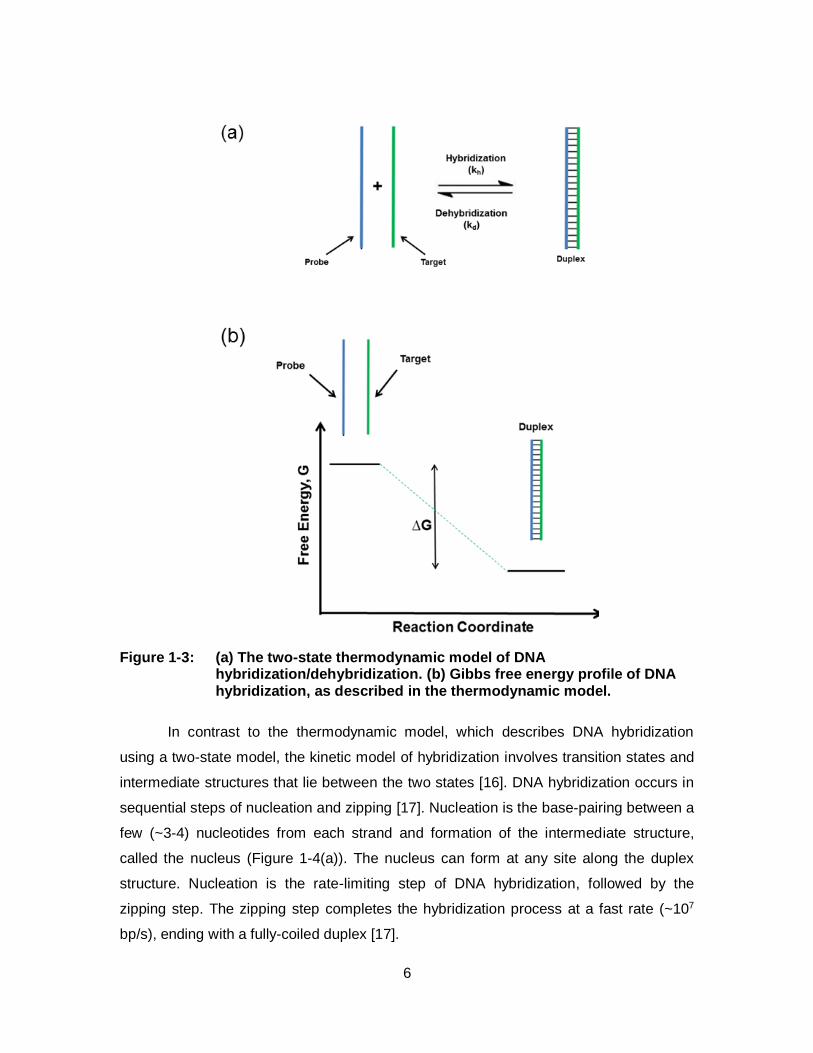
Figure 1-4: Different steps of the kinetic model of (a) DNA hybridization, and (b) dehybridization. ......................................................................................8
Figure 1-5: Free energy profiles of (a) hybridization and (b) dehybridization reactions according to the transition state theory. ΔGh
≠ and ΔGd≠
are the activation free energy changes for hybridization and dehybridization processes, respectively. .................................................. 10
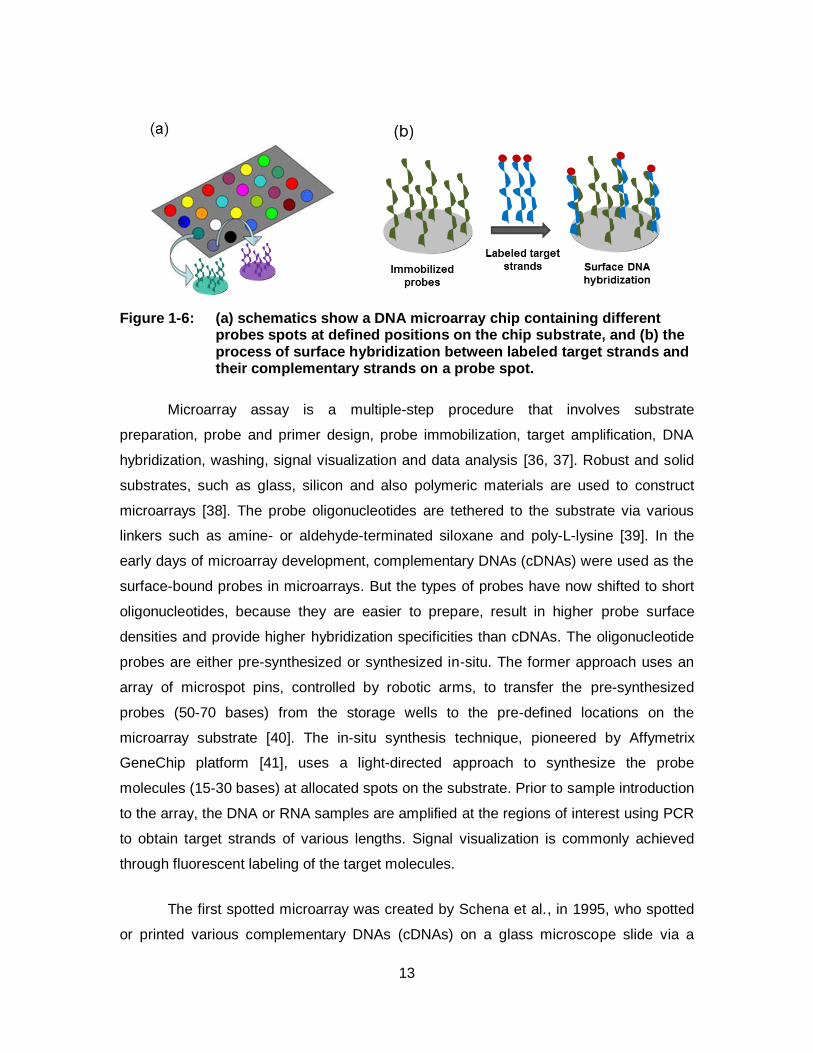
Figure 1-6: (a) schematics show a DNA microarray chip containing different probes spots at defined positions on the chip substrate, and (b) the process of surface hybridization between labeled target strands and their complementary strands on a probe spot...................... 13
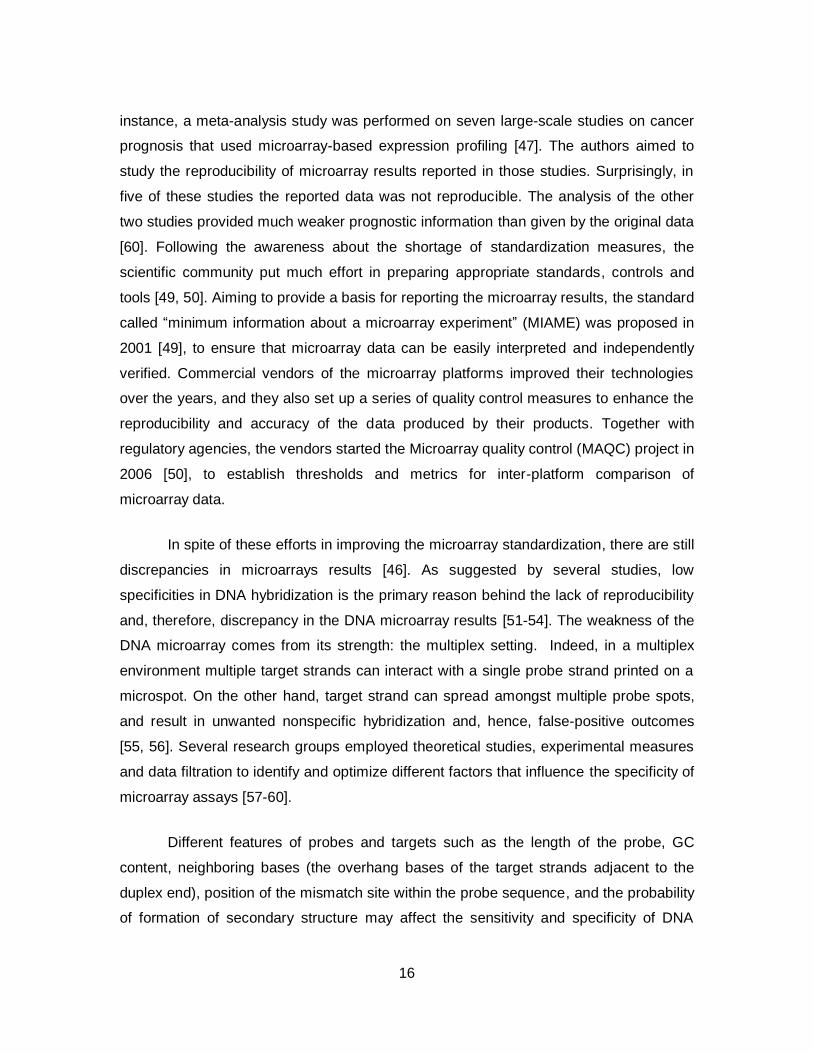
Figure 1-7: Schematics show various new generations of hybridization probes to enhance specificity. (a) Binary probes: the probe is divided into two halves which contain inactive reporters attached to the inner ends. Signal visualization is via activation of the reporter upon simultaneous hybridization of both probes to the target strand. (b) Molecular beacons (MBs): a secondary structure is introduced into the probe sequence, creating a stem-and-loop structure. The segment complementary to the target sequence is positioned in the loop and probe-target hybridization involves prior disruption of the stem structure. (c) Toehold exchange probe: the probe strand is hybridized to a protector, inactivating the reporter. The hybridization of the target to the probe involves strand displacement between the target and the reporter at equilibrium condition. A non-overlapping region (toehold) accelerates the strand-displacement reaction. (d) Three-way junction concept: The hybridization between the target strand and the reporter strand (probe A) is assisted by a secondary probe strand (probe B). Upon formation of the junction structure, the restriction site is generated and nicked by a restriction enzyme, which cause the release of the quencher and signal enhancement. With permission from [65]. ................................................................................................... 19
xii
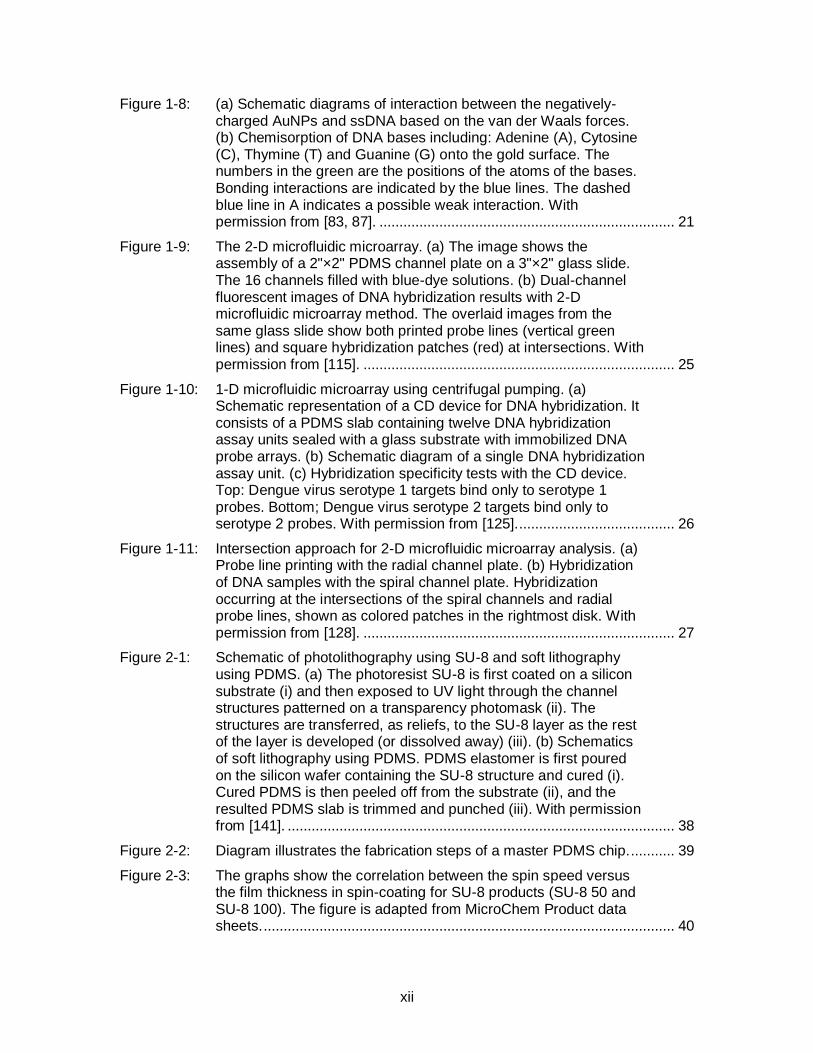
Figure 1-8: (a) Schematic diagrams of interaction between the negatively-charged AuNPs and ssDNA based on the van der Waals forces. (b) Chemisorption of DNA bases including: Adenine (A), Cytosine (C), Thymine (T) and Guanine (G) onto the gold surface. The numbers in the green are the positions of the atoms of the bases. Bonding interactions are indicated by the blue lines. The dashed blue line in A indicates a possible weak interaction. With permission from [83, 87]. .......................................................................... 21
Figure 1-9: The 2-D microfluidic microarray. (a) The image shows the assembly of a 2"×2" PDMS channel plate on a 3"×2" glass slide. The 16 channels filled with blue-dye solutions. (b) Dual-channel fluorescent images of DNA hybridization results with 2-D microfluidic microarray method. The overlaid images from the same glass slide show both printed probe lines (vertical green lines) and square hybridization patches (red) at intersections. With permission from [115]. .............................................................................. 25
Figure 1-10: 1-D microfluidic microarray using centrifugal pumping. (a) Schematic representation of a CD device for DNA hybridization. It consists of a PDMS slab containing twelve DNA hybridization assay units sealed with a glass substrate with immobilized DNA probe arrays. (b) Schematic diagram of a single DNA hybridization assay unit. (c) Hybridization specificity tests with the CD device. Top: Dengue virus serotype 1 targets bind only to serotype 1 probes. Bottom; Dengue virus serotype 2 targets bind only to serotype 2 probes. With permission from [125]........................................ 26
Figure 1-11: Intersection approach for 2-D microfluidic microarray analysis. (a) Probe line printing with the radial channel plate. (b) Hybridization of DNA samples with the spiral channel plate. Hybridization occurring at the intersections of the spiral channels and radial probe lines, shown as colored patches in the rightmost disk. With permission from [128]. .............................................................................. 27
Figure 2-1: Schematic of photolithography using SU-8 and soft lithography using PDMS. (a) The photoresist SU-8 is first coated on a silicon substrate (i) and then exposed to UV light through the channel structures patterned on a transparency photomask (ii). The structures are transferred, as reliefs, to the SU-8 layer as the rest of the layer is developed (or dissolved away) (iii). (b) Schematics of soft lithography using PDMS. PDMS elastomer is first poured on the silicon wafer containing the SU-8 structure and cured (i). Cured PDMS is then peeled off from the substrate (ii), and the resulted PDMS slab is trimmed and punched (iii). With permission from [141]. ................................................................................................. 38
Figure 2-2: Diagram illustrates the fabrication steps of a master PDMS chip. ........... 39
Figure 2-3: The graphs show the correlation between the spin speed versus the film thickness in spin-coating for SU-8 products (SU-8 50 and SU-8 100). The figure is adapted from MicroChem Product data sheets. ....................................................................................................... 40
xiii
Figure 2-4: The image shows the transfer of straight channels from photomask (a) to master mould (b) and then to the straight-channel PDMS chip (c). the straight channels are 200 µm wide and 35 µm deep. ....................................................................................... 41
Figure 2-5: The image shows transfer of the pattern of radial channels from photomask (a) to master mould (b) and then to the radial-channel PDMS chip (c). The radial channels are 200 µm wide and 35 µm deep. ......................................................................................................... 41
Figure 2-6: The image shows transfer of the pattern of spiral channels from photomask (a) to master mould (b) and then to the spiral-channel PDMS chip (c). The spiral channels are 100 µm wide and 35 µm deep. ......................................................................................................... 42
Figure 2-7: Procedure to prepare aldehyde-functionalized glass chips. The steps 1, 2 and 3 show piranha cleaning, APTES functionalization and glutaraldehyde functionalization, respectively. .................................. 43
Figure 2-8: (a) The scanned image and (b) the graph of immobilization signal for a 20-mer probe oligonucleotide in the straight channels of the NBA chip. For immobilization, different concentrations of probe solutions (5-100 µM) were incubated in the radial channels for 30 min. In order to visualize the immobilization signals the probe molecules were anchored to the surface via an amine group at the 5’-end and were Cy5-labeled at the 3’-end. The error bars show the standard deviation of 3 replicates. ...................................................... 44
Figure 2-9: The image of the rotating platform used for spinning the CD-NBA chip. ........................................................................................................... 45
Figure 2-10: (a) The scanned image and (b) the graph of immobilization signal for a 20-mer probe oligonucleotide in the radial channels of CD-NBA chip. For immobilization, the probe solutions (25 µM) were incubated in the radial channels for 5 to 60 min. The error bars show the standard deviations of 3 replicates. .......................................... 45
Figure 2-11: Transmission electron microscopy (TEM) images of 5-nm diameter gold nanoparticles in aqueous solution (A), these pristine AuNPs in the hybridization buffer containing 0.15 M NaCl (B), and 5-nm AuNPs that have been conjugated with 60-mer target oligonucleotides prior to dispersion in the same buffer solution (C). All scale bars are 50 nm in length. The optical images of the 3 respective solutions are shown below their TEM images. ....................... 48
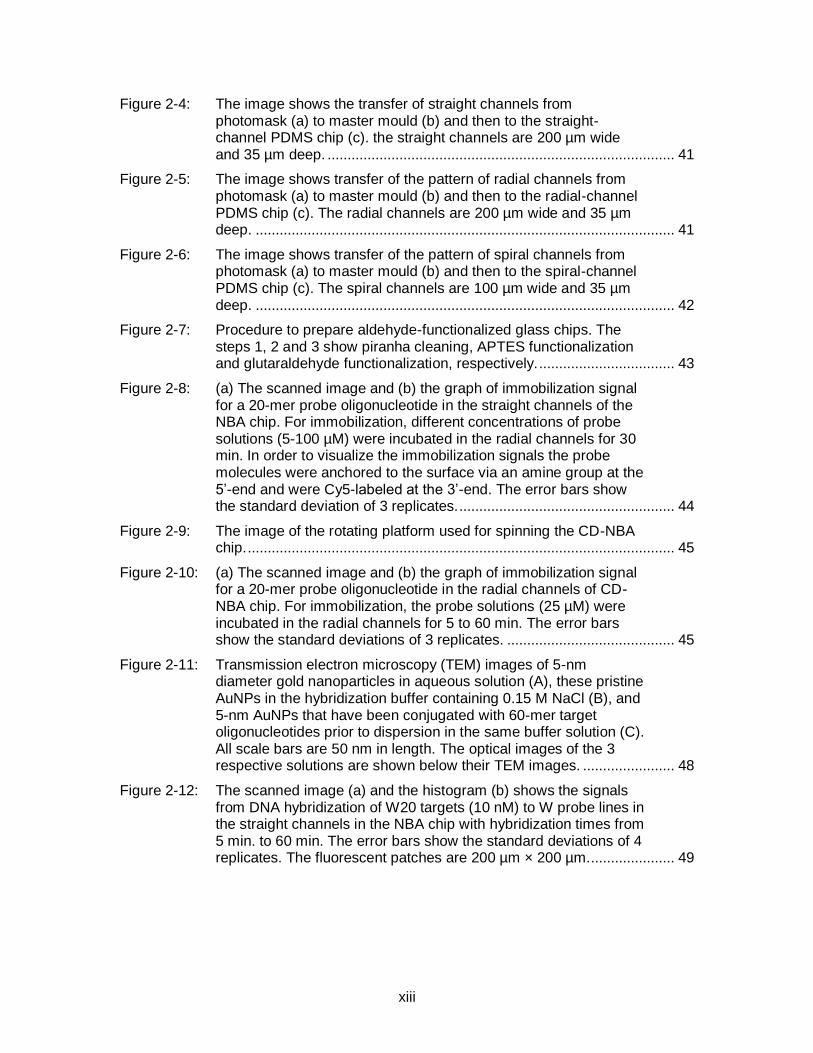
Figure 2-12: The scanned image (a) and the histogram (b) shows the signals from DNA hybridization of W20 targets (10 nM) to W probe lines in the straight channels in the NBA chip with hybridization times from 5 min. to 60 min. The error bars show the standard deviations of 4 replicates. The fluorescent patches are 200 µm × 200 µm...................... 49
xiv
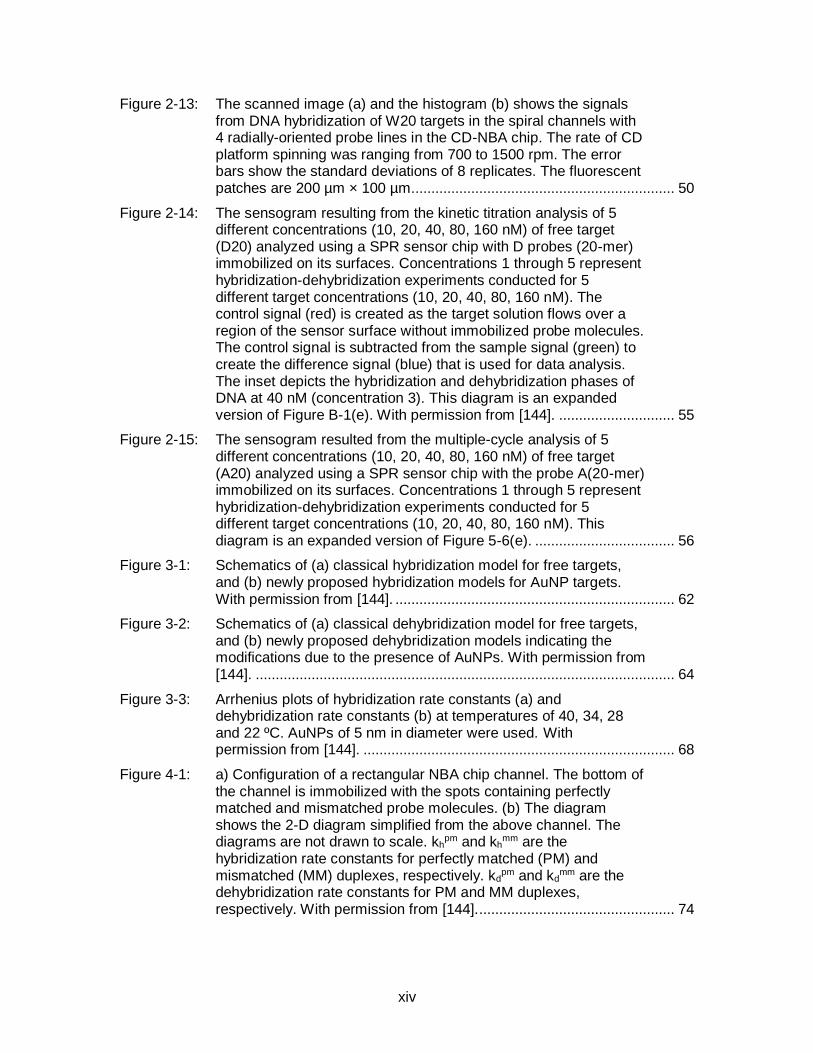
Figure 2-13: The scanned image (a) and the histogram (b) shows the signals from DNA hybridization of W20 targets in the spiral channels with 4 radially-oriented probe lines in the CD-NBA chip. The rate of CD platform spinning was ranging from 700 to 1500 rpm. The error bars show the standard deviations of 8 replicates. The fluorescent patches are 200 µm × 100 µm.................................................................. 50
Figure 2-14: The sensogram resulting from the kinetic titration analysis of 5 different concentrations (10, 20, 40, 80, 160 nM) of free target (D20) analyzed using a SPR sensor chip with D probes (20-mer) immobilized on its surfaces. Concentrations 1 through 5 represent hybridization-dehybridization experiments conducted for 5 different target concentrations (10, 20, 40, 80, 160 nM). The control signal (red) is created as the target solution flows over a region of the sensor surface without immobilized probe molecules. The control signal is subtracted from the sample signal (green) to create the difference signal (blue) that is used for data analysis. The inset depicts the hybridization and dehybridization phases of DNA at 40 nM (concentration 3). This diagram is an expanded version of Figure B-1(e). With permission from [144]. ............................. 55
Figure 2-15: The sensogram resulted from the multiple-cycle analysis of 5 different concentrations (10, 20, 40, 80, 160 nM) of free target (A20) analyzed using a SPR sensor chip with the probe A(20-mer) immobilized on its surfaces. Concentrations 1 through 5 represent hybridization-dehybridization experiments conducted for 5 different target concentrations (10, 20, 40, 80, 160 nM). This diagram is an expanded version of Figure 5-6(e). ................................... 56
Figure 3-1: Schematics of (a) classical hybridization model for free targets, and (b) newly proposed hybridization models for AuNP targets. With permission from [144]. ...................................................................... 62
Figure 3-2: Schematics of (a) classical dehybridization model for free targets, and (b) newly proposed dehybridization models indicating the modifications due to the presence of AuNPs. With permission from [144]. ......................................................................................................... 64
Figure 3-3: Arrhenius plots of hybridization rate constants (a) and dehybridization rate constants (b) at temperatures of 40, 34, 28 and 22 ºC. AuNPs of 5 nm in diameter were used. With permission from [144]. .............................................................................. 68
Figure 4-1: a) Configuration of a rectangular NBA chip channel. The bottom of the channel is immobilized with the spots containing perfectly matched and mismatched probe molecules. (b) The diagram shows the 2-D diagram simplified from the above channel. The diagrams are not drawn to scale. kh
pm and khmm are the
hybridization rate constants for perfectly matched (PM) and mismatched (MM) duplexes, respectively. kd
pm and kdmm are the
dehybridization rate constants for PM and MM duplexes, respectively. With permission from [144].................................................. 74
xv
Figure 4-2: The simulated hybridization signals and the concentration profile at 22 °C (a, c) and 40 °C (b, d). The dynamic hybridization was simulated at flow rate of 0.1 µL/min. for 10 min. The static hybridization was simulated for 30 min. In both cases the applied target concentration was 10 nM and volume was 1 µL. ........................... 78
Figure 4-3: (a) Simulated hybridization fraction and (b) predicted hybridization plotted against the hybridization time that resulted from D20 targets (free targets at 22°C and 40°C, and AuNP targets at 22°C). Hybridization fractions are the fractions of perfectly matched (PM) probes that form duplexes with the targets, and specificities (dashed lines) are derived from the ratio of PM duplexes to mismatched (MM) duplexes. With permission from [144]. ......................................................................................................... 79
Figure 4-4: Comparison of predicted and experimentally measured hybridization fractions from the formation of surface-bound DNA duplexes. Scanned fluorescence images of the NanoBioArray chips contain spots associated with hybridization of W20 and D20 targets at 20 min. (with or without 5-nm AuNPs) (a). The histograms (b) and (c) correspond to the hybridization fraction from W20 and D20 targets, respectively. Histograms created from experimentally derived fluorescence signal intensities are shown in the columns (background-corrected and averaged between two independent spots) and plotted in comparison to the signals predicted from the hybridization model (lines). With permission from [144]. ................................................................................................. 80
Figure 4-5: (a) Histogram resulted from the hybridization signals resulted from free targets (60-mer) and targets conjugated with AuNPs of different sizes (5, 10, 12 and 20 nm in diameter). The numbers on top of the histogram bars are specificities obtained using Eq. 4-6. A value of 1 for specificity means no discrimination between PM and MM probes. (b) Histogram shows hybridization signals from free targets as well as from 60-mer targets loaded on 5-nm AuNPs with different DNA-to-AuNP (DTA) ratios. With permission from [166]. ......................................................................................................... 82
Figure 4-6: Scanned images and the corresponding histograms (below each image) resulted from hybridization of free targets at (a) 22 °C, (b) hybridization of AuNP targets at 22 °C and (c) hybridization of free targets at 55 °C. The 60-mer target DNAs were loaded on 5-nm AuNPs at DTA of 1:1. Error bars show the standard deviation of 3 measurements. The number above each column shows the specificity (See Eq. 4-7). For other conditions see Figure 4-4. With permission from [166]. .............................................................................. 84
Figure 4-7: Scanned image showing half of the 16x16 NBA chip (a), the inset inside the blue box (b) and resulted histogram (c) of free target (60-mer) and AuNP target (5 nm) based on 60 min. of hybridization at 22 ºC. Error bars are standard deviation from 3-replicate measurements. For other conditions see Figure 4-4. With permission from [166]. .............................................................................. 86
xvi
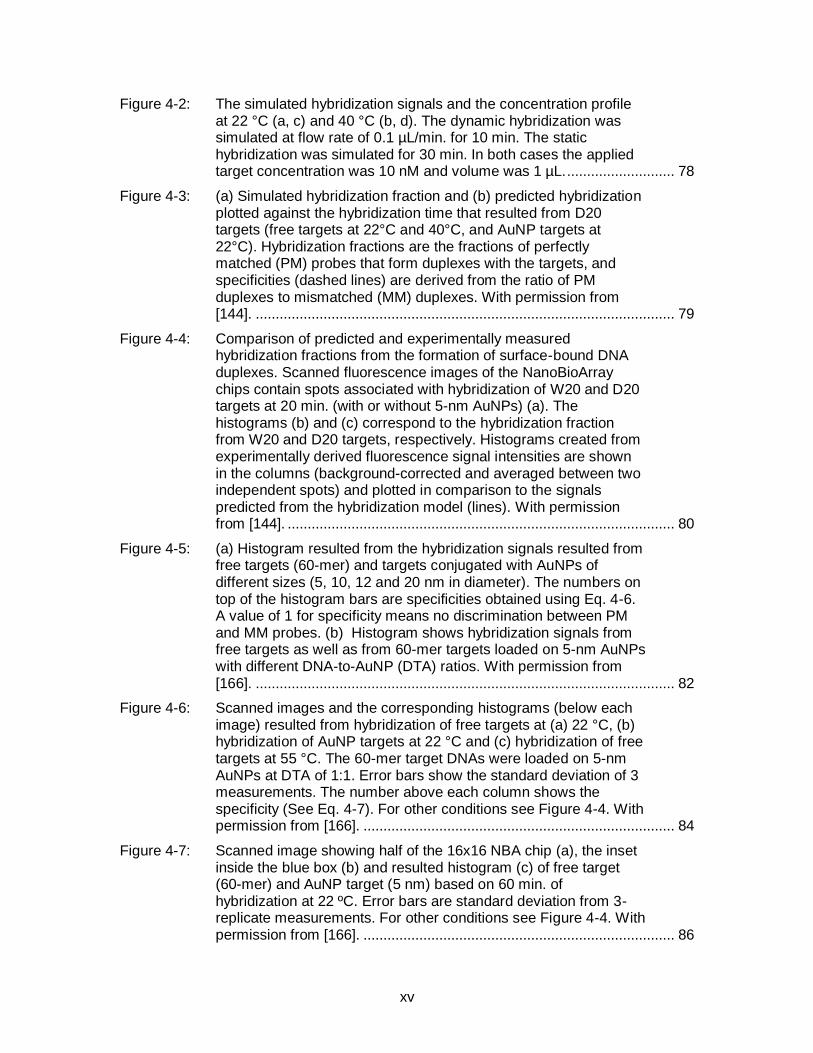
Figure 4-8: DNA amplification by asymmetric PCR. Scanned image (a) and the corresponding histogram (b) resulted from hybridization of PCR products amplified from genomic DNAs with 100% wild-type KRAS alleles (W’) at 22 °C for 60 min. on the NBA chip. Asymmetric PCR was performed using different concentrations of the reverse primer (0.05, 0.1, 0.2, 0.3, 0.4, 0.5 µM) with a constant forward primer concentration of 0.5 µM. All the targets (6 nM) are previously loaded on the 5-nm AuNPs (10 nM). In the histogram, the column bars show the average of signal intensities of the spots, measured at the intersection of horizontal probe lines and the vertical target lines, and the true positive binding signals of W’ are represented by the hatched bar. Error bars show the standard deviation of 3 measurements. The number above each column shows the specificity which is determined by dividing the intensity of the PM spots (W’ to W) by that of the 3 MM spots (W’ to A, V and D). With permission from [166]. ......................................................... 87
Figure 4-9: Scanned image and the corresponding histogram resulted from hybridization of PCR products amplified from genomic DNAs with different KRAS allele compositions (one sample is 100% wild-type and the other is 50% wild-type plus 50% G12D mutant). The PCR amplification was performed with a reverse primer concentration of 0.2 µM. The targets are either free or loaded on 5-nm AuNPs. Error bars are from 3 replicate measurements. For other conditions see Figure 4-8. With permission from [166]. ........................... 88
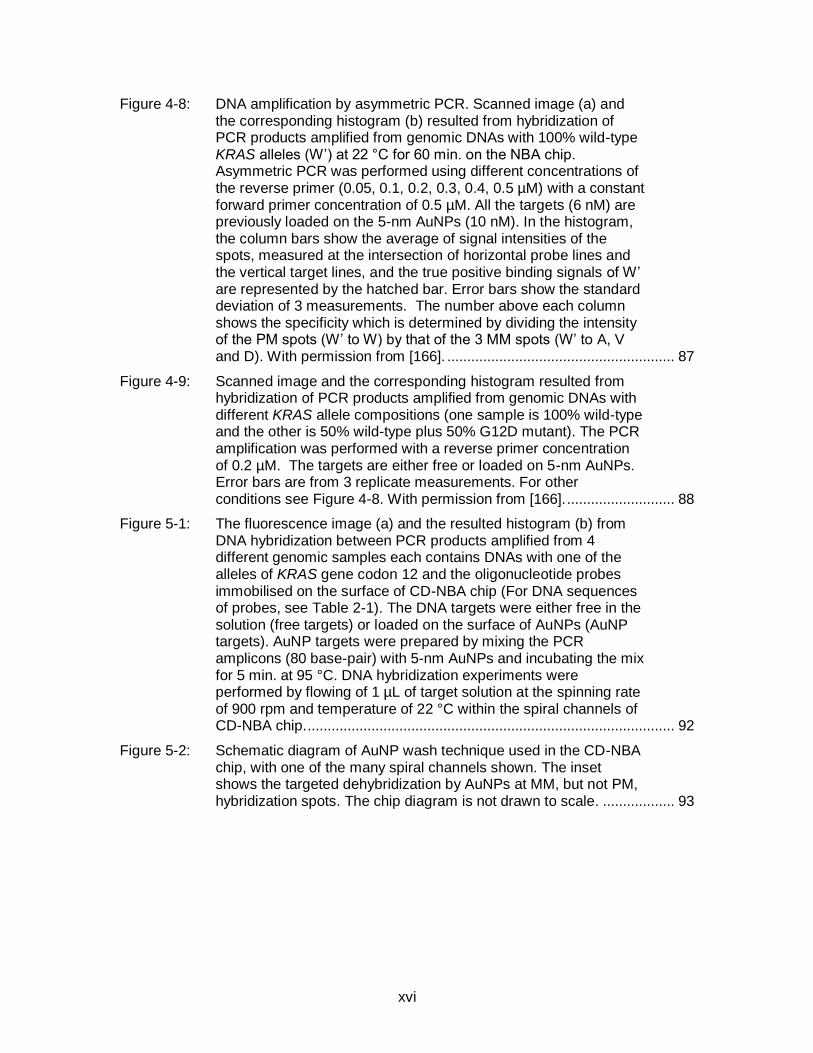
Figure 5-1: The fluorescence image (a) and the resulted histogram (b) from DNA hybridization between PCR products amplified from 4 different genomic samples each contains DNAs with one of the alleles of KRAS gene codon 12 and the oligonucleotide probes immobilised on the surface of CD-NBA chip (For DNA sequences of probes, see Table 2-1). The DNA targets were either free in the solution (free targets) or loaded on the surface of AuNPs (AuNP targets). AuNP targets were prepared by mixing the PCR amplicons (80 base-pair) with 5-nm AuNPs and incubating the mix for 5 min. at 95 °C. DNA hybridization experiments were performed by flowing of 1 µL of target solution at the spinning rate of 900 rpm and temperature of 22 °C within the spiral channels of CD-NBA chip. ............................................................................................ 92
Figure 5-2: Schematic diagram of AuNP wash technique used in the CD-NBA chip, with one of the many spiral channels shown. The inset shows the targeted dehybridization by AuNPs at MM, but not PM, hybridization spots. The chip diagram is not drawn to scale. .................. 93
xvii
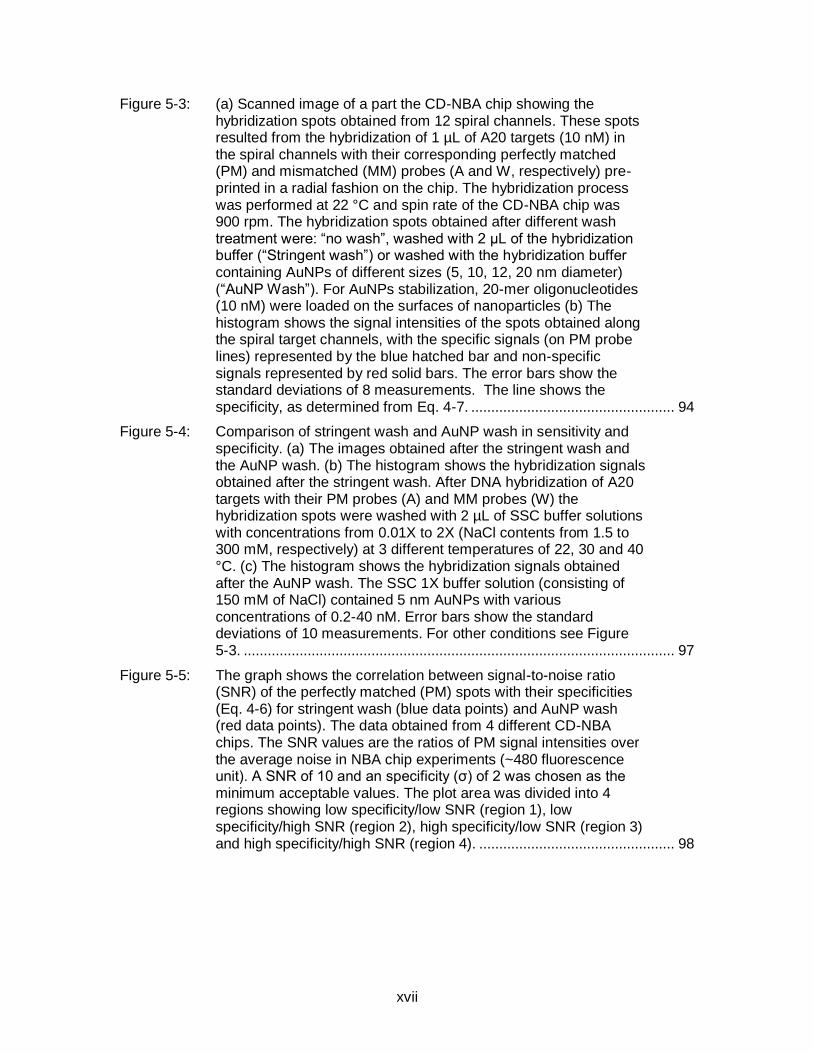
Figure 5-3: (a) Scanned image of a part the CD-NBA chip showing the hybridization spots obtained from 12 spiral channels. These spots resulted from the hybridization of 1 µL of A20 targets (10 nM) in the spiral channels with their corresponding perfectly matched (PM) and mismatched (MM) probes (A and W, respectively) pre-printed in a radial fashion on the chip. The hybridization process was performed at 22 °C and spin rate of the CD-NBA chip was 900 rpm. The hybridization spots obtained after different wash treatment were: “no wash”, washed with 2 µL of the hybridization buffer (“Stringent wash”) or washed with the hybridization buffer containing AuNPs of different sizes (5, 10, 12, 20 nm diameter) (“AuNP Wash”). For AuNPs stabilization, 20-mer oligonucleotides (10 nM) were loaded on the surfaces of nanoparticles (b) The histogram shows the signal intensities of the spots obtained along the spiral target channels, with the specific signals (on PM probe lines) represented by the blue hatched bar and non-specific signals represented by red solid bars. The error bars show the standard deviations of 8 measurements. The line shows the specificity, as determined from Eq. 4-7. ................................................... 94
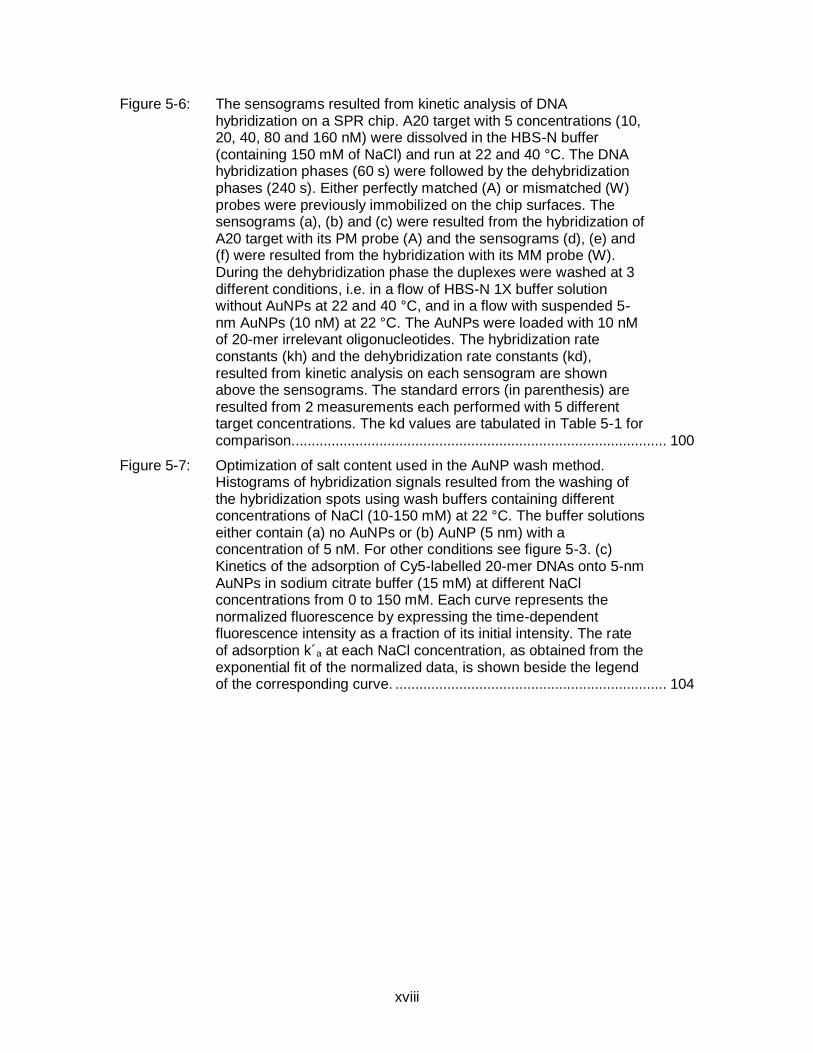
Figure 5-4: Comparison of stringent wash and AuNP wash in sensitivity and specificity. (a) The images obtained after the stringent wash and the AuNP wash. (b) The histogram shows the hybridization signals obtained after the stringent wash. After DNA hybridization of A20 targets with their PM probes (A) and MM probes (W) the hybridization spots were washed with 2 µL of SSC buffer solutions with concentrations from 0.01X to 2X (NaCl contents from 1.5 to 300 mM, respectively) at 3 different temperatures of 22, 30 and 40 °C. (c) The histogram shows the hybridization signals obtained after the AuNP wash. The SSC 1X buffer solution (consisting of 150 mM of NaCl) contained 5 nm AuNPs with various concentrations of 0.2-40 nM. Error bars show the standard deviations of 10 measurements. For other conditions see Figure 5-3. ............................................................................................................ 97
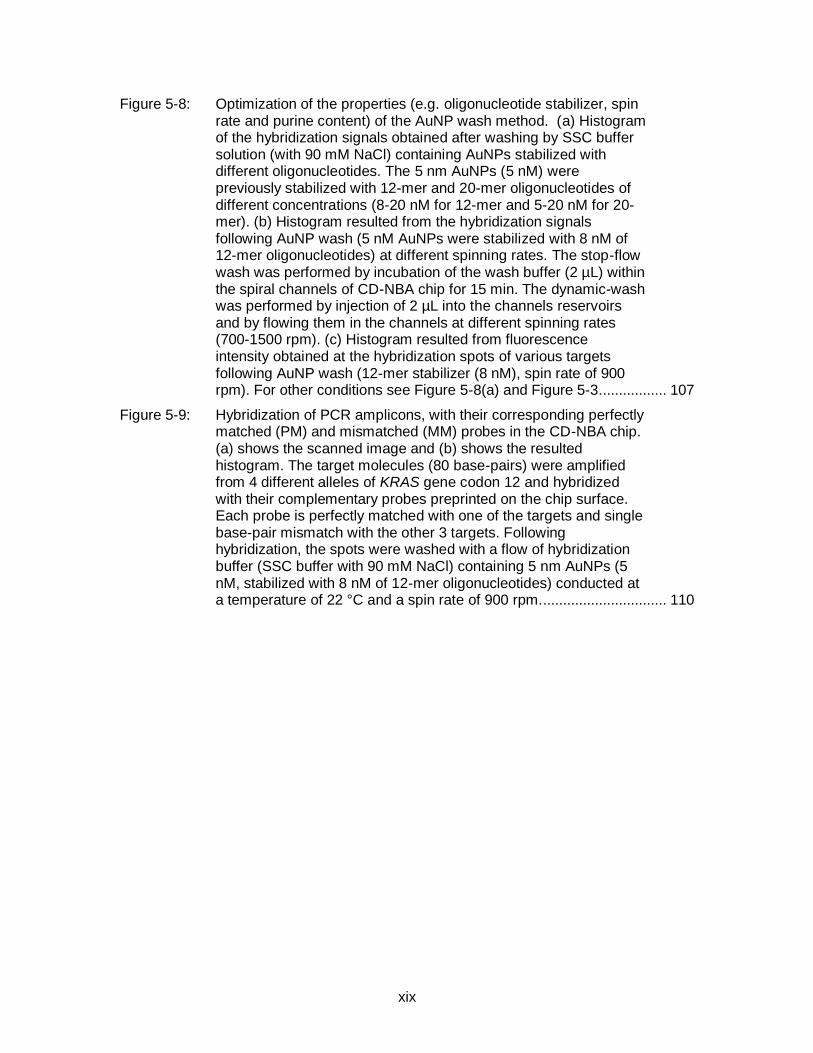
Figure 5-5: The graph shows the correlation between signal-to-noise ratio (SNR) of the perfectly matched (PM) spots with their specificities (Eq. 4-6) for stringent wash (blue data points) and AuNP wash (red data points). The data obtained from 4 different CD-NBA chips. The SNR values are the ratios of PM signal intensities over the average noise in NBA chip experiments (~480 fluorescence unit). A SNR of 10 and an specificity (σ) of 2 was chosen as the minimum acceptable values. The plot area was divided into 4 regions showing low specificity/low SNR (region 1), low specificity/high SNR (region 2), high specificity/low SNR (region 3) and high specificity/high SNR (region 4). ................................................. 98
xviii
Figure 5-6: The sensograms resulted from kinetic analysis of DNA hybridization on a SPR chip. A20 target with 5 concentrations (10, 20, 40, 80 and 160 nM) were dissolved in the HBS-N buffer (containing 150 mM of NaCl) and run at 22 and 40 °C. The DNA hybridization phases (60 s) were followed by the dehybridization phases (240 s). Either perfectly matched (A) or mismatched (W) probes were previously immobilized on the chip surfaces. The sensograms (a), (b) and (c) were resulted from the hybridization of A20 target with its PM probe (A) and the sensograms (d), (e) and (f) were resulted from the hybridization with its MM probe (W). During the dehybridization phase the duplexes were washed at 3 different conditions, i.e. in a flow of HBS-N 1X buffer solution without AuNPs at 22 and 40 °C, and in a flow with suspended 5-nm AuNPs (10 nM) at 22 °C. The AuNPs were loaded with 10 nM of 20-mer irrelevant oligonucleotides. The hybridization rate constants (kh) and the dehybridization rate constants (kd), resulted from kinetic analysis on each sensogram are shown above the sensograms. The standard errors (in parenthesis) are resulted from 2 measurements each performed with 5 different target concentrations. The kd values are tabulated in Table 5-1 for comparison.............................................................................................. 100
Figure 5-7: Optimization of salt content used in the AuNP wash method. Histograms of hybridization signals resulted from the washing of the hybridization spots using wash buffers containing different concentrations of NaCl (10-150 mM) at 22 °C. The buffer solutions either contain (a) no AuNPs or (b) AuNP (5 nm) with a concentration of 5 nM. For other conditions see figure 5-3. (c) Kinetics of the adsorption of Cy5-labelled 20-mer DNAs onto 5-nm AuNPs in sodium citrate buffer (15 mM) at different NaCl concentrations from 0 to 150 mM. Each curve represents the normalized fluorescence by expressing the time-dependent fluorescence intensity as a fraction of its initial intensity. The rate of adsorption k´a at each NaCl concentration, as obtained from the exponential fit of the normalized data, is shown beside the legend of the corresponding curve. .................................................................... 104
xix
Figure 5-8: Optimization of the properties (e.g. oligonucleotide stabilizer, spin rate and purine content) of the AuNP wash method. (a) Histogram of the hybridization signals obtained after washing by SSC buffer solution (with 90 mM NaCl) containing AuNPs stabilized with different oligonucleotides. The 5 nm AuNPs (5 nM) were previously stabilized with 12-mer and 20-mer oligonucleotides of different concentrations (8-20 nM for 12-mer and 5-20 nM for 20-mer). (b) Histogram resulted from the hybridization signals following AuNP wash (5 nM AuNPs were stabilized with 8 nM of 12-mer oligonucleotides) at different spinning rates. The stop-flow wash was performed by incubation of the wash buffer (2 µL) within the spiral channels of CD-NBA chip for 15 min. The dynamic-wash was performed by injection of 2 µL into the channels reservoirs and by flowing them in the channels at different spinning rates (700-1500 rpm). (c) Histogram resulted from fluorescence intensity obtained at the hybridization spots of various targets following AuNP wash (12-mer stabilizer (8 nM), spin rate of 900 rpm). For other conditions see Figure 5-8(a) and Figure 5-3................. 107
Figure 5-9: Hybridization of PCR amplicons, with their corresponding perfectly matched (PM) and mismatched (MM) probes in the CD-NBA chip. (a) shows the scanned image and (b) shows the resulted histogram. The target molecules (80 base-pairs) were amplified from 4 different alleles of KRAS gene codon 12 and hybridized with their complementary probes preprinted on the chip surface. Each probe is perfectly matched with one of the targets and single base-pair mismatch with the other 3 targets. Following hybridization, the spots were washed with a flow of hybridization buffer (SSC buffer with 90 mM NaCl) containing 5 nm AuNPs (5 nM, stabilized with 8 nM of 12-mer oligonucleotides) conducted at a temperature of 22 °C and a spin rate of 900 rpm................................ 110
xx
List of Acronyms
1-D One-dimensional
2-D Two-dimensional
A’ 80 bp amplicons resulted from PCR amplification of genomic DNA with sequence of G12A mutant of KRAS gene.
A60 60-mer oligonucleotide probe with the DNA sequence of G12A allele of KRAS gene. The 5’-end of the sequence is labelled by biotin group.
AB 21-mer oligonucleotide probe with a DNA sequence complementary to the DNA sequence of fungal pathogen Botrytis cinerea. The 5’-end of the sequence is labelled by an amine group linked with a –(CH2)12– spacer.
APTES 3-Aminopropyltriethoxysilane
AuNP Gold nanoparticle
AuNP target DNA targets loaded on the surfaces of AuNPs
bp(s) Base pair(s)
CD Compact disk
cDNA Complementary DNA synthesized from a messenger RNA template
CD-NBA The CD-like NanoBioArray chip
CTAB Cetyl-3-methylammonium bromide
Cy5 A fluorescent cyanine dye. The number of methane (CH) groups in its polymethine chain is 5.
D 20-mer oligonucleotide probe with a DNA sequence complementary to the G12D allele of KRAS gene. The 5’-end of the sequence is labelled by an amine group linked with a –(CH2)12– spacer.
D’ 80 bp amplicons resulted from PCR amplification of genomic DNA with sequence of G12D mutant of KRAS gene.
D20 20-mer oligonucleotide probe with the DNA sequence of G12A allele of KRAS gene. The 5’-end of the sequence is labelled by biotin group.
D60 60-mer oligonucleotide probe with the DNA sequence of G12D allele of KRAS gene. The 5’-end of the sequence is labelled by biotin group.
DI deionized
DLS Dynamic light scattering
DNA Deoxyribonucleic acid
dsDNA Double-stranded DNA

xxi
EDC 1-Ethyl-3-(3-dimethylaminopropyl)carbodiimide
Free target DNA targets free in the solution
FRET Förster resonance energy transfer
G12A The G12A mutation results in an amino acid substitution at position 12 in KRAS, from a glycine (G) to an alanine (A).
G12A The G12V mutation results in an amino acid substitution at position 12 in KRAS, from a glycine (G) to a valine (V).
G12D The G12D mutation results in an amino acid substitution at codon 12 in KRAS, from a glycine (G) to an aspartic acid (D).
GO Graphene oxide
HBS-N HEPES buffer saline
HDA Helicase-dependent amplification
KRAS V-Ki-ras2 Kirsten rat sarcoma viral oncogene homolog
MB Molecular beacon
MM Mismatched
NBA NanoBioArray chip
NHS N-Hydroxysuccinimide
Oligo(s) Oligonucleotide(s)
PBS Phosphate Buffered Saline
PCR Polymerase chain reaction
PDMS Polydimethylsiloxane
PM Perfect match
POC Point of care
PBS Phosphate buffer saline
HEPES 4-(2-hydroxyethyl)-1-piperazineethanesulfonic acid
HBS-N HEPES buffer saline
SNR Signal-to-noise ratio
RNA Ribonucleic acid
rpm Revolutions per minute
SDA Strand-displacement amplification
SDS Sodium dodecyl sulphate
SNP Single nucleotide polymorphism
SPM Scanning probe microscopy
SPR Surface plasmon resonance
SSC Saline sodium citrate
xxii
ssDNA Single-stranded DNA
TBP TATA binding protein
TST Transition state theory
V 20-mer oligonucleotide probe with a DNA sequence complementary to the G12V allele of KRAS gene. The 5’-end of the sequence is labelled by an amine group linked with a –(CH2)12– spacer.
V’ 80 bp amplicons resulted from PCR amplification of genomic DNA with sequence of G12V mutant of KRAS gene.
V60 60-mer oligonucleotide probe with the DNA sequence of G12V allele of KRAS gene. The 5’-end of the sequence is labelled by biotin group.
W 20-mer oligonucleotide probe with the DNA sequence of wild-type allele of KRAS gene. The 5’-end of the sequence is labelled by biotin group.
W’ 80 bp amplicons resulted from PCR amplification of genomic DNA with wild-type sequence of KRAS gene.
W20 20-mer oligonucleotide probe with the DNA sequence of G12D allele of KRAS gene. The 5’-end of the sequence is labelled by biotin group.
W60 60-mer oligonucleotide probe with the DNA sequence of wild-type allele of KRAS gene. The 5’-end of the sequence is labelled by biotin group.
WT Wild-type KRAS
xxiii
List of Symbols
C DNA concentration
D Diffusion coefficient
F Fluorescence intensity
F0 Initial fluorescence intensity
H Channel height
kB Boltzmann constant
K Equilibrium constant
ka Rate constant of the adsorption of ssDNAs onto the surfaces of gold nanoparticles
kd Rate constant of DNA dehybridization
kdpm Rate constant for dehybridization of perfectly matched duplexes
kdmm Rate constant for dehybridization of mismatched duplexes
kh Rate constant of DNA hybridization
khpm Rate constant for hybridization of perfectly matched duplexes
khmm Rate constant for hybridization of mismatched duplexes
R Resonance unit
r Pearson correlation coefficient
Spm Signal intensity from the perfectly matched duplexes
Smm Signal intensity from the mismatched duplexes
u Flow velocity in x direction (along the channel)
U Characteristic flow speed, measured as the average liquid front speed from the experiment
z Distance perpendicular to the channel lower wall of the channel
ΔGh≠ Free energy changes of activation for DNA hybridization reaction
ΔGd≠ Free energy changes of activation for DNA dehybridization reaction
ΔHh≠ Enthalpy changes of activation for DNA hybridization reaction
ΔHd≠ Enthalpy changes of activation for DNA dehybridization reaction
ΔSh≠ Entropy of activation for DNA hybridization reaction
Δsd≠ Entropy of activation for DNA dehybridization reaction
ΔΔGh≠ The difference between the hybridization free energy change of
activation for perfectly matched duplexes and that of mismatched duplexes
ΔΔGd≠ The difference between the dehybridization free energy change of

xxiv
activation for perfectly matched duplexes and that of mismatched duplexes
θ0 Probe density, equal to the maximal surface concentration of hybridized duplexes
θpm Surface concentration of the hybridized perfectly matched duplexes
θmm Surface concentration of the hybridized mismatched duplexes
σ Specificity, defined as the ratio of the signal from the perfectly matched duplexes over that of mismatched one (SPM/ SMM
η Dynamic viscosity
1
Chapter 1. Introduction
In this thesis, a method for the detection of single nucleotide polymorphisms (SNP) in
the NanoBioArray (NBA) chip is reported. The detection is achieved on the basis of the
enhancement of the specificity of DNA hybridization reactions by gold nanoparticles
(AuNPs). Therefore, the background information for SNP, DNA hybridization, DNA
microarray, AuNP and NBA chip will be introduced.
1.1. Detection of Single nucleotide polymorphisms (SNPs)
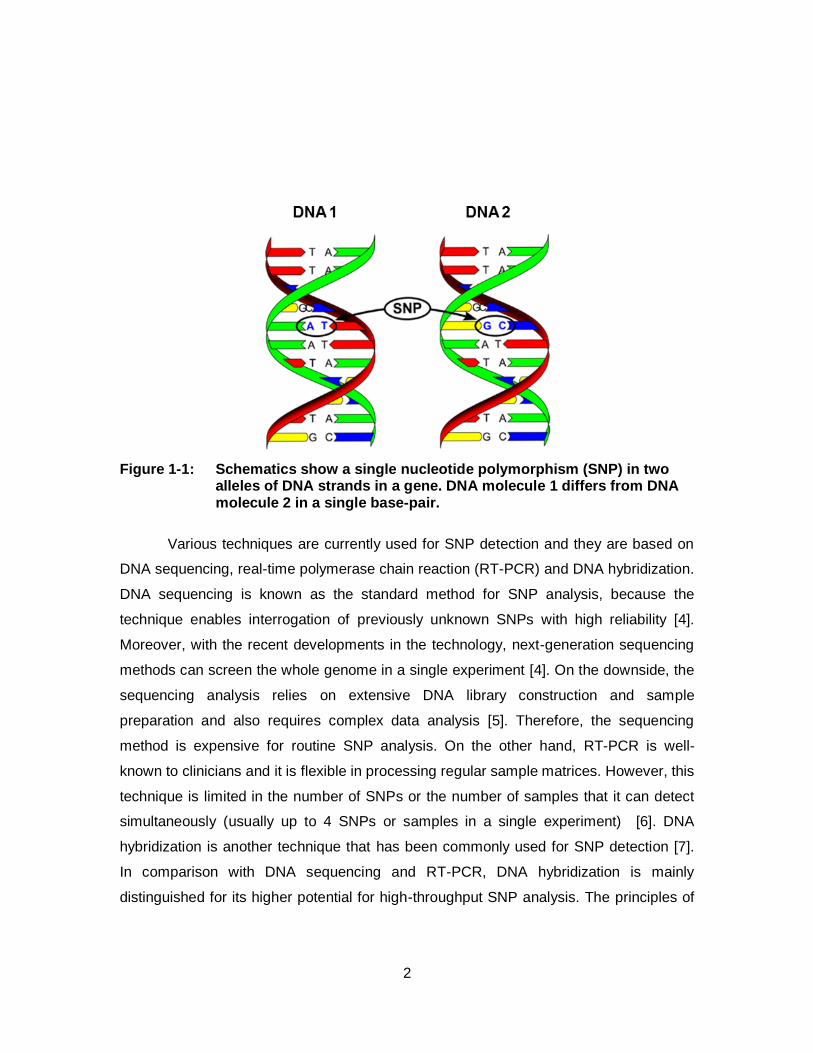
SNPs are DNA sequence variations in which a single nucleotide differs in a gene
(Figure 1-1). SNPs are the most abundant genetic variations and are estimated to
account for 90% of all DNA sequence variations among the human genome [1]. SNPs
can occur in both coding and non-coding regions of the genome, and SNPs present in
the coding regions are responsible for many genetic disorders and for certain cancers
such as retinoblastoma, colorectal carcinoma and adenocarcinoma of the pancreas
[1,2].
SNPs, as key genetic biomarkers, are detected to study the genetic factors
associated with human diseases and also to follow the inheritance pattern of
chromosomal regions [2]. More importantly, the detection of some SNP variations is
critical for the selection of the appropriate type of treatment for individual patients. For
instance, in colorectal cancer patients with wild-type allele of KRAS gene respond well to
the anti-epithermal growth factor receptor (anti-EGFR) therapy, a common treatment for
colorectal cancer. However, the treatment becomes ineffective if the patient carries a
mutation in the KRAS gene [3].
2
Figure 1-1: Schematics show a single nucleotide polymorphism (SNP) in two alleles of DNA strands in a gene. DNA molecule 1 differs from DNA molecule 2 in a single base-pair.
Various techniques are currently used for SNP detection and they are based on
DNA sequencing, real-time polymerase chain reaction (RT-PCR) and DNA hybridization.
DNA sequencing is known as the standard method for SNP analysis, because the
technique enables interrogation of previously unknown SNPs with high reliability [4].
Moreover, with the recent developments in the technology, next-generation sequencing
methods can screen the whole genome in a single experiment [4]. On the downside, the
sequencing analysis relies on extensive DNA library construction and sample
preparation and also requires complex data analysis [5]. Therefore, the sequencing
method is expensive for routine SNP analysis. On the other hand, RT-PCR is well-
known to clinicians and it is flexible in processing regular sample matrices. However, this
technique is limited in the number of SNPs or the number of samples that it can detect
simultaneously (usually up to 4 SNPs or samples in a single experiment) [6]. DNA
hybridization is another technique that has been commonly used for SNP detection [7].
In comparison with DNA sequencing and RT-PCR, DNA hybridization is mainly
distinguished for its higher potential for high-throughput SNP analysis. The principles of
3
DNA hybridization, and the kinetic and thermodynamic processes involved, are
discussed in the following section.
1.2. DNA hybridization:
Pioneered by Charles Sibley and Jon Ahlquist, DNA hybridization, or DNA-DNA
hybridization, is one of the first genome-based methods developed to evaluate genomic
interrelationships [8]. Hybridization has been used to detect a specific sequence (target)
of nucleic acids (DNA or RNA) using a short DNA strand (probe) with a sequence
complementary to the specific sequence. A signal resulted from the probe-target
hybridization is usually visible by fluorescence-labelling of either the probe or target
strand, and the fluorescent signal indicates the presence of the target sequence. DNA
hybridization can be carried out in the bulk solution (bulk hybridization), where both the
probe and the target are dissolved (Figure 1-2(a)), or at the surface-solution interface
(surface hybridization, See Figure 1-2), where one of the two strands is immobilized on a
solid support and the other is dissolved in the surrounding solution (Figure 1-2(b)).
Surface DNA hybridization is commonly used in DNA microarrays, where thousands of
hybridization probes are anchored on discrete spots on a solid substrate to carry out
DNA hybridization with the target sequences present in the sample solution. The
fundamentals of DNA microarrays will be discussed in a subsequent section. For the
success of DNA hybridization analyses, optimization of several experimental factors
including probe length and sequence, hybridization temperature and buffer salt content
are required. However, a probe may hybridize to several regions in the genome leading
to false-positive results. On the other hand, no hybridization, or false-negative results
may also occur due to the formation of secondary structures within the probe or the
target strands. Therefore, the understanding of the thermodynamics and kinetics of the
DNA hybridization reaction is critical for proper experimental design of DNA microarrays.
4
Figure 1-2: Schematics of (a) bulk DNA hybridization and (b) surface DNA hybridization.
1.2.1. Kinetics and thermodynamics of DNA hybridization
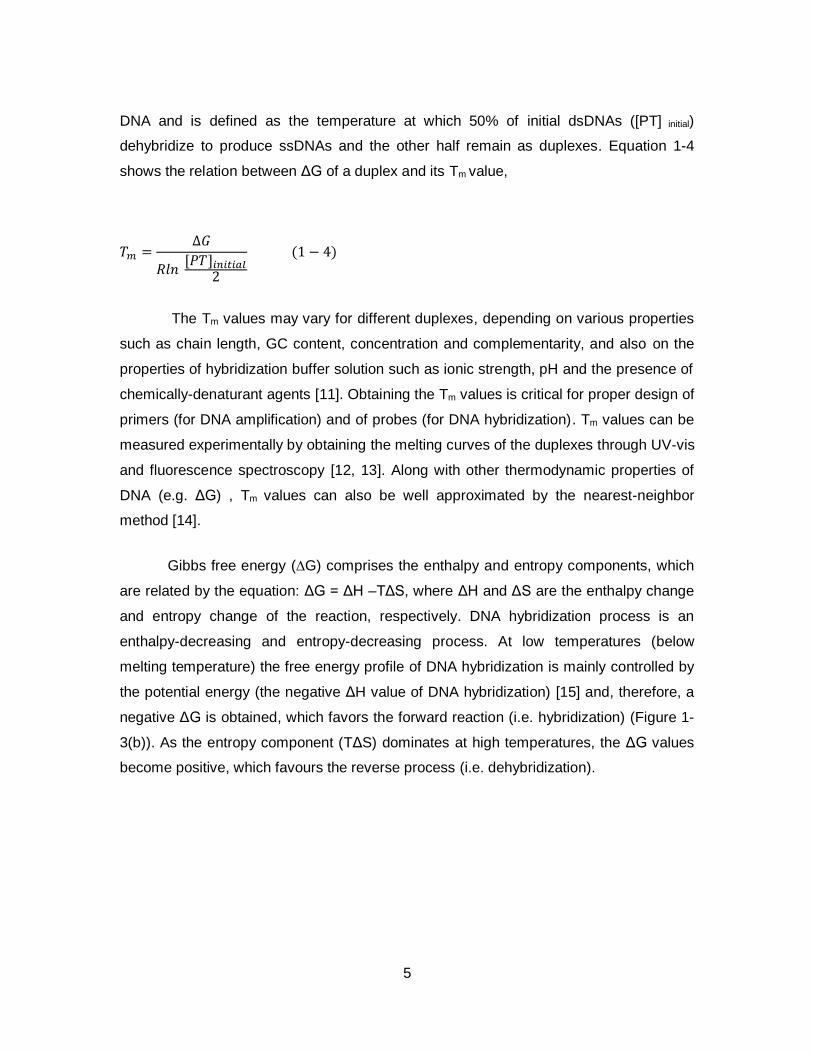
The thermodynamics of DNA hybridization is described in a two-state model [9].
In one state the single-stranded DNAs (ssDNAs) are widely separated and have the
random-coil format, and in the other, the two strands form complete (fully-coiled)
duplexes i.e. double-stranded DNA (dsDNA) [9]. In this simplified model, the forward and
reverse reaction can be defined as bimolecular and unimolecular reactions (Eq. 1-1 and
Figure 1-3(a)), respectively. Given enough time, the reaction reaches equilibrium and the
reaction rates for the hybridization (formation of the duplex) and dehybridization
(dissociation of the duplex) are identical. The equilibrium constant K is given by Equation
1-2:
𝑃 + 𝑇 ↔ 𝑃𝑇 (1 − 1)
𝐾 =[𝑃𝑇]
[𝑃] [𝑇]=𝑘ℎ𝑘𝑑 (1 − 2)
Where [P], [T] and [PT] are the equilibrium concentrations of probe, target and
duplex, respectively, at equilibrium. According to the Van´t Hoff equation [10], K is
related to the Gibbs free energy (∆G) by Equation 1-3,
∆𝐺 = −𝑅𝑇 𝑙𝑛𝐾 (1 − 3)
Where R is the ideal gas law constant and T is the absolute temperature of the
reaction. DNA melting temperature (Tm) is another critical thermodynamic property of
5
DNA and is defined as the temperature at which 50% of initial dsDNAs ([PT] initial)
dehybridize to produce ssDNAs and the other half remain as duplexes. Equation 1-4
shows the relation between ΔG of a duplex and its Tm value,
𝑇𝑚 =∆𝐺
𝑅𝑙𝑛 [𝑃𝑇]𝑖𝑛𝑖𝑡𝑖𝑎𝑙
2
(1 − 4)
The Tm values may vary for different duplexes, depending on various properties
such as chain length, GC content, concentration and complementarity, and also on the
properties of hybridization buffer solution such as ionic strength, pH and the presence of
chemically-denaturant agents [11]. Obtaining the Tm values is critical for proper design of
primers (for DNA amplification) and of probes (for DNA hybridization). Tm values can be
measured experimentally by obtaining the melting curves of the duplexes through UV-vis
and fluorescence spectroscopy [12, 13]. Along with other thermodynamic properties of
DNA (e.g. ΔG) , Tm values can also be well approximated by the nearest-neighbor
method [14].
Gibbs free energy (∆G) comprises the enthalpy and entropy components, which
are related by the equation: ΔG = ΔH –TΔS, where ΔH and ΔS are the enthalpy change
and entropy change of the reaction, respectively. DNA hybridization process is an
enthalpy-decreasing and entropy-decreasing process. At low temperatures (below
melting temperature) the free energy profile of DNA hybridization is mainly controlled by
the potential energy (the negative ΔH value of DNA hybridization) [15] and, therefore, a
negative ΔG is obtained, which favors the forward reaction (i.e. hybridization) (Figure 1-
3(b)). As the entropy component (TΔS) dominates at high temperatures, the ΔG values
become positive, which favours the reverse process (i.e. dehybridization).
6
Figure 1-3: (a) The two-state thermodynamic model of DNA hybridization/dehybridization. (b) Gibbs free energy profile of DNA hybridization, as described in the thermodynamic model.
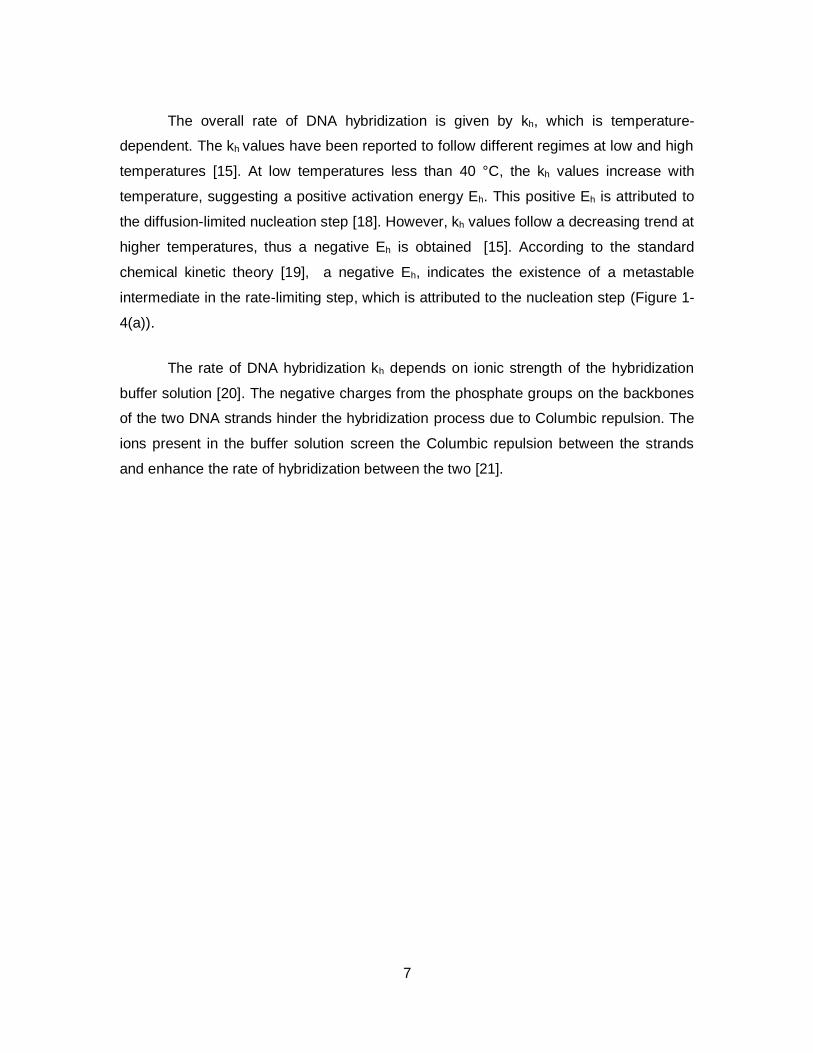
In contrast to the thermodynamic model, which describes DNA hybridization
using a two-state model, the kinetic model of hybridization involves transition states and
intermediate structures that lie between the two states [16]. DNA hybridization occurs in
sequential steps of nucleation and zipping [17]. Nucleation is the base-pairing between a
few (~3-4) nucleotides from each strand and formation of the intermediate structure,
called the nucleus (Figure 1-4(a)). The nucleus can form at any site along the duplex
structure. Nucleation is the rate-limiting step of DNA hybridization, followed by the
zipping step. The zipping step completes the hybridization process at a fast rate (~107
bp/s), ending with a fully-coiled duplex [17].
7
The overall rate of DNA hybridization is given by kh, which is temperature-
dependent. The kh values have been reported to follow different regimes at low and high
temperatures [15]. At low temperatures less than 40 °C, the kh values increase with
temperature, suggesting a positive activation energy Eh. This positive Eh is attributed to
the diffusion-limited nucleation step [18]. However, kh values follow a decreasing trend at
higher temperatures, thus a negative Eh is obtained [15]. According to the standard
chemical kinetic theory [19], a negative Eh, indicates the existence of a metastable
intermediate in the rate-limiting step, which is attributed to the nucleation step (Figure 1-
4(a)).
The rate of DNA hybridization kh depends on ionic strength of the hybridization
buffer solution [20]. The negative charges from the phosphate groups on the backbones
of the two DNA strands hinder the hybridization process due to Columbic repulsion. The
ions present in the buffer solution screen the Columbic repulsion between the strands
and enhance the rate of hybridization between the two [21].
8
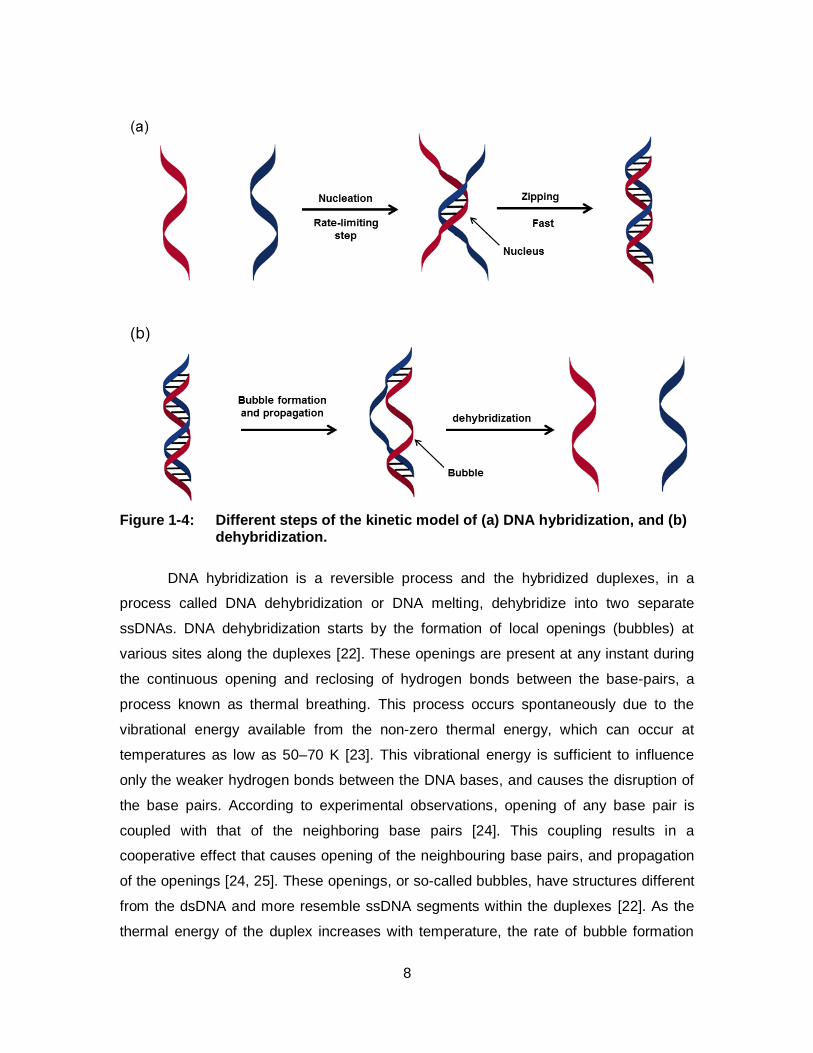
Figure 1-4: Different steps of the kinetic model of (a) DNA hybridization, and (b) dehybridization.
DNA hybridization is a reversible process and the hybridized duplexes, in a
process called DNA dehybridization or DNA melting, dehybridize into two separate
ssDNAs. DNA dehybridization starts by the formation of local openings (bubbles) at
various sites along the duplexes [22]. These openings are present at any instant during
the continuous opening and reclosing of hydrogen bonds between the base-pairs, a
process known as thermal breathing. This process occurs spontaneously due to the
vibrational energy available from the non-zero thermal energy, which can occur at
temperatures as low as 50–70 K [23]. This vibrational energy is sufficient to influence
only the weaker hydrogen bonds between the DNA bases, and causes the disruption of
the base pairs. According to experimental observations, opening of any base pair is
coupled with that of the neighboring base pairs [24]. This coupling results in a
cooperative effect that causes opening of the neighbouring base pairs, and propagation
of the openings [24, 25]. These openings, or so-called bubbles, have structures different
from the dsDNA and more resemble ssDNA segments within the duplexes [22]. As the
thermal energy of the duplex increases with temperature, the rate of bubble formation
9
increases, thus the rate of DNA dehybridization increases. The lifetime of DNA bubbles
are of the order of 1 µs, a relatively long period in comparison to the molecular diffusion
times, which suggests that these intermediate structures may have enough time to
undergo biological events or modifications [26]. In 2004, Choi and coworkers reported
that the binding between the dehybridization openings formed in some regions of the
DNA duplex and the TATA binding protein (TBP), initiate the gene transcription process
[26].
The transition state theory (TST) can provide insights about the mechanisms of
chemical reactions; for instance, how many transition states or reactive intermediates
are involved in the conversion of reactants to products. According to TST, the rate-
limiting step of a reaction is the formation of the activated complexes or transition states,
and the kinetic theory can be used to determine the rate of the conversion of the
transition states to the products [19]. The TST assumes that, even with no equilibrium
between the reactants and the products, the transition states are in quasi-equilibrium
with the reactants. Derived from TST, the Eyring-Polanyi equation (Eq. 1-5) [27] relates
the free energy change of transition state formation (ΔG≠), also known as activation free
energy change, to the rate constant of the reaction (k) by:
k =kBT
he-∆G≠
RT (1-5)
where kB is Boltzmann constant, T is absolute temperature, R is universal gas
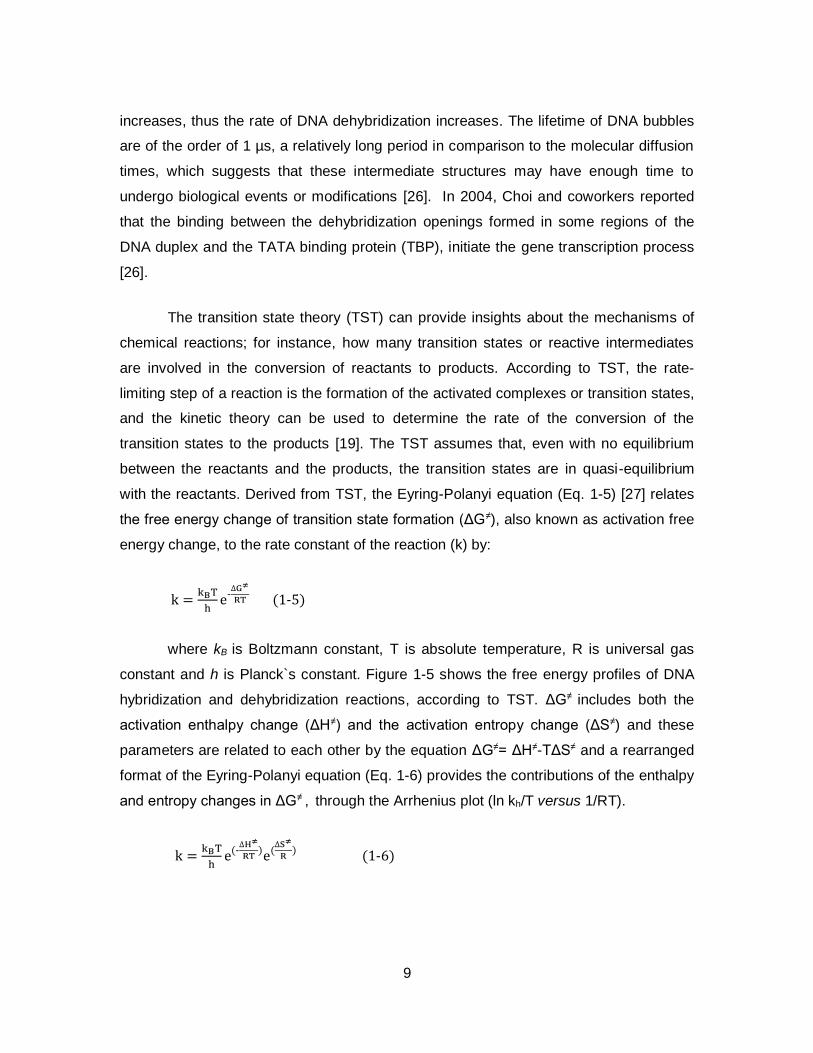
constant and h is Planck`s constant. Figure 1-5 shows the free energy profiles of DNA
hybridization and dehybridization reactions, according to TST. ΔG≠ includes both the
activation enthalpy change (ΔH≠) and the activation entropy change (ΔS≠) and these
parameters are related to each other by the equation ΔG≠= ΔH≠-TΔS≠ and a rearranged
format of the Eyring-Polanyi equation (Eq. 1-6) provides the contributions of the enthalpy
and entropy changes in ΔG≠ , through the Arrhenius plot (ln kh/T versus 1/RT).
k =kBT
he(-
∆H≠
RT)e(
∆S≠
R) (1-6)
10
Transition state theory (TST) is used in this thesis to extract mechanistic
information about the DNA hybridization, and also dehybridization, in the presence of
gold nanoparticle (AuNP)-ssDNA interactions (chapter 3).
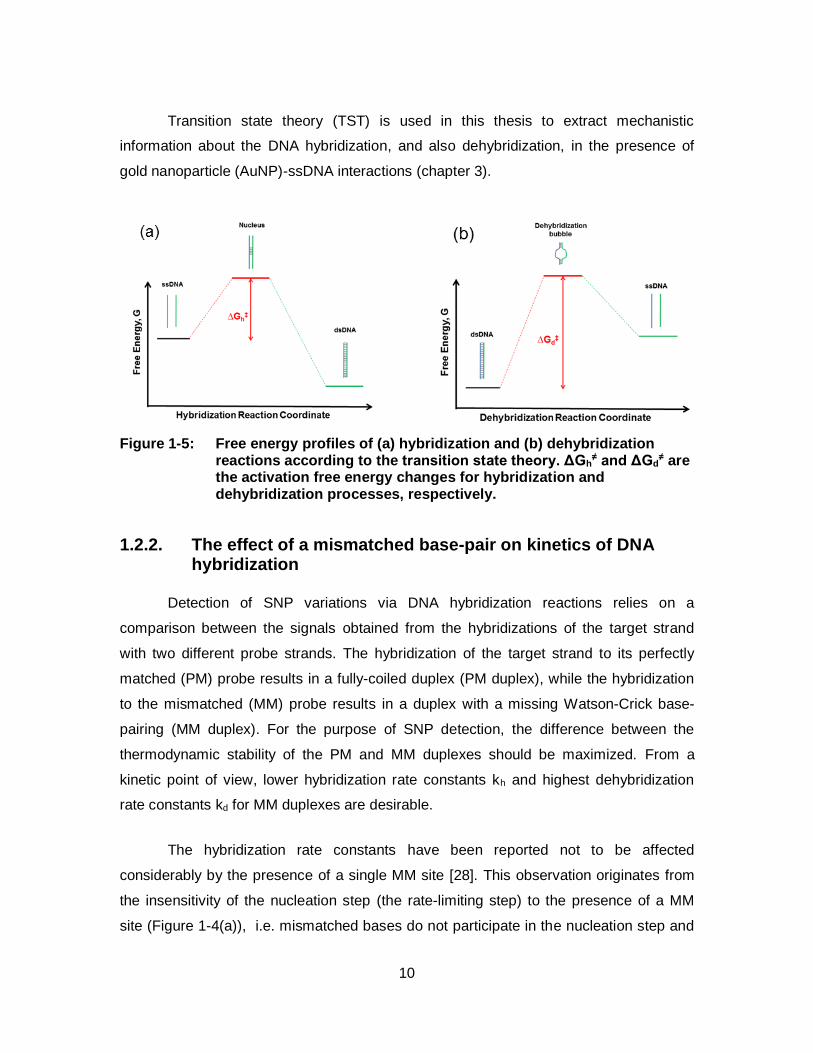
Figure 1-5: Free energy profiles of (a) hybridization and (b) dehybridization reactions according to the transition state theory. ΔGh
≠ and ΔGd≠ are
the activation free energy changes for hybridization and dehybridization processes, respectively.
1.2.2. The effect of a mismatched base-pair on kinetics of DNA hybridization
Detection of SNP variations via DNA hybridization reactions relies on a
comparison between the signals obtained from the hybridizations of the target strand
with two different probe strands. The hybridization of the target strand to its perfectly
matched (PM) probe results in a fully-coiled duplex (PM duplex), while the hybridization
to the mismatched (MM) probe results in a duplex with a missing Watson-Crick base-
pairing (MM duplex). For the purpose of SNP detection, the difference between the
thermodynamic stability of the PM and MM duplexes should be maximized. From a
kinetic point of view, lower hybridization rate constants kh and highest dehybridization
rate constants kd for MM duplexes are desirable.
The hybridization rate constants have been reported not to be affected
considerably by the presence of a single MM site [28]. This observation originates from
the insensitivity of the nucleation step (the rate-limiting step) to the presence of a MM
site (Figure 1-4(a)), i.e. mismatched bases do not participate in the nucleation step and
11
only the matched bases take part in the formation of the nucleus [29]. Although the
presence of a mismatch base reduces the number of the possible nucleation sites,
experimental observations showed that duplexes with a single mismatch base-pair have
a hybridization rate constant similar to that of a perfect match duplex [30].
On the other hand, the presence of a mismatched base-pair in a duplex
destabilizes it and reduces its Tm value, making this value smaller than that for the
corresponding PM duplexes (~2-5 °C). However, this small difference in Tm value does
not completely account for the great number of bubbles that form during the melting of
MM duplexes. It is because the melting curve analysis, from which the Tm value is
obtained from the midpoint of the transition between dsDNA and ssDNA, does not
distinguish between the entirely dehybridized duplexes and the partially dehybridized
ones [31]. In contrast to the melting curve analysis, the dissociation curve analysis is
able to independently trace the formation of local bubbles in partially dehybridized
duplexes. In 2006, Zeng and coworkers compared the dissociation curves obtained
experimentally from perfectly matched duplexes and single base-pair mismatched ones
[31]. The dissociation curves showed that even though Tm may not be much affected by
the presence of the mismatched site, the number of intermediates is drastically
enhanced. They also suggest that in MM duplexes the bubbles predominantly start at
the MM site, in contrast to PM duplexes in which the bubbles form at any site in the
duplex, or at the duplex ends in the case of short duplexes.
1.3. Surface DNA hybridization
Surface DNA hybridization occurs at the interface of a solution that contains
target strands and a surface where the probe strands are immobilised (Figure 1-2(b)).
The greater complexity of the interfacial environment imposes more challenges in the
fundamental understanding of surface hybridization, as compared to bulk hybridization
[32]. The surface is known to suppress the rate of DNA hybridization, resulting in kh
values reduced by an order of magnitude for surface hybridization in comparison to bulk
hybridization [33, 34]. This rate suppression is caused by the steric and electrostatic
hindrance at the surface-solution interface and by the conformational restrictions of
hybridization of target strands to the surface-bound strands [33]. The neighboring DNA
12
strands on the solid surface can also affect both the kinetics and thermodynamics of
DNA hybridization. Thus, the spacing between neighboring immobilized probes, and the
probe density, are influential factors in surface hybridization. Paterson and coworkers
observed that, at low probe density, surface hybridization is fast and follows Langmuir
kinetics, but at high probe density, the hybridization efficiency drops and the kinetics are
slower [35].
Surface DNA hybridization is involved in commonly used techniques, such as
microarrays. In the following section various aspects of DNA microarrays, used in the
field of molecular biology, are discussed.
1.4. DNA microarrays
The DNA microarray, which consists of many microscopic DNA spots (<200 µm)
arrayed at precisely-defined positions on a solid support, allows for simultaneous
analysis of numerous DNA or RNA sequences. DNA microarrays are constructed based
on the knowledge about nucleic acids sequences in the human genome using the
robotic technique and micro-technology. On a DNA microarray, hybridization occurs
between “probes” and “targets”, where probes are nucleic acid fragments with known
sequences attached to the solid surface and targets are the free nucleic acids in the
sample solution whose identity or abundance are being detected (Figure 1-7).
13
Figure 1-6: (a) schematics show a DNA microarray chip containing different probes spots at defined positions on the chip substrate, and (b) the process of surface hybridization between labeled target strands and their complementary strands on a probe spot.
Microarray assay is a multiple-step procedure that involves substrate
preparation, probe and primer design, probe immobilization, target amplification, DNA
hybridization, washing, signal visualization and data analysis [36, 37]. Robust and solid
substrates, such as glass, silicon and also polymeric materials are used to construct
microarrays [38]. The probe oligonucleotides are tethered to the substrate via various
linkers such as amine- or aldehyde-terminated siloxane and poly-L-lysine [39]. In the
early days of microarray development, complementary DNAs (cDNAs) were used as the
surface-bound probes in microarrays. But the types of probes have now shifted to short
oligonucleotides, because they are easier to prepare, result in higher probe surface
densities and provide higher hybridization specificities than cDNAs. The oligonucleotide
probes are either pre-synthesized or synthesized in-situ. The former approach uses an
array of microspot pins, controlled by robotic arms, to transfer the pre-synthesized
probes (50-70 bases) from the storage wells to the pre-defined locations on the
microarray substrate [40]. The in-situ synthesis technique, pioneered by Affymetrix
GeneChip platform [41], uses a light-directed approach to synthesize the probe
molecules (15-30 bases) at allocated spots on the substrate. Prior to sample introduction
to the array, the DNA or RNA samples are amplified at the regions of interest using PCR
to obtain target strands of various lengths. Signal visualization is commonly achieved
through fluorescent labeling of the target molecules.
The first spotted microarray was created by Schena et al., in 1995, who spotted
or printed various complementary DNAs (cDNAs) on a glass microscope slide via a
14
robotic printer and the microarray was used to monitor the differential expression of
many genes in parallel. Since then, a vast development has been achieved both in the
technology and in the applications of DNA microarrays [42]. There are three major
applications for microarrays. First, most of the microarray platforms have been used for
studying the expression profiles of the genes. These studies aim to obtain clinically
relevant information from the expression levels of certain genes [43]. For example, the
microarray data were used to differentiate between the cancer subtypes, to provide
prognostic information (e.g. likelihood of recurrence or metastasis) and, in some cases,
predictive information (e.g. the efficacy of chemotherapy). Second, microarrays were
used for genotyping, which has been developed to characterize viral pathogens or detect
human gene mutations. Third, array-based comparative genomic hybridization (array-
CGH) provides a tool for screening copy number variations (CNVs) in the whole genome
and this tool offers a much higher resolution (i.e. the smallest size of the sequence
variation that can be detected), over the classical techniques [44].
1.4.1. Challenges of DNA microarray technology
Despite its growth in research use, the microarray technique has been slow to
penetrate in the molecular diagnostic market as the technique accounted for only 10% of
the entire molecular diagnostic market in 2010 (7). This slow growth in the market may
be attributed to several challenges that microarray-based diagnostic tests face. One
challenge is the competition from PCR-based and sequencing-based tests. For instance,
simple low-density microarray tests, when only a few genes are being monitored or a
limited number of mutations are being interrogated, have to compete with the well-known
PCR-based tests. On the other hand, complex high-density microarray tests, which
provide high amounts of information out of reach of PCR-based techniques, are facing a
strong competition with the newly emerged next-generation sequencing (NGS)
techniques. This is because NGS can provide detailed genetic information at a price that
has been lowered tremendously over the past few years [45]
The other challenges of the microarray tests for molecular diagnostics are
obtaining regulatory approval and gaining clinical acceptance. These challenges are
more serious in gene expression profiling, where the test is commonly based on the new

15
research studies that correlate the level of expression of a set of several genes to a
clinical outcome, and these expression profiles are not predefined and known
biomarkers. In order to gain clinical acceptance, expression profiling tests are required to
prove the correlation of their result to the clinical outcome [63].
On the other hand, genotyping arrays are usually used to detect well-known and
previously characterized sequence variations and, therefore, their clinical correlation and
utility have been established. There are two types of DNA genotyping arrays: high-
density and low-density. First, high-density genotyping arrays contain significantly higher
numbers of features to investigate mutations in several genes or mixtures of pathogens.
As an example, the AmpliChip CYP450 obtained FDA approval in 2004 (the first
microarray-based clinical test). The test uses 15,000 features on an Affymetrix platform
to assess several types of variations in two genes involved in the metabolism of many
psychoactive drugs. Second, low-density genotyping arrays use a fairly small number of
features (up to few hundreds on a chip) for characterization of a pathogen or
investigation of several SNP sites in a particular gene at a relatively inexpensive price.
For instance, PapilloCheck test provided by Greiner BioOne Company (Frickenhausen,
Germany) is a fairly successful low-density genotyping test, which obtained the US
regulatory approval in 2009. The PapilloCheck system utilizes an array of 140
oligonucleotides to determine the human papillomavirus (HPV) subtypes in cervical
smear samples [63].
The most serious challenge of DNA microarrays is the reliability of their results,
which has been questioned by many scientists [46]. Considering the relevance of the
subject to the purposes and outcomes of this thesis, the underlying reasons for the
reliability challenge of DNA microarray tests and the attempts to solve it are discussed in
detail in the following section.
1.4.2. Reliability of microarray data- the connection of specificity
Despite the fast pace of technology development of microarrays, method
development and standardization lagged behind. Consequently, a lot of concerns were
raised regarding the reliability and reproducibility of the microarray data [47, 48]. For
16
instance, a meta-analysis study was performed on seven large-scale studies on cancer
prognosis that used microarray-based expression profiling [47]. The authors aimed to
study the reproducibility of microarray results reported in those studies. Surprisingly, in
five of these studies the reported data was not reproducible. The analysis of the other
two studies provided much weaker prognostic information than given by the original data
[60]. Following the awareness about the shortage of standardization measures, the
scientific community put much effort in preparing appropriate standards, controls and
tools [49, 50]. Aiming to provide a basis for reporting the microarray results, the standard
called “minimum information about a microarray experiment” (MIAME) was proposed in
2001 [49], to ensure that microarray data can be easily interpreted and independently
verified. Commercial vendors of the microarray platforms improved their technologies
over the years, and they also set up a series of quality control measures to enhance the
reproducibility and accuracy of the data produced by their products. Together with
regulatory agencies, the vendors started the Microarray quality control (MAQC) project in
2006 [50], to establish thresholds and metrics for inter-platform comparison of
microarray data.
In spite of these efforts in improving the microarray standardization, there are still
discrepancies in microarrays results [46]. As suggested by several studies, low
specificities in DNA hybridization is the primary reason behind the lack of reproducibility
and, therefore, discrepancy in the DNA microarray results [51-54]. The weakness of the
DNA microarray comes from its strength: the multiplex setting. Indeed, in a multiplex
environment multiple target strands can interact with a single probe strand printed on a
microspot. On the other hand, target strand can spread amongst multiple probe spots,
and result in unwanted nonspecific hybridization and, hence, false-positive outcomes
[55, 56]. Several research groups employed theoretical studies, experimental measures
and data filtration to identify and optimize different factors that influence the specificity of
microarray assays [57-60].
Different features of probes and targets such as the length of the probe, GC
content, neighboring bases (the overhang bases of the target strands adjacent to the
duplex end), position of the mismatch site within the probe sequence, and the probability
of formation of secondary structure may affect the sensitivity and specificity of DNA
17
hybridization reaction [9, 58, 61]. First, short probes have higher specificities than the
long ones because the mismatch site is less tolerated in a shorter length of duplex, i.e.
the formation of mismatched duplexes is less favorable with a shorter probe [58].
However, there is a limitation in reducing the probe length since shorter probes cause
lower sensitivities. Second, the position of the mismatch site also affects the specificity.
If the mismatched base pairs are located at the ends of the probe-target duplexes, there
is no considerable effect on the duplex stability, and thus the mismatched target
hybridize to the probe as effective as the perfectly matched target [9, 61]. As the MM
position is shifted toward the center of the duplex, its destabilizing effect on the duplex
stability increases. Therefore, in designing the probes for SNP analysis, the MM site is
often positioned at the center of the duplex. In addition to the probe and target
sequences, experimental factors can influence the kinetics, and hence the specificity of
DNA hybridization. Hybridization time also affects the specificity, because hybridization
rate constants of PM and MM are similar but the dehybridization rates are much higher
for MM duplexes than that of PM counterparts [60]. The difference in the dehybridization
rates also shows the efficacy of a washing step after DNA hybridization [62].
The experimental modifications that influence the specificity, or stringency, of
DNA hybridization, include increasing the temperature of hybridization reaction, lowering
the salt content in the hybridization buffer, or adding denaturing chemicals such as
formamide, formaldehyde and urea to the hybridization buffer. [59, 63, 64]. These
modifications cause the hybridization reaction to occur near the melting temperature of
the duplexes, where hybridization is less favorable than lower temperatures. The
specificity of DNA hybridization is enhanced as the MM duplexes, with lower
hybridization affinity in comparison to PM duplexes, are more affected by the stringent
condition. The stringent condition can also be applied in the post-hybridization wash step
to remove the less stable MM duplexes [64]. Unfortunately, the stringency method also
affects the PM duplexes, and thus the sensitivity of microarray assays. Hence, in
selecting the level of hybridization stringency (e.g. hybridization temperature, buffer ionic
strength, etc.) a balance between the desired sensitivity and specificity should be
considered. Moreover, establishment of such a balance in the highly multiplexed setting
of the DNA microarray, where up to a million duplexes with different Tm values have to
be interrogated at a single hybridization condition, is very difficult [56]. Therefore, false-

18
positive results may be obtained for those duplexes with high Tm values while false-
negative outcomes are likely for the ones with low Tm values.
To enhance the specificity of DNA hybridization assays, several approaches to
produce a new generation of hybridization probes have been developed [65]. The design
of these probes, though complicated, facilitates the specific hybridization and favours the
formation of PM duplexes over the MM duplexes. One approach is to divide the probe
strand into two short probes (binary probes), and signal visualization only occurs when
there is simultaneous hybridization of both probes to the target strand (Figure 1-8 (a))
[66]. Another approach is to create a stem-loop structure, called the molecular beacon
(Figure 1-8(b)) [67]. Upon binding with the perfectly matched target, the stem hairpin
structure disrupts, resulting in fluorescence emission. A third approach is to design a
toehold probe (Figure 1-7(c)) [68, 69]. Toehold is an overhang single-stranded region
that acts as a nucleation site for strand displacement and enhances the kinetics of the
process [70]. Figure 1-7(d) shows the fourth approach in which the target strand together
with the assistant probe (probe B) hybridizes to the reporter strand (probe A) to form a
three-way junction structure, which includes a dsDNA region that is recognised by a
restriction enzyme [71, 72]. The fluorophore-quencher separation upon nicking by the
enzyme causes an enhancement in the fluorescence emission and, thus, detection of
the target [71].
19
Figure 1-7: Schematics show various new generations of hybridization probes to enhance specificity. (a) Binary probes: the probe is divided into two halves which contain inactive reporters attached to the inner ends. Signal visualization is via activation of the reporter upon simultaneous hybridization of both probes to the target strand. (b) Molecular beacons (MBs): a secondary structure is introduced into the probe sequence, creating a stem-and-loop structure. The segment complementary to the target sequence is positioned in the loop and probe-target hybridization involves prior disruption of the stem structure. (c) Toehold exchange probe: the probe strand is hybridized to a protector, inactivating the reporter. The hybridization of the target to the probe involves strand displacement between the target and the reporter at equilibrium condition. A non-overlapping region (toehold) accelerates the strand-displacement reaction. (d) Three-way junction concept: The hybridization between the target strand and the reporter strand (probe A) is assisted by a secondary probe strand (probe B). Upon formation of the junction structure, the restriction site is generated and nicked by a restriction enzyme, which cause the release of the quencher and signal enhancement. With permission from [65].
20
While the new generation of probes enhance the specificity of DNA hybridization,
these probes, which require complicated design, are unable to simultaneously analyse
more than 4 targets in a sample. Therefore, application of these probes in highly
multiplexed settings such as DNA microarray is limited. [65]. A more general approach
which does not require complex probe design, and hence is compatible with multiplexed
analyses, is required [65]. For this purpose, the non-specific interaction between gold
nanoparticles (AuNPs) and ssDNA has been suggested to enhance hybridization
specificity [73].
1.5. Gold nanoparticle-based DNA sensing
The use of gold nanoparticles (AuNPs) to construct DNA biosensors was first
reported by Mirkin group in 1997 [74]. The unique chemical and physical properties of
AuNPs make them suitable for many biotechnological applications [75-81]. For instance,
the unique optical properties of AuNPs, due to the size-dependent plasmon resonance
on their surfaces, have been utilized in developing many colorimetric DNA biosensors
[74, 75, 77, 79-81]. The excess amount of citrate, added in the AuNP synthesis [82], is
adsorbed onto the AuNP surface rendering the surface negatively charged, which
contributes to the stability against particle aggregation [83]. However, AuNPs start to
aggregate at salt concentrations above a threshold (e.g. NaCl concentration of ~30 mM),
as the negative particle charges are screened, causing the color of AuNP solutions to
change from red to blue [84]. Most applications in DNA-biosensing that utilize AuNPs
employ the chemisorption of thiol-modified oligonucleotides onto the gold particle
surfaces [85]. For instance, Mirkin group conjugated two thiol-modified probe strands,
each complementary with one region of the target strand, on the surfaces of two different
groups of AuNPs [74]. When present, the target strand can simultaneously hybridize to
both probes, and thus crosslink the AuNPs. This crosslinking resulted in the formation of
a network of AuNPs, which accompanied with a color change of the solution from red to
blue. However, recent studies have utilized the adsorption of non-thiolated DNA onto
AuNP surfaces [86]. In 2004, Li and Rothberg reported that although dsDNAs do not
specifically interact with the surfaces of AuNPs, ssDNA can still adsorb onto AuNPs [86,
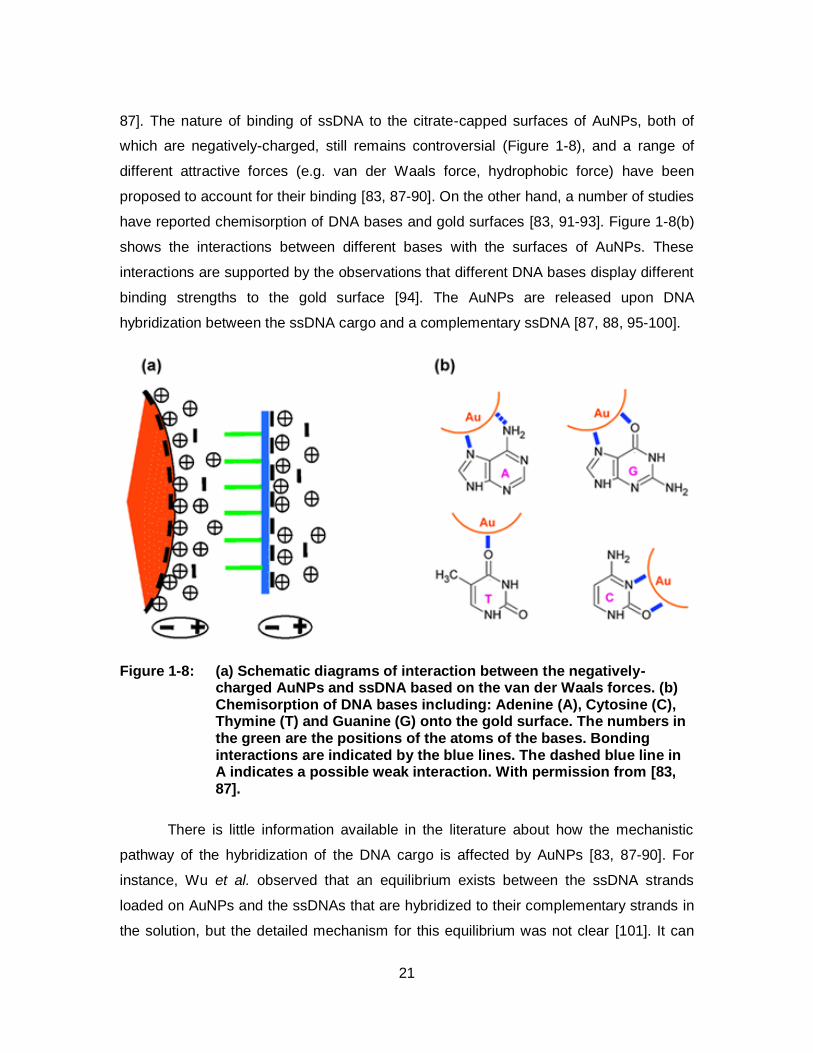
21
87]. The nature of binding of ssDNA to the citrate-capped surfaces of AuNPs, both of
which are negatively-charged, still remains controversial (Figure 1-8), and a range of
different attractive forces (e.g. van der Waals force, hydrophobic force) have been
proposed to account for their binding [83, 87-90]. On the other hand, a number of studies
have reported chemisorption of DNA bases and gold surfaces [83, 91-93]. Figure 1-8(b)
shows the interactions between different bases with the surfaces of AuNPs. These
interactions are supported by the observations that different DNA bases display different
binding strengths to the gold surface [94]. The AuNPs are released upon DNA
hybridization between the ssDNA cargo and a complementary ssDNA [87, 88, 95-100].
Figure 1-8: (a) Schematic diagrams of interaction between the negatively-charged AuNPs and ssDNA based on the van der Waals forces. (b) Chemisorption of DNA bases including: Adenine (A), Cytosine (C), Thymine (T) and Guanine (G) onto the gold surface. The numbers in the green are the positions of the atoms of the bases. Bonding interactions are indicated by the blue lines. The dashed blue line in A indicates a possible weak interaction. With permission from [83, 87].
There is little information available in the literature about how the mechanistic
pathway of the hybridization of the DNA cargo is affected by AuNPs [83, 87-90]. For
instance, Wu et al. observed that an equilibrium exists between the ssDNA strands
loaded on AuNPs and the ssDNAs that are hybridized to their complementary strands in
the solution, but the detailed mechanism for this equilibrium was not clear [101]. It can
22
be implied from the research of several other groups that AuNP-ssDNAs binding impacts
the kinetics of DNA hybridization that involves the ssDNA cargo [88, 97, 99]. For
example, Ray reported that the hybridization of longer oligonucleotides, while loaded
onto AuNPs, with their complementary strands (of a fixed size) in the solution occurred
more slowly than the hybridization of shorter oligonucleotides [97]. This observation
hypothesizes the involvement of AuNPs in the rate-limiting step of duplex formation
since longer oligonucleotides have a higher binding affinity to the AuNP surfaces [90].
However, no experiment has been performed to confirm this hypothesis. Other studies
have suggested that AuNPs are involved in the dehybridization of dsDNAs [94, 102-
106], but to the best of our knowledge no experiments have proved this suggestion
either. For instance, Cho et al. observed that AuNPs enhanced the dehybridization of
single base-pair mismatched (MM) duplexes [102], but they did not explain the reason
for this observation. In 2009, Chen et al. studied the kinetics and thermodynamics of
DNA hybridization on the surface of AuNPs, but their findings also did not explain why
dehybridization of MM duplexes occurred to a greater extent than that observed for PM
duplexes [107]. More surprisingly, Yang et al. observed that dehybridization was
enhanced even for PM duplexes in the presence of 5-nm diameter AuNPs, and
speculated that the duplex was first adsorbed and then denatured on the surfaces of the
AuNPs [106]. This and other studies suggest a discrepancy of how dsDNA binds to the
AuNPs [103, 104, 106], which is contrary to many other reports concluding that dsDNA
does not bind to the AuNPs [86, 87, 89, 90]. Previous work in our group demonstrated
the use of binding of DNA to AuNPs for applications in which the AuNPs were used to
hold onto the ssDNA as a cargo in assisting single base-pair discrimination [73]. The
authors used a single surface-bound probe to hybridize to a PM target and a MM target
at room-temperature. It was reported that the targets loaded on the surfaces of AuNPs,
in contrast to the ones free in the solution, displayed weaker MM hybridization signals at
room temperature. This observation was attributed to the role of AuNPs that compete
with the probes for target binding, and hence discourage the weaker MM binding [73].
However, the mechanistic detail of this competition is yet to be determined. In this thesis
we conduct kinetic studies using surface plasmon resonance (SPR) spectroscopy and
transition state theory (TST) to reveal the influence of ssDNA-AuNPs interactions on the
DNA hybridization of AuNP-loaded targets to the PM and MM probes. The mechanism of
23
enhancement of specificity is then known, and a wash method is suggested and proven
to maintain sensitivity.
1.6. DNA hybridization in NanoBioArray (NBA) chip
In the NanoBioArray (NBA) chips, the use of nanoparticles on microarray is
incorporated with the microfluidic chip. Coupling with microfluidic operations potentially
adds several advantages to the microarray assays. One benefit is the reduced
consumption of samples and reagents due to the use of small micrometer-sized
channels. Moreover, the target molecules are delivered to the probe spots using the
convective flow, in addition to diffusion that occurs in conventional microarrays, thereby
reducing the hybridization times from hours to minutes. Moreover, the benefit of the
microfluidic microarray is in its potential for high sample throughput in addition to
sufficient numbers of probes. Conventional microarray experiments usually allow only 1-
10 samples to be applied on one glass chip [108]. However, as discussed in section
1.3.2, one of the big challenges of DNA microarrays is in the inevitable variations among
the samples which has led to a false recognition of biomarkers [48]. These variations
make replicate analysis necessary, and therefore the multi-sample analysis capability of
microfluidic microarray chips is highly valuable.
The microfluidic flow, which is achieved by a syringe pump, is used to deliver
DNA sample solutions over the probe spots for hybridization. The sample solutions are
either flowed within the microfluidic chambers or through the microfluidic channels to be
delivered to the probe [109-111]. The microfluidic chambers are compatible with both
low-density and high-density microarrays, but it is always a challenge to design how the
liquid will flow over the chamber in such a way to achieve an uniformly distributed liquid
movement across the arrays [112]. On the other hand, the microfluidic channels were
used and they provided better flow control of target solutions over the probe arrays.
Various microfluidic chips containing straight and serpentine microchannels have been
designed, mainly for low-density microarray experiments [113].
The microfluidic flow is used not only to deliver the sample solutions for
hybridization, but has also been used to print probe solutions on the surface. For
24
instance, networks of microchannels were used for the probe printing and then for DNA
hybridization to create 2-D arrays, and this method is called the intersection approach
(Figure 1-9) [112-115]. The performance of the hybridization assay is heavily influenced
by the quality of printed probe spot morphology. Since the spotting solutions are
exposed to air in the pin-spotting methods, the solutions are subject to problems of
splashing, uneven evaporation and cross contamination [115]. Moreover, during the
blocking and washing procedures after probe-spotting on the glass surface, the
remaining unreacted probe molecules could diffuse away and smear the chip to form
comet-like spots [114, 116]. Furthermore, when the microchannel hybridization is to be
used later with the spotted array, additional devices such as steel clamps must be used
to ensure that the entire hybridization microchannel is well aligned to the probe rows
[116]. By using the microchannel network as a microprinting technique, probe spots of a
high homogeneity can be obtained.
In the 2-D array method, the probe solutions that were confined in
polydimethylsiloxane (PDMS) microchannels, were first used to create an array of
vertical probe lines on a glass surface. Then, the target solutions flow on the surface
along the horizontal channels of another PDMS chip and the target molecules hybridize
to the spotted probes at the intersections to the horizontal probe lines. The 2-D
microfluidic microarray format is well suited for parallel sample hybridizations of DNA
samples. Unlike pin-spotted low-density DNA microarray, the use of long and narrow
probe line arrays alleviate the need for perfect alignment between hybridization channels
and probe spots.
The 2-D microfluidic microarray design is compatible with the low-density DNA
microarrays, which are used for diagnostic applications. In many diagnostic applications,
once the genes are identified using high-density DNA microarrays, low-density
microarrays can be designed to screen these genes across many patients to identify
single nucleotide polymorphisms (SNPs) [117]. This low-density microarray approach
has been demonstrated to be reliable, cost-effective, and fast in data analysis and
interpretation [118-124].
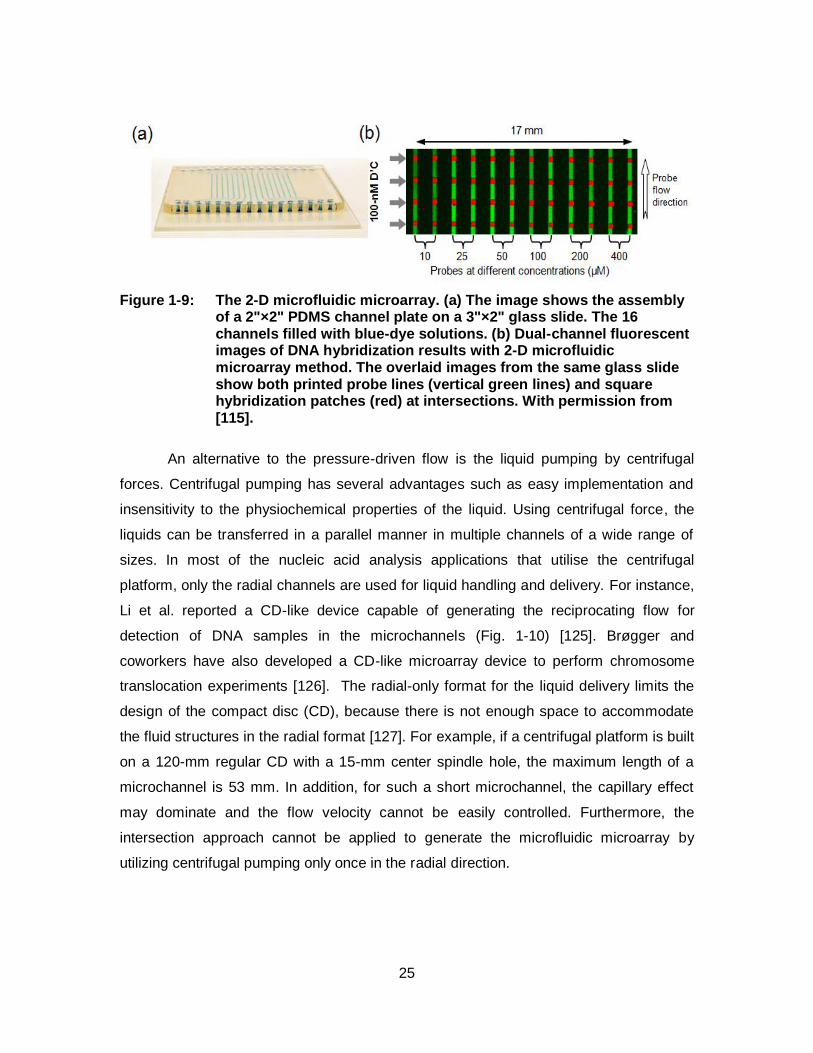
25
Figure 1-9: The 2-D microfluidic microarray. (a) The image shows the assembly of a 2"×2" PDMS channel plate on a 3"×2" glass slide. The 16 channels filled with blue-dye solutions. (b) Dual-channel fluorescent images of DNA hybridization results with 2-D microfluidic microarray method. The overlaid images from the same glass slide show both printed probe lines (vertical green lines) and square hybridization patches (red) at intersections. With permission from [115].
An alternative to the pressure-driven flow is the liquid pumping by centrifugal
forces. Centrifugal pumping has several advantages such as easy implementation and
insensitivity to the physiochemical properties of the liquid. Using centrifugal force, the
liquids can be transferred in a parallel manner in multiple channels of a wide range of
sizes. In most of the nucleic acid analysis applications that utilise the centrifugal
platform, only the radial channels are used for liquid handling and delivery. For instance,
Li et al. reported a CD-like device capable of generating the reciprocating flow for
detection of DNA samples in the microchannels (Fig. 1-10) [125]. Brøgger and
coworkers have also developed a CD-like microarray device to perform chromosome
translocation experiments [126]. The radial-only format for the liquid delivery limits the
design of the compact disc (CD), because there is not enough space to accommodate
the fluid structures in the radial format [127]. For example, if a centrifugal platform is built
on a 120-mm regular CD with a 15-mm center spindle hole, the maximum length of a
microchannel is 53 mm. In addition, for such a short microchannel, the capillary effect
may dominate and the flow velocity cannot be easily controlled. Furthermore, the
intersection approach cannot be applied to generate the microfluidic microarray by
utilizing centrifugal pumping only once in the radial direction.
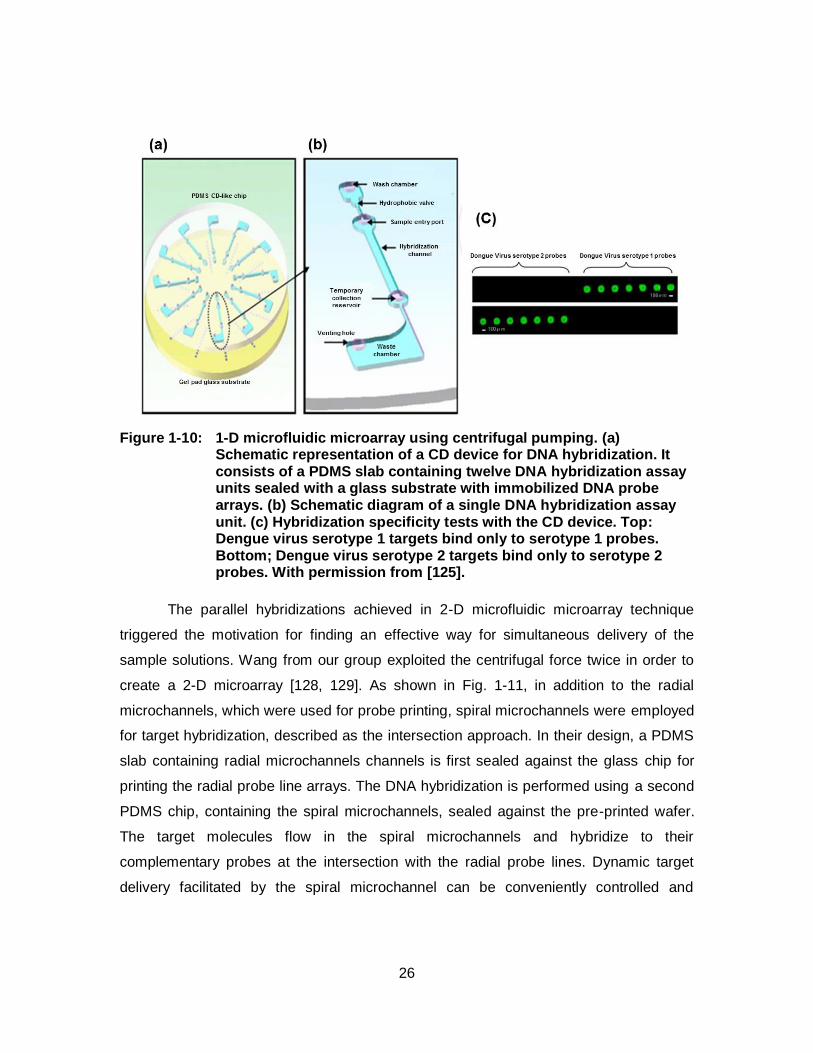
26
Figure 1-10: 1-D microfluidic microarray using centrifugal pumping. (a) Schematic representation of a CD device for DNA hybridization. It consists of a PDMS slab containing twelve DNA hybridization assay units sealed with a glass substrate with immobilized DNA probe arrays. (b) Schematic diagram of a single DNA hybridization assay unit. (c) Hybridization specificity tests with the CD device. Top: Dengue virus serotype 1 targets bind only to serotype 1 probes. Bottom; Dengue virus serotype 2 targets bind only to serotype 2 probes. With permission from [125].
The parallel hybridizations achieved in 2-D microfluidic microarray technique
triggered the motivation for finding an effective way for simultaneous delivery of the
sample solutions. Wang from our group exploited the centrifugal force twice in order to
create a 2-D microarray [128, 129]. As shown in Fig. 1-11, in addition to the radial
microchannels, which were used for probe printing, spiral microchannels were employed
for target hybridization, described as the intersection approach. In their design, a PDMS
slab containing radial microchannels channels is first sealed against the glass chip for
printing the radial probe line arrays. The DNA hybridization is performed using a second
PDMS chip, containing the spiral microchannels, sealed against the pre-printed wafer.
The target molecules flow in the spiral microchannels and hybridize to their
complementary probes at the intersection with the radial probe lines. Dynamic target
delivery facilitated by the spiral microchannel can be conveniently controlled and
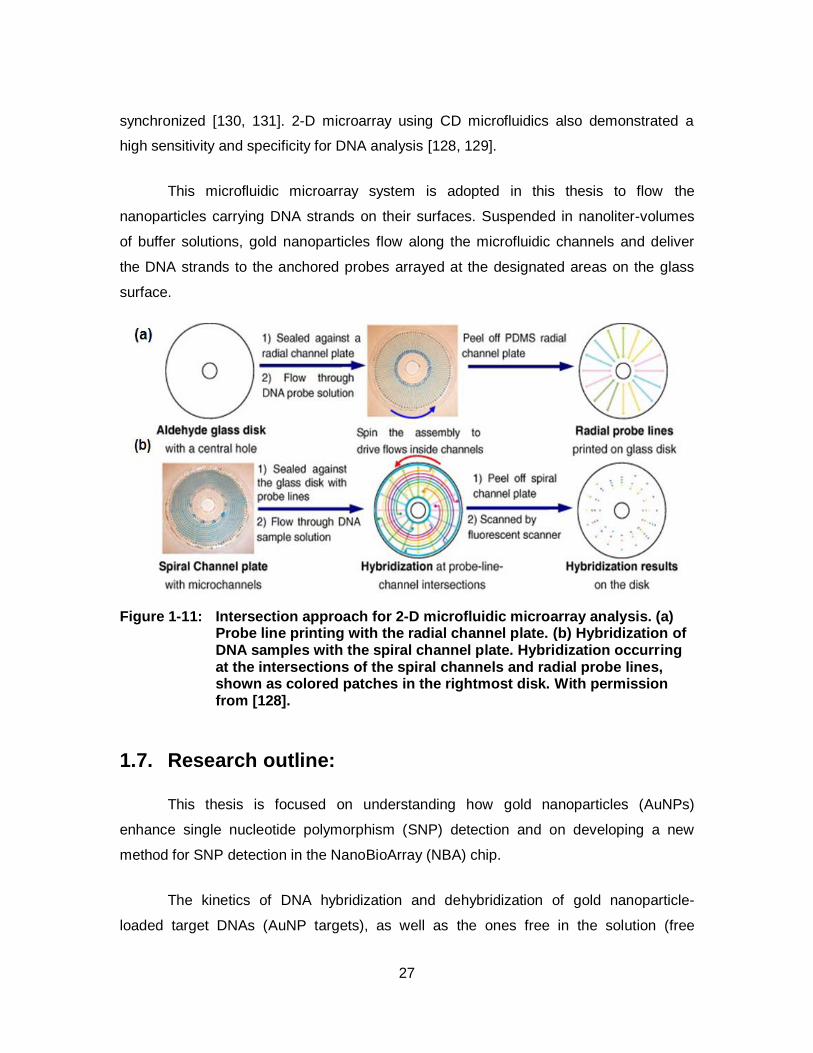
27
synchronized [130, 131]. 2-D microarray using CD microfluidics also demonstrated a
high sensitivity and specificity for DNA analysis [128, 129].
This microfluidic microarray system is adopted in this thesis to flow the
nanoparticles carrying DNA strands on their surfaces. Suspended in nanoliter-volumes
of buffer solutions, gold nanoparticles flow along the microfluidic channels and deliver
the DNA strands to the anchored probes arrayed at the designated areas on the glass
surface.
Figure 1-11: Intersection approach for 2-D microfluidic microarray analysis. (a) Probe line printing with the radial channel plate. (b) Hybridization of DNA samples with the spiral channel plate. Hybridization occurring at the intersections of the spiral channels and radial probe lines, shown as colored patches in the rightmost disk. With permission from [128].
1.7. Research outline:
This thesis is focused on understanding how gold nanoparticles (AuNPs)
enhance single nucleotide polymorphism (SNP) detection and on developing a new
method for SNP detection in the NanoBioArray (NBA) chip.
The kinetics of DNA hybridization and dehybridization of gold nanoparticle-
loaded target DNAs (AuNP targets), as well as the ones free in the solution (free
28
targets), were studied using surface plasmon resonance (SPR) spectroscopy. The rate
constants obtained from SPR spectroscopy were used to extract kinetic information to
understand the mechanism of the influence of AuNPs on DNA hybridization, according
to transition state theory (TST). The rate constants were used in a Langmuir model to
simulate surface DNA hybridization of AuNP targets in the channels of the NBA chip.
The simulated data was used to optimize a room-temperature SNP detection method in
the NBA chip for detection of SNPs in the KRAS gene.
Then, a novel wash method using AuNPs was developed to maintain the
sensitivity of DNA hybridization signals in CD-NBA chip for SNP detection. This method
is simple and compatible with the multiplexed DNA hybridization settings. More
importantly, the AuNP wash method enjoys a targeted mechanism that enhances
specificity without compromising signal intensity.
This thesis is organised in 6 chapters. Described as follows:
In chapter 1, the basic concepts, recent advances and challenges of nucleic acid
detection using the microarray technology, and the interactions between gold
nanoparticles and DNA strands are discussed. Part of the recent advances and
challenges is published as a book chapter. (A. Sedighi, and P. C. H. Li. “Challenges and
future trends in DNA microarray analysis” in “Fundamentals of Advanced Omics
Technologies: From Genes to Metabolites”, Elsevier Science, 2013).
In chapter 2, the details of the experimental procedures, the techniques involved,
and the technology and instrumentation used in chip fabrication, array printing, DNA
hybridization and signal detection in NBA chip are described. Other methods used such
as DNA amplification using polymerase chain reaction (PCR), preparation of AuNP-
loaded DNAs, kinetic analysis using surface plasmon resonance (SPR) spectroscopy,
melting temperature analysis, dynamic light scattering (DLS) and transmission electron
microscopy (TEM) are described.
In chapter 3, we describe two studies, namely (1) the determination of the
hybridization and dehybridization rate constants of AuNP targets using SPR data, and
(2) the use of transition state theory (TST) to extract mechanistic information (activation
29
parameters) about DNA hybridization from the rate constants are described. Based on
these studies, new mechanisms of DNA hybridization and dehybridization as influenced
by gold nanoparticles are proposed. The results have been published in ACS Nano (A.
Sedighi, P. C. H. Li, I. C. Pekcevik, B. D. Gates, A Proposed Mechanism of the Influence
of Gold Nanoparticles on DNA Hybridization. ACS Nano, 2014, 8(7), 6765-6777)
In chapter 4, a Langmuir kinetic model is created to simulate mass transfer of
DNA targets loaded on AuNPs delivered in the NBA channels, and the hybridization
reaction of these AuNP-loaded targets with the surface-immobilized probes using the
rate constants determined in chapter 3. The simulated data (obtained by COMSOL) is
used to optimize surface hybridization reaction in the NBA chip. Using this information, a
method for SNP analysis of PCR-amplified genomic DNAs is developed. Part of this
study was published in Analytical Biochemistry (A. Sedighi, P. C. H. Li, KRAS Gene
Codon 12 Mutation Detection Enabled by Gold Nanoparticles Conducted in a
NanoBioArray Chip. Analytical Biochemistry, 2014, 448, 58-64).
In chapter 5, the findings in chapter 3 are used to develop a novel AuNP-based
wash technique that specifically removes the nonspecific signals. The CD-NBA chip is
used because of its high throughput capability. The AuNP wash method enhances the
specificity of DNA hybridization while maintaining the detection sensitivity. Different
experimental factors that affect the performance of the AuNP wash technique are
investigated and optimized. A manuscript entitled “Targeted destabilization of DNA using
gold nanoparticles offers specificity without compromising sensitivity for nucleic acid
analyses” has been prepared for submission.
In chapter 6, a summary of the findings of the research including the proposed
mechanisms for DNA hybridization and dehybridization of AuNP targets, the technique
developed for SNP detection of the KRAS gene codon 12, and the AuNP wash method,
as well as the general outcome and application of the findings are provided. The
perspective and future direction are also discussed.
There are 4 appendices. In appendix A, the detailed procedures of modeling of
mass transfer and DNA hybridization in COMSOL, used in chapter 4, are given. In
Appendix B, the method used to confirm the rate constants obtained from BIAevaluation

30
software is described. In appendix C, the analysis on the effect of residual free targets
present in the AuNP target solutions on the hybridization rate constants is presented. In
appendix D, the calculations to extract the activation enthalpy and activation entropy of
DNA hybridization from the rate constants are described.
31
Chapter 2. Experimental Section
Here, the experimental approaches used in this thesis are described. The
methods involved in the SNP detection in the NanoBioArray (NBA) chip (Chapter 4) and
also in CD-NanoBioArray (CD-NBA) chip (Chapter 5) such as microchip fabrication,
functionalization of glass surfaces, probe immobilization, DNA amplification, preparation
of AuNP-loaded targets, DNA hybridization and signal visualization are provided in
detail. The other experimental methods such as hyperchromicity experiments for DNA
melting temperature analysis (Chapter 3), kinetic analysis using Surface Plasmon
Resonance (SPR) spectroscopy (Chapter 3 and 5), Dynamic Light Scattering (Chapter
4) and analysis of DNA adsorption on AuNPs (Chapter 5) are also described.
2.1. Materials
The negative photoresist SU-8 50 and SU-8 developer were purchased from
MicroChem Corp (Newton, MA, USA). Circular silicon wafers (4-inch diameter) were
obtained from Cemat Silicon SA (Warsaw, Poland). SYLGARD 184 silicone elastomer kit
and silicone sealant 732 were provided by Dow Corning Corp. (Midland, MI). The
channel pattern for photomask was designed using a software (Visual Basic or L-Edit)
and was printed at high-resolution (>3000 dpi) [132]. Dimethyldichlorosilane solution 2%
in octamethylcyclotetrasiloxane (Repel silane) was obtained from GE Healthcare
(Uppsala, Sweden). Rectangular microscope slides (3 × 2 inch) and circular glass chips
(4-inch diameter) were obtained from Precision Glass & Optics (Santa Ana, CA, USA).
Gold nanoparticles (stabilized with citrate and tannic acid) of 5, 10 and 20 nm
diameter were purchased from Sigma Life Science and 12-nm diameter gold
32
nanoparticles (capped with citrate) were obtained from NanoComposix (CA, USA).
Cetyl-3-methylammonium bromide (CTAB, ≥98%) was purchased from Sigma-Aldrich).
All the reagents and materials required for surface plasmon resonance (SPR)
experiments including 1-ethyl-3-(3-dimethylaminopropyl) carbodiimide (EDC), N-
hydroxysuccinimide (NHS), ethanolamine-HCl (pH 8.5), HBS-N Buffer (0.01 M HEPES
pH 7.4, 0.15 M NaCl) and CM5 sensor chips, were provided by GE Healthcare (UK).
All oligonucleotides and the primers were synthesized and modified by Integrated
DNA Technologies (Coralville, IA). 20-mer and 60-mer target oligonucleotides with the
sequence of KRAS gene [133], were modified by biotin molecule at the 5’- end (Table 2-
1). The sequences were designed in such a way that the codon 12 sequence was
located at the center of the oligonucleotides. Four different 20-mer oligonucleotide
probes (W, A, D, V), each of them complementary to the KRAS targets of 20-mer (W20,
D20) and of 60-mer (W60, A60, D60, V60), were designed. The probes were modified
with an amine group and a C12 spacer at the 5′-end. In addition, 20-mer target
oligonucleotides with B21 and NB21 sequences related to a previous study [115],
modified by biotin molecule at the 5’- end, together with the complementary probe
sequences (AB, ANB), were used.
The genomic DNA samples, containing different allele compositions of the KRAS
gene codon 12 were obtained from Horizon Diagnostics (Cambridge, UK). One of the
samples contained the pure wild-type allele, and the other contained a mixture of 50%
wild type and 50% G12D mutant (the genotypes were characterized by the vendor using
Sanger sequencing). In order to obtain the 80-bp PCR products, a pair of specific
primers (forward and reverse, See Table 2-1) was used. A DNA amplification kit
including 10X amplification buffer, dNTP solution (10 mM), MgCl2 and Taq DNA
polymerase was purchased from Life Technologies (Burlington, ON, Canada). The
QIAquick nucleotide removal kit including spin columns, buffer PNI, buffer PE, buffer EB
and collection tubes was obtained from Qiagen Inc.(Toronto, ON, Canada).
Different solutions and mixtures used in this study were prepared as follows:
• Piranha solution: sulfuric acid (98%) was mixed with hydrogen peroxide (30%) in a 7:3 ratio. Piranha solution is a hazardous and corrosive solution, which
33
must be handled with extreme caution. Personal protective equipment such as full face shield and heavy duty gloves must be used. Hydrogen peroxide should always be added slowly to the acid.
• Nox solution: The concentrated Liqui-Nox (Alconox, White Plains, NY) was diluted in 10 volumes of deionized (DI) water (18 MΩ cm-1).
• Sparkleen detergent: 10% w/v of Sparkleen powder was dissolved in DI water in a wash bottle.
• APTES solution: 2% v/v of 3-aminopropyltriethoxysilane (APTES) obtained from Sigma-Aldrich (Oakville, ON, Canada) was prepared in anhydrous ethanol.
• Phosphate buffer silane (PBS) 20X: 60.00 g NaCl (≥99.0%), 2.00 g KCl (≥99.0%), 14.4 g Na2HPO4 (99.95%) and 2.4 g KH2PO4 (≥99.0%) were dissolved in 500 ml of DI water.
• 5% Glutaraldehyde solution: 20 ml glutaraldehyde (25% in H2O, Grade I) obtained from Sigma-Aldrich (Oakville, ON, Canada), 5 ml PBS 20X and 75 ml of DI water were mixed. Glutaraldehyde is toxic and a is strong irritant and should be handled inside the fume hood. Glutaraldehyde also degrades at room temperature and it should be stored at 4 °C.
• DNA probe stock solution: 500 µM of probe solution were prepared in DI water.
• Immobilization buffer: 0.15 M of sodium bicarbonate and 1.5 M of NaCl were prepared in DI water.
• Probe solutions: 2 ± 0.1 µL of probe stock solution was mixed in 38 µL of immobilization buffer.
• Reduction solution: 50 mg sodium borohydride, 0.75 ml PBS 20X, 0.1 ml Triton X 100 (10%), 5 ml ethanol 95% were added in a Falcon tube and the mix was diluted with DI water to 20 ml.
• Blocking solution: 20 mg of bovine serum albumin (≥98.0%, Sigma-Aldrich, Oakville, ON, Canada) was mixed in 20 ml PBS solution.
• Forward primer: 5 µM solution of forward primer was prepared in DI water.
• Reverse primer: 5 µM solution of reverse primer was prepared in DI water.
• Buffer PNI: 12.5mL of PNI buffer were mixed with 19 mL of isopropanol. This buffer was used in DNA purification.
• Buffer PE: 6 mL of PE buffer were mixed with 24 mL of ethanol. This buffer was used in DNA purification.
• Saline sodium citrate (SSC) 10X: 44.3 g sodium citrate (C6H5Na3O7.2H2O, ≥99.0%) (Sigma-Aldrich Oakville, ON, Canada) and 87.6 of NaCl were dissolved in 1000 mL of DI water and pH was adjusted to 7 using 0.1 M HCl.
34
• Sodium dodecyl sulphate (SDS) 1.5%: 150 mg of solid SDS (molecular biology grade, Sigma-Aldrich, Oakville, ON, Canada) was added to 15 mL of DI water.
• Target solutions (10 nM of oligonucleotide solutions): 2 µL of target stock solution (100 nM), 2 µL of SSC 10X and 2 µL of SDS 1.5%, and 14 µL of DI water were mixed and centrifuged in a microcentrifuge tube.
• Target solutions (PCR products): 4 µL of purified PCR products and 10 µL of DI water were mixed in a microcentrifuge tube, placed the tube in a water bath on a hot plate at 95 °C for 3 min. The solution was cooled down by placing it in an ice bath for 5 min. and was centrifuged, 2 µL of SSC 10X and 2 µL of SDS 1.5% was added to the solution and mixed.
• SA-Cy5 solution (50 µg/mL): 5 µL of streptavidin-Cy5 stock solution (1 mg/L) (Life Technologies, Burlington, ON, Canada) were mixed with 10 µL of Tween 20 (1.5%) and 85 µL of DI water.
• PBS wash solution: 50 µL of PBS 20X solution were mixed with100 µL of Tween 20 (1.5%) and 850 µL of DI water.
2.2. Apparatus and equipment
A spin coater WS-400 (Laurell Technologies Corp., North Wales, PA, USA) was
used to coat SU-8 on the silicon wafer. The thermocycler (Perkin Elmer, Waltham, MA,
USA) was used for PCR amplification. UV-Visible spectrophotometer (Cary 300 Bio,
Varian) was used to obtain melting temperature of the DNA duplexes. A microcentrifuge
Model V (VMR Scientific) was used for all centrifugations. Two different confocal
fluorescence scanners were used for signal visualization of the duplexes in the NBA
chip. The signals reported in chapter 4 were obtained using a Typhoon 9410 (GE
Healthcare) instruments, and the ones in chapter 5 were obtained using a Typhoon
Trio+ instrument (GE Healthcare). The SPR measurements were performed using a
BIAcore X100 instrument (GE Healthcare). The TEM images were obtained using a
transmission electron microscope (H-8100, Hitachi). The kinetics of DNA adsorption on
the AuNP surface was studied using a fluorescence spectrophotometer (Photon
Technology International). The dynamic light scattering (DLS) experiments were
performed on a Zetasizer Nano instrument (Malvern Instruments, UK).
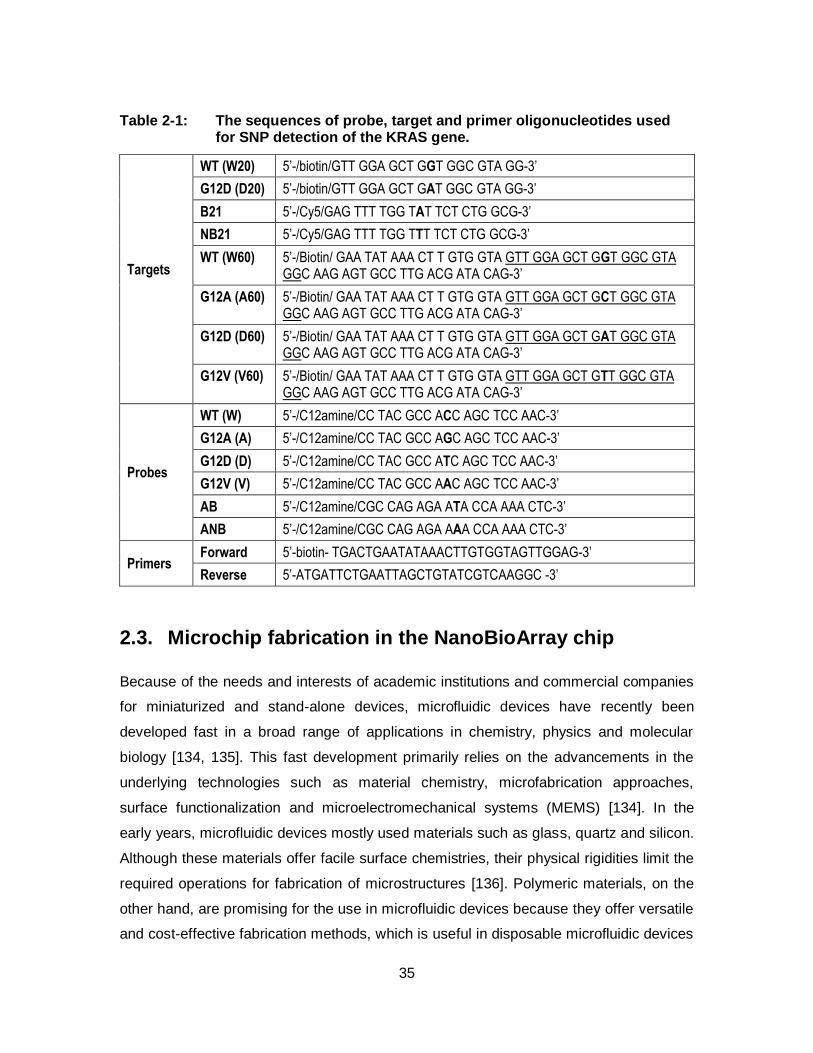
35
Table 2-1: The sequences of probe, target and primer oligonucleotides used for SNP detection of the KRAS gene.
Targets
WT (W20) 5’-/biotin/GTT GGA GCT GGT GGC GTA GG-3’
G12D (D20) 5’-/biotin/GTT GGA GCT GAT GGC GTA GG-3’
B21 5’-/Cy5/GAG TTT TGG TAT TCT CTG GCG-3’
NB21 5’-/Cy5/GAG TTT TGG TTT TCT CTG GCG-3’
WT (W60) 5’-/Biotin/ GAA TAT AAA CT T GTG GTA GTT GGA GCT GGT GGC GTA GGC AAG AGT GCC TTG ACG ATA CAG-3’
G12A (A60) 5’-/Biotin/ GAA TAT AAA CT T GTG GTA GTT GGA GCT GCT GGC GTA GGC AAG AGT GCC TTG ACG ATA CAG-3’
G12D (D60) 5’-/Biotin/ GAA TAT AAA CT T GTG GTA GTT GGA GCT GAT GGC GTA GGC AAG AGT GCC TTG ACG ATA CAG-3’
G12V (V60) 5’-/Biotin/ GAA TAT AAA CT T GTG GTA GTT GGA GCT GTT GGC GTA GGC AAG AGT GCC TTG ACG ATA CAG-3’
Probes
WT (W) 5’-/C12amine/CC TAC GCC ACC AGC TCC AAC-3’
G12A (A) 5’-/C12amine/CC TAC GCC AGC AGC TCC AAC-3’
G12D (D) 5’-/C12amine/CC TAC GCC ATC AGC TCC AAC-3’
G12V (V) 5’-/C12amine/CC TAC GCC AAC AGC TCC AAC-3’
AB 5’-/C12amine/CGC CAG AGA ATA CCA AAA CTC-3’
ANB 5’-/C12amine/CGC CAG AGA AAA CCA AAA CTC-3’
Primers Forward 5’-biotin- TGACTGAATATAAACTTGTGGTAGTTGGAG-3’
Reverse 5’-ATGATTCTGAATTAGCTGTATCGTCAAGGC -3’
2.3. Microchip fabrication in the NanoBioArray chip
Because of the needs and interests of academic institutions and commercial companies
for miniaturized and stand-alone devices, microfluidic devices have recently been
developed fast in a broad range of applications in chemistry, physics and molecular
biology [134, 135]. This fast development primarily relies on the advancements in the
underlying technologies such as material chemistry, microfabrication approaches,
surface functionalization and microelectromechanical systems (MEMS) [134]. In the
early years, microfluidic devices mostly used materials such as glass, quartz and silicon.
Although these materials offer facile surface chemistries, their physical rigidities limit the
required operations for fabrication of microstructures [136]. Polymeric materials, on the
other hand, are promising for the use in microfluidic devices because they offer versatile
and cost-effective fabrication methods, which is useful in disposable microfluidic devices
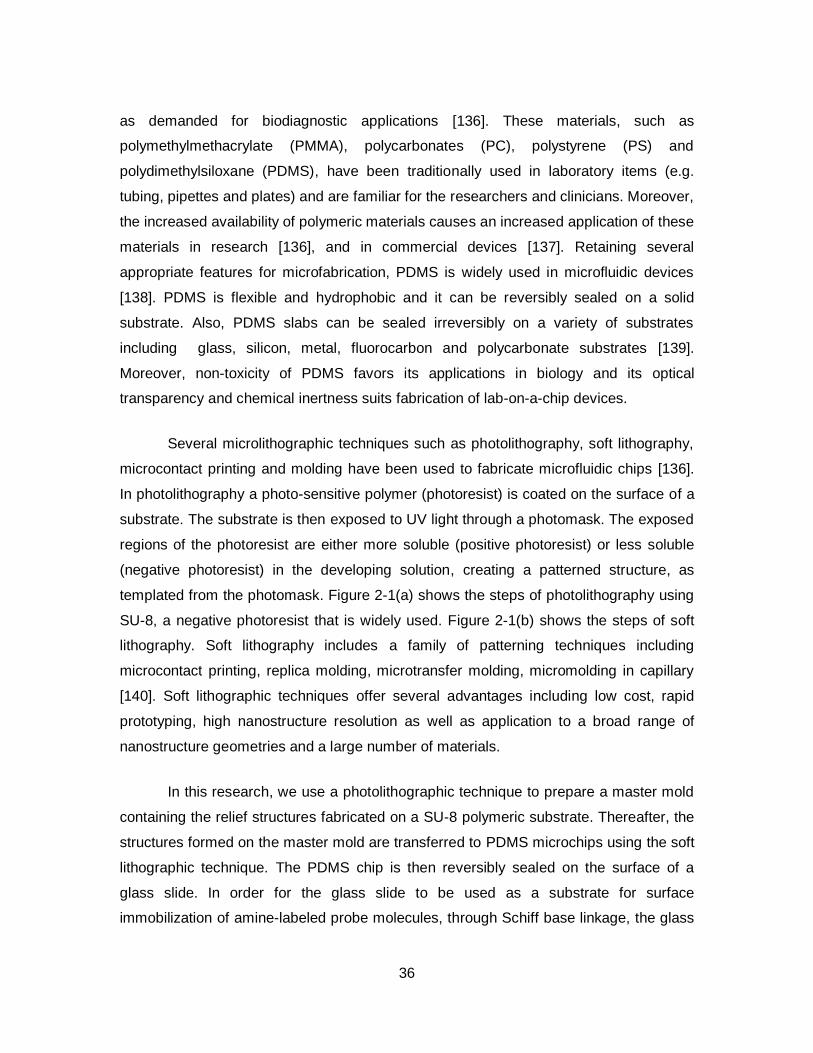
36
as demanded for biodiagnostic applications [136]. These materials, such as
polymethylmethacrylate (PMMA), polycarbonates (PC), polystyrene (PS) and
polydimethylsiloxane (PDMS), have been traditionally used in laboratory items (e.g.
tubing, pipettes and plates) and are familiar for the researchers and clinicians. Moreover,
the increased availability of polymeric materials causes an increased application of these
materials in research [136], and in commercial devices [137]. Retaining several
appropriate features for microfabrication, PDMS is widely used in microfluidic devices
[138]. PDMS is flexible and hydrophobic and it can be reversibly sealed on a solid
substrate. Also, PDMS slabs can be sealed irreversibly on a variety of substrates
including glass, silicon, metal, fluorocarbon and polycarbonate substrates [139].
Moreover, non-toxicity of PDMS favors its applications in biology and its optical
transparency and chemical inertness suits fabrication of lab-on-a-chip devices.
Several microlithographic techniques such as photolithography, soft lithography,
microcontact printing and molding have been used to fabricate microfluidic chips [136].
In photolithography a photo-sensitive polymer (photoresist) is coated on the surface of a
substrate. The substrate is then exposed to UV light through a photomask. The exposed
regions of the photoresist are either more soluble (positive photoresist) or less soluble
(negative photoresist) in the developing solution, creating a patterned structure, as
templated from the photomask. Figure 2-1(a) shows the steps of photolithography using
SU-8, a negative photoresist that is widely used. Figure 2-1(b) shows the steps of soft
lithography. Soft lithography includes a family of patterning techniques including
microcontact printing, replica molding, microtransfer molding, micromolding in capillary
[140]. Soft lithographic techniques offer several advantages including low cost, rapid
prototyping, high nanostructure resolution as well as application to a broad range of
nanostructure geometries and a large number of materials.
In this research, we use a photolithographic technique to prepare a master mold
containing the relief structures fabricated on a SU-8 polymeric substrate. Thereafter, the
structures formed on the master mold are transferred to PDMS microchips using the soft
lithographic technique. The PDMS chip is then reversibly sealed on the surface of a
glass slide. In order for the glass slide to be used as a substrate for surface
immobilization of amine-labeled probe molecules, through Schiff base linkage, the glass
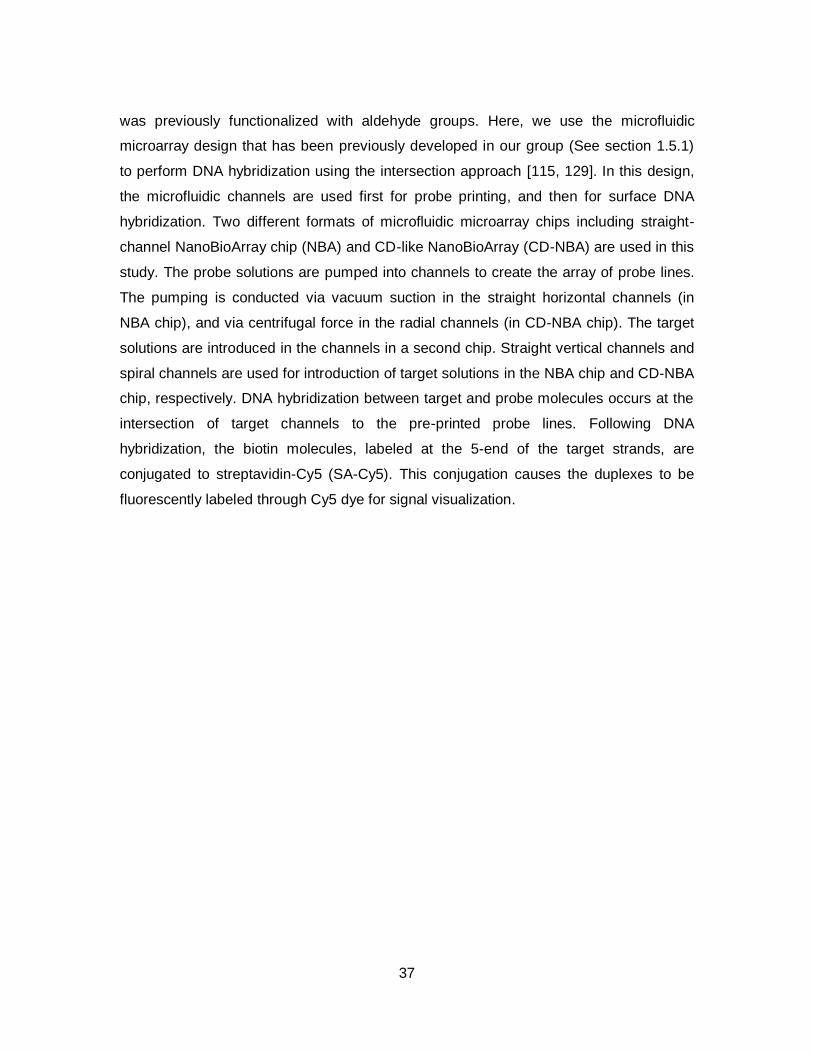
37
was previously functionalized with aldehyde groups. Here, we use the microfluidic
microarray design that has been previously developed in our group (See section 1.5.1)
to perform DNA hybridization using the intersection approach [115, 129]. In this design,
the microfluidic channels are used first for probe printing, and then for surface DNA
hybridization. Two different formats of microfluidic microarray chips including straight-
channel NanoBioArray chip (NBA) and CD-like NanoBioArray (CD-NBA) are used in this
study. The probe solutions are pumped into channels to create the array of probe lines.
The pumping is conducted via vacuum suction in the straight horizontal channels (in
NBA chip), and via centrifugal force in the radial channels (in CD-NBA chip). The target
solutions are introduced in the channels in a second chip. Straight vertical channels and
spiral channels are used for introduction of target solutions in the NBA chip and CD-NBA
chip, respectively. DNA hybridization between target and probe molecules occurs at the
intersection of target channels to the pre-printed probe lines. Following DNA
hybridization, the biotin molecules, labeled at the 5-end of the target strands, are
conjugated to streptavidin-Cy5 (SA-Cy5). This conjugation causes the duplexes to be
fluorescently labeled through Cy5 dye for signal visualization.
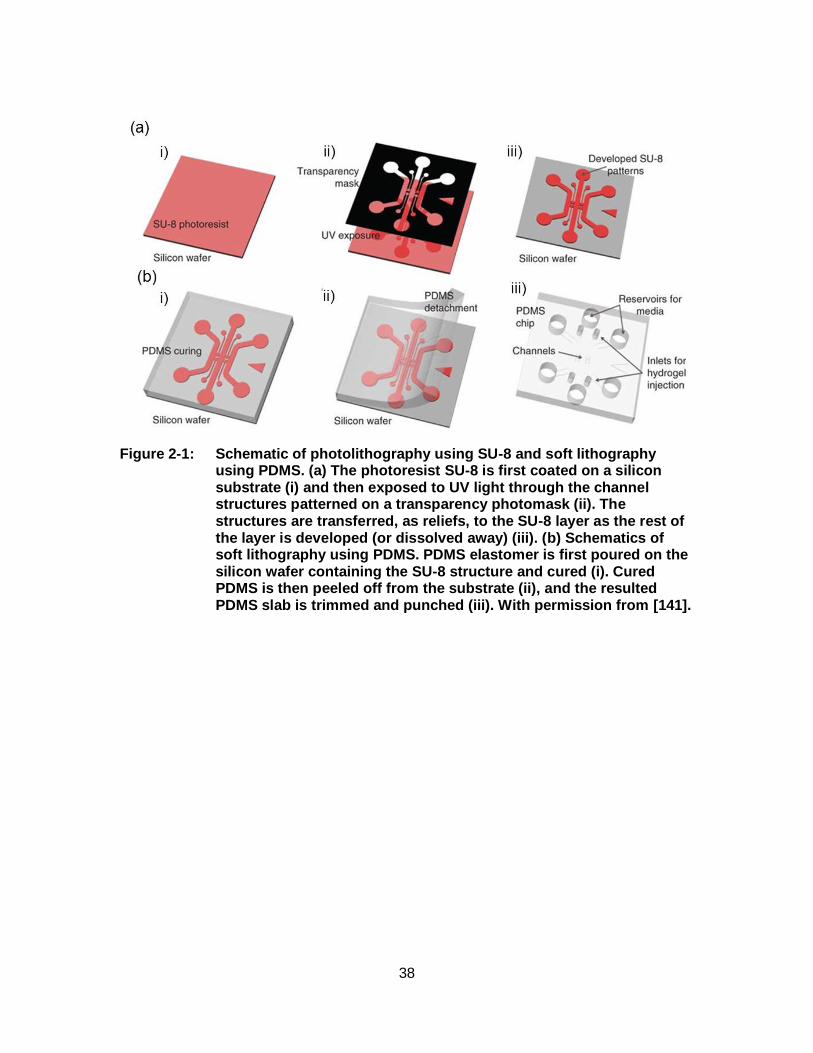
38
Figure 2-1: Schematic of photolithography using SU-8 and soft lithography using PDMS. (a) The photoresist SU-8 is first coated on a silicon substrate (i) and then exposed to UV light through the channel structures patterned on a transparency photomask (ii). The structures are transferred, as reliefs, to the SU-8 layer as the rest of the layer is developed (or dissolved away) (iii). (b) Schematics of soft lithography using PDMS. PDMS elastomer is first poured on the silicon wafer containing the SU-8 structure and cured (i). Cured PDMS is then peeled off from the substrate (ii), and the resulted PDMS slab is trimmed and punched (iii). With permission from [141].
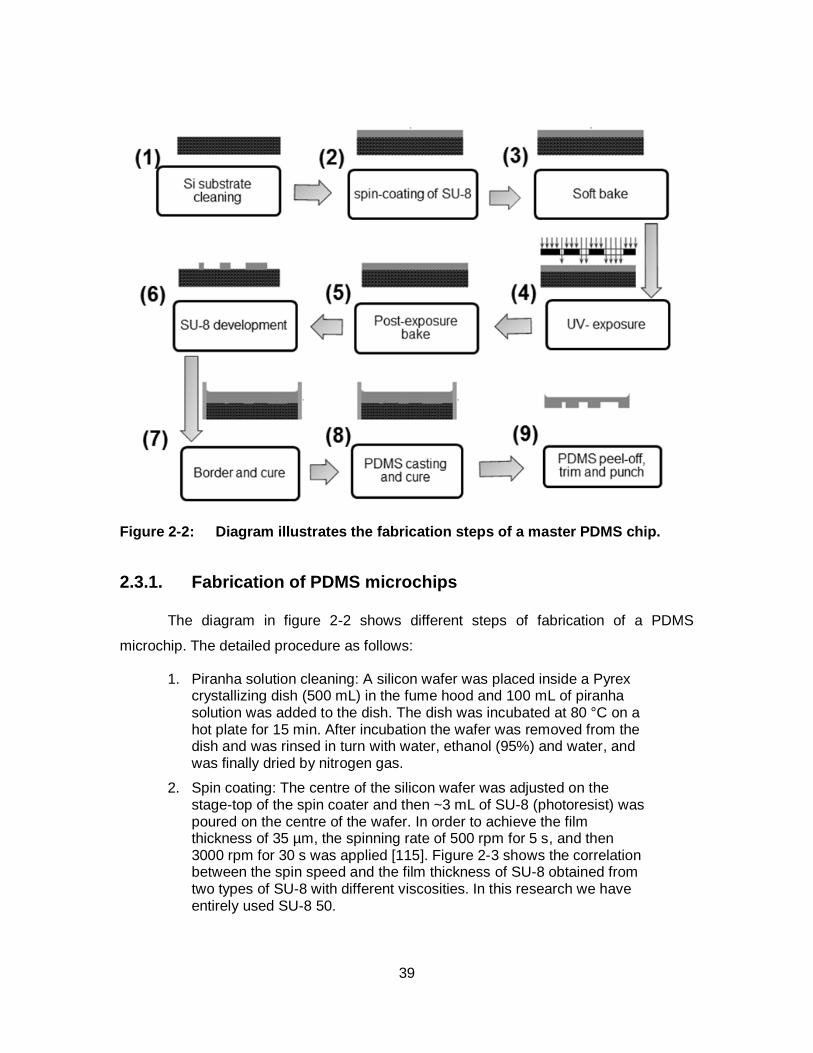
39
Figure 2-2: Diagram illustrates the fabrication steps of a master PDMS chip.
2.3.1. Fabrication of PDMS microchips
The diagram in figure 2-2 shows different steps of fabrication of a PDMS
microchip. The detailed procedure as follows:
1. Piranha solution cleaning: A silicon wafer was placed inside a Pyrex crystallizing dish (500 mL) in the fume hood and 100 mL of piranha solution was added to the dish. The dish was incubated at 80 °C on a hot plate for 15 min. After incubation the wafer was removed from the dish and was rinsed in turn with water, ethanol (95%) and water, and was finally dried by nitrogen gas.
2. Spin coating: The centre of the silicon wafer was adjusted on the stage-top of the spin coater and then ~3 mL of SU-8 (photoresist) was poured on the centre of the wafer. In order to achieve the film thickness of 35 µm, the spinning rate of 500 rpm for 5 s, and then 3000 rpm for 30 s was applied [115]. Figure 2-3 shows the correlation between the spin speed and the film thickness of SU-8 obtained from two types of SU-8 with different viscosities. In this research we have entirely used SU-8 50.
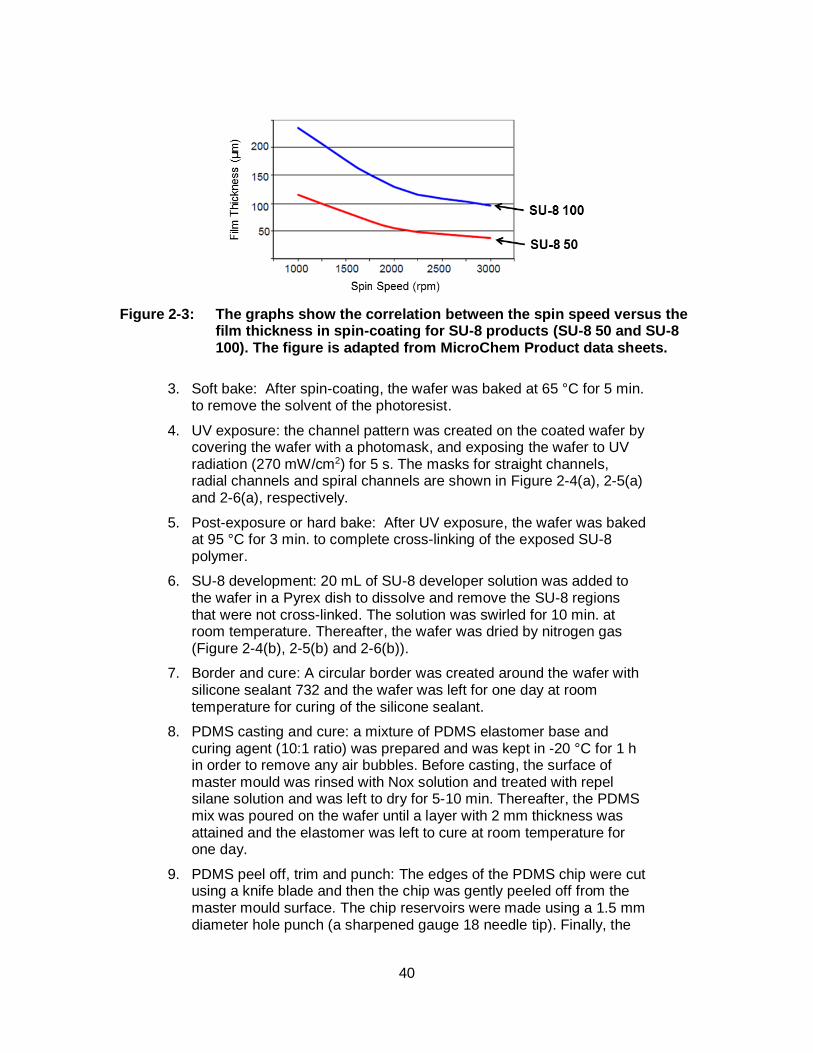
40
Figure 2-3: The graphs show the correlation between the spin speed versus the film thickness in spin-coating for SU-8 products (SU-8 50 and SU-8 100). The figure is adapted from MicroChem Product data sheets.
3. Soft bake: After spin-coating, the wafer was baked at 65 °C for 5 min. to remove the solvent of the photoresist.
4. UV exposure: the channel pattern was created on the coated wafer by covering the wafer with a photomask, and exposing the wafer to UV radiation (270 mW/cm2) for 5 s. The masks for straight channels, radial channels and spiral channels are shown in Figure 2-4(a), 2-5(a) and 2-6(a), respectively.
5. Post-exposure or hard bake: After UV exposure, the wafer was baked at 95 °C for 3 min. to complete cross-linking of the exposed SU-8 polymer.
6. SU-8 development: 20 mL of SU-8 developer solution was added to the wafer in a Pyrex dish to dissolve and remove the SU-8 regions that were not cross-linked. The solution was swirled for 10 min. at room temperature. Thereafter, the wafer was dried by nitrogen gas (Figure 2-4(b), 2-5(b) and 2-6(b)).
7. Border and cure: A circular border was created around the wafer with silicone sealant 732 and the wafer was left for one day at room temperature for curing of the silicone sealant.
8. PDMS casting and cure: a mixture of PDMS elastomer base and curing agent (10:1 ratio) was prepared and was kept in -20 °C for 1 h in order to remove any air bubbles. Before casting, the surface of master mould was rinsed with Nox solution and treated with repel silane solution and was left to dry for 5-10 min. Thereafter, the PDMS mix was poured on the wafer until a layer with 2 mm thickness was attained and the elastomer was left to cure at room temperature for one day.
9. PDMS peel off, trim and punch: The edges of the PDMS chip were cut using a knife blade and then the chip was gently peeled off from the master mould surface. The chip reservoirs were made using a 1.5 mm diameter hole punch (a sharpened gauge 18 needle tip). Finally, the

41
chip was washed with Nox solution and was dried by nitrogen gas (Figure 2-4(c), 2-5(c) and 2-6(c)).
Figure 2-4: The image shows the transfer of straight channels from photomask (a) to master mould (b) and then to the straight-channel PDMS chip (c). the straight channels are 200 µm wide and 35 µm deep.
Figure 2-5: The image shows transfer of the pattern of radial channels from photomask (a) to master mould (b) and then to the radial-channel PDMS chip (c). The radial channels are 200 µm wide and 35 µm deep.
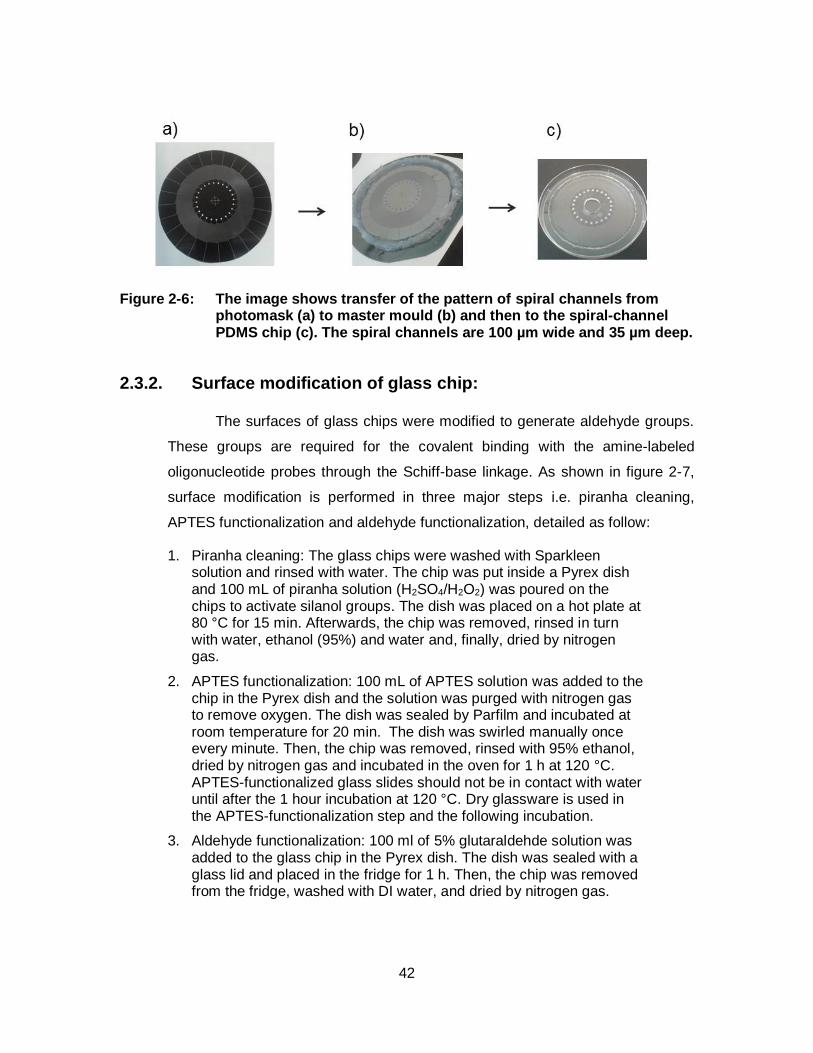
42
Figure 2-6: The image shows transfer of the pattern of spiral channels from photomask (a) to master mould (b) and then to the spiral-channel PDMS chip (c). The spiral channels are 100 µm wide and 35 µm deep.
2.3.2. Surface modification of glass chip:
The surfaces of glass chips were modified to generate aldehyde groups.
These groups are required for the covalent binding with the amine-labeled
oligonucleotide probes through the Schiff-base linkage. As shown in figure 2-7,
surface modification is performed in three major steps i.e. piranha cleaning,
APTES functionalization and aldehyde functionalization, detailed as follow:
1. Piranha cleaning: The glass chips were washed with Sparkleen solution and rinsed with water. The chip was put inside a Pyrex dish and 100 mL of piranha solution (H2SO4/H2O2) was poured on the chips to activate silanol groups. The dish was placed on a hot plate at 80 °C for 15 min. Afterwards, the chip was removed, rinsed in turn with water, ethanol (95%) and water and, finally, dried by nitrogen gas.
2. APTES functionalization: 100 mL of APTES solution was added to the chip in the Pyrex dish and the solution was purged with nitrogen gas to remove oxygen. The dish was sealed by Parfilm and incubated at room temperature for 20 min. The dish was swirled manually once every minute. Then, the chip was removed, rinsed with 95% ethanol, dried by nitrogen gas and incubated in the oven for 1 h at 120 °C. APTES-functionalized glass slides should not be in contact with water until after the 1 hour incubation at 120 °C. Dry glassware is used in the APTES-functionalization step and the following incubation.
3. Aldehyde functionalization: 100 ml of 5% glutaraldehde solution was added to the glass chip in the Pyrex dish. The dish was sealed with a glass lid and placed in the fridge for 1 h. Then, the chip was removed from the fridge, washed with DI water, and dried by nitrogen gas.
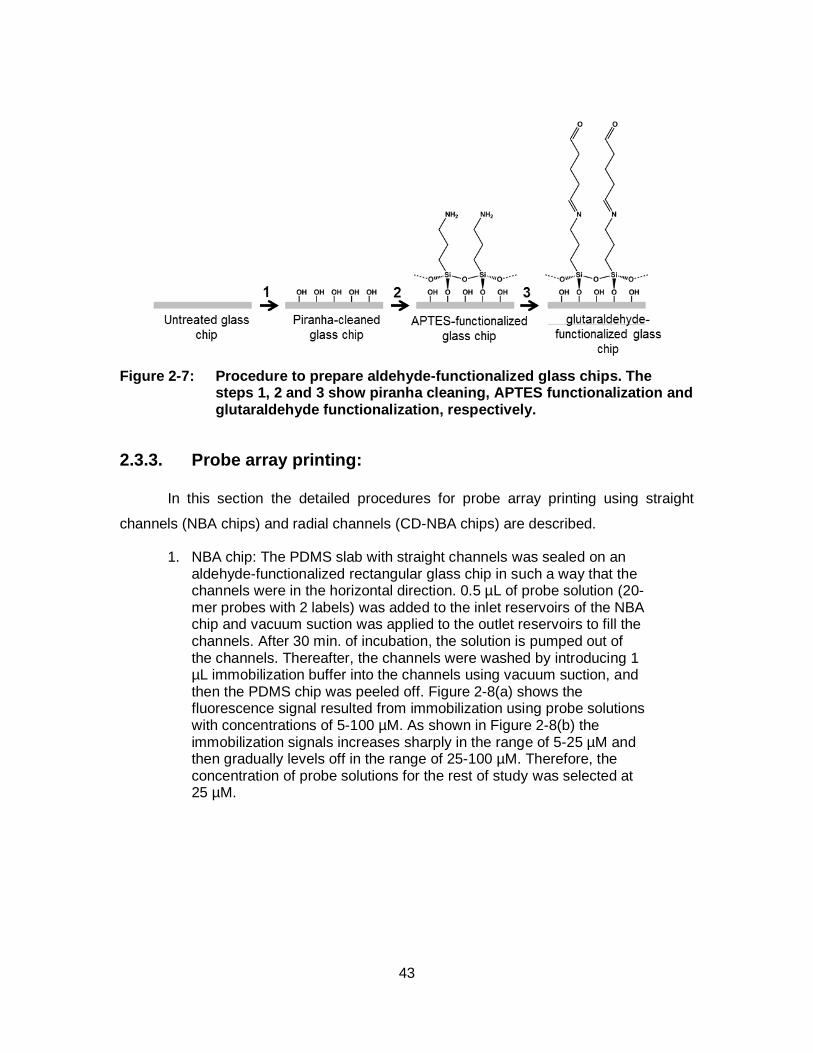
43
Figure 2-7: Procedure to prepare aldehyde-functionalized glass chips. The steps 1, 2 and 3 show piranha cleaning, APTES functionalization and glutaraldehyde functionalization, respectively.
2.3.3. Probe array printing:
In this section the detailed procedures for probe array printing using straight
channels (NBA chips) and radial channels (CD-NBA chips) are described.
1. NBA chip: The PDMS slab with straight channels was sealed on an aldehyde-functionalized rectangular glass chip in such a way that the channels were in the horizontal direction. 0.5 µL of probe solution (20-mer probes with 2 labels) was added to the inlet reservoirs of the NBA chip and vacuum suction was applied to the outlet reservoirs to fill the channels. After 30 min. of incubation, the solution is pumped out of the channels. Thereafter, the channels were washed by introducing 1 µL immobilization buffer into the channels using vacuum suction, and then the PDMS chip was peeled off. Figure 2-8(a) shows the fluorescence signal resulted from immobilization using probe solutions with concentrations of 5-100 µM. As shown in Figure 2-8(b) the immobilization signals increases sharply in the range of 5-25 µM and then gradually levels off in the range of 25-100 µM. Therefore, the concentration of probe solutions for the rest of study was selected at 25 µM.
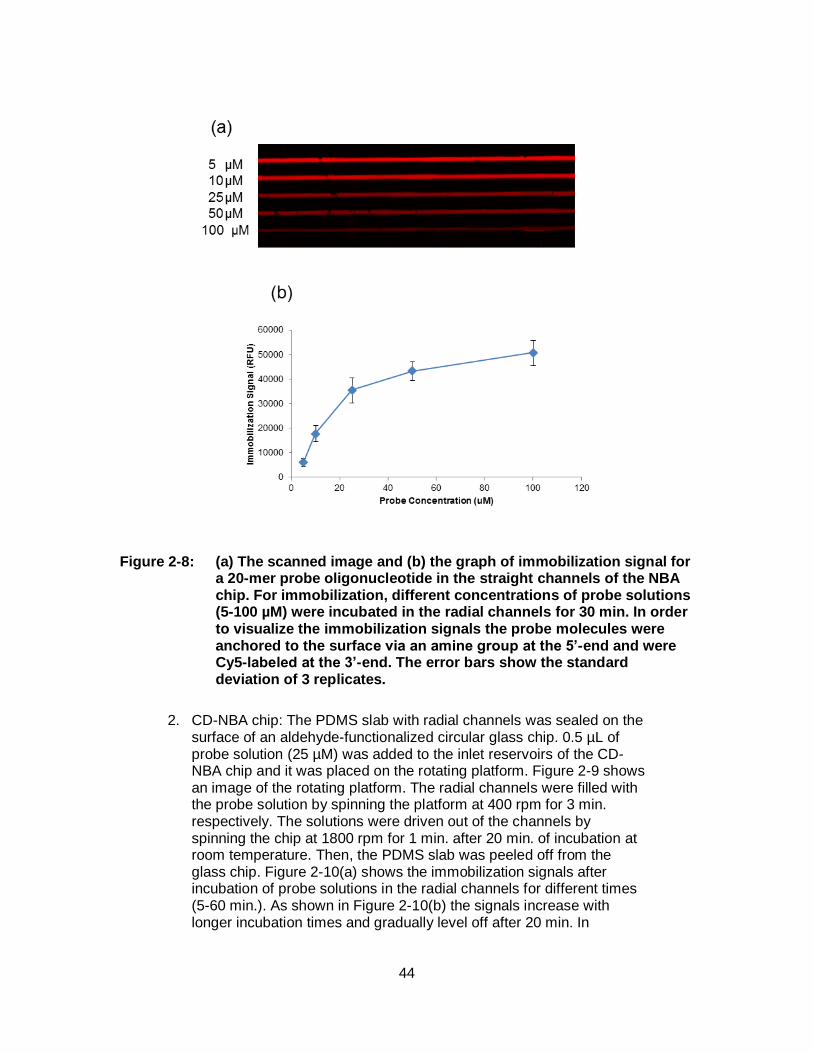
44
Figure 2-8: (a) The scanned image and (b) the graph of immobilization signal for a 20-mer probe oligonucleotide in the straight channels of the NBA chip. For immobilization, different concentrations of probe solutions (5-100 µM) were incubated in the radial channels for 30 min. In order to visualize the immobilization signals the probe molecules were anchored to the surface via an amine group at the 5’-end and were Cy5-labeled at the 3’-end. The error bars show the standard deviation of 3 replicates.
2. CD-NBA chip: The PDMS slab with radial channels was sealed on the surface of an aldehyde-functionalized circular glass chip. 0.5 µL of probe solution (25 µM) was added to the inlet reservoirs of the CD-NBA chip and it was placed on the rotating platform. Figure 2-9 shows an image of the rotating platform. The radial channels were filled with the probe solution by spinning the platform at 400 rpm for 3 min. respectively. The solutions were driven out of the channels by spinning the chip at 1800 rpm for 1 min. after 20 min. of incubation at room temperature. Then, the PDMS slab was peeled off from the glass chip. Figure 2-10(a) shows the immobilization signals after incubation of probe solutions in the radial channels for different times (5-60 min.). As shown in Figure 2-10(b) the signals increase with longer incubation times and gradually level off after 20 min. In
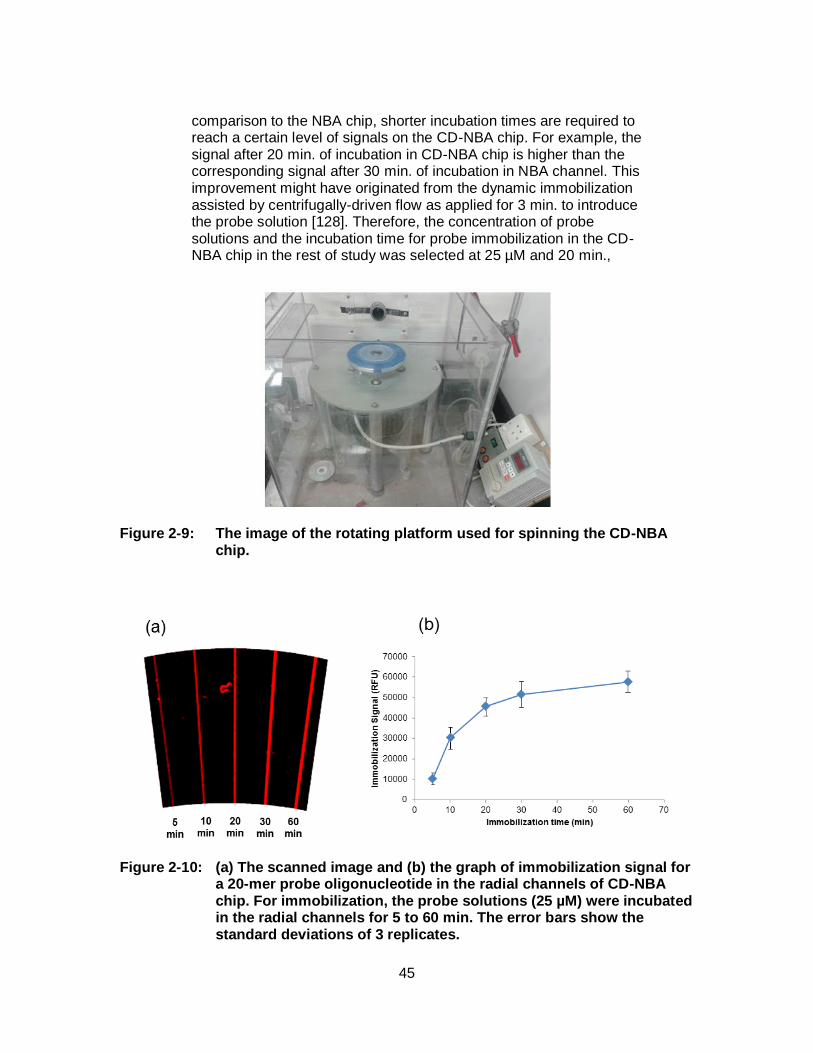
45
comparison to the NBA chip, shorter incubation times are required to reach a certain level of signals on the CD-NBA chip. For example, the signal after 20 min. of incubation in CD-NBA chip is higher than the corresponding signal after 30 min. of incubation in NBA channel. This improvement might have originated from the dynamic immobilization assisted by centrifugally-driven flow as applied for 3 min. to introduce the probe solution [128]. Therefore, the concentration of probe solutions and the incubation time for probe immobilization in the CD-NBA chip in the rest of study was selected at 25 µM and 20 min.,
Figure 2-9: The image of the rotating platform used for spinning the CD-NBA chip.
Figure 2-10: (a) The scanned image and (b) the graph of immobilization signal for a 20-mer probe oligonucleotide in the radial channels of CD-NBA chip. For immobilization, the probe solutions (25 µM) were incubated in the radial channels for 5 to 60 min. The error bars show the standard deviations of 3 replicates.
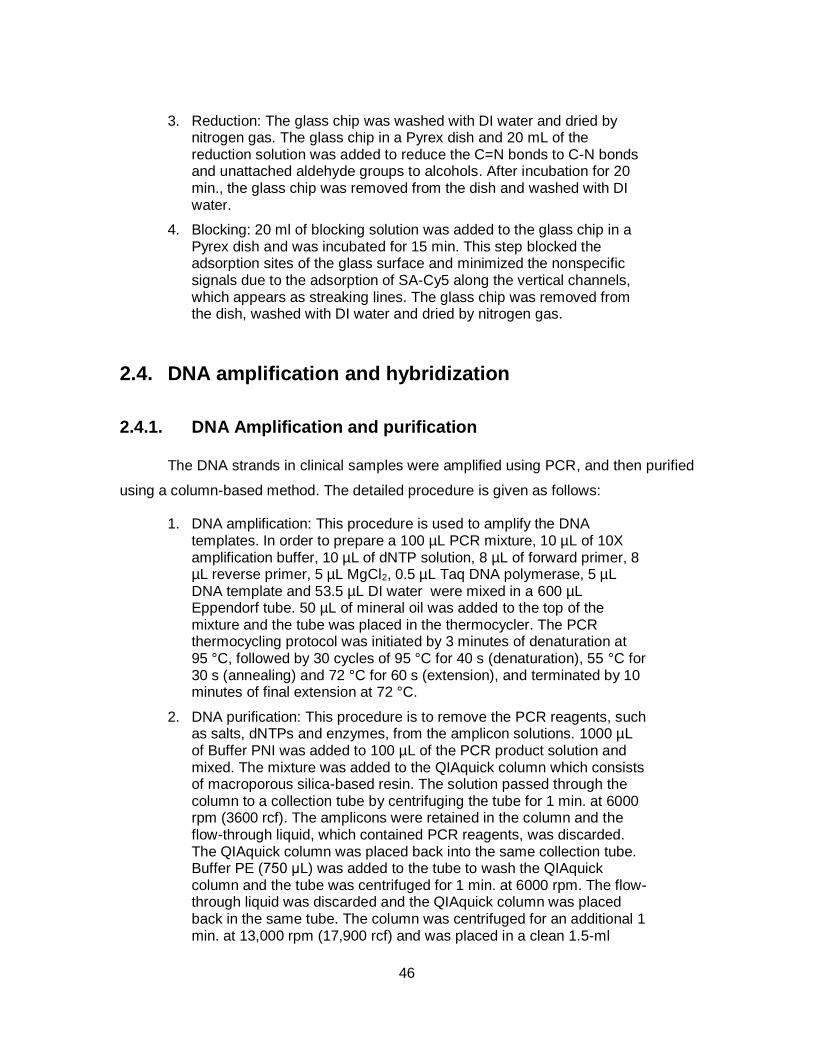
46
3. Reduction: The glass chip was washed with DI water and dried by nitrogen gas. The glass chip in a Pyrex dish and 20 mL of the reduction solution was added to reduce the C=N bonds to C-N bonds and unattached aldehyde groups to alcohols. After incubation for 20 min., the glass chip was removed from the dish and washed with DI water.
4. Blocking: 20 ml of blocking solution was added to the glass chip in a Pyrex dish and was incubated for 15 min. This step blocked the adsorption sites of the glass surface and minimized the nonspecific signals due to the adsorption of SA-Cy5 along the vertical channels, which appears as streaking lines. The glass chip was removed from the dish, washed with DI water and dried by nitrogen gas.
2.4. DNA amplification and hybridization
2.4.1. DNA Amplification and purification
The DNA strands in clinical samples were amplified using PCR, and then purified
using a column-based method. The detailed procedure is given as follows:
1. DNA amplification: This procedure is used to amplify the DNA templates. In order to prepare a 100 µL PCR mixture, 10 µL of 10X amplification buffer, 10 µL of dNTP solution, 8 µL of forward primer, 8 µL reverse primer, 5 µL MgCl2, 0.5 µL Taq DNA polymerase, 5 µL DNA template and 53.5 µL DI water were mixed in a 600 µL Eppendorf tube. 50 µL of mineral oil was added to the top of the mixture and the tube was placed in the thermocycler. The PCR thermocycling protocol was initiated by 3 minutes of denaturation at 95 °C, followed by 30 cycles of 95 °C for 40 s (denaturation), 55 °C for 30 s (annealing) and 72 °C for 60 s (extension), and terminated by 10 minutes of final extension at 72 °C.
2. DNA purification: This procedure is to remove the PCR reagents, such as salts, dNTPs and enzymes, from the amplicon solutions. 1000 µL of Buffer PNI was added to 100 µL of the PCR product solution and mixed. The mixture was added to the QIAquick column which consists of macroporous silica-based resin. The solution passed through the column to a collection tube by centrifuging the tube for 1 min. at 6000 rpm (3600 rcf). The amplicons were retained in the column and the flow-through liquid, which contained PCR reagents, was discarded. The QIAquick column was placed back into the same collection tube. Buffer PE (750 μL) was added to the tube to wash the QIAquick column and the tube was centrifuged for 1 min. at 6000 rpm. The flow-through liquid was discarded and the QIAquick column was placed back in the same tube. The column was centrifuged for an additional 1 min. at 13,000 rpm (17,900 rcf) and was placed in a clean 1.5-ml
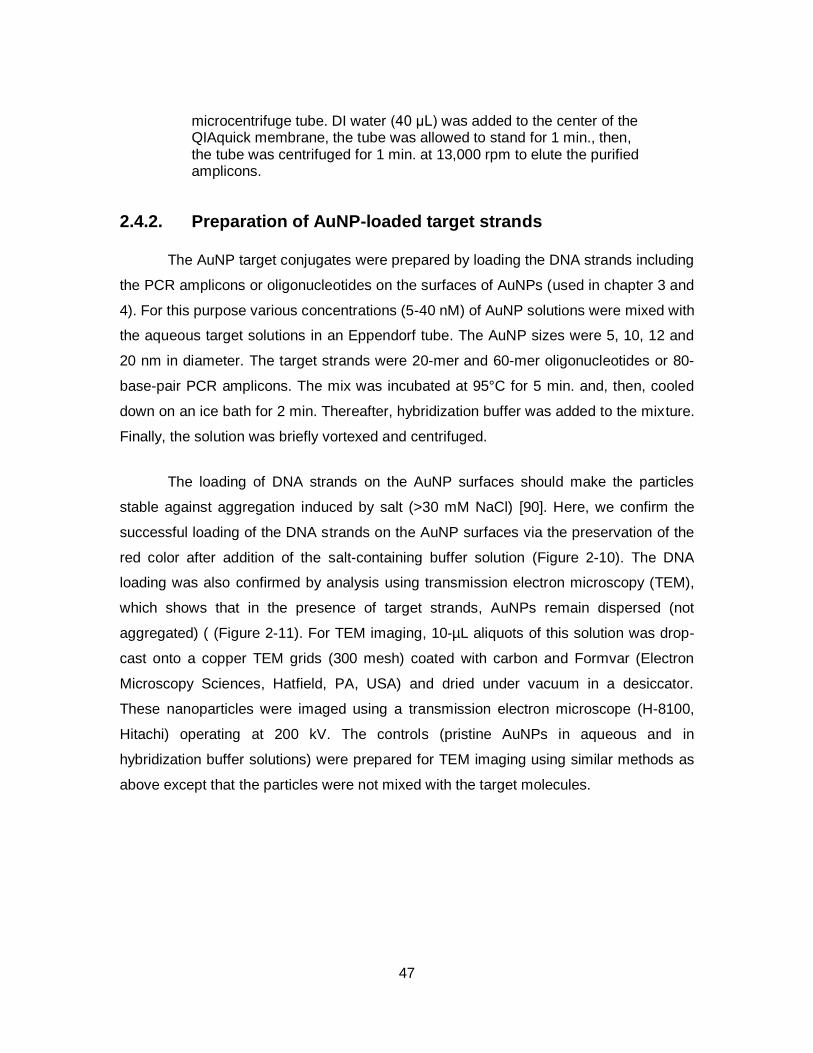
47
microcentrifuge tube. DI water (40 μL) was added to the center of the QIAquick membrane, the tube was allowed to stand for 1 min., then, the tube was centrifuged for 1 min. at 13,000 rpm to elute the purified amplicons.
2.4.2. Preparation of AuNP-loaded target strands
The AuNP target conjugates were prepared by loading the DNA strands including
the PCR amplicons or oligonucleotides on the surfaces of AuNPs (used in chapter 3 and
4). For this purpose various concentrations (5-40 nM) of AuNP solutions were mixed with
the aqueous target solutions in an Eppendorf tube. The AuNP sizes were 5, 10, 12 and
20 nm in diameter. The target strands were 20-mer and 60-mer oligonucleotides or 80-
base-pair PCR amplicons. The mix was incubated at 95°C for 5 min. and, then, cooled
down on an ice bath for 2 min. Thereafter, hybridization buffer was added to the mixture.
Finally, the solution was briefly vortexed and centrifuged.
The loading of DNA strands on the AuNP surfaces should make the particles
stable against aggregation induced by salt (>30 mM NaCl) [90]. Here, we confirm the
successful loading of the DNA strands on the AuNP surfaces via the preservation of the
red color after addition of the salt-containing buffer solution (Figure 2-10). The DNA
loading was also confirmed by analysis using transmission electron microscopy (TEM),
which shows that in the presence of target strands, AuNPs remain dispersed (not
aggregated) ( (Figure 2-11). For TEM imaging, 10-µL aliquots of this solution was drop-
cast onto a copper TEM grids (300 mesh) coated with carbon and Formvar (Electron
Microscopy Sciences, Hatfield, PA, USA) and dried under vacuum in a desiccator.
These nanoparticles were imaged using a transmission electron microscope (H-8100,
Hitachi) operating at 200 kV. The controls (pristine AuNPs in aqueous and in
hybridization buffer solutions) were prepared for TEM imaging using similar methods as
above except that the particles were not mixed with the target molecules.
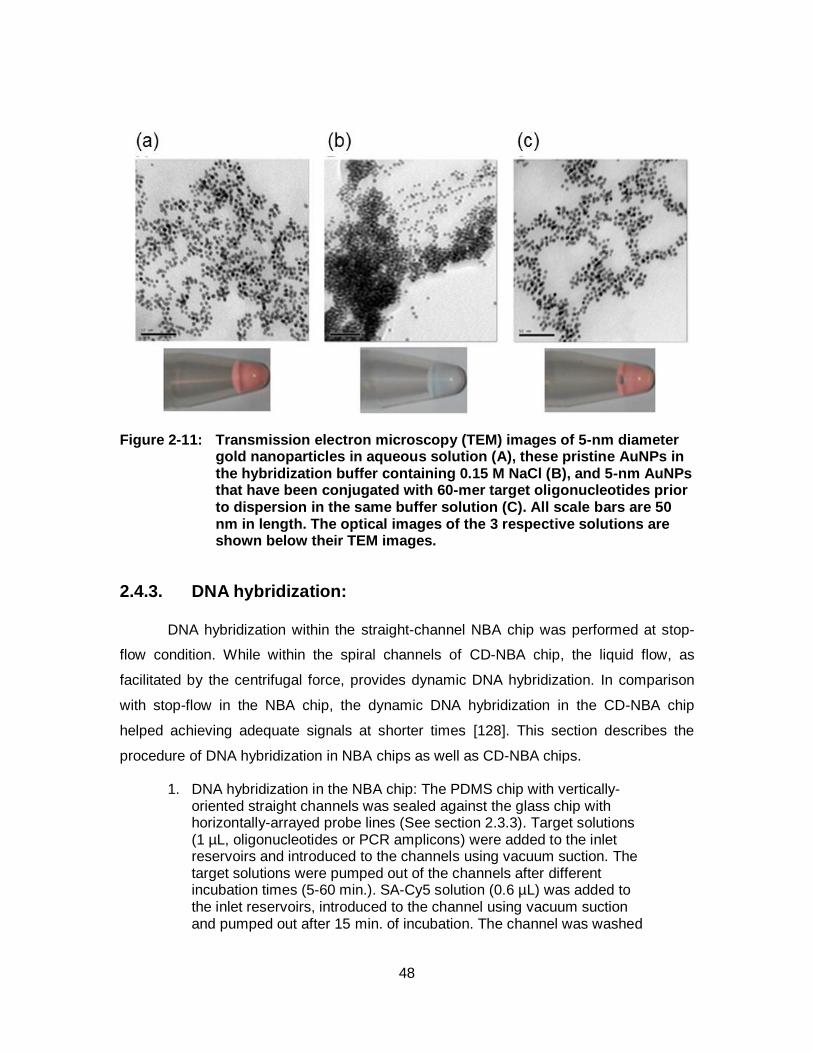
48
Figure 2-11: Transmission electron microscopy (TEM) images of 5-nm diameter gold nanoparticles in aqueous solution (A), these pristine AuNPs in the hybridization buffer containing 0.15 M NaCl (B), and 5-nm AuNPs that have been conjugated with 60-mer target oligonucleotides prior to dispersion in the same buffer solution (C). All scale bars are 50 nm in length. The optical images of the 3 respective solutions are shown below their TEM images.
2.4.3. DNA hybridization:
DNA hybridization within the straight-channel NBA chip was performed at stop-
flow condition. While within the spiral channels of CD-NBA chip, the liquid flow, as
facilitated by the centrifugal force, provides dynamic DNA hybridization. In comparison
with stop-flow in the NBA chip, the dynamic DNA hybridization in the CD-NBA chip
helped achieving adequate signals at shorter times [128]. This section describes the
procedure of DNA hybridization in NBA chips as well as CD-NBA chips.
1. DNA hybridization in the NBA chip: The PDMS chip with vertically-oriented straight channels was sealed against the glass chip with horizontally-arrayed probe lines (See section 2.3.3). Target solutions (1 µL, oligonucleotides or PCR amplicons) were added to the inlet reservoirs and introduced to the channels using vacuum suction. The target solutions were pumped out of the channels after different incubation times (5-60 min.). SA-Cy5 solution (0.6 µL) was added to the inlet reservoirs, introduced to the channel using vacuum suction and pumped out after 15 min. of incubation. The channel was washed
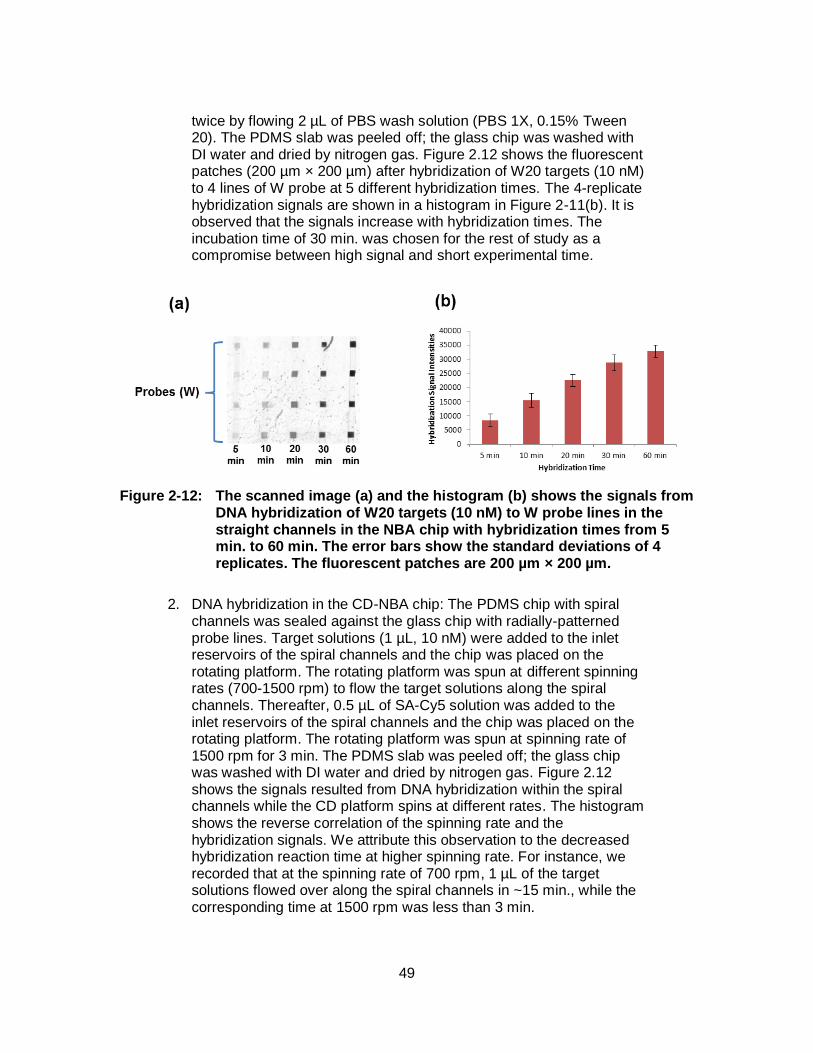
49
twice by flowing 2 µL of PBS wash solution (PBS 1X, 0.15% Tween 20). The PDMS slab was peeled off; the glass chip was washed with DI water and dried by nitrogen gas. Figure 2.12 shows the fluorescent patches (200 µm × 200 µm) after hybridization of W20 targets (10 nM) to 4 lines of W probe at 5 different hybridization times. The 4-replicate hybridization signals are shown in a histogram in Figure 2-11(b). It is observed that the signals increase with hybridization times. The incubation time of 30 min. was chosen for the rest of study as a compromise between high signal and short experimental time.
Figure 2-12: The scanned image (a) and the histogram (b) shows the signals from DNA hybridization of W20 targets (10 nM) to W probe lines in the straight channels in the NBA chip with hybridization times from 5 min. to 60 min. The error bars show the standard deviations of 4 replicates. The fluorescent patches are 200 µm × 200 µm.
2. DNA hybridization in the CD-NBA chip: The PDMS chip with spiral channels was sealed against the glass chip with radially-patterned probe lines. Target solutions (1 µL, 10 nM) were added to the inlet reservoirs of the spiral channels and the chip was placed on the rotating platform. The rotating platform was spun at different spinning rates (700-1500 rpm) to flow the target solutions along the spiral channels. Thereafter, 0.5 µL of SA-Cy5 solution was added to the inlet reservoirs of the spiral channels and the chip was placed on the rotating platform. The rotating platform was spun at spinning rate of 1500 rpm for 3 min. The PDMS slab was peeled off; the glass chip was washed with DI water and dried by nitrogen gas. Figure 2.12 shows the signals resulted from DNA hybridization within the spiral channels while the CD platform spins at different rates. The histogram shows the reverse correlation of the spinning rate and the hybridization signals. We attribute this observation to the decreased hybridization reaction time at higher spinning rate. For instance, we recorded that at the spinning rate of 700 rpm, 1 µL of the target solutions flowed over along the spiral channels in ~15 min., while the corresponding time at 1500 rpm was less than 3 min.
50
Figure 2-13: The scanned image (a) and the histogram (b) shows the signals from DNA hybridization of W20 targets in the spiral channels with 4 radially-oriented probe lines in the CD-NBA chip. The rate of CD platform spinning was ranging from 700 to 1500 rpm. The error bars show the standard deviations of 8 replicates. The fluorescent patches are 200 µm × 100 µm.
2.4.4. AuNP wash in CD-NBA chip.
In the AuNP wash technique, instead of using AuNPs in DNA hybridization,
AuNPs were used only in the wash step, which was performed subsequently after the
DNA hybridization, to enhance the specificity of hybridization signals (used in chapter 5).
The washing solution was SSC with NaCl concentrations that range from 10 to 300 mM.
The washing buffer contained either no AuNPs or AuNPs of various concentrations from
0.2 to 40 nM. In order to stabilize the AuNPs against salt aggregation, they were loaded
with DNA oligonucleotides, with sequences irrelevant to the target strands, prior to
addition to the washing buffer. This loading was performed in a way similar to the
preparation of AuNP targets, in which various concentrations of 12- or 20-mer
oligonucleotide were added to the aqueous suspension of AuNP colloids and the wash
buffer mix was incubated at 95°C for 5 min. Then, 2 µL of the washing buffer was added
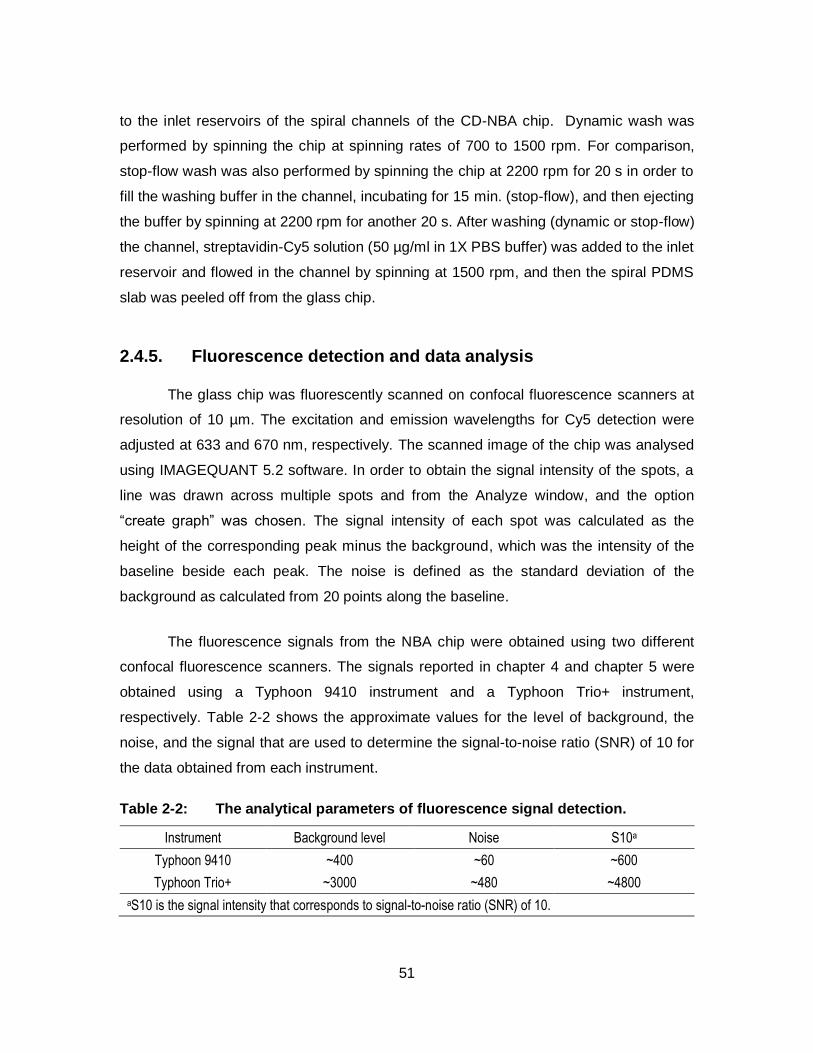
51
to the inlet reservoirs of the spiral channels of the CD-NBA chip. Dynamic wash was
performed by spinning the chip at spinning rates of 700 to 1500 rpm. For comparison,
stop-flow wash was also performed by spinning the chip at 2200 rpm for 20 s in order to
fill the washing buffer in the channel, incubating for 15 min. (stop-flow), and then ejecting
the buffer by spinning at 2200 rpm for another 20 s. After washing (dynamic or stop-flow)
the channel, streptavidin-Cy5 solution (50 µg/ml in 1X PBS buffer) was added to the inlet
reservoir and flowed in the channel by spinning at 1500 rpm, and then the spiral PDMS
slab was peeled off from the glass chip.
2.4.5. Fluorescence detection and data analysis
The glass chip was fluorescently scanned on confocal fluorescence scanners at
resolution of 10 µm. The excitation and emission wavelengths for Cy5 detection were
adjusted at 633 and 670 nm, respectively. The scanned image of the chip was analysed
using IMAGEQUANT 5.2 software. In order to obtain the signal intensity of the spots, a
line was drawn across multiple spots and from the Analyze window, and the option
“create graph” was chosen. The signal intensity of each spot was calculated as the
height of the corresponding peak minus the background, which was the intensity of the
baseline beside each peak. The noise is defined as the standard deviation of the
background as calculated from 20 points along the baseline.
The fluorescence signals from the NBA chip were obtained using two different
confocal fluorescence scanners. The signals reported in chapter 4 and chapter 5 were
obtained using a Typhoon 9410 instrument and a Typhoon Trio+ instrument,
respectively. Table 2-2 shows the approximate values for the level of background, the
noise, and the signal that are used to determine the signal-to-noise ratio (SNR) of 10 for
the data obtained from each instrument.
Table 2-2: The analytical parameters of fluorescence signal detection.
Instrument Background level Noise S10a
Typhoon 9410 ~400 ~60 ~600
Typhoon Trio+ ~3000 ~480 ~4800
aS10 is the signal intensity that corresponds to signal-to-noise ratio (SNR) of 10.
52
2.5. Surface plasmon resonance (SPR) spectroscopy
All the SPR measurements were performed on BIAcore X100 (GE Healthcare).
Immobilization of the amine-labeled DNA probes on the CM5 sensor chip was carried
out using a company-developed protocol [142]. Briefly, the sensor chip surface was
activated by an EDC/NHS mixture (1:1, v/v), which converted the surface carboxylic
groups to succinimide groups required to react with amine groups on the probe strands
to form amide bonds. The probe molecules were immobilized on the sensor surface by
running the immobilization solution containing the probe molecules (50 µM) and CTAB
(0.6 mM) over the sensor surfaces. Finally, unreacted succinimide groups were
deactivated using an ethanolamine hydrochloride solution (pH 8.5). In order to
investigate the influence of AuNPs on the rate constants of DNA hybridization and
dehybridization, the target solutions were prepared as free targets and AuNP targets.
Free target solutions were prepared with target concentrations of 10, 20, 40, 80 and 160
nM. The AuNP target solutions were prepared with identical concentrations of the target
DNA, but each contained an AuNP concentration of 20 nM. The mixed solutions were
incubated thereafter at 95°C for 5 min. in order for the target DNA to load on the
surfaces of AuNPs. Then, 7 µL of HBS-N 10X buffer was added to the mix to obtain a
final volume of 70 µL of AuNP target solution in HBS-N 1X (containing 150 mM of NaCl)
as the hybridization buffer.
Two different approaches, namely single-cycle (or kinetic titration) analysis and
multi-cycle analysis, were used to determine the kinetic rate constants. The multi-cycle
approach is the classical approach for kinetic analysis using SPR measurements, while
kinetic titration method is faster and requires less amount of reagents without
compromising accuracy of the results [143]. The rate constants provided in chapter 3
were obtained using the kinetic titration procedure. As a basis for confirmation of the rate
constants obtained from the kinetic titration method, the rate constants provided in
chapter 5 were determined using the multi-cycle approach.
In the kinetic titration method, the target solutions continuously flowed for 30 s
on the sensor chip surface (with immobilized probe), starting from the lowest
concentration to the highest. Following the hybridization of each target solution, the
53
dehybridization buffer was introduced by a continuous flow over the sensor surface for
60 s. The HBS-N buffer was used as the dehybridization buffer for the free target
solution, while the dehybridization buffer for the AuNP targets was HBS-N buffer
containing the AuNP loaded with other oligonucleotides, with the same target length but
with an unrelated sequence.
During the course of the experiment, the SPR instrument measures the changes
in the refractive index within a thin layer above the sensor chip and records changes in
resonance units (RU). The resulting SPR sensogram contains a double-phase cycle,
and each cycle (experiment run with each concentration) consists of a hybridization
phase and a dehybridization phase (Figure 2-14). During each cycle, the RU value
increases as a result of the hybridization to the immobilized probes by the target
molecules which were either free or loaded onto surfaces of the AuNPs. The
dehybridization phase of the sensogram was generated as the blank solution (vide infra)
flowed over the sensor surface following each hybridization phase. The hybridization
buffer (the buffer in which the target molecules were dissolved) was used as the blank
solution for the free targets. Aiming to investigate the dehybridization process in the
presence of AuNPs, the blank solution for the AuNP targets also contained AuNPs
loaded with oligonucleotides with unrelated sequences. At the end of the dehybridization
phase in the last cycle, the regeneration buffer (50 mM NaOH) was added to remove all
the hybridized targets and regenerate the sensor chip surface for subsequent
experiments. A full cycle of zero target concentrations (the blank), which contained
AuNPs but no target DNAs, were run prior to the sample run. The response at each time
of the blank sensogram was subtracted from the corresponding sample response to give
the subtracted value R. The R values were used to indicate the duplex concentration at
each time and the maximum response (Rmax) was taken to represent the probe
concentration in the Langmuir equation. The BIAevaluation software (GE Healthcare)
was used to analyze the sensogram to extract the hybridization and dehybridization rate
constants as given by the Langmuir Equations 2-1 and 2-2, respectively [143].
𝑑𝑅
𝑑𝑡= 𝑘ℎ𝐶 [𝑅𝑚𝑎𝑥 −𝑅] − 𝑘𝑑𝑅 ( 2 − 1)
54
dR
dt= −kdR (2 − 2)
Where t, kh, C and kd are time, the hybridization rate constant, target
concentration and the dehybridization rate constant, respectively. The rate of duplex
formation (dR/dt), acquired by nonlinear fitting of the sensogram, contains both the
hybridization and dehybridization terms of the Langmuir equation (Eq. 2-1) during the
hybridization phase. While in the dehybridization phase, dR/dt only contains the
dehybridization term (Eq. 2-2). Therefore, both kinetic rate constants kh and kd have
been calculated using the sensogram information.
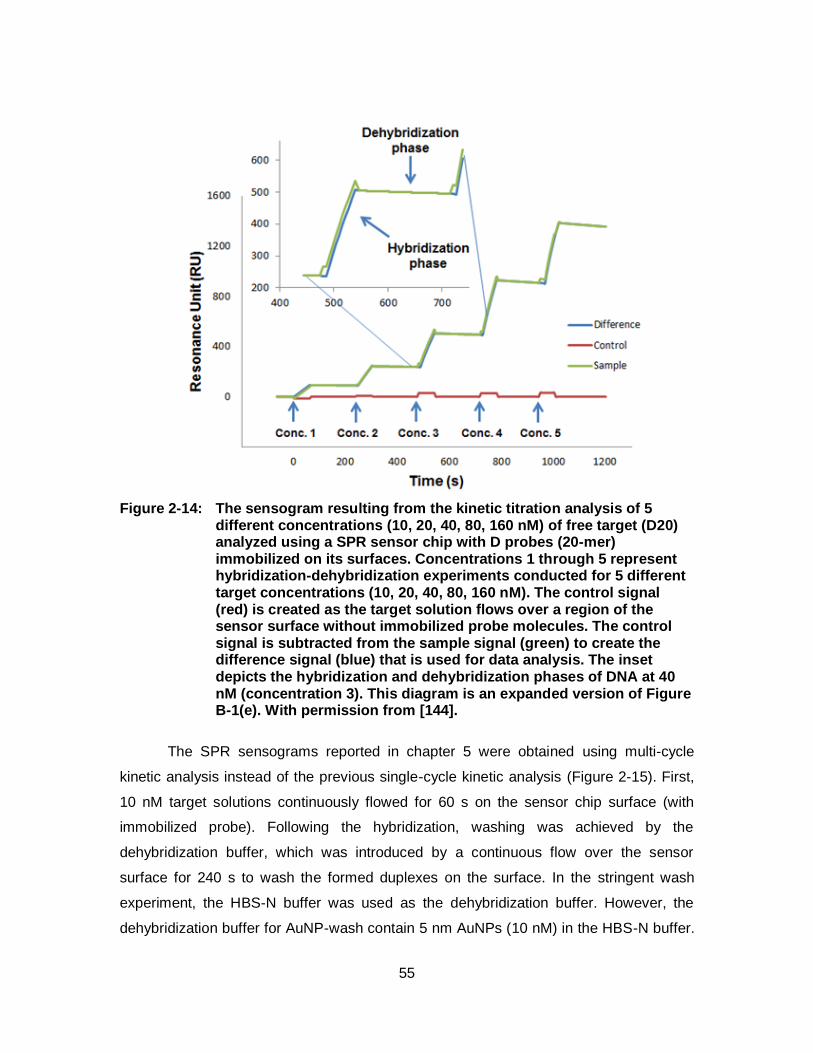
55
Figure 2-14: The sensogram resulting from the kinetic titration analysis of 5 different concentrations (10, 20, 40, 80, 160 nM) of free target (D20) analyzed using a SPR sensor chip with D probes (20-mer) immobilized on its surfaces. Concentrations 1 through 5 represent hybridization-dehybridization experiments conducted for 5 different target concentrations (10, 20, 40, 80, 160 nM). The control signal (red) is created as the target solution flows over a region of the sensor surface without immobilized probe molecules. The control signal is subtracted from the sample signal (green) to create the difference signal (blue) that is used for data analysis. The inset depicts the hybridization and dehybridization phases of DNA at 40 nM (concentration 3). This diagram is an expanded version of Figure B-1(e). With permission from [144].
The SPR sensograms reported in chapter 5 were obtained using multi-cycle
kinetic analysis instead of the previous single-cycle kinetic analysis (Figure 2-15). First,
10 nM target solutions continuously flowed for 60 s on the sensor chip surface (with
immobilized probe). Following the hybridization, washing was achieved by the
dehybridization buffer, which was introduced by a continuous flow over the sensor
surface for 240 s to wash the formed duplexes on the surface. In the stringent wash
experiment, the HBS-N buffer was used as the dehybridization buffer. However, the
dehybridization buffer for AuNP-wash contain 5 nm AuNPs (10 nM) in the HBS-N buffer.
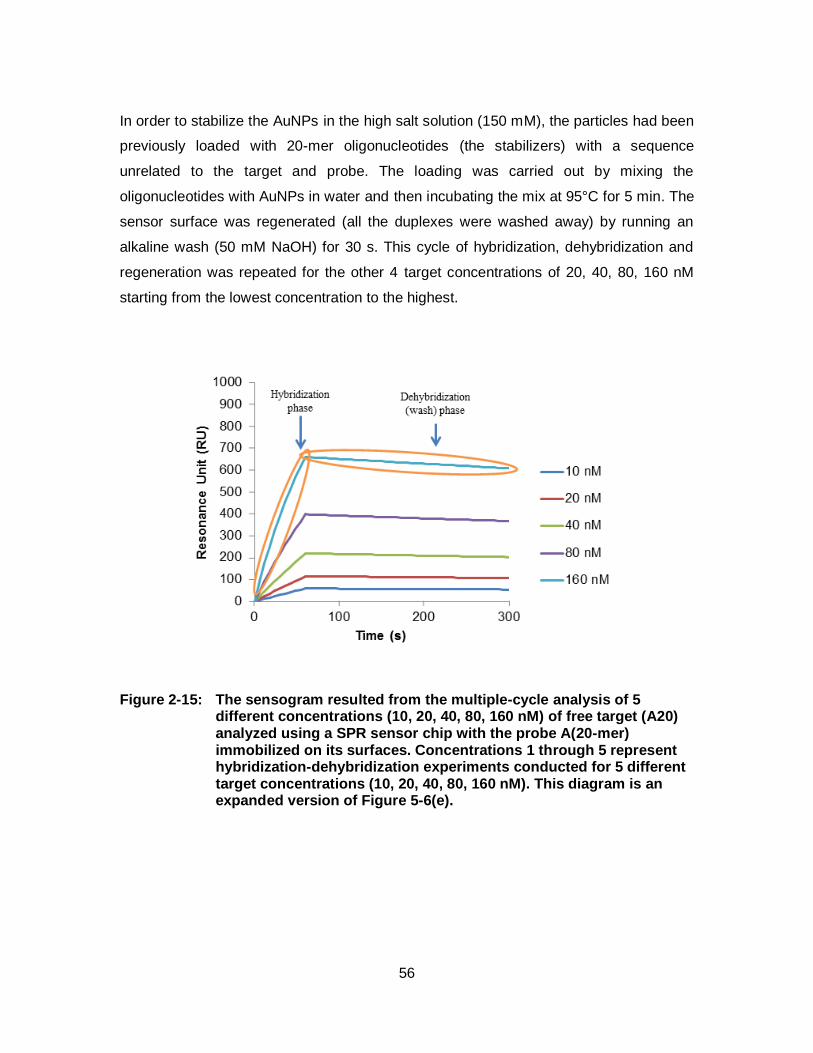
56
In order to stabilize the AuNPs in the high salt solution (150 mM), the particles had been
previously loaded with 20-mer oligonucleotides (the stabilizers) with a sequence
unrelated to the target and probe. The loading was carried out by mixing the
oligonucleotides with AuNPs in water and then incubating the mix at 95°C for 5 min. The
sensor surface was regenerated (all the duplexes were washed away) by running an
alkaline wash (50 mM NaOH) for 30 s. This cycle of hybridization, dehybridization and
regeneration was repeated for the other 4 target concentrations of 20, 40, 80, 160 nM
starting from the lowest concentration to the highest.
Figure 2-15: The sensogram resulted from the multiple-cycle analysis of 5 different concentrations (10, 20, 40, 80, 160 nM) of free target (A20) analyzed using a SPR sensor chip with the probe A(20-mer) immobilized on its surfaces. Concentrations 1 through 5 represent hybridization-dehybridization experiments conducted for 5 different target concentrations (10, 20, 40, 80, 160 nM). This diagram is an expanded version of Figure 5-6(e).
57
2.6. DNA melting temperature measurement using absorbance spectroscopy
The UV absorbance spectra of the DNA were recorded using a Cary 300 Bio UV-
Visible spectrophotometer (Varian). Equal molar concentrations of probes and targets
were dispersed in the hybridization buffer (HBS-N) and incubated overnight at room
temperature. The absorbance hyperchromicity was recorded by monitoring the
absorbance at 260 nm with a linear heating rate of 0.5 °C/min., starting from 25°C to
85°C.
2.7. Dynamic light scattering (DLS) measurements
The hydrodynamic diameters (dh) of the AuNP targets were measured by
dynamic light scattering (DLS) using a Zetasizer Nano instrument (Malvern Instruments,
UK). The AuNP solutions (5-nm diameter) were incubated with W20 targets
(concentration ratio of 1:1) at 95°C for 5 min, cooled down to room temperature, and
were directly measured by DLS. The same procedure without the addition of W20
targets was followed to measure the hydrodynamic diameter of pristine AuNPs (5 nm).
From the DLS measurements the hydrodynamic diameter (dh) of the nanoparticle was
measured and the diffusion coefficient D could be derived using the Einstein-Stokes
equation (Eq. 2-3) [145]:
𝑑ℎ =𝑘𝐵𝑇
3𝜋𝜂𝐷 (2 − 3)
Where kB is Boltzmann constant, η is dynamic viscosity of the solvent, and T is
the absolute temperature. For instance, for a dh value of 7.6 nm obtained for AuNPs (5
nm) loaded with 20-mer oligonucleotides, D value is determined to be 6.4×10⁻⁷ cm2/s.
58
2.8. Fluorescence quenching experiments to study the kinetics of DNA adsorption on AuNPs
In order to study the kinetics of adsorption of DNA oligonucleotides onto the
surface of AuNPs, the fluorescence quenching measurement was conducted. Cy5-
labeled W20 oligonucleotides (8 nM) were prepared in several sodium citrate buffer
solutions (15 mM, 1 mL) in a polystyrene cuvette. The buffers contained various NaCl
concentrations of 0, 10, 30, 50, 70, 90, 110, 130 and 150 mM. The cuvette was placed in
the holder of spectrophotometer. Thereafter, 1 ml of aqueous AuNP colloid (80 nM) was
added to the cuvette and the content was mixed. Immediately after, the fluorescence
intensity was monitored (excitation at 650 and emission at 670) for 7 min. using the time-
based mode. The experiment was repeated for other NaCl concentrations.
The adsorption of the single-stranded oligonucleotides (ssDNAs) onto the
surfaces of AuNPs in the absence of a complementary ssDNA strand is associated with
the irreversible reaction shown in Equation 2-4:
𝑠𝑠𝐷𝑁𝐴 + 𝐴𝑢𝑁𝑃𝑘𝑎→ 𝑠𝑠𝐷𝑁𝐴 − 𝐴𝑢𝑁𝑃 (2 − 4)
Where, ka is the rate constant of adsorption. The concentration of AuNPs was in
excess over the concentration of oligonucleotides (at least 10 times larger), so that the
adsorption could be regarded as a pseudo first-order reaction (Eq. 2-5).
−𝑑[𝑠𝑠𝐷𝑁𝐴]
𝑑𝑡= 𝑘𝑎[𝐴𝑢𝑁𝑃][𝑠𝑠𝐷𝑁𝐴] = 𝑘𝑎
′ [𝑠𝑠𝐷𝑁𝐴] (2 − 5)
We assume that the fluorescence intensity of the non-adsorbed sequences is
linear with respect to the fluorophore concentration. The time-based fluorescence data
were fit to an exponential decay function (Eq. 2-6).
𝐹
𝐹0= 𝑒−𝑘𝑎
′ 𝑡 (2 − 6)
where, F is the fluorescence intensity at time t; F0 is the initial fluorescence intensity.
59
Chapter 3. A Proposed Mechanism of the Influence of Gold Nanoparticles on DNA Hybridization
As discussed in section 1-4, a previous study in our group had reported that
AuNP-loaded DNA targets (AuNP targets), in contrast to the DNA targets freely
dissolved in the buffer solution (free targets), were able to discriminate between the
perfectly matched immobilized probe from the single base-pair mismatched probes when
unaided by thermal stringency at room temperature [73]. They hypothesized that AuNPs
compete with the immobilized probes to gain the target binding, which increases the
stringency of the hybridization process. During this competitive process, the formation of
mismatched duplexes with a lower hybridization affinity would be influenced more
strongly by the presence of AuNPs than the formation of perfectly matched duplex. The
different energy barrier for each of these two processes would enhance the
discrimination efficiency between the hybridization of mismatched and of perfectly
matched duplexes. The mechanism of the observed discrimination is, however, still
unknown.
To explore the mechanism, we aim to study the kinetics for DNA hybridization
and for dehybridization of AuNP targets and of surface-immobilized oligonucleotide
probes. These studies are performed using surface plasmon resonance (SPR)
spectroscopy, which has the advantage of not requiring target labeling, in order to
monitor the hybridization/dehybridization processes. The kinetic rate constants for
hybridization to surface bound DNA, determined using SPR, were used to calculate the
activation parameters in accordance with transition state theory (TST).
60
3.1. Rates of hybridization and dehybridization
The kinetic rate constants for the hybridization of target oligonucleotides to
surface-immobilized 20-mer probes were studies by SPR Spectroscopy (See section 2-
5). The hybridization rate constants kh and dehybridization rate constants kd values were
determined from SPR experiments using the BIAevaluation software, and the values are
tabulated in Table 3-1 and Table 3-2. These values were confirmed using a method
developed by Gotoh et al. (Appendix B) [146].
Transition state theory (TST) was used to extract mechanistic information from
the kinetic parameters (kh and kd). The Eyring-Polanyi equation (Eq. 1-4), derived from
TST, was used to determine the activation free energy changes, which are tabulated
along with the kh, and kd values in Table 3-1 and Table 3-2. The similar values of kh for
the free target hybridization resulted in the corresponding ΔGh≠ values to be
approximately the same, i.e. ~11 kcal/mol. Therefore, the ΔΔGh≠ values between the
perfectly matched duplexes and mismatched duplexes (with a mismatched base-pair at
the center of the sequence) of the free targets are very small, indicating an insensitivity
of ΔGh≠ to the presence of the mismatch site. This mismatch insensitivity of ΔGh
≠
suggests that the mismatched nucleotide does not significantly influence the transition
state. This observation agrees with previous reports that the rate-limiting step of free
target hybridization is the nucleation step (See section 1.2.1). Since the mismatch bases
are incorporated in the subsequent zipping step, the presence of the mismatch base has
little influence on the hybridization rate.
On the other hand, AuNP-loaded targets exhibit smaller kh values, leading to
higher ΔGh≠, in comparison to hybridization with free targets (see Table 3-1). More
noticeably, the kh values are even lower for the mismatched duplexes, which lead to
significantly higher ΔΔGh≠ values, in contrast to those for the free targets. In light of
these observations, we propose a model for the hybridization of AuNP targets (Figure 3-
1). We infer that significant differences in ΔGh≠ originate from a shift in the rate-limiting
step from a mismatch-insensitive nucleation step to a mismatch-sensitive zipping step.
This shift is, in turn, due to a difference in hybridization environment for AuNP-loaded
nucleotides during the zipping step in comparison to the free target nucleotides.
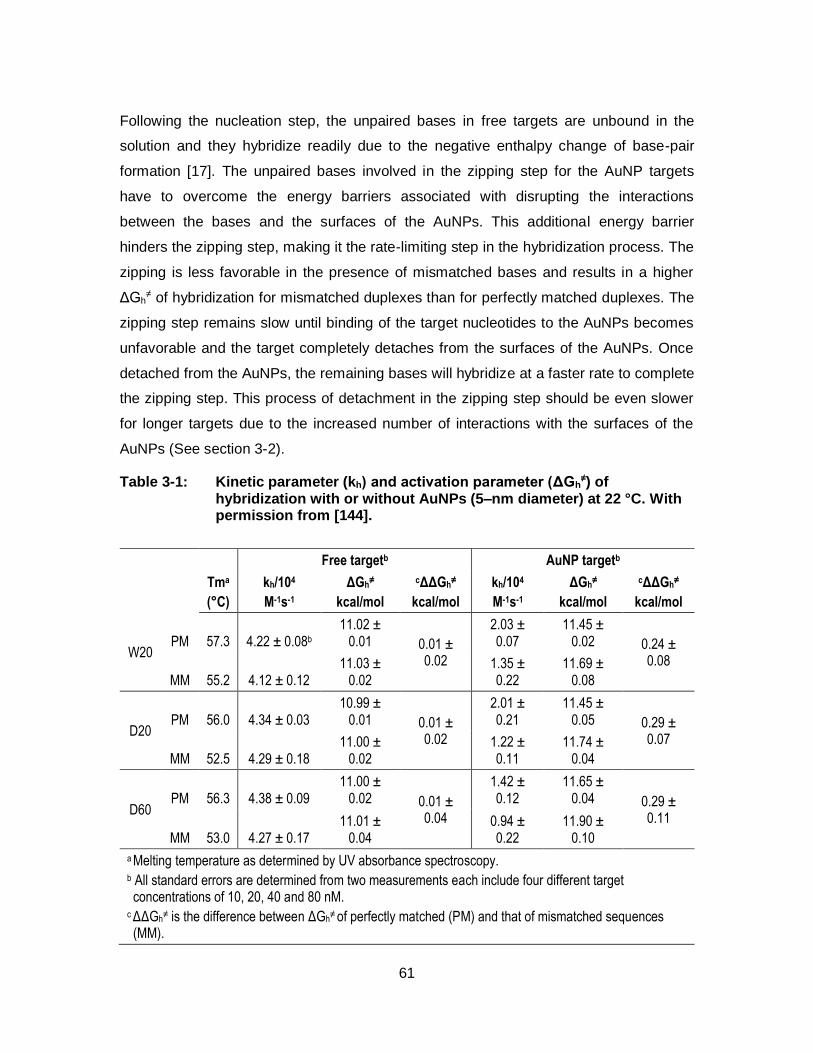
61
Following the nucleation step, the unpaired bases in free targets are unbound in the
solution and they hybridize readily due to the negative enthalpy change of base-pair
formation [17]. The unpaired bases involved in the zipping step for the AuNP targets
have to overcome the energy barriers associated with disrupting the interactions
between the bases and the surfaces of the AuNPs. This additional energy barrier
hinders the zipping step, making it the rate-limiting step in the hybridization process. The
zipping is less favorable in the presence of mismatched bases and results in a higher
ΔGh≠ of hybridization for mismatched duplexes than for perfectly matched duplexes. The
zipping step remains slow until binding of the target nucleotides to the AuNPs becomes
unfavorable and the target completely detaches from the surfaces of the AuNPs. Once
detached from the AuNPs, the remaining bases will hybridize at a faster rate to complete
the zipping step. This process of detachment in the zipping step should be even slower
for longer targets due to the increased number of interactions with the surfaces of the
AuNPs (See section 3-2).
Table 3-1: Kinetic parameter (kh) and activation parameter (ΔGh≠) of
hybridization with or without AuNPs (5–nm diameter) at 22 °C. With permission from [144].
Free targetb AuNP targetb
Tma
(°C)
kh/104
M-1s-1
ΔGh≠
kcal/mol
cΔΔGh≠
kcal/mol
kh/104
M-1s-1
ΔGh≠
kcal/mol
cΔΔGh≠
kcal/mol
W20 PM 57.3 4.22 ± 0.08b
11.02 ± 0.01 0.01 ±
0.02
2.03 ± 0.07
11.45 ± 0.02 0.24 ±
0.08
MM 55.2 4.12 ± 0.12 11.03 ±
0.02 1.35 ± 0.22
11.69 ± 0.08
D20 PM 56.0 4.34 ± 0.03
10.99 ± 0.01 0.01 ±
0.02
2.01 ± 0.21
11.45 ± 0.05 0.29 ±
0.07
MM 52.5 4.29 ± 0.18 11.00 ±
0.02 1.22 ± 0.11
11.74 ± 0.04
D60 PM 56.3 4.38 ± 0.09
11.00 ± 0.02 0.01 ±
0.04
1.42 ± 0.12
11.65 ± 0.04 0.29 ±
0.11
MM 53.0 4.27 ± 0.17 11.01 ±
0.04 0.94 ± 0.22
11.90 ± 0.10
a Melting temperature as determined by UV absorbance spectroscopy. b All standard errors are determined from two measurements each include four different target concentrations of 10, 20, 40 and 80 nM.
c ΔΔGh≠ is the difference between ΔGh
≠ of perfectly matched (PM) and that of mismatched sequences (MM).
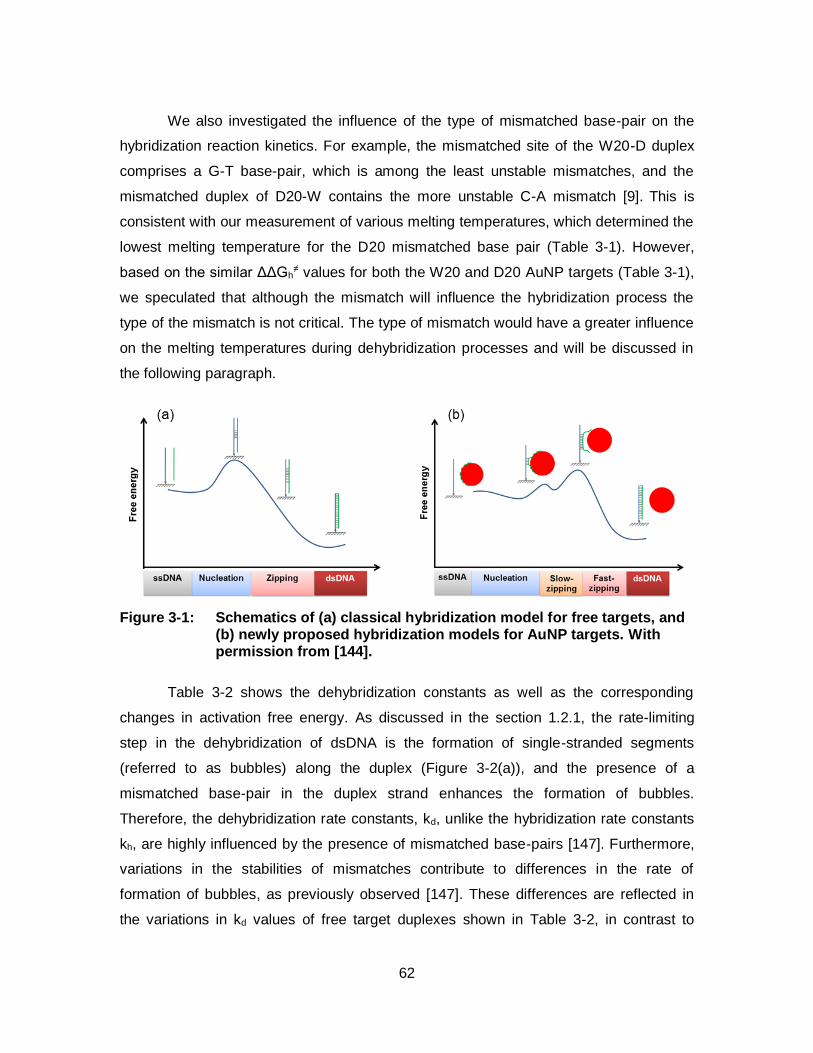
62
We also investigated the influence of the type of mismatched base-pair on the
hybridization reaction kinetics. For example, the mismatched site of the W20-D duplex
comprises a G-T base-pair, which is among the least unstable mismatches, and the
mismatched duplex of D20-W contains the more unstable C-A mismatch [9]. This is
consistent with our measurement of various melting temperatures, which determined the
lowest melting temperature for the D20 mismatched base pair (Table 3-1). However,
based on the similar ΔΔGh≠ values for both the W20 and D20 AuNP targets (Table 3-1),
we speculated that although the mismatch will influence the hybridization process the
type of the mismatch is not critical. The type of mismatch would have a greater influence
on the melting temperatures during dehybridization processes and will be discussed in
the following paragraph.
Figure 3-1: Schematics of (a) classical hybridization model for free targets, and (b) newly proposed hybridization models for AuNP targets. With permission from [144].
Table 3-2 shows the dehybridization constants as well as the corresponding
changes in activation free energy. As discussed in the section 1.2.1, the rate-limiting
step in the dehybridization of dsDNA is the formation of single-stranded segments
(referred to as bubbles) along the duplex (Figure 3-2(a)), and the presence of a
mismatched base-pair in the duplex strand enhances the formation of bubbles.
Therefore, the dehybridization rate constants, kd, unlike the hybridization rate constants
kh, are highly influenced by the presence of mismatched base-pairs [147]. Furthermore,
variations in the stabilities of mismatches contribute to differences in the rate of
formation of bubbles, as previously observed [147]. These differences are reflected in
the variations in kd values of free target duplexes shown in Table 3-2, in contrast to
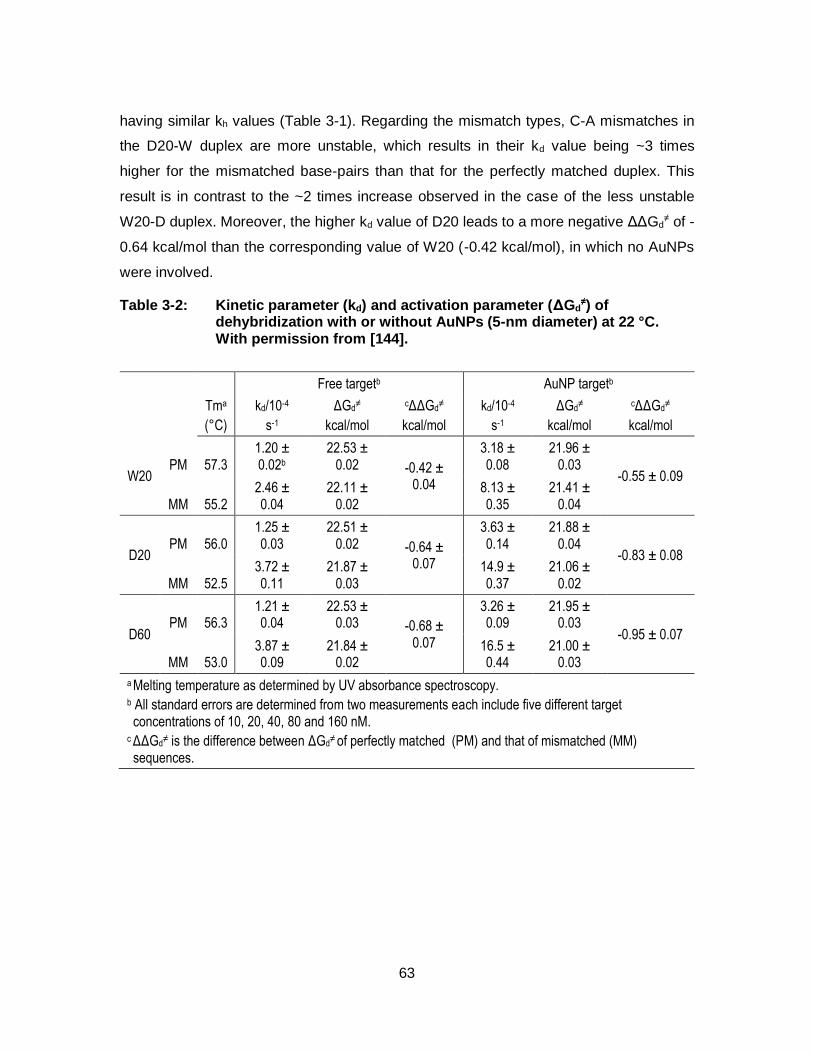
63
having similar kh values (Table 3-1). Regarding the mismatch types, C-A mismatches in
the D20-W duplex are more unstable, which results in their kd value being ~3 times
higher for the mismatched base-pairs than that for the perfectly matched duplex. This
result is in contrast to the ~2 times increase observed in the case of the less unstable
W20-D duplex. Moreover, the higher kd value of D20 leads to a more negative ΔΔGd≠ of -
0.64 kcal/mol than the corresponding value of W20 (-0.42 kcal/mol), in which no AuNPs
were involved.
Table 3-2: Kinetic parameter (kd) and activation parameter (ΔGd≠) of
dehybridization with or without AuNPs (5-nm diameter) at 22 °C. With permission from [144].
Free targetb AuNP targetb
Tma
(°C)
kd/10-4
s-1
ΔGd≠
kcal/mol
cΔΔGd≠
kcal/mol
kd/10-4
s-1
ΔGd≠
kcal/mol
cΔΔGd≠
kcal/mol
W20 PM 57.3
1.20 ± 0.02b
22.53 ± 0.02 -0.42 ±
0.04
3.18 ± 0.08
21.96 ± 0.03
-0.55 ± 0.09
MM 55.2 2.46 ± 0.04
22.11 ± 0.02
8.13 ± 0.35
21.41 ± 0.04
D20 PM 56.0
1.25 ± 0.03
22.51 ± 0.02 -0.64 ±
0.07
3.63 ± 0.14
21.88 ± 0.04
-0.83 ± 0.08
MM 52.5 3.72 ± 0.11
21.87 ± 0.03
14.9 ± 0.37
21.06 ± 0.02
D60 PM 56.3
1.21 ± 0.04
22.53 ± 0.03 -0.68 ±
0.07
3.26 ± 0.09
21.95 ± 0.03
-0.95 ± 0.07
MM 53.0 3.87 ± 0.09
21.84 ± 0.02
16.5 ± 0.44
21.00 ± 0.03
a Melting temperature as determined by UV absorbance spectroscopy. b All standard errors are determined from two measurements each include five different target concentrations of 10, 20, 40, 80 and 160 nM.
c ΔΔGd≠ is the difference between ΔGd
≠ of perfectly matched (PM) and that of mismatched (MM) sequences.
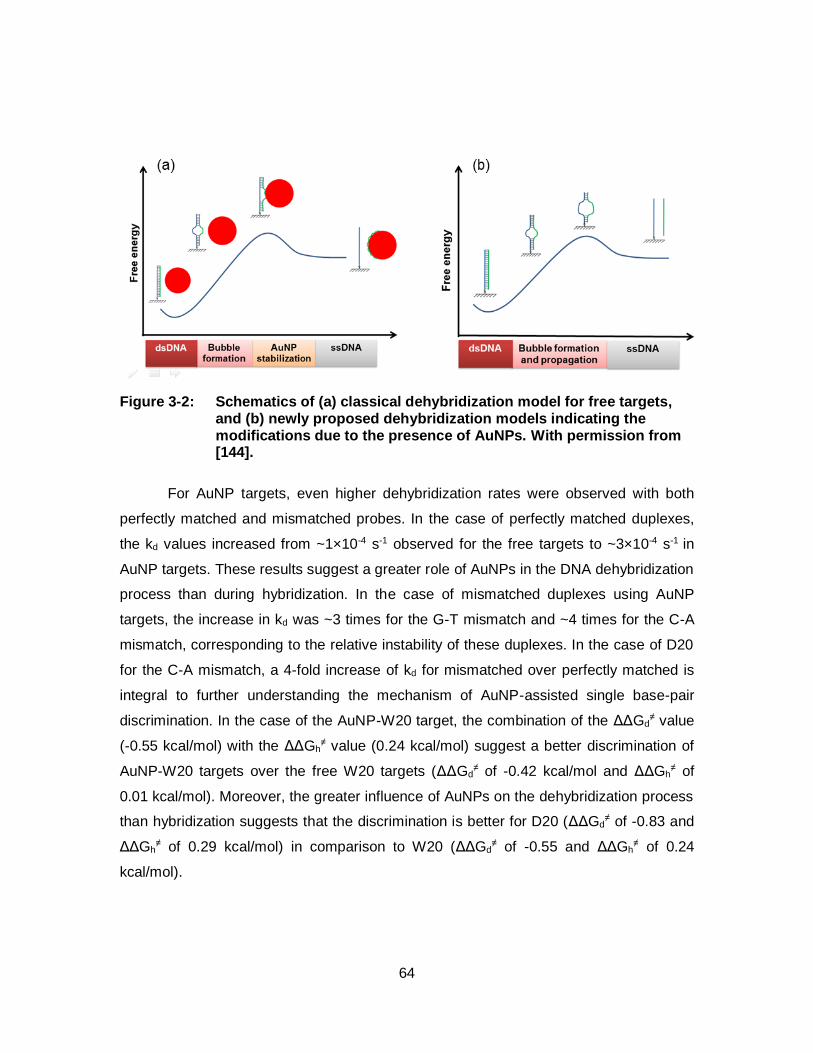
64
Figure 3-2: Schematics of (a) classical dehybridization model for free targets, and (b) newly proposed dehybridization models indicating the modifications due to the presence of AuNPs. With permission from [144].
For AuNP targets, even higher dehybridization rates were observed with both
perfectly matched and mismatched probes. In the case of perfectly matched duplexes,
the kd values increased from ~1×10⁻⁴ s-1 observed for the free targets to ~3×10⁻⁴ s-1 in
AuNP targets. These results suggest a greater role of AuNPs in the DNA dehybridization
process than during hybridization. In the case of mismatched duplexes using AuNP
targets, the increase in kd was ~3 times for the G-T mismatch and ~4 times for the C-A
mismatch, corresponding to the relative instability of these duplexes. In the case of D20
for the C-A mismatch, a 4-fold increase of kd for mismatched over perfectly matched is
integral to further understanding the mechanism of AuNP-assisted single base-pair
discrimination. In the case of the AuNP-W20 target, the combination of the ΔΔGd≠ value
(-0.55 kcal/mol) with the ΔΔGh≠ value (0.24 kcal/mol) suggest a better discrimination of
AuNP-W20 targets over the free W20 targets (ΔΔGd≠ of -0.42 kcal/mol and ΔΔGh
≠ of
0.01 kcal/mol). Moreover, the greater influence of AuNPs on the dehybridization process
than hybridization suggests that the discrimination is better for D20 (ΔΔGd≠ of -0.83 and
ΔΔGh≠ of 0.29 kcal/mol) in comparison to W20 (ΔΔGd
≠ of -0.55 and ΔΔGh≠ of 0.24
kcal/mol).
65
Since the binding of AuNPs to the bases is rather non-specific, acceleration of
the dehybridization process by AuNP binding is expected to be independent of the
mismatch base-pair stability. Furthermore, AuNPs have been frequently reported not to
bind with dsDNA [83, 86-90, 97, 98]. We can explain the correlation between our results
and these previous reports by revisiting the rate-limiting step of the dehybridization
process for AuNP targets. Figure 3-2(b) shows a potential AuNP-mediated
dehybridization process (in AuNP targets), in which ssDNA bubbles are formed, in a
manner similar to natural dehybridization (in free targets). Although fully-coiled duplex
DNAs do not bind to AuNPs, once the ssDNA bubbles form, they are able to bind to the
AuNPs at the bubbles. Therefore, the energy released from the interactions between the
dehybridized bases and surfaces of the AuNPs may compensate for the energy required
for the remaining bases to undergo dehybridization from the probe molecules, thus
accelerating the process of duplex dehybridization. Our model suggests that
dehybridization in the experiment by Yang et al. was actually initiated by binding of the
AuNPs with the thermal bubbles (or ssDNA segments in the duplex), but not to the fully-
coiled dsDNA [105]. Other biological events have also been reported to involve binding
with thermally-formed bubbles. For example, TATA binding protein (TBP), a transcription
promoter, binds to bubbles of DNA that form by thermal breathing to initiate the
transcription process [26].
3.2. Effect of target length
Longer oligonucleotides are known to bind more tightly to the AuNP surfaces
[83], most likely due to the potentially higher number of contact points between the
oligonucleotides and the surfaces of the AuNPs. In order to investigate the influence of
target length, and thus AuNP-binding strength, on the hybridization and dehybridization
processes, we performed SPR studies using targets of two different lengths. These
targets were D60 (60-mer) and D20 (20-mer) (see Table 2-1). The measured
hybridization rate constants and the corresponding activation parameters of D60 are
shown in Table 3-1. In comparison to the D20 targets conjugated to 5-nm diameter
AuNPs, D60 shows slower reaction rates (i.e. 1.42 vs 2.01 ×10⁴ M-1s-1) indicating a
higher energy barrier for hybridization. In accordance with our proposed model of
66
hybridization of AuNP targets, we believe that for longer target molecules, due to the
greater number of contact points with the AuNP surfaces, the slow-zipping step (the
rate-limiting step) lasts longer and consequently the hybridization rate is reduced. Unlike
the differences observed in the hybridization rates, the D60 target had similar
dehybridization rates in comparison to the D20 targets (3.26 vs 3.63 ×10⁻⁴ s-1,
respectively), which suggests binding between the AuNPs and the dangling region of the
D60 target does not enhance its dehybridization.
3.3. Effect of AuNP size
The ssDNAs have been observed to bind less tightly to small AuNPs in
comparison to larger AuNPs [148]. A higher degree of curvature in the smaller AuNPs
appears to have an adverse effect on binding strength. In order to investigate the
influence of AuNP size on interaction with the oligonucleotides, we measured the kinetic
rate constants of D20 targets loaded onto 12-nm diameter AuNPs and compared their
hybridization and dehybridization parameters with the corresponding values for D20
loaded onto 5-nm diameter AuNPs. Both values were also compared with those
obtained for free targets. From the derived kh values (Table 3-3) it can be observed that
the 12 nm AuNP targets had a similar hybridization rate to that of the 5 nm AuNP targets
(i.e. 2.08 vs 2.01 ×10⁴ M-1s-1, respectively). The values of ΔΔGh≠ for the perfectly
matched and mismatched probes remain similar between the 5 nm AuNP (0.29 kcal/mol)
and 12 nm AuNP (0.27 kcal/mol).
On the other hand, the rates of dehybridization for the duplexes were not
increased in the presence of 12 nm AuNP and the kd values were similar to those for the
free targets (1.17 vs 1.25 ×10⁻⁴ s-1, respectively). This result is in contrast to the values
observed for 5 nm AuNP and for free targets (3.63 ×10⁻⁴ s-1 vs 1.25 ×10⁻⁴ s-1), as shown
in Table 3-3. These observations suggest that the 12 nm AuNP is not significantly
involved in the dehybridization process in contrast to 5 nm AuNP. While the kh values
indicate similar binding strength between the DNA bases and surfaces of AuNPs with
different sizes, one may anticipate a similar dehybridization rate for the 12 nm AuNPs.
The apparent decreased involvement in the dehybridization process by the larger AuNPs
might be due to their relatively smaller degree of curvature. The surfaces of the citrate-
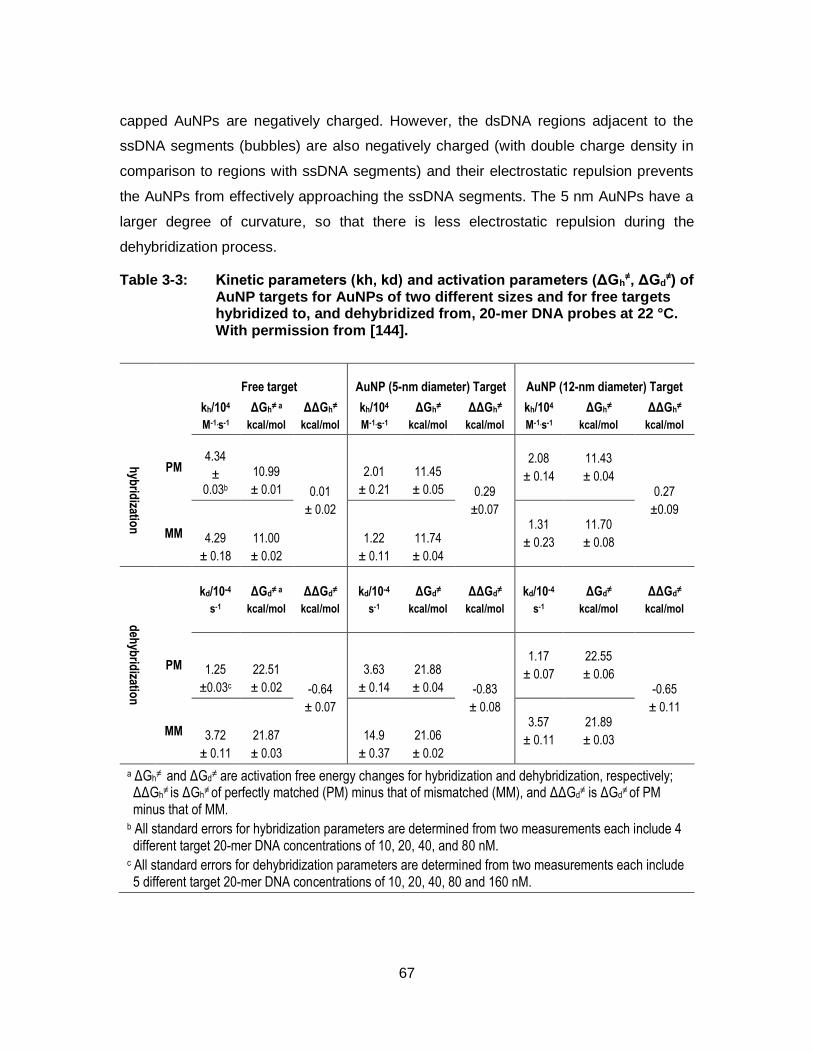
67
capped AuNPs are negatively charged. However, the dsDNA regions adjacent to the
ssDNA segments (bubbles) are also negatively charged (with double charge density in
comparison to regions with ssDNA segments) and their electrostatic repulsion prevents
the AuNPs from effectively approaching the ssDNA segments. The 5 nm AuNPs have a
larger degree of curvature, so that there is less electrostatic repulsion during the
dehybridization process.
Table 3-3: Kinetic parameters (kh, kd) and activation parameters (ΔGh≠, ΔGd
≠) of AuNP targets for AuNPs of two different sizes and for free targets hybridized to, and dehybridized from, 20-mer DNA probes at 22 °C. With permission from [144].
Free target AuNP (5-nm diameter) Target AuNP (12-nm diameter) Target
kh/104
M-1.s-1
ΔGh≠ a
kcal/mol
ΔΔGh≠
kcal/mol
kh/104
M-1.s-1
ΔGh≠
kcal/mol
ΔΔGh≠
kcal/mol
kh/104
M-1.s-1
ΔGh≠
kcal/mol
ΔΔGh≠
kcal/mol
hyb
ridizatio
n
PM 4.34
± 0.03b
10.99
± 0.01 0.01
± 0.02
2.01
± 0.21
11.45
± 0.05 0.29
±0.07
2.08
± 0.14
11.43
± 0.04 0.27
±0.09
MM 4.29
± 0.18
11.00
± 0.02
1.22
± 0.11
11.74
± 0.04
1.31
± 0.23
11.70
± 0.08
deh
ybrid
ization
kd/10-4
s-1
ΔGd≠ a
kcal/mol
ΔΔGd≠
kcal/mol
kd/10-4
s-1
ΔGd≠
kcal/mol
ΔΔGd≠
kcal/mol
kd/10-4
s-1
ΔGd≠
kcal/mol
ΔΔGd≠
kcal/mol
PM 1.25
±0.03c
22.51
± 0.02 -0.64
± 0.07
3.63
± 0.14
21.88
± 0.04 -0.83
± 0.08
1.17
± 0.07
22.55
± 0.06 -0.65
± 0.11
MM 3.72
± 0.11
21.87
± 0.03
14.9
± 0.37
21.06
± 0.02
3.57
± 0.11
21.89
± 0.03
a ΔGh≠ and ΔGd
≠ are activation free energy changes for hybridization and dehybridization, respectively; ΔΔGh
≠ is ΔGh≠ of perfectly matched (PM) minus that of mismatched (MM), and ΔΔGd
≠ is ΔGd≠ of PM
minus that of MM. b All standard errors for hybridization parameters are determined from two measurements each include 4 different target 20-mer DNA concentrations of 10, 20, 40, and 80 nM.
c All standard errors for dehybridization parameters are determined from two measurements each include 5 different target 20-mer DNA concentrations of 10, 20, 40, 80 and 160 nM.
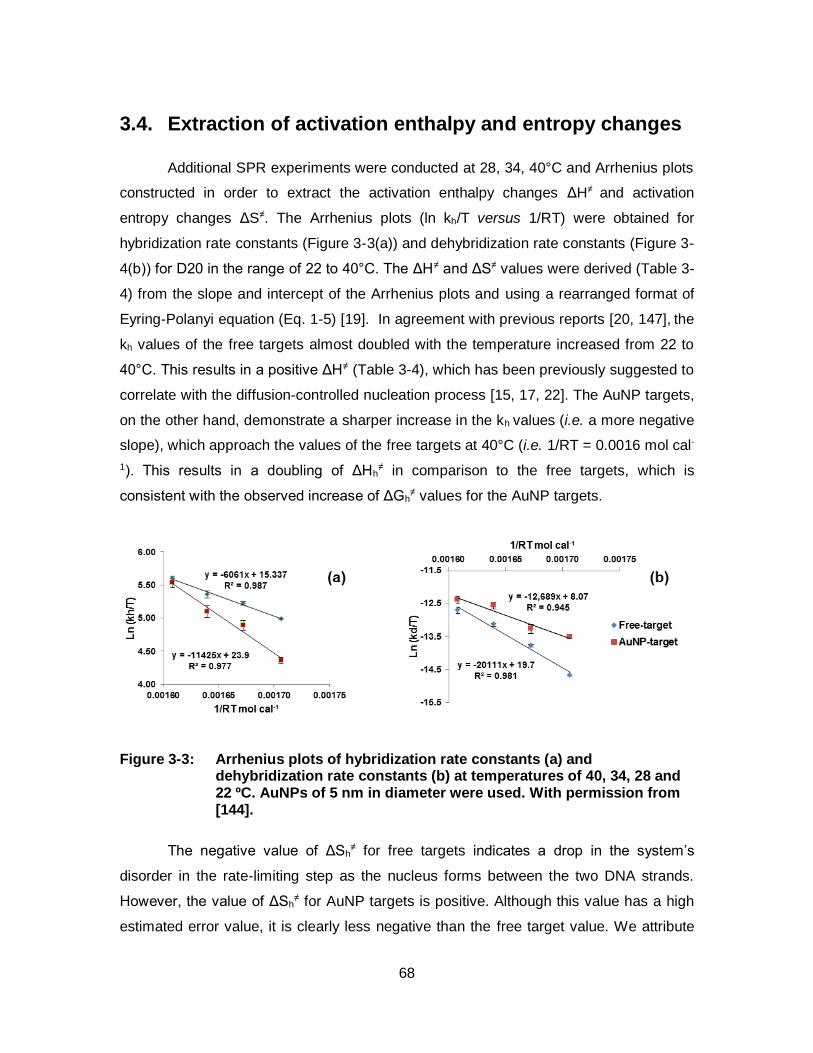
68
3.4. Extraction of activation enthalpy and entropy changes
Additional SPR experiments were conducted at 28, 34, 40°C and Arrhenius plots
constructed in order to extract the activation enthalpy changes ΔH≠ and activation
entropy changes ΔS≠. The Arrhenius plots (ln kh/T versus 1/RT) were obtained for
hybridization rate constants (Figure 3-3(a)) and dehybridization rate constants (Figure 3-
4(b)) for D20 in the range of 22 to 40°C. The ΔH≠ and ΔS≠ values were derived (Table 3-
4) from the slope and intercept of the Arrhenius plots and using a rearranged format of
Eyring-Polanyi equation (Eq. 1-5) [19]. In agreement with previous reports [20, 147], the
kh values of the free targets almost doubled with the temperature increased from 22 to
40°C. This results in a positive ΔH≠ (Table 3-4), which has been previously suggested to
correlate with the diffusion-controlled nucleation process [15, 17, 22]. The AuNP targets,
on the other hand, demonstrate a sharper increase in the kh values (i.e. a more negative
slope), which approach the values of the free targets at 40°C (i.e. 1/RT = 0.0016 mol cal-
1). This results in a doubling of ΔHh≠ in comparison to the free targets, which is
consistent with the observed increase of ΔGh≠ values for the AuNP targets.
Figure 3-3: Arrhenius plots of hybridization rate constants (a) and dehybridization rate constants (b) at temperatures of 40, 34, 28 and 22 ºC. AuNPs of 5 nm in diameter were used. With permission from [144].
The negative value of ΔSh≠ for free targets indicates a drop in the system’s
disorder in the rate-limiting step as the nucleus forms between the two DNA strands.
However, the value of ΔSh≠ for AuNP targets is positive. Although this value has a high
estimated error value, it is clearly less negative than the free target value. We attribute
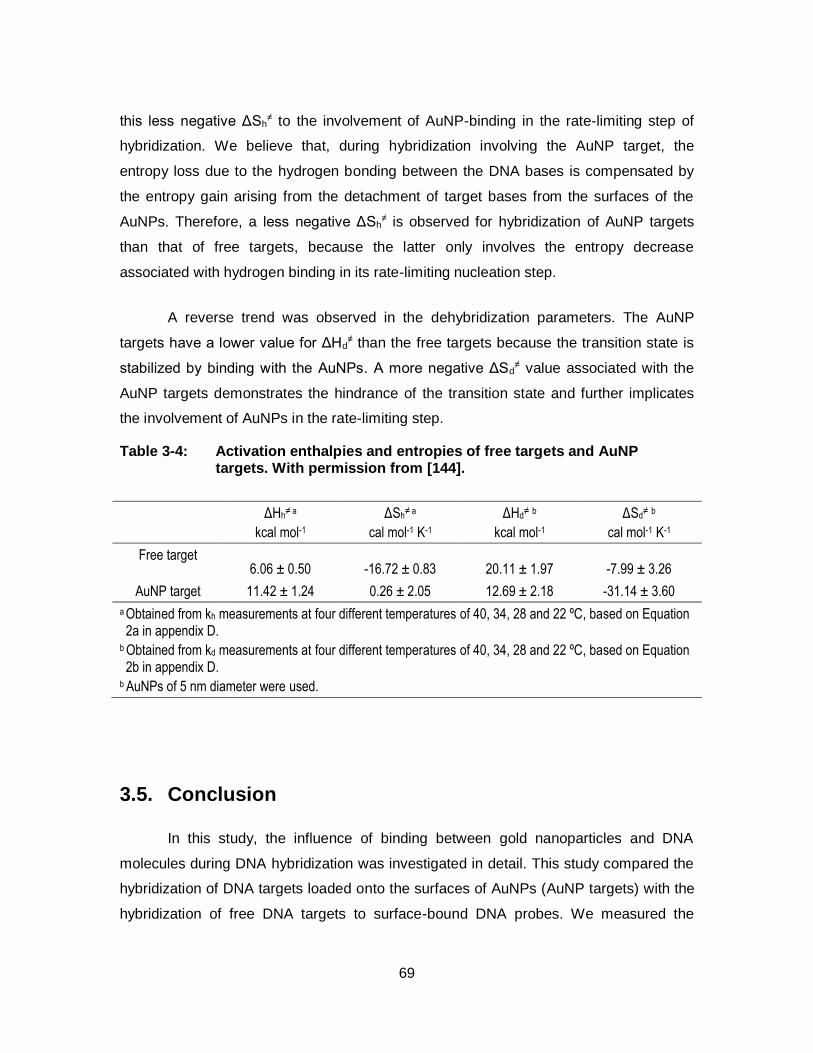
69
this less negative ΔSh≠ to the involvement of AuNP-binding in the rate-limiting step of
hybridization. We believe that, during hybridization involving the AuNP target, the
entropy loss due to the hydrogen bonding between the DNA bases is compensated by
the entropy gain arising from the detachment of target bases from the surfaces of the
AuNPs. Therefore, a less negative ΔSh≠ is observed for hybridization of AuNP targets
than that of free targets, because the latter only involves the entropy decrease
associated with hydrogen binding in its rate-limiting nucleation step.
A reverse trend was observed in the dehybridization parameters. The AuNP
targets have a lower value for ΔHd≠ than the free targets because the transition state is
stabilized by binding with the AuNPs. A more negative ΔSd≠ value associated with the
AuNP targets demonstrates the hindrance of the transition state and further implicates
the involvement of AuNPs in the rate-limiting step.
Table 3-4: Activation enthalpies and entropies of free targets and AuNP targets. With permission from [144].
ΔHh≠ a
kcal mol-1
ΔSh≠ a
cal mol-1 K-1
ΔHd≠ b
kcal mol-1
ΔSd≠ b
cal mol-1 K-1
Free target 6.06 ± 0.50 -16.72 ± 0.83 20.11 ± 1.97 -7.99 ± 3.26
AuNP target 11.42 ± 1.24 0.26 ± 2.05 12.69 ± 2.18 -31.14 ± 3.60
a Obtained from kh measurements at four different temperatures of 40, 34, 28 and 22 ºC, based on Equation 2a in appendix D.
b Obtained from kd measurements at four different temperatures of 40, 34, 28 and 22 ºC, based on Equation 2b in appendix D.
b AuNPs of 5 nm diameter were used.
3.5. Conclusion
In this study, the influence of binding between gold nanoparticles and DNA
molecules during DNA hybridization was investigated in detail. This study compared the
hybridization of DNA targets loaded onto the surfaces of AuNPs (AuNP targets) with the
hybridization of free DNA targets to surface-bound DNA probes. We measured the
70
kinetic rate constants for the hybridization and dehybridization processes and
determined the activation parameters of AuNP-loaded targets in comparison to their
equivalent free targets. Our studies suggest a mechanism that the rate-limiting step in
the hybridization process is the DNA zipping step in the AuNP targets and that AuNPs
enhance the dehybridization of duplexes by stabilization of thermally formed DNA
bubbles. The findings of this study provide a mechanism for the observed AuNP-
assisted single base-pair discrimination in a NanoBioArray chip. More importantly, the
results of this investigation provide an explanation for the discrepancy in the literature
regarding DNA hybridization using AuNP-loaded DNA strands.
71
Chapter 4. Single nucleotide polymorphism detection of KRAS gene codon 12 enabled by gold nanoparticles conducted in the NanoBioArray chip
Single nucleotide polymorphism (SNP) variations in the KRAS gene codon 12
have been frequently observed in genetic disorders in various cancers such as
colorectal carcinoma, lung adenocarcinoma, and ductal carcinoma of the pancreas
[149]. Since the presence of KRAS mutation influences the effectiveness of some
therapies, the prior detection of the mutation is critical for the physicians to select the
appropriate type of therapy [1, 3]. DNA sequencing and real-time PCR have been widely
used for detection of SNPs in KRAS gene; however, these techniques have limitations in
developing simple, fast, robust and high-throughput detection that can be routinely used
(See section 1.1).
Enjoying the design versatility and simplicity of DNA hybridization reactions, low-
density DNA microarrays are appropriate platforms for simultaneous detection of several
SNPs within a gene and from many patients [150]. In general, the transport of target
molecules to surface-bound probes in DNA microarray chips is by diffusion, which has a
slow kinetics and will lead to long DNA hybridization times [108]. When combined with
low-density DNA microarrays, the microfluidic technology can enhance the kinetics of
DNA hybridization via convective mass transport in a flow within the microchannels
[151].
The greater complexity of an interfacial environment and the enhanced molecular
interactions due to the 2-D immobilization layer render the DNA hybridization on the
surface different from the reaction in a bulk [152]. Several theoretical works have studied
the DNA hybridization of the liquid-phase target DNAs with the surface-bound
72
oligonucleotide probes on microarray chips and characterized various factors affecting
sensitivities and specificities of the results [28, 62, 152-156]. For instance, Zhang and
coworkers observed that the amounts of the specific and non-specific DNA duplexes
formed on the surface vary considerably with time and these amounts do not follow the
values that can be predicted from the equilibrium constants [62]. DNA hybridization
within the microfluidic channels and the impact of convective mass transport in a flow on
the reaction rates have been the subject of several research studies [157-160]. However
the impact of the flow on the assay specificities is less well-known.
In our group, Wang et al. developed a 2-D model of DNA hybridization in the
microfluidic channels to predict the effects of various experimental factors such as probe
densities, flow velocities, channel height and target concentrations on the hybridization
kinetics of the perfectly matched (PM) duplexes [161]. However, the model did not
predict the specificities of DNA hybridization. Herein, we aim to extend this model to
include the hybridization of target DNAs to the mismatched (MM) probes in presence of
the perfectly matched (PM) ones. This extension allows us to study the impact of flow on
the specificity of DNA hybridization in addition to the sensitivity. We also incorporate the
hybridization rate constants obtained from the surface plasmon resonance (SPR)
spectroscopy experiments (See Chapter 3) into the model, which allows us to calculate
the hybridization fractions and compare them with the experimental results. More
importantly, the model is used to study the hybridization kinetics of AuNP-loaded targets
(AuNP targets) in contrast to that of free targets.
These understandings help us to develop a room-temperature technique for
detection of SNP variations of KRAS gene codon 12 in the NBA chip. This method
alleviates the need for temperature control devices and also the tedious temperature
optimization procedure. Therefore, the method adds to the simplicity of the conventional
DNA microarrays assays by allowing multiplex analysis of SNPs at a single temperature.
Furthermore, the method offers the convenience of using the widely used PDMS-based
chips to conduct DNA hybridizations at room temperature.

73
4.1. A numerical model for DNA hybridization in a NanoBioArray chip channel
Figure 4-1(a) shows the configuration of a rectangular straight channel of the
NBA chip. Incompressible Navier-Stokes equation was used to simulate the microfluidic
flow in the microfluidic channels. The target solutions are introduced through the inlet
and flow along the channel (in x direction). The channels are long and rigid, in which
there is a steady-state laminar flow in the x-direction. In order to simulate the target
concentrations along the z- and x-directions, we use two-dimensional geometry (Figure
4-1(b)). The incompressible Navier-Stokes equation in these conditions is thus reduced
to Eq. 4-1 [161]:
u = 6Uz
H(1 −
z
H) (4 − 1)
Where u is the flow velocity in each point (z) along the channel's height, U is the average
flow velocity, and H is the channel height.
The DNA target molecules dissolved in the bulk phase are transported through
the convective force along the x direction. The mass transport of the target molecules is
via both diffusion as well as convection. The target concentration, C, is given by Eq. 4-2:
𝜕𝐶
𝜕𝑡= 𝐷 (
𝜕2𝐶
𝜕𝑥2+𝜕2𝐶
𝜕𝑧2) − u(
𝜕𝐶
𝜕𝑥) (4 − 2)
where D is the target diffusion coefficient. To determine D for ssDNA in aqueous
solutions, Stellwagen et al. suggested an empirical equation (Eq. 4-3) [162].
D = 7.38 × 10⁻⁶ cm 2s−1 × [base number]−0.539 (4 − 3)
Equation 4-3 was used to calculate the D values for free targets. For AuNP
targets, The D values were obtained from dynamic light scattering (DLS) measurement
(See section 2.7).
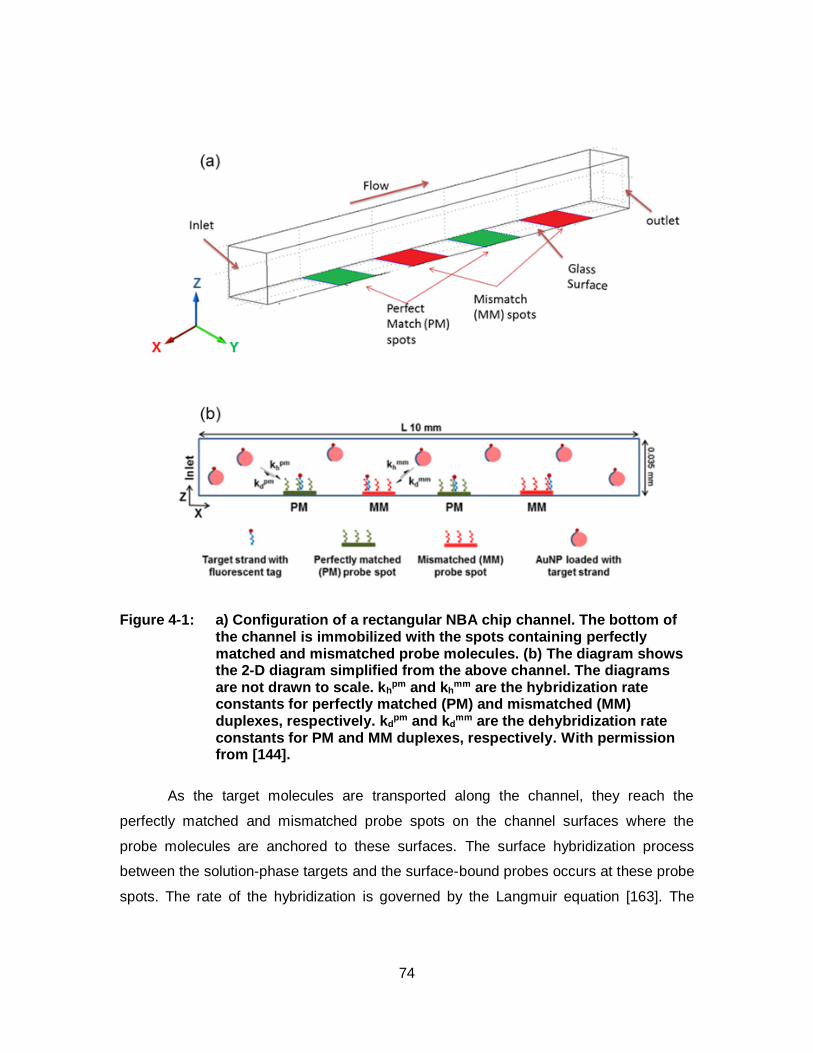
74
Figure 4-1: a) Configuration of a rectangular NBA chip channel. The bottom of the channel is immobilized with the spots containing perfectly matched and mismatched probe molecules. (b) The diagram shows the 2-D diagram simplified from the above channel. The diagrams are not drawn to scale. kh
pm and khmm are the hybridization rate
constants for perfectly matched (PM) and mismatched (MM) duplexes, respectively. kd
pm and kdmm are the dehybridization rate
constants for PM and MM duplexes, respectively. With permission from [144].
As the target molecules are transported along the channel, they reach the
perfectly matched and mismatched probe spots on the channel surfaces where the
probe molecules are anchored to these surfaces. The surface hybridization process
between the solution-phase targets and the surface-bound probes occurs at these probe
spots. The rate of the hybridization is governed by the Langmuir equation [163]. The
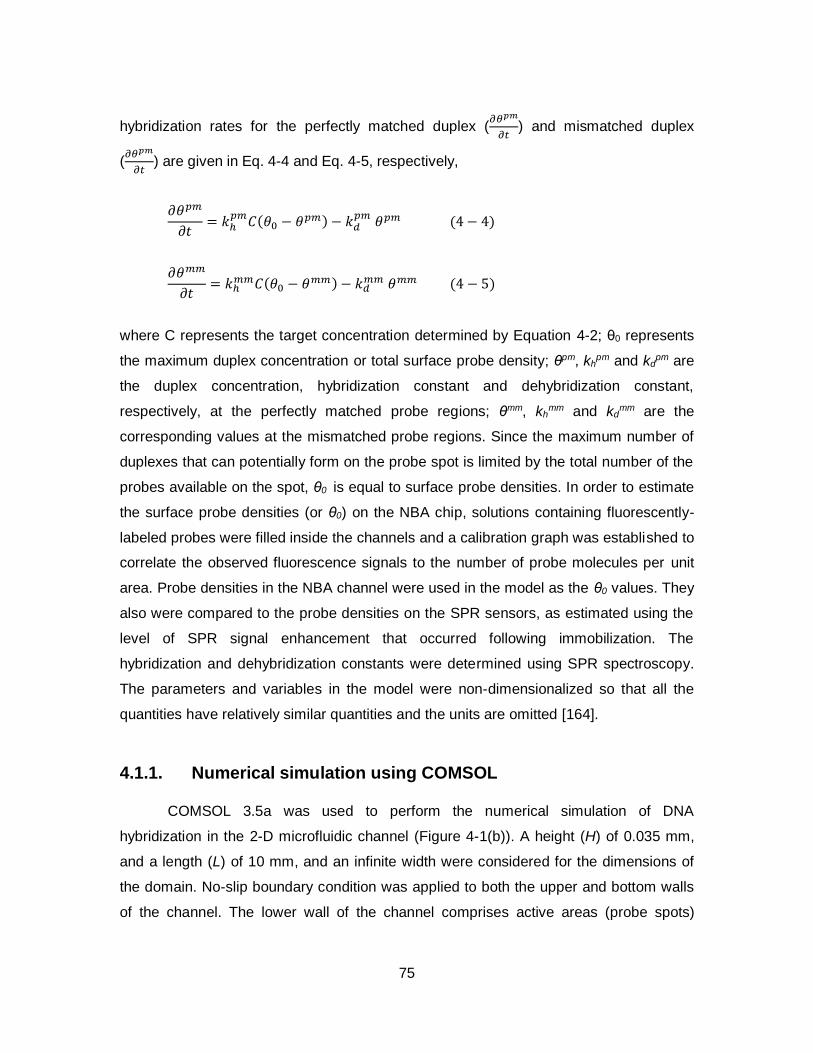
75
hybridization rates for the perfectly matched duplex (𝜕𝜃𝑝𝑚
𝜕𝑡) and mismatched duplex
(𝜕𝜃𝑝𝑚
𝜕𝑡) are given in Eq. 4-4 and Eq. 4-5, respectively,
𝜕𝜃𝑝𝑚
𝜕𝑡= 𝑘ℎ
𝑝𝑚𝐶(𝜃0 − 𝜃𝑝𝑚) − 𝑘𝑑
𝑝𝑚 𝜃𝑝𝑚 (4 − 4)
𝜕𝜃𝑚𝑚
𝜕𝑡= 𝑘ℎ
𝑚𝑚𝐶(𝜃0 − 𝜃𝑚𝑚) − 𝑘𝑑
𝑚𝑚 𝜃𝑚𝑚 (4 − 5)
where C represents the target concentration determined by Equation 4-2; θ0 represents
the maximum duplex concentration or total surface probe density; θpm, khpm and kd
pm are
the duplex concentration, hybridization constant and dehybridization constant,
respectively, at the perfectly matched probe regions; θmm, khmm and kd
mm are the
corresponding values at the mismatched probe regions. Since the maximum number of
duplexes that can potentially form on the probe spot is limited by the total number of the
probes available on the spot, θ0 is equal to surface probe densities. In order to estimate
the surface probe densities (or θ0) on the NBA chip, solutions containing fluorescently-
labeled probes were filled inside the channels and a calibration graph was established to
correlate the observed fluorescence signals to the number of probe molecules per unit
area. Probe densities in the NBA channel were used in the model as the θ0 values. They
also were compared to the probe densities on the SPR sensors, as estimated using the
level of SPR signal enhancement that occurred following immobilization. The
hybridization and dehybridization constants were determined using SPR spectroscopy.
The parameters and variables in the model were non-dimensionalized so that all the
quantities have relatively similar quantities and the units are omitted [164].
4.1.1. Numerical simulation using COMSOL
COMSOL 3.5a was used to perform the numerical simulation of DNA
hybridization in the 2-D microfluidic channel (Figure 4-1(b)). A height (H) of 0.035 mm,
and a length (L) of 10 mm, and an infinite width were considered for the dimensions of
the domain. No-slip boundary condition was applied to both the upper and bottom walls
of the channel. The lower wall of the channel comprises active areas (probe spots)
76
where solution-surface interactions (i.e. DNA hybridization between the bulk-phase
target molecules and surface-bound probe molecules) occur and non-active areas where
no surface-bulk interaction take place. The detailed procedure of simulation steps using
COMSOL is given in appendix A.
The parameters that are required to scale in the dimensionless processes were
either extracted from the literature or obtained experimentally. For instance, the initial
target concentration, similar to our typical experimental values, varies between 1-100
nM. The average flow rate (U) was in the range from 1 to 5 mm/s. Moreover, the
knowledge of the diffusion coefficient, D, of the target DNAs is required for determination
of target concentration (C) and the hybridization fractions (θpm for perfectly matched
duplexes and θmm for mismatched duplexes). The D value for a 20-mer free target,
calculated from Eq. 4-3, was 1.47×10⁻⁶ cm2/s. On the other hand, the D value for the
AuNP targets (20-mer) was calculated from dynamic light scattering (DLS)
measurements. The measured hydrodynamic diameter, dh, values, from the DLS
experiments, were used to derive D using the Einstein-Stokes equation (Ęq. 2-3). The
value of dh for the 5-nm diameter AuNPs (before DNA loading) was determined to be 6.8
(±0.2) nm, which increased to 7.6 (±0.5) nm when loaded with the D20 target. The
calculated value of D was 6.4×10⁻⁷ cm2/s for the 20-mer AuNP targets, which was about
half of the value (1.47×10⁻⁶ cm2/s) estimated for the 20-mer free targets.
The values for probe density θ0 were experimentally obtained from both the
measurements of SPR and experiments using the NBA chip. Based on the SPR
responses before and after probe immobilization, we estimated that the probe density on
the surfaces of the SPR sensor chip was (1.1 ±0.3) ×10-8 mol/m2. This value is relatively
close to the corresponding value obtained from the NBA chip experiments [(1.4 ±0.2)
×10-8 mol/m2]. Both values of the probe densities are at a low level which suggests that
the probe-probe interactions are minor [35].
4.1.2. Simulated results explain the effect of dynamic hybridization
Figure 4-2 shows the results obtained from simulation of the static and dynamic
hybridization between 20-mer free targets and their perfectly matched probes. F or the
77
dynamic condition, the lowest possible flow rate using vacuum suction in the straight
NBA channel (0.1 µL/min.) was chosen, and this condition resulted in a hybridization
time of 10 min. A typical 30-min. time was selected for the static condition. As shown in
the histogram (Figure 4-2(a), at 22 °C the hybridization signal from dynamic condition is
only slightly lower than the signal from static condition. The effect of convective mass
transport is more obvious at 40 °C (Figure 4-2(b)), which has led to higher hybridization
signal from the shorter dynamic condition, in comparison to the longer static condition.
Considering the shorter hybridization time in dynamic condition (10 min. vs. 30 min.), an
improvement in the signal intensity due to the convective mass transport is apparent.
The effect of convective mass transport can be explained by the concentration profiles.
The surface reaction caused the formation of depletion layers around the probe spots,
which deter the hybridization reaction. On the other hand, the efficient mass transport
and target replenishment, as provided in dynamic hybridization, diminish the depletion
layers and enhance the hybridization signals. This enhanced influence of the flow can be
explained by the concentration profiles, as the depletion layers of static conditions at 40
°C are developed over the entire channel height, representing completely diffusion-
controlled reaction kinetics. This observation is attributed to the enhanced hybridization
rate constants at higher temperatures (Table 3-1), which increases the target
consumption at the surface-bulk interface and cause more drastic depletion in the
neighboring bulk layers. Minimizing the localized depletion via convective mass transport
coupled with the enhanced hybridization kinetics caused the considerably higher signal
intensity from dynamic hybridization at 40 °C. These results explain the observations
reported previously from our group [115].
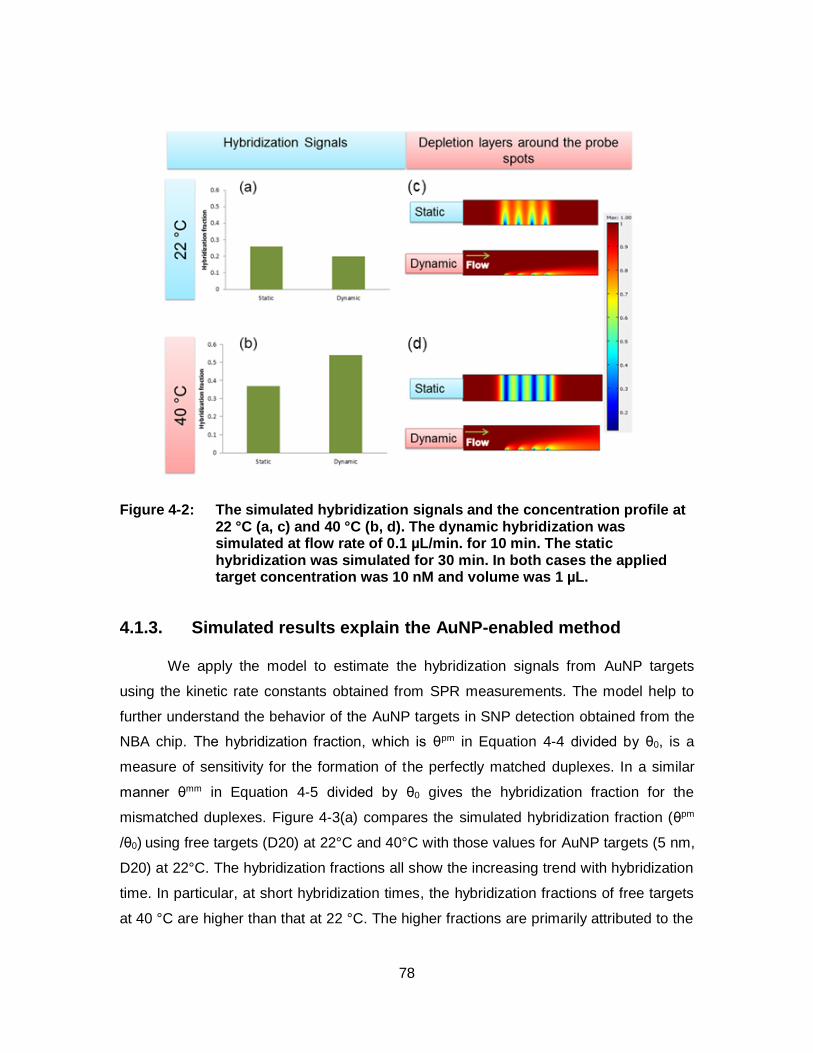
78
Figure 4-2: The simulated hybridization signals and the concentration profile at 22 °C (a, c) and 40 °C (b, d). The dynamic hybridization was simulated at flow rate of 0.1 µL/min. for 10 min. The static hybridization was simulated for 30 min. In both cases the applied target concentration was 10 nM and volume was 1 µL.
4.1.3. Simulated results explain the AuNP-enabled method
We apply the model to estimate the hybridization signals from AuNP targets
using the kinetic rate constants obtained from SPR measurements. The model help to
further understand the behavior of the AuNP targets in SNP detection obtained from the
NBA chip. The hybridization fraction, which is θpm in Equation 4-4 divided by θ0, is a
measure of sensitivity for the formation of the perfectly matched duplexes. In a similar
manner θmm in Equation 4-5 divided by θ0 gives the hybridization fraction for the
mismatched duplexes. Figure 4-3(a) compares the simulated hybridization fraction (θpm
/θ0) using free targets (D20) at 22°C and 40°C with those values for AuNP targets (5 nm,
D20) at 22°C. The hybridization fractions all show the increasing trend with hybridization
time. In particular, at short hybridization times, the hybridization fractions of free targets
at 40 °C are higher than that at 22 °C. The higher fractions are primarily attributed to the
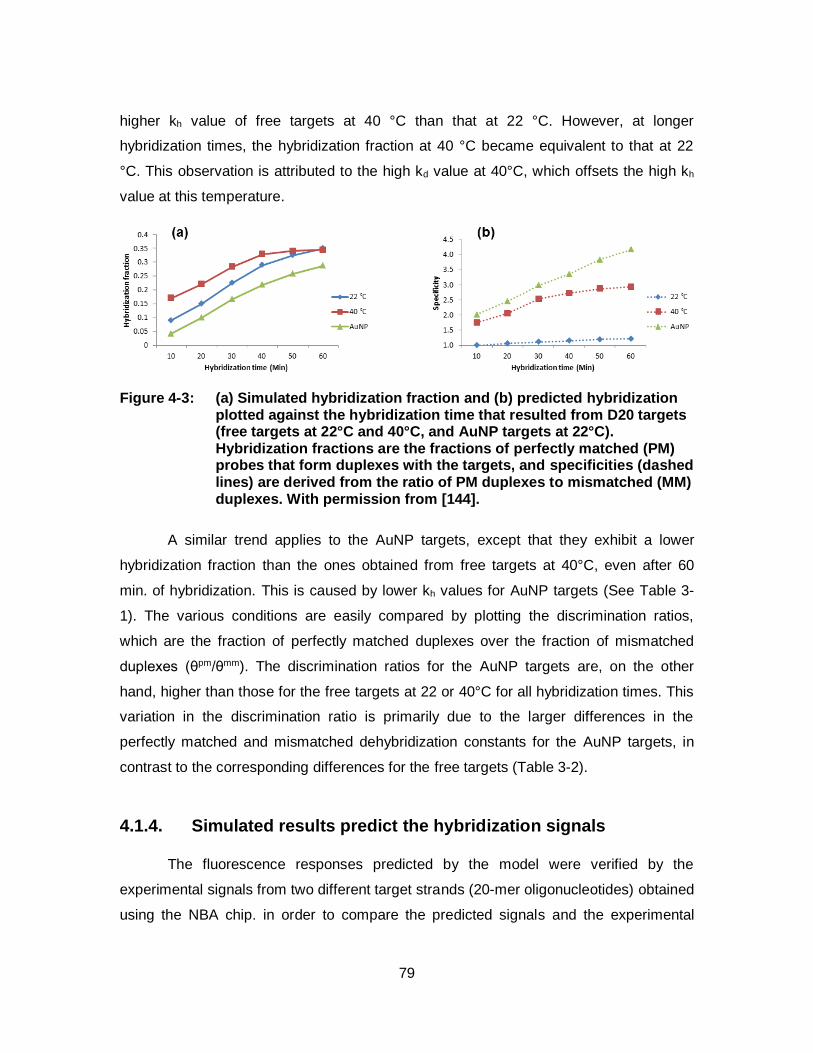
79
higher kh value of free targets at 40 °C than that at 22 °C. However, at longer
hybridization times, the hybridization fraction at 40 °C became equivalent to that at 22
°C. This observation is attributed to the high kd value at 40°C, which offsets the high kh
value at this temperature.
Figure 4-3: (a) Simulated hybridization fraction and (b) predicted hybridization plotted against the hybridization time that resulted from D20 targets (free targets at 22°C and 40°C, and AuNP targets at 22°C). Hybridization fractions are the fractions of perfectly matched (PM) probes that form duplexes with the targets, and specificities (dashed lines) are derived from the ratio of PM duplexes to mismatched (MM) duplexes. With permission from [144].
A similar trend applies to the AuNP targets, except that they exhibit a lower
hybridization fraction than the ones obtained from free targets at 40°C, even after 60
min. of hybridization. This is caused by lower kh values for AuNP targets (See Table 3-
1). The various conditions are easily compared by plotting the discrimination ratios,
which are the fraction of perfectly matched duplexes over the fraction of mismatched
duplexes (θpm/θmm). The discrimination ratios for the AuNP targets are, on the other
hand, higher than those for the free targets at 22 or 40°C for all hybridization times. This
variation in the discrimination ratio is primarily due to the larger differences in the
perfectly matched and mismatched dehybridization constants for the AuNP targets, in
contrast to the corresponding differences for the free targets (Table 3-2).
4.1.4. Simulated results predict the hybridization signals
The fluorescence responses predicted by the model were verified by the
experimental signals from two different target strands (20-mer oligonucleotides) obtained
using the NBA chip. in order to compare the predicted signals and the experimental
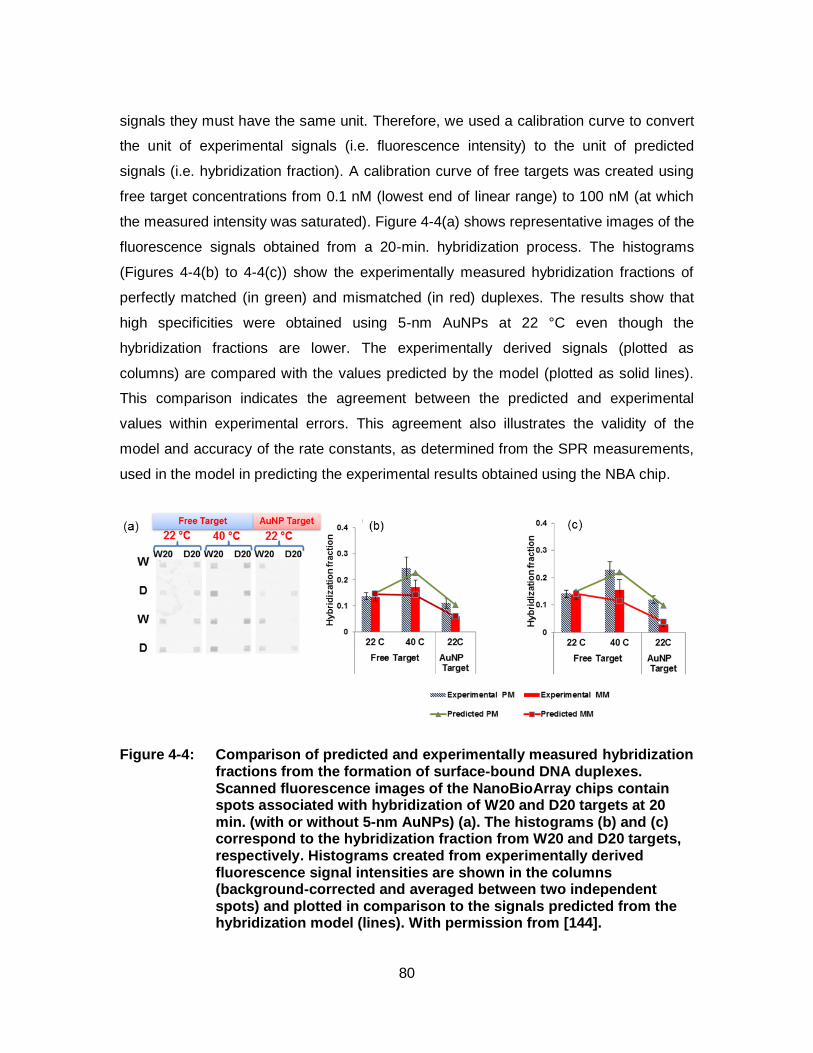
80
signals they must have the same unit. Therefore, we used a calibration curve to convert
the unit of experimental signals (i.e. fluorescence intensity) to the unit of predicted
signals (i.e. hybridization fraction). A calibration curve of free targets was created using
free target concentrations from 0.1 nM (lowest end of linear range) to 100 nM (at which
the measured intensity was saturated). Figure 4-4(a) shows representative images of the
fluorescence signals obtained from a 20-min. hybridization process. The histograms
(Figures 4-4(b) to 4-4(c)) show the experimentally measured hybridization fractions of
perfectly matched (in green) and mismatched (in red) duplexes. The results show that
high specificities were obtained using 5-nm AuNPs at 22 °C even though the
hybridization fractions are lower. The experimentally derived signals (plotted as
columns) are compared with the values predicted by the model (plotted as solid lines).
This comparison indicates the agreement between the predicted and experimental
values within experimental errors. This agreement also illustrates the validity of the
model and accuracy of the rate constants, as determined from the SPR measurements,
used in the model in predicting the experimental results obtained using the NBA chip.
Figure 4-4: Comparison of predicted and experimentally measured hybridization fractions from the formation of surface-bound DNA duplexes. Scanned fluorescence images of the NanoBioArray chips contain spots associated with hybridization of W20 and D20 targets at 20 min. (with or without 5-nm AuNPs) (a). The histograms (b) and (c) correspond to the hybridization fraction from W20 and D20 targets, respectively. Histograms created from experimentally derived fluorescence signal intensities are shown in the columns (background-corrected and averaged between two independent spots) and plotted in comparison to the signals predicted from the hybridization model (lines). With permission from [144].
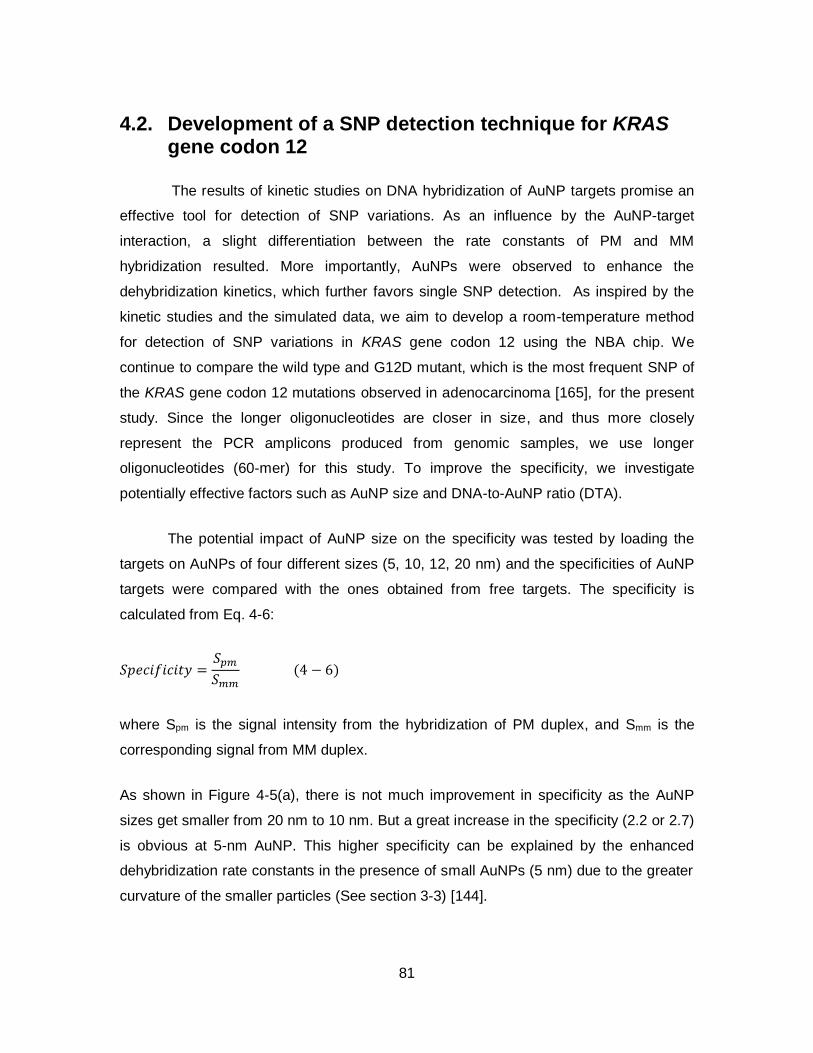
81
4.2. Development of a SNP detection technique for KRAS gene codon 12
The results of kinetic studies on DNA hybridization of AuNP targets promise an
effective tool for detection of SNP variations. As an influence by the AuNP-target
interaction, a slight differentiation between the rate constants of PM and MM
hybridization resulted. More importantly, AuNPs were observed to enhance the
dehybridization kinetics, which further favors single SNP detection. As inspired by the
kinetic studies and the simulated data, we aim to develop a room-temperature method
for detection of SNP variations in KRAS gene codon 12 using the NBA chip. We
continue to compare the wild type and G12D mutant, which is the most frequent SNP of
the KRAS gene codon 12 mutations observed in adenocarcinoma [165], for the present
study. Since the longer oligonucleotides are closer in size, and thus more closely
represent the PCR amplicons produced from genomic samples, we use longer
oligonucleotides (60-mer) for this study. To improve the specificity, we investigate
potentially effective factors such as AuNP size and DNA-to-AuNP ratio (DTA).
The potential impact of AuNP size on the specificity was tested by loading the
targets on AuNPs of four different sizes (5, 10, 12, 20 nm) and the specificities of AuNP
targets were compared with the ones obtained from free targets. The specificity is
calculated from Eq. 4-6:
𝑆𝑝𝑒𝑐𝑖𝑓𝑖𝑐𝑖𝑡𝑦 =𝑆𝑝𝑚
𝑆𝑚𝑚 (4 − 6)
where Spm is the signal intensity from the hybridization of PM duplex, and Smm is the
corresponding signal from MM duplex.
As shown in Figure 4-5(a), there is not much improvement in specificity as the AuNP
sizes get smaller from 20 nm to 10 nm. But a great increase in the specificity (2.2 or 2.7)
is obvious at 5-nm AuNP. This higher specificity can be explained by the enhanced
dehybridization rate constants in the presence of small AuNPs (5 nm) due to the greater
curvature of the smaller particles (See section 3-3) [144].
82
The DNA-to-AuNP (DTA) ratio was another factor that its influence on the
specificities was investigated. As concluded from Figure 4-5(b), as DTA decreases from
3 to 1, which means that the number of AuNP per target strand increases from 0.33 to 1,
the specificity increases (up to 2.7). Therefore, DTA of 1 was chosen as the optimum,
which corroborated with the results previously reported [73].
Figure 4-5: (a) Histogram resulted from the hybridization signals resulted from free targets (60-mer) and targets conjugated with AuNPs of different sizes (5, 10, 12 and 20 nm in diameter). The numbers on top of the histogram bars are specificities obtained using Eq. 4-6. A value of 1 for specificity means no discrimination between PM and MM probes. (b) Histogram shows hybridization signals from free targets as well as from 60-mer targets loaded on 5-nm AuNPs with different DNA-to-AuNP (DTA) ratios. With permission from [166].
83
4.2.1. Multiple mutation detection
Following the optimization of the AuNP-enabled method using wild-type (WT)
and one of its mutant (G12D) of the KRAS gene sequences, the method was evaluated
fully using all 3 codon 12 mutants plus the wild-type. Figure 4-6(a) and 4-7(b) show the
image and the corresponding histogram of room-temperature hybridization of free
targets as well as AuNP targets. The numbers above each group of PM and MM column
are the specificity of each target which are the signal of PM spot (Spm) divided by the
average of the signals of other 3 MM spots (Smm1, Smm2, Smm3). see Equation 4-7.
𝑆𝑝𝑒𝑐𝑖𝑓𝑖𝑐𝑖𝑡𝑦 =𝑆𝑝𝑚
13⁄ (Smm1+𝑆mm2+𝑆mm3)
(4 − 7)
While the specificity of AuNP target (D60) remains to be low (2.4), the values
resulted from the AuNP targets range from 5.9 for the V60 target to 7.1 for A60. As a
comparison, we performed a similar experiment using the conventional temperature
stringency method at 55 °C, which is commonly used for microarray analysis of KRAS
[167]. As shown in Figure 4-6(b), free targets at 55 ºC created specificities ranging from
1.4 to 6.6. These specificities are also in the same range as those obtained previously
using microarray approaches [167, 168]. The high-temperature values are comparable
to, if not worse than, the ones resulted from AuNP targets at room-temperature
hybridization (specificities of 2.4 to 7.1). These results demonstrate that the AuNP
method has enabled the targets to effectively discriminate between their PM probes and
the MM probes at room temperature at a short hybridization time of 20 min.
It is noted that though the specificity is improved, the signal intensity decreases
in both the AuNP method and the high-temperature method. These lower signal
intensities result from the lower hybridization rate constants of AuNP targets, as
compared to free targets (See Table 3-1). As suggested by the simulated results (Figure
4-3), this issue can be resolved by using long hybridization times, as 12 h are usually
needed to achieve high sensitivities and specificities in conventional nucleic acid
bioarray experiments [169]. But we did not need 12 h; we hybridized for 60 min., instead
of 20 min., with the results shown in Figure 4-7. While the signal intensities are
generally higher, more importantly, the PM spots of AuNP targets show comparable
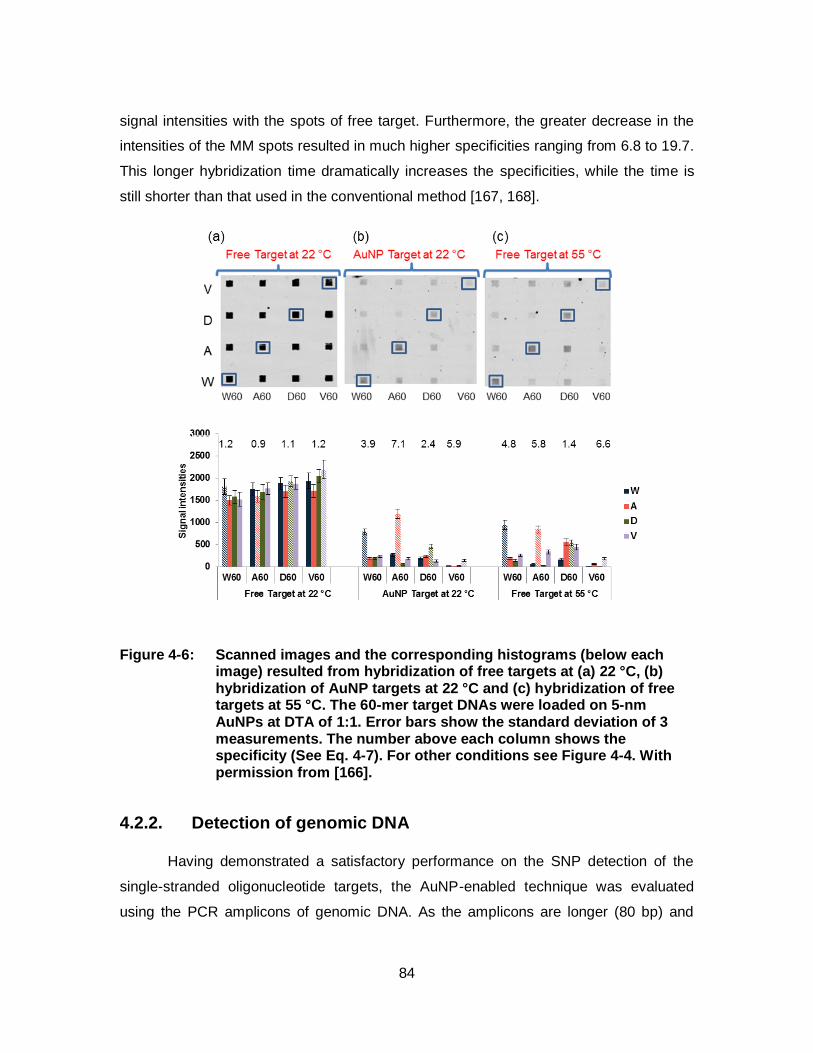
84
signal intensities with the spots of free target. Furthermore, the greater decrease in the
intensities of the MM spots resulted in much higher specificities ranging from 6.8 to 19.7.
This longer hybridization time dramatically increases the specificities, while the time is
still shorter than that used in the conventional method [167, 168].
Figure 4-6: Scanned images and the corresponding histograms (below each image) resulted from hybridization of free targets at (a) 22 °C, (b) hybridization of AuNP targets at 22 °C and (c) hybridization of free targets at 55 °C. The 60-mer target DNAs were loaded on 5-nm AuNPs at DTA of 1:1. Error bars show the standard deviation of 3 measurements. The number above each column shows the specificity (See Eq. 4-7). For other conditions see Figure 4-4. With permission from [166].
4.2.2. Detection of genomic DNA
Having demonstrated a satisfactory performance on the SNP detection of the
single-stranded oligonucleotide targets, the AuNP-enabled technique was evaluated
using the PCR amplicons of genomic DNA. As the amplicons are longer (80 bp) and
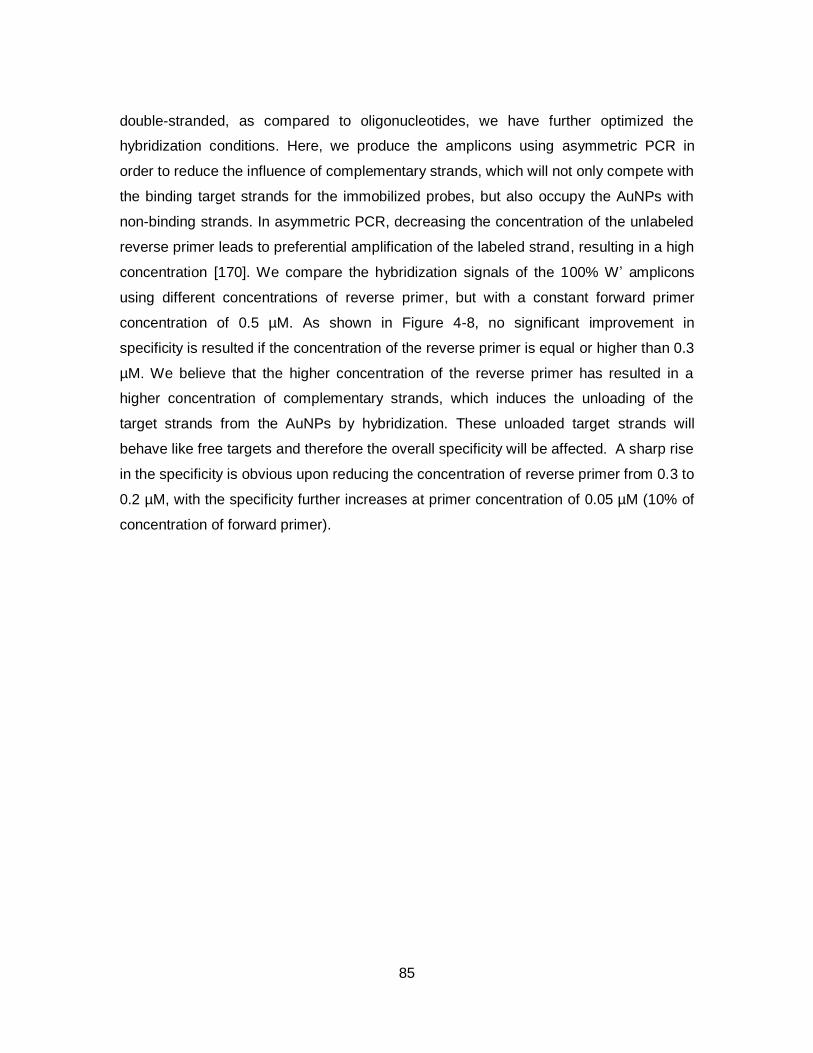
85
double-stranded, as compared to oligonucleotides, we have further optimized the
hybridization conditions. Here, we produce the amplicons using asymmetric PCR in
order to reduce the influence of complementary strands, which will not only compete with
the binding target strands for the immobilized probes, but also occupy the AuNPs with
non-binding strands. In asymmetric PCR, decreasing the concentration of the unlabeled
reverse primer leads to preferential amplification of the labeled strand, resulting in a high
concentration [170]. We compare the hybridization signals of the 100% W’ amplicons
using different concentrations of reverse primer, but with a constant forward primer
concentration of 0.5 µM. As shown in Figure 4-8, no significant improvement in
specificity is resulted if the concentration of the reverse primer is equal or higher than 0.3
µM. We believe that the higher concentration of the reverse primer has resulted in a
higher concentration of complementary strands, which induces the unloading of the
target strands from the AuNPs by hybridization. These unloaded target strands will
behave like free targets and therefore the overall specificity will be affected. A sharp rise
in the specificity is obvious upon reducing the concentration of reverse primer from 0.3 to
0.2 µM, with the specificity further increases at primer concentration of 0.05 µM (10% of
concentration of forward primer).
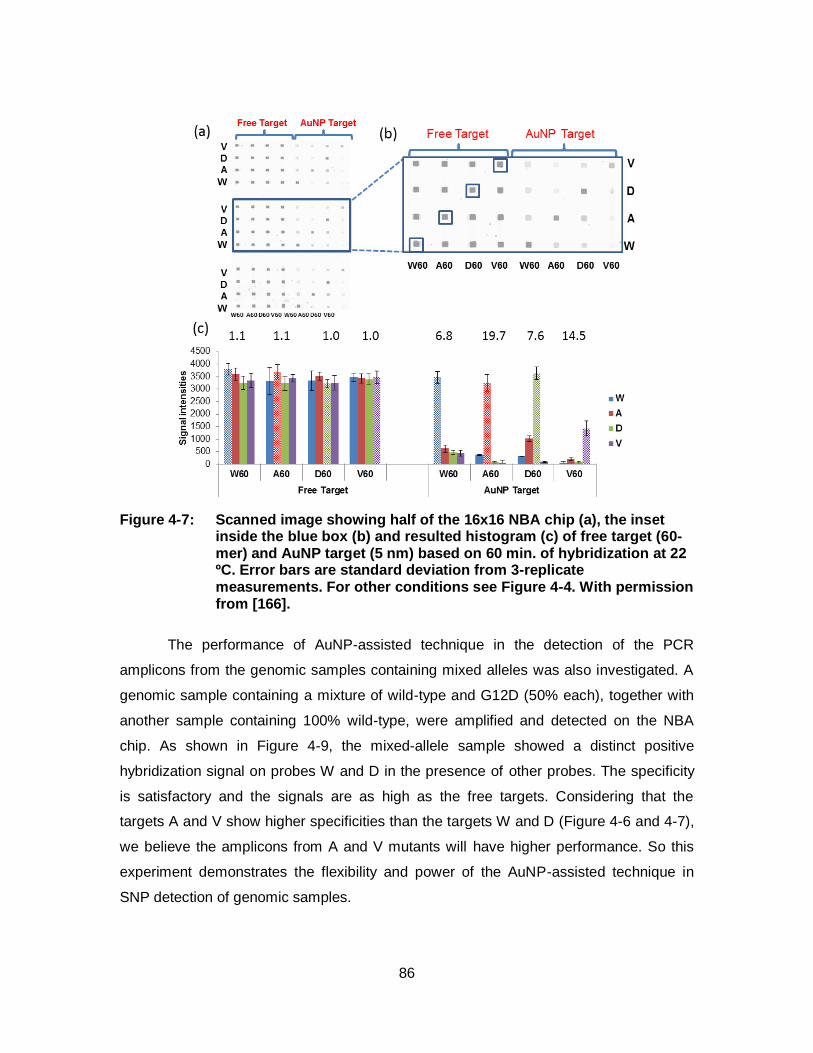
86
Figure 4-7: Scanned image showing half of the 16x16 NBA chip (a), the inset inside the blue box (b) and resulted histogram (c) of free target (60-mer) and AuNP target (5 nm) based on 60 min. of hybridization at 22 ºC. Error bars are standard deviation from 3-replicate measurements. For other conditions see Figure 4-4. With permission from [166].
The performance of AuNP-assisted technique in the detection of the PCR
amplicons from the genomic samples containing mixed alleles was also investigated. A
genomic sample containing a mixture of wild-type and G12D (50% each), together with
another sample containing 100% wild-type, were amplified and detected on the NBA
chip. As shown in Figure 4-9, the mixed-allele sample showed a distinct positive
hybridization signal on probes W and D in the presence of other probes. The specificity
is satisfactory and the signals are as high as the free targets. Considering that the
targets A and V show higher specificities than the targets W and D (Figure 4-6 and 4-7),
we believe the amplicons from A and V mutants will have higher performance. So this
experiment demonstrates the flexibility and power of the AuNP-assisted technique in
SNP detection of genomic samples.
87
Figure 4-8: DNA amplification by asymmetric PCR. Scanned image (a) and the corresponding histogram (b) resulted from hybridization of PCR products amplified from genomic DNAs with 100% wild-type KRAS alleles (W’) at 22 °C for 60 min. on the NBA chip. Asymmetric PCR was performed using different concentrations of the reverse primer (0.05, 0.1, 0.2, 0.3, 0.4, 0.5 µM) with a constant forward primer concentration of 0.5 µM. All the targets (6 nM) are previously loaded on the 5-nm AuNPs (10 nM). In the histogram, the column bars show the average of signal intensities of the spots, measured at the intersection of horizontal probe lines and the vertical target lines, and the true positive binding signals of W’ are represented by the hatched bar. Error bars show the standard deviation of 3 measurements. The number above each column shows the specificity which is determined by dividing the intensity of the PM spots (W’ to W) by that of the 3 MM spots (W’ to A, V and D). With permission from [166].
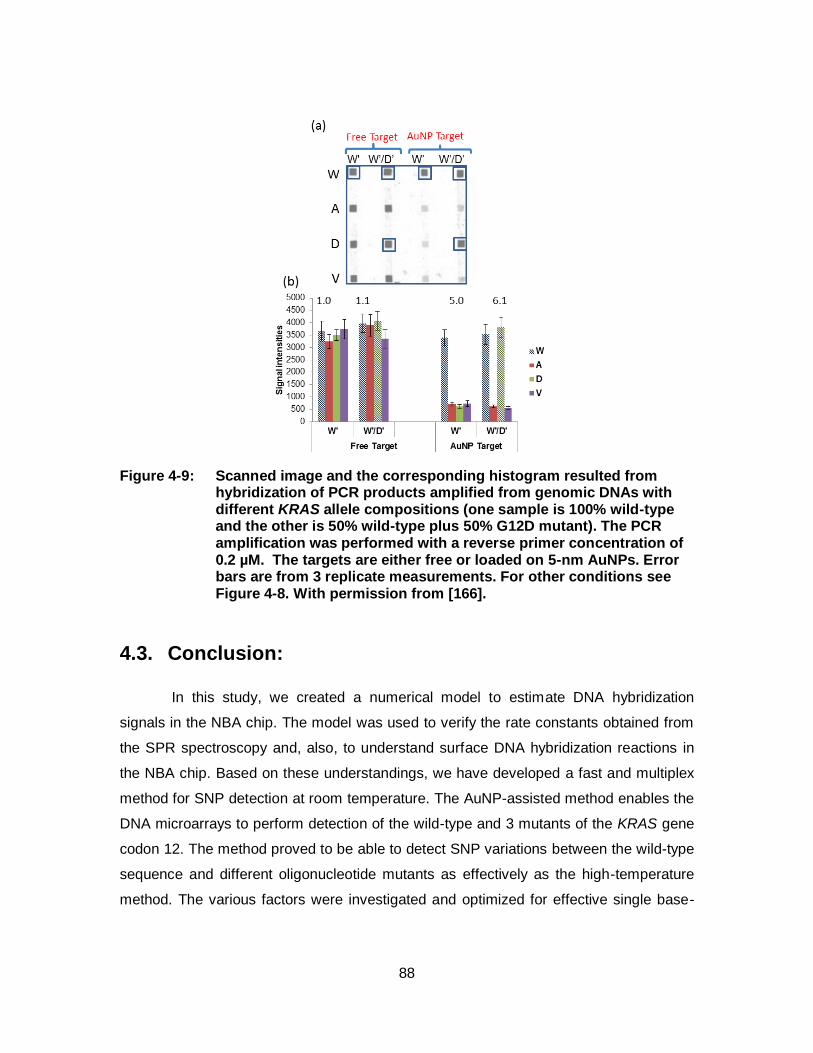
88
Figure 4-9: Scanned image and the corresponding histogram resulted from hybridization of PCR products amplified from genomic DNAs with different KRAS allele compositions (one sample is 100% wild-type and the other is 50% wild-type plus 50% G12D mutant). The PCR amplification was performed with a reverse primer concentration of 0.2 µM. The targets are either free or loaded on 5-nm AuNPs. Error bars are from 3 replicate measurements. For other conditions see Figure 4-8. With permission from [166].
4.3. Conclusion:
In this study, we created a numerical model to estimate DNA hybridization
signals in the NBA chip. The model was used to verify the rate constants obtained from
the SPR spectroscopy and, also, to understand surface DNA hybridization reactions in
the NBA chip. Based on these understandings, we have developed a fast and multiplex
method for SNP detection at room temperature. The AuNP-assisted method enables the
DNA microarrays to perform detection of the wild-type and 3 mutants of the KRAS gene
codon 12. The method proved to be able to detect SNP variations between the wild-type
sequence and different oligonucleotide mutants as effectively as the high-temperature
method. The various factors were investigated and optimized for effective single base-
89
pair discriminations. The method has been tested on PCR amplicons of the wild-type
allele (W) and of one mutant allele (D).
90
Chapter 5. Targeted acceleration of DNA dehybridization using gold nanoparticles offers specificity without compromising sensitivity for nucleic acid analyses
In this chapter, we report the development of a wash method that uses AuNPs to
preferentially destabilize the nonspecific duplexes in the presence of the specific ones.
As discussed in section 3-1, our kinetic studies of DNA hybridization showed a shift in
the rate-limiting step of hybridization from the mismatch-insensitive nucleation step to
the mismatch-sensitive zipping step. This shift reduces the hybridization of MM duplexes
slightly more than that of the PM ones in a SNP study. We further observed that AuNPs
enhanced the dehybridization of the MM duplexes more than that of PM duplexes. This
further observation accounts for most of the SNP discrimination power of the AuNP
technique. Using the kinetic studies and the insights from the modelling of DNA
hybridization, we developed a method for SNP detection in the NBA chip. Here, we use
CD-NBA chip as a platform for developing our wash method. This chip has higher
multiplexing capacities than the NBA chip because it not only can accommodate higher
numbers of individual probe-target hybridization events (9216 events (96 × 96 channels)
in CD-NBA chip vs. 256 events (16 × 16 channels) in the NBA chip, but also it enjoys the
convenience of centrifugal pumping for high-throughput analysis (See section 1-5).
The scanned image and the histogram in Figure 5-1 show the hybridization
signals from the PCR amplicons with 4 different alleles of KRAS gene codon 12 in the
CD-NBA chip. In CD-NBA chip, the target molecules flow along the spiral channels and
hybridize to their complementary probes located at the intersections of the spiral
channels to the radially-patterned probe lines. In agreement with the previous results in
chapter 4, AuNP targets, in contrast to free targets, were able to discriminate between
the perfectly matched (PM) probes and the mismatched (MM) probes. However, the
91
sensitivities (PM signal intensities) of the hybridization of AuNP targets are lower than
that of the free targets (Figure 5-1). We attribute the reduced sensitivities in AuNP
targets to their lower hybridization rate constants kh, as compared to free targets.
Considering that the CD spinning rate of 900 rpm, used in this experiment, corresponds
to ~10 min. hybridization, these results are in agreement with the observations in the
NBA chip (See section 4-5) that in the short hybridization times; where the contribution
of kh values is larger, AuNP targets, with lower kh values, result in lower hybridization
signals than free targets. Therefore, we consider a compromise between the sensitivity
and specificity for AuNP targets at short hybridization times. Moreover, this technique
adds the complexity of sample preparation since the target strands have to be loaded
onto the AuNP surfaces prior to the hybridization analysis. Our search for an effective
and simple SNP detection technique continues.
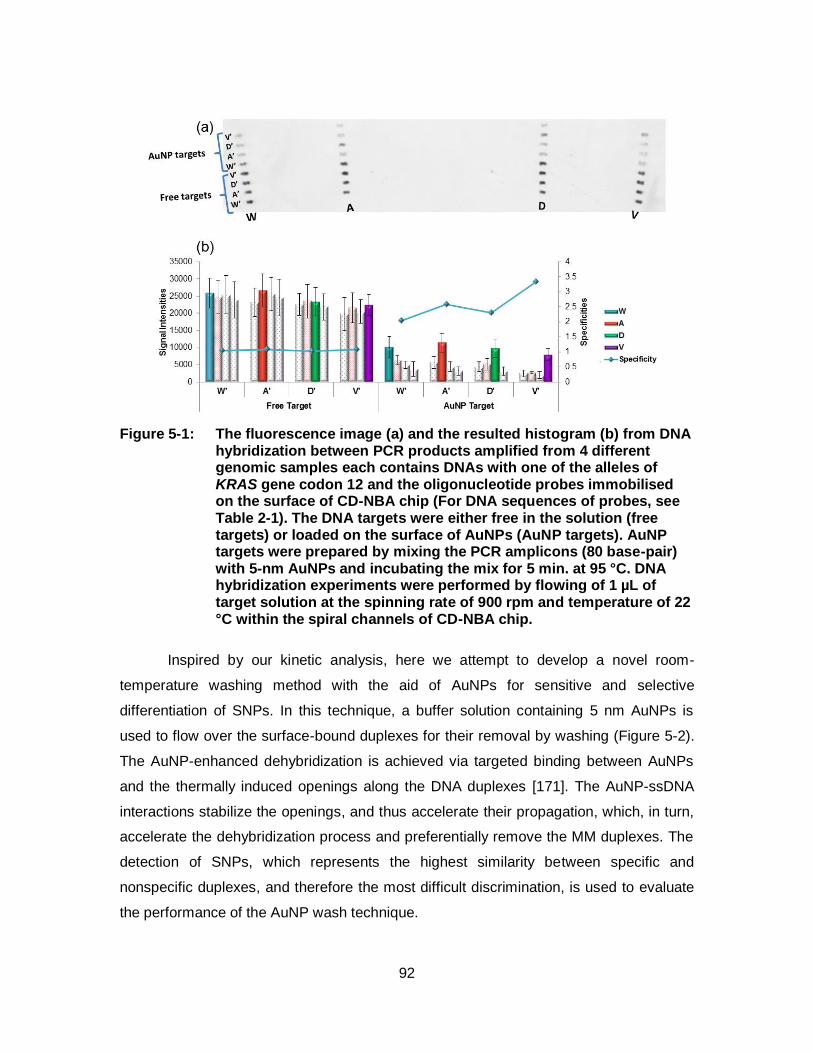
92
Figure 5-1: The fluorescence image (a) and the resulted histogram (b) from DNA hybridization between PCR products amplified from 4 different genomic samples each contains DNAs with one of the alleles of KRAS gene codon 12 and the oligonucleotide probes immobilised on the surface of CD-NBA chip (For DNA sequences of probes, see Table 2-1). The DNA targets were either free in the solution (free targets) or loaded on the surface of AuNPs (AuNP targets). AuNP targets were prepared by mixing the PCR amplicons (80 base-pair) with 5-nm AuNPs and incubating the mix for 5 min. at 95 °C. DNA hybridization experiments were performed by flowing of 1 µL of target solution at the spinning rate of 900 rpm and temperature of 22 °C within the spiral channels of CD-NBA chip.
Inspired by our kinetic analysis, here we attempt to develop a novel room-
temperature washing method with the aid of AuNPs for sensitive and selective
differentiation of SNPs. In this technique, a buffer solution containing 5 nm AuNPs is
used to flow over the surface-bound duplexes for their removal by washing (Figure 5-2).
The AuNP-enhanced dehybridization is achieved via targeted binding between AuNPs
and the thermally induced openings along the DNA duplexes [171]. The AuNP-ssDNA
interactions stabilize the openings, and thus accelerate their propagation, which, in turn,
accelerate the dehybridization process and preferentially remove the MM duplexes. The
detection of SNPs, which represents the highest similarity between specific and
nonspecific duplexes, and therefore the most difficult discrimination, is used to evaluate
the performance of the AuNP wash technique.
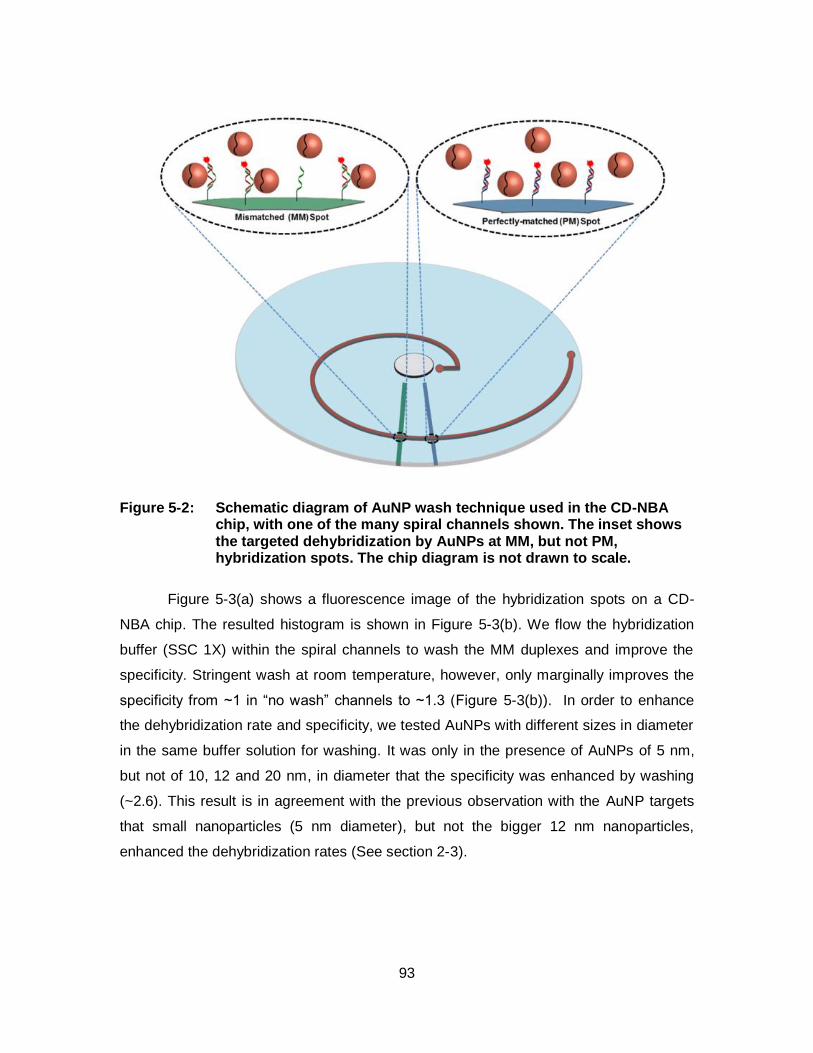
93
Figure 5-2: Schematic diagram of AuNP wash technique used in the CD-NBA chip, with one of the many spiral channels shown. The inset shows the targeted dehybridization by AuNPs at MM, but not PM, hybridization spots. The chip diagram is not drawn to scale.
Figure 5-3(a) shows a fluorescence image of the hybridization spots on a CD-
NBA chip. The resulted histogram is shown in Figure 5-3(b). We flow the hybridization
buffer (SSC 1X) within the spiral channels to wash the MM duplexes and improve the
specificity. Stringent wash at room temperature, however, only marginally improves the
specificity from ~1 in “no wash” channels to ~1.3 (Figure 5-3(b)). In order to enhance
the dehybridization rate and specificity, we tested AuNPs with different sizes in diameter
in the same buffer solution for washing. It was only in the presence of AuNPs of 5 nm,
but not of 10, 12 and 20 nm, in diameter that the specificity was enhanced by washing
(~2.6). This result is in agreement with the previous observation with the AuNP targets
that small nanoparticles (5 nm diameter), but not the bigger 12 nm nanoparticles,
enhanced the dehybridization rates (See section 2-3).
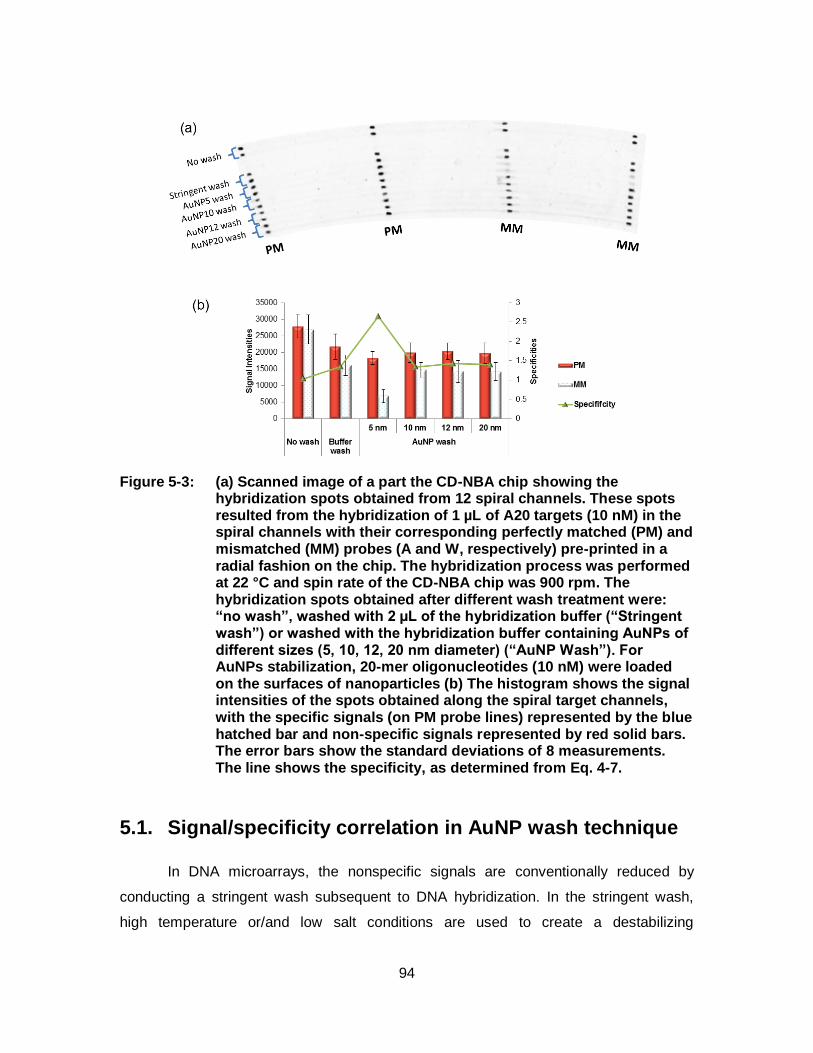
94
Figure 5-3: (a) Scanned image of a part the CD-NBA chip showing the hybridization spots obtained from 12 spiral channels. These spots resulted from the hybridization of 1 µL of A20 targets (10 nM) in the spiral channels with their corresponding perfectly matched (PM) and mismatched (MM) probes (A and W, respectively) pre-printed in a radial fashion on the chip. The hybridization process was performed at 22 °C and spin rate of the CD-NBA chip was 900 rpm. The hybridization spots obtained after different wash treatment were: “no wash”, washed with 2 µL of the hybridization buffer (“Stringent wash”) or washed with the hybridization buffer containing AuNPs of different sizes (5, 10, 12, 20 nm diameter) (“AuNP Wash”). For AuNPs stabilization, 20-mer oligonucleotides (10 nM) were loaded on the surfaces of nanoparticles (b) The histogram shows the signal intensities of the spots obtained along the spiral target channels, with the specific signals (on PM probe lines) represented by the blue hatched bar and non-specific signals represented by red solid bars. The error bars show the standard deviations of 8 measurements. The line shows the specificity, as determined from Eq. 4-7.
5.1. Signal/specificity correlation in AuNP wash technique
In DNA microarrays, the nonspecific signals are conventionally reduced by
conducting a stringent wash subsequent to DNA hybridization. In the stringent wash,
high temperature or/and low salt conditions are used to create a destabilizing
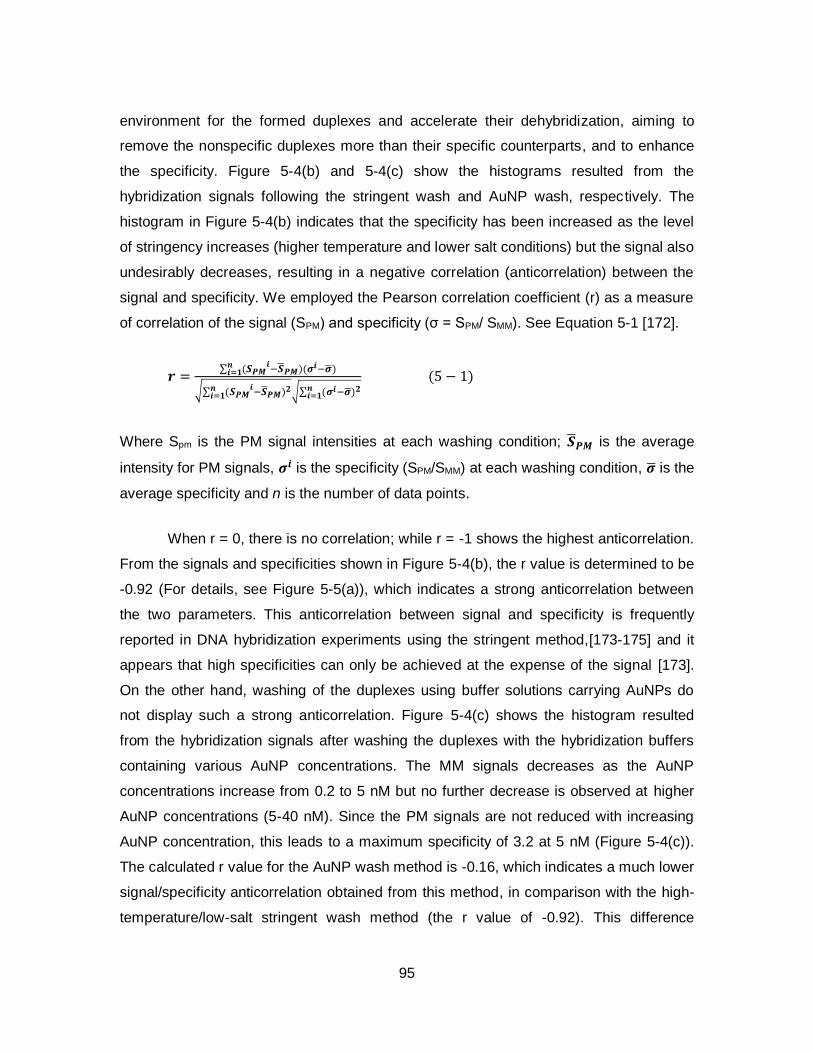
95
environment for the formed duplexes and accelerate their dehybridization, aiming to
remove the nonspecific duplexes more than their specific counterparts, and to enhance
the specificity. Figure 5-4(b) and 5-4(c) show the histograms resulted from the
hybridization signals following the stringent wash and AuNP wash, respectively. The
histogram in Figure 5-4(b) indicates that the specificity has been increased as the level
of stringency increases (higher temperature and lower salt conditions) but the signal also
undesirably decreases, resulting in a negative correlation (anticorrelation) between the
signal and specificity. We employed the Pearson correlation coefficient (r) as a measure
of correlation of the signal (SPM) and specificity (σ = SPM/ SMM). See Equation 5-1 [172].
𝒓 =∑ (𝑺𝑷𝑴
𝒊−�̅�𝑷𝑴)(𝝈
𝒊−�̅�)𝒏𝒊=𝟏
√∑ (𝑺𝑷𝑴𝒊−�̅�𝑷𝑴)
𝟐𝒏𝒊=𝟏 √∑ (𝝈𝒊−�̅�)𝟐𝒏
𝒊=𝟏
(5 − 1)
Where Spm is the PM signal intensities at each washing condition; �̅�𝑷𝑴 is the average
intensity for PM signals, 𝝈𝒊 is the specificity (SPM/SMM) at each washing condition, �̅� is the
average specificity and n is the number of data points.
When r = 0, there is no correlation; while r = -1 shows the highest anticorrelation.
From the signals and specificities shown in Figure 5-4(b), the r value is determined to be
-0.92 (For details, see Figure 5-5(a)), which indicates a strong anticorrelation between
the two parameters. This anticorrelation between signal and specificity is frequently
reported in DNA hybridization experiments using the stringent method,[173-175] and it
appears that high specificities can only be achieved at the expense of the signal [173].
On the other hand, washing of the duplexes using buffer solutions carrying AuNPs do
not display such a strong anticorrelation. Figure 5-4(c) shows the histogram resulted
from the hybridization signals after washing the duplexes with the hybridization buffers
containing various AuNP concentrations. The MM signals decreases as the AuNP
concentrations increase from 0.2 to 5 nM but no further decrease is observed at higher
AuNP concentrations (5-40 nM). Since the PM signals are not reduced with increasing
AuNP concentration, this leads to a maximum specificity of 3.2 at 5 nM (Figure 5-4(c)).
The calculated r value for the AuNP wash method is -0.16, which indicates a much lower
signal/specificity anticorrelation obtained from this method, in comparison with the high-
temperature/low-salt stringent wash method (the r value of -0.92). This difference
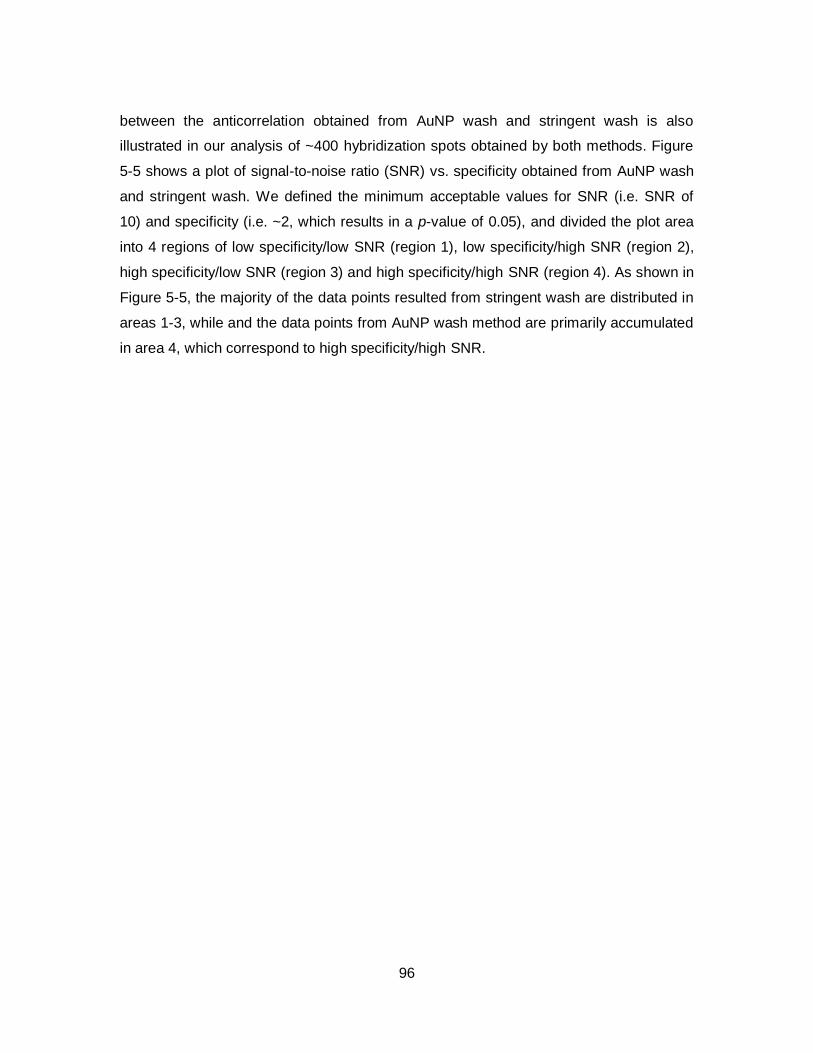
96
between the anticorrelation obtained from AuNP wash and stringent wash is also
illustrated in our analysis of ~400 hybridization spots obtained by both methods. Figure
5-5 shows a plot of signal-to-noise ratio (SNR) vs. specificity obtained from AuNP wash
and stringent wash. We defined the minimum acceptable values for SNR (i.e. SNR of
10) and specificity (i.e. ~2, which results in a p-value of 0.05), and divided the plot area
into 4 regions of low specificity/low SNR (region 1), low specificity/high SNR (region 2),
high specificity/low SNR (region 3) and high specificity/high SNR (region 4). As shown in
Figure 5-5, the majority of the data points resulted from stringent wash are distributed in
areas 1-3, while and the data points from AuNP wash method are primarily accumulated
in area 4, which correspond to high specificity/high SNR.
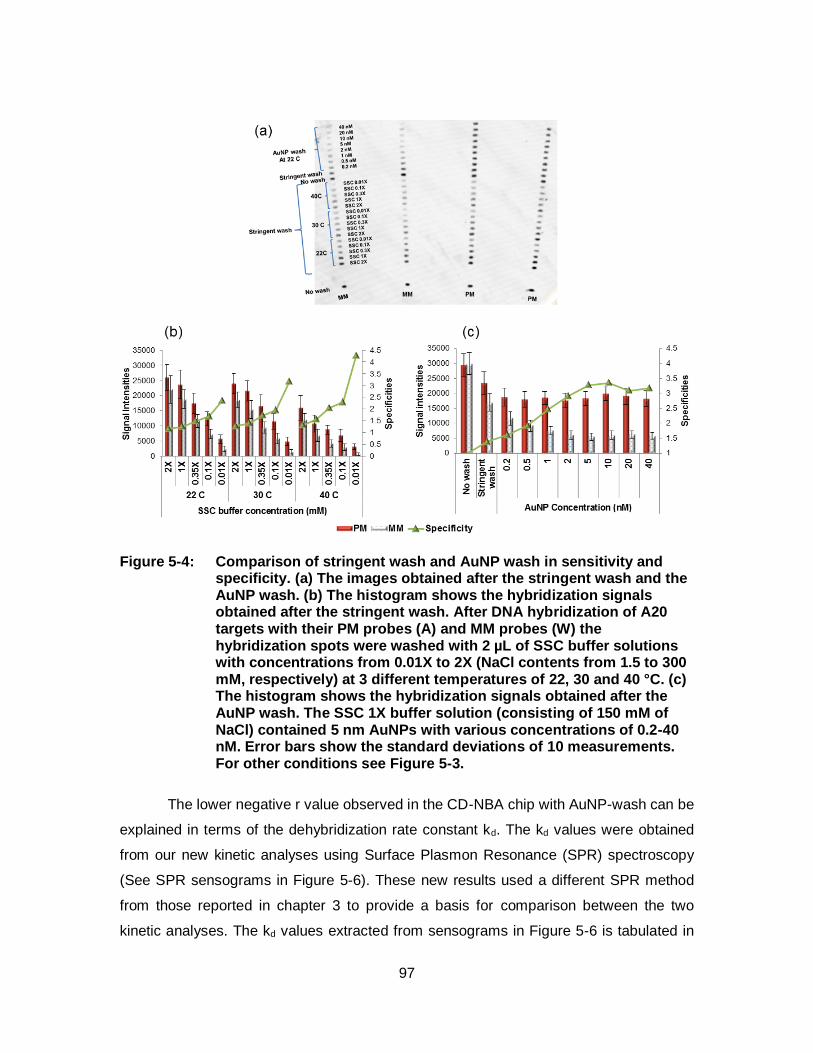
97
Figure 5-4: Comparison of stringent wash and AuNP wash in sensitivity and specificity. (a) The images obtained after the stringent wash and the AuNP wash. (b) The histogram shows the hybridization signals obtained after the stringent wash. After DNA hybridization of A20 targets with their PM probes (A) and MM probes (W) the hybridization spots were washed with 2 µL of SSC buffer solutions with concentrations from 0.01X to 2X (NaCl contents from 1.5 to 300 mM, respectively) at 3 different temperatures of 22, 30 and 40 °C. (c) The histogram shows the hybridization signals obtained after the AuNP wash. The SSC 1X buffer solution (consisting of 150 mM of NaCl) contained 5 nm AuNPs with various concentrations of 0.2-40 nM. Error bars show the standard deviations of 10 measurements. For other conditions see Figure 5-3.
The lower negative r value observed in the CD-NBA chip with AuNP-wash can be
explained in terms of the dehybridization rate constant kd. The kd values were obtained
from our new kinetic analyses using Surface Plasmon Resonance (SPR) spectroscopy
(See SPR sensograms in Figure 5-6). These new results used a different SPR method
from those reported in chapter 3 to provide a basis for comparison between the two
kinetic analyses. The kd values extracted from sensograms in Figure 5-6 is tabulated in
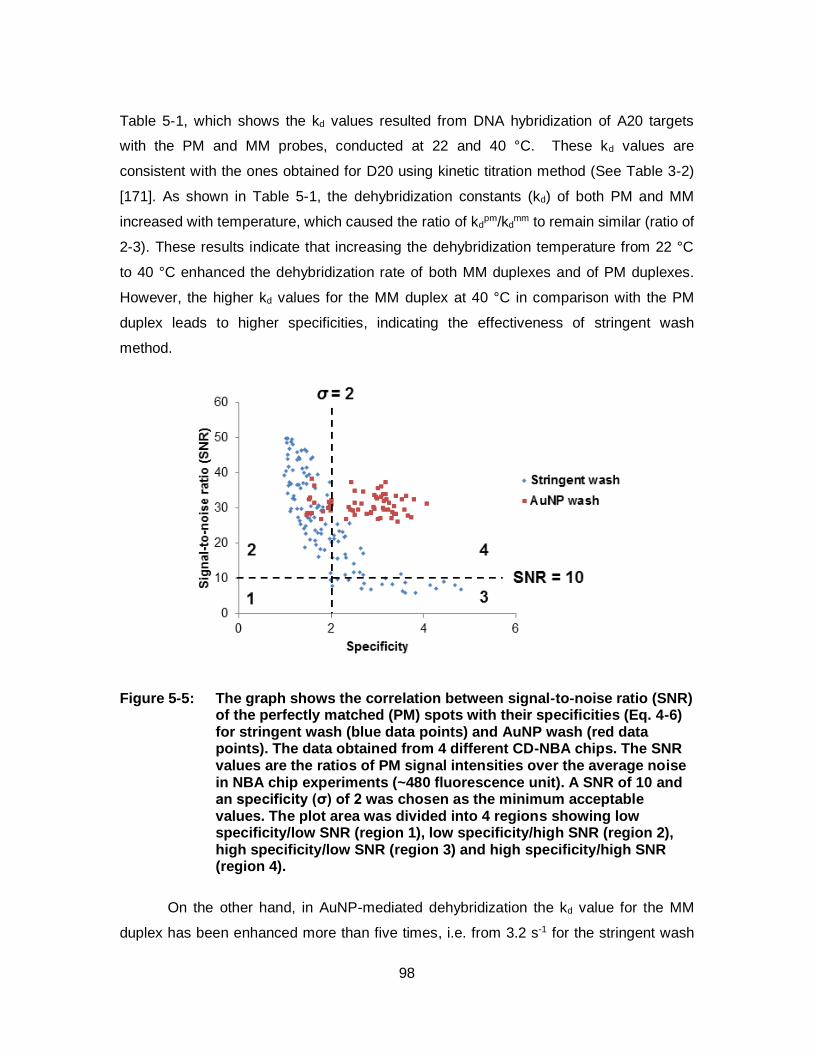
98
Table 5-1, which shows the kd values resulted from DNA hybridization of A20 targets
with the PM and MM probes, conducted at 22 and 40 °C. These kd values are
consistent with the ones obtained for D20 using kinetic titration method (See Table 3-2)
[171]. As shown in Table 5-1, the dehybridization constants (kd) of both PM and MM
increased with temperature, which caused the ratio of kdpm/kd
mm to remain similar (ratio of
2-3). These results indicate that increasing the dehybridization temperature from 22 °C
to 40 °C enhanced the dehybridization rate of both MM duplexes and of PM duplexes.
However, the higher kd values for the MM duplex at 40 °C in comparison with the PM
duplex leads to higher specificities, indicating the effectiveness of stringent wash
method.
Figure 5-5: The graph shows the correlation between signal-to-noise ratio (SNR) of the perfectly matched (PM) spots with their specificities (Eq. 4-6) for stringent wash (blue data points) and AuNP wash (red data points). The data obtained from 4 different CD-NBA chips. The SNR values are the ratios of PM signal intensities over the average noise in NBA chip experiments (~480 fluorescence unit). A SNR of 10 and an specificity (σ) of 2 was chosen as the minimum acceptable values. The plot area was divided into 4 regions showing low specificity/low SNR (region 1), low specificity/high SNR (region 2), high specificity/low SNR (region 3) and high specificity/high SNR (region 4).
On the other hand, in AuNP-mediated dehybridization the kd value for the MM
duplex has been enhanced more than five times, i.e. from 3.2 s-1 for the stringent wash
99
to 15.9 s-1 for the AuNP wash at 22 °C. This observation is attributed to the acceleration
of dehybridization of the MM duplexes by AuNPs. As for PM duplex, the kd value has not
increased much, i.e. from 1.7 s-1 to 3.0 s-1 for stringent wash and AuNP wash,
respectively. Moreover, the kd value for AuNP wash at 22 °C (3.0 s-1) is not increased as
much as in the 40 °C stringent wash (8.1 s-1), and so less PM duplexes were
dehybridized in the AuNP wash conditions. These observations explain our findings in
the CD-NBA chip that the PM signals are not affected as much as the MM counterparts
in the AuNP wash method, resulting in a targeted dehybridization of the MM duplex, but
not of the PM duplex, or preservation of the detection sensitivity.
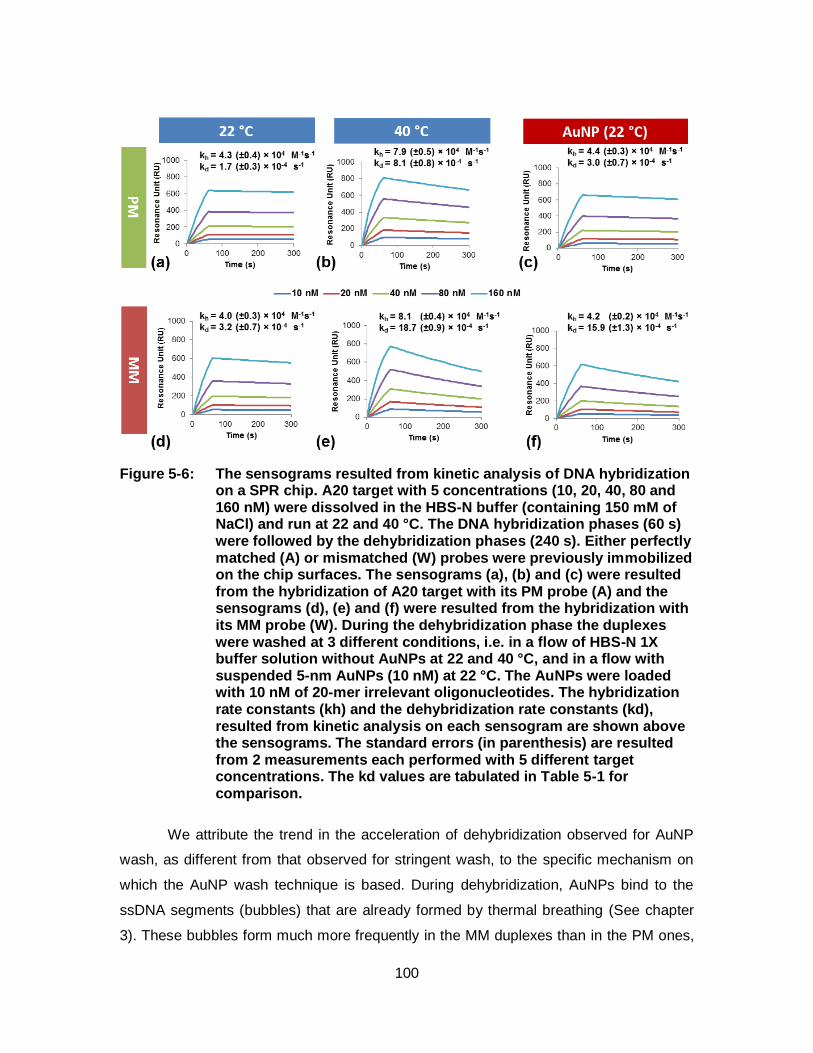
100
Figure 5-6: The sensograms resulted from kinetic analysis of DNA hybridization on a SPR chip. A20 target with 5 concentrations (10, 20, 40, 80 and 160 nM) were dissolved in the HBS-N buffer (containing 150 mM of NaCl) and run at 22 and 40 °C. The DNA hybridization phases (60 s) were followed by the dehybridization phases (240 s). Either perfectly matched (A) or mismatched (W) probes were previously immobilized on the chip surfaces. The sensograms (a), (b) and (c) were resulted from the hybridization of A20 target with its PM probe (A) and the sensograms (d), (e) and (f) were resulted from the hybridization with its MM probe (W). During the dehybridization phase the duplexes were washed at 3 different conditions, i.e. in a flow of HBS-N 1X buffer solution without AuNPs at 22 and 40 °C, and in a flow with suspended 5-nm AuNPs (10 nM) at 22 °C. The AuNPs were loaded with 10 nM of 20-mer irrelevant oligonucleotides. The hybridization rate constants (kh) and the dehybridization rate constants (kd), resulted from kinetic analysis on each sensogram are shown above the sensograms. The standard errors (in parenthesis) are resulted from 2 measurements each performed with 5 different target concentrations. The kd values are tabulated in Table 5-1 for comparison.
We attribute the trend in the acceleration of dehybridization observed for AuNP
wash, as different from that observed for stringent wash, to the specific mechanism on
which the AuNP wash technique is based. During dehybridization, AuNPs bind to the
ssDNA segments (bubbles) that are already formed by thermal breathing (See chapter
3). These bubbles form much more frequently in the MM duplexes than in the PM ones,
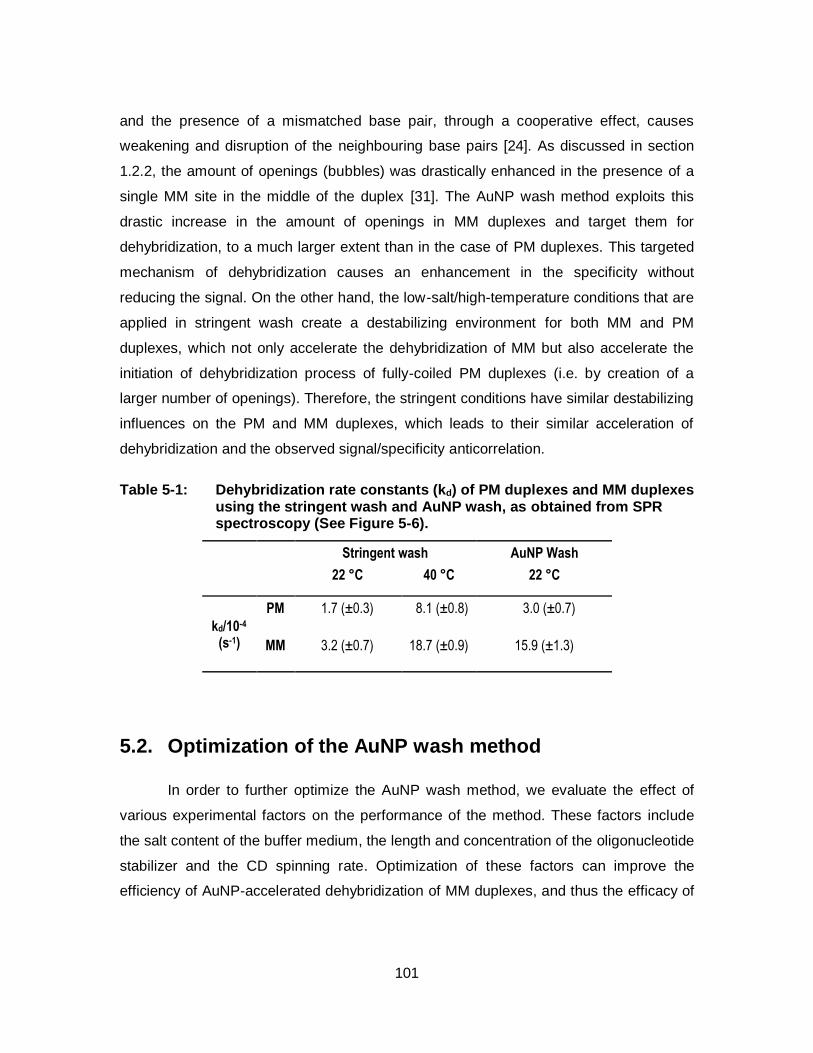
101
and the presence of a mismatched base pair, through a cooperative effect, causes
weakening and disruption of the neighbouring base pairs [24]. As discussed in section
1.2.2, the amount of openings (bubbles) was drastically enhanced in the presence of a
single MM site in the middle of the duplex [31]. The AuNP wash method exploits this
drastic increase in the amount of openings in MM duplexes and target them for
dehybridization, to a much larger extent than in the case of PM duplexes. This targeted
mechanism of dehybridization causes an enhancement in the specificity without
reducing the signal. On the other hand, the low-salt/high-temperature conditions that are
applied in stringent wash create a destabilizing environment for both MM and PM
duplexes, which not only accelerate the dehybridization of MM but also accelerate the
initiation of dehybridization process of fully-coiled PM duplexes (i.e. by creation of a
larger number of openings). Therefore, the stringent conditions have similar destabilizing
influences on the PM and MM duplexes, which leads to their similar acceleration of
dehybridization and the observed signal/specificity anticorrelation.
Table 5-1: Dehybridization rate constants (kd) of PM duplexes and MM duplexes using the stringent wash and AuNP wash, as obtained from SPR spectroscopy (See Figure 5-6).
Stringent wash AuNP Wash
22 °C 40 °C 22 °C
kd/10-4 (s-1)
PM 1.7 (±0.3) 8.1 (±0.8) 3.0 (±0.7)
MM 3.2 (±0.7) 18.7 (±0.9) 15.9 (±1.3)
5.2. Optimization of the AuNP wash method
In order to further optimize the AuNP wash method, we evaluate the effect of
various experimental factors on the performance of the method. These factors include
the salt content of the buffer medium, the length and concentration of the oligonucleotide
stabilizer and the CD spinning rate. Optimization of these factors can improve the
efficiency of AuNP-accelerated dehybridization of MM duplexes, and thus the efficacy of
102
the method. Furthermore, the effect of the purine content in the target sequence on the
specificity obtained from AuNP wash method was also studied.
First, the salt content of the AuNP wash buffer is varied by using different NaCl
concentrations (10-150 mM). The histogram in Figure 5-7(a) shows the hybridization
signals after the stringent wash. As the salt concentration is reduced, the signal
decreases, and the specificity increases. This signal/specificity anticorrelation is
consistent with the results in Figure 5-4(b). The histogram in Figure 5-7(b) shows the
hybridization signals after washing with the buffer solutions containing 5 nM of AuNPs
(5-nm AuNP, 150 mM NaCl). Figure 5-7(b) displays a similar increasing trend for
specificity with reducing salt contents from 150 nM to 90 mM, but a different decreasing
trend at lower salt contents reaching the specificities comparable to the values from
stringent wash from 50 to 10 mM of NaCl. This latter trend indicates that the AuNPs
become ineffective at low salt concentrations. We attribute this ineffectiveness to the low
extent of binding between AuNP surfaces and ssDNA segments of the duplexes
(bubbles) at low salt concentrations. To prove this low rate of binding, we monitor the
kinetics of adsorption of ssDNAs onto the surfaces of AuNPs at different salt
concentrations. This measurement is based on the fact that the emission of the
fluorescently-labelled DNAs is quenched after they bind to the AuNPs. Figure 5-7(c)
shows the kinetic traces of the normalized fluorescence of a 20-mer fluorescently
labelled oligonucleotide (W20) upon mixing with AuNPs at different NaCl concentrations.
The pseudo first-order rate constant of adsorption of oligonucleotides onto the AuNP
surfaces k´a was obtained from the exponential fit of the kinetic data (See Figure 5-7(c)).
The k´a values increase from 1.64 × 10⁻⁴ s-1 at no salt condition to 490 × 10-4 s-1 at 150
mM of NaCl. This increasing trend may be explained by the electrostatic repulsion
between the negatively charged DNA backbone and the citrate-capped surfaces of
AuNPs [90], which is reduced by charge screening at high salt concentrations. Using
these observations on Figure 5-7(c), we can explain the salt-dependency of the AuNP-
accelerated dehybridization, and of the specificities, that are observed in Figure 5-7(b).
The salt content has 2 opposing effects on the specificity of AuNP wash method. First,
an increase in the salt content reduces the stringency and, hence, the specificity (See
Figure 5-7(a)). AuNP wash method share this effect with the stringent wash method.
Second, an increase in the salt content enhances the AuNP-ssDNA binding. This latter
103
effect enhances the effectiveness of AuNP wash method and thus the specificity. The
sharp enhancement in the specificities resulted from the AuNP wash method at NaCl
concentrations of 30 to 70 mM (Figure 5-7(b)), indicates that the second effect (e.g.
enhancement of AuNP-ssDNA binding) prevails at this range of salt content. On the
other hand, at high salt concentrations (90 to 150 mM NaCl), there is a decreasing trend
of specificities, which is similarly observed in AuNP wash (Figure 5-7(b)) and stringent
wash (Figure 5-4(b) and 5-7(a)). This decreasing trend shows that at this range of salt
content, changes in the stringency is more effective than changes in the AuNP-ssDNA
binding effectiveness in improving specificity.
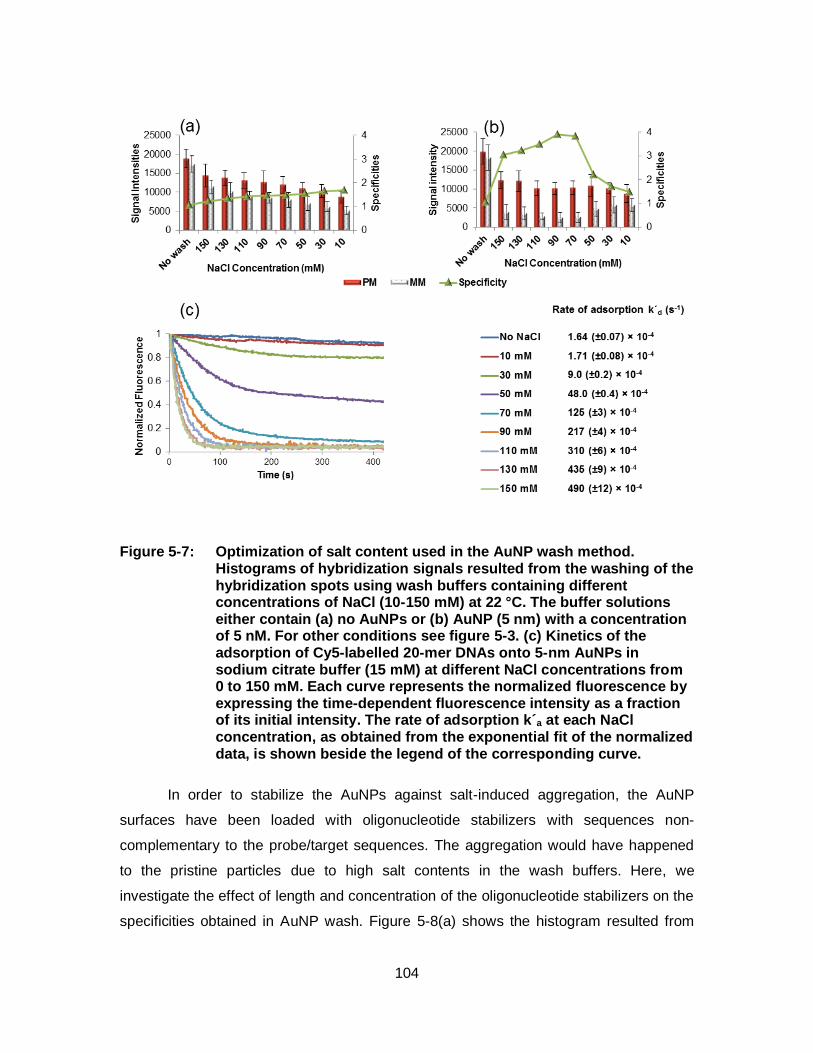
104
Figure 5-7: Optimization of salt content used in the AuNP wash method. Histograms of hybridization signals resulted from the washing of the hybridization spots using wash buffers containing different concentrations of NaCl (10-150 mM) at 22 °C. The buffer solutions either contain (a) no AuNPs or (b) AuNP (5 nm) with a concentration of 5 nM. For other conditions see figure 5-3. (c) Kinetics of the adsorption of Cy5-labelled 20-mer DNAs onto 5-nm AuNPs in sodium citrate buffer (15 mM) at different NaCl concentrations from 0 to 150 mM. Each curve represents the normalized fluorescence by expressing the time-dependent fluorescence intensity as a fraction of its initial intensity. The rate of adsorption k´a at each NaCl concentration, as obtained from the exponential fit of the normalized data, is shown beside the legend of the corresponding curve.
In order to stabilize the AuNPs against salt-induced aggregation, the AuNP
surfaces have been loaded with oligonucleotide stabilizers with sequences non-
complementary to the probe/target sequences. The aggregation would have happened
to the pristine particles due to high salt contents in the wash buffers. Here, we
investigate the effect of length and concentration of the oligonucleotide stabilizers on the
specificities obtained in AuNP wash. Figure 5-8(a) shows the histogram resulted from
105
hybridization signals after the duplexes were washed with solutions containing AuNPs
that have been stabilized with 12-mer and 20-mer of irrelevant oligonucleotides of
different concentrations. It is observed that higher specificities are obtained when shorter
oligonucleotides (12-mer vs. 20-mer) and/or lower concentrations of oligonucleotide are
used. The specificities are higher, maybe because the oligonucleotide stabilizers with
shorter sequence lengths and lower concentrations occupy smaller portions of the AuNP
surfaces and more surfaces are available for binding to the single-stranded segments of
the duplexes. Additionally, since the negative charges of the oligonucleotides add to the
negative charge density on the AuNP surfaces and hinder AuNPs from approaching and
attaching to the duplexes, which are also negatively-charged, oligonucleotide stabilizers
of shorter lengths and lower concentrations will lead to higher efficiencies in AuNP-
accelerated dehybridization, and to higher specificities.
In the CD-NBA chip, the liquid flow is driven by the centrifugal force, and the flow
transports the AuNPs within the spiral channels of the chip and delivers the
nanoparticles to the hybridization regions along the channel. Figure 5-8(b) illustrates a
comparison between the specificities resulted from AuNP wash, under the dynamic flow
condition and under the stop-flow condition. The stop-flow AuNP wash was performed
by incubation of the wash solution in the CD-NBA channels for 15 min. Although this
AuNP wash has resulted in only a slightly higher specificity in comparison with the
corresponding stringent wash (1.8 vs 1.2), the dynamic wash method leads to a much
enhanced specificity (up to 3.9) within similar wash times (i.e. 700 rpm disc rotation
takes about 15 min.). We believe that this enhanced specificity is due to the flow-
mediated convective mass transport in dynamic AuNP wash which is much more
effective than the diffusion-mediated mass transport in stop-flow wash. The former
method leads to higher effectiveness in AuNP-accelerated dehybridization, and hence,
higher specificities. The enhanced mass transport in dynamic flow condition has been
explained in section 4.1.2.
We have also evaluated the robustness of the AuNP wash technique by testing it on
various target strands. We employ 3 sequences related to KRAS gene (A20, A60, W60),
and two sequences related to a fungal pathogen (See Table 2-1). In W20 and A60
targets, the 20 bases of the target that hybridize with the probes are similar to A20
106
except for variations in the type of the mismatch base-pair (C-C base-pair in A20 vs. G-
G in W20) and also in the length of the target (60 bases in A60 vs. 20 bases in A20). As
shown in Figure 5-8(c), these variations do not affect the performance of the technique.
Experiments were also performed using sequences that have been changed from A20 to
B20 and NB20. The strength of binding with gold is known to vary among DNA bases,
and purine bases (A and G) are known to bind more strongly with the gold surface than
pyrimidine bases (C and T) [176]. Since B20 and NB20 targets have lower purine base
contents in their sequences, in comparison with the A20 target (~40% in B20/NB20
targets vs. 60% in A20), we expect to observe lower specificities among these B20 and
NB20 targets. However, as inferred from Figure 5-8(c), the lower purine base content of
B20/NB20 targets do not decrease the specificities. This observation might be due to the
fact that the binding of AuNPs to either the target strand or the probe strand can
accelerate the dehybridization process. Therefore, the weaker binding with its
complementary pyrimidine-rich strand offset the stronger binding between AuNPs and
the purine-rich strand, leading to an insensitivity of the method to the purine content of
the sequence.
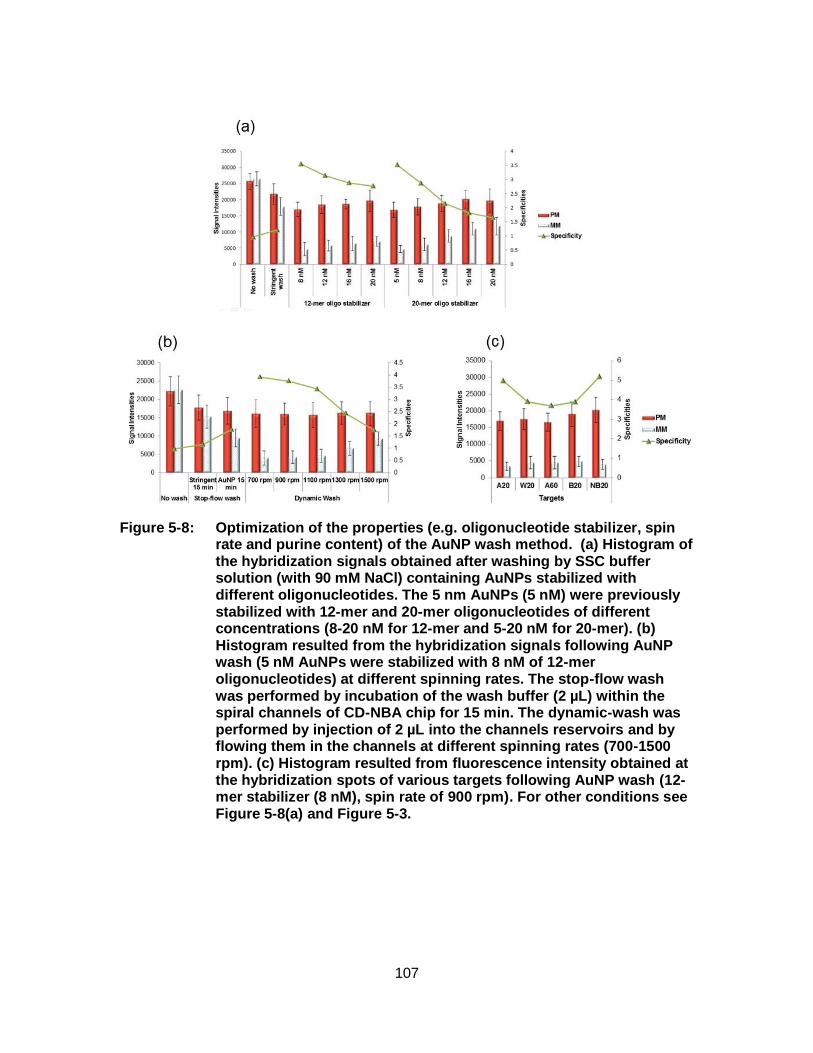
107
Figure 5-8: Optimization of the properties (e.g. oligonucleotide stabilizer, spin rate and purine content) of the AuNP wash method. (a) Histogram of the hybridization signals obtained after washing by SSC buffer solution (with 90 mM NaCl) containing AuNPs stabilized with different oligonucleotides. The 5 nm AuNPs (5 nM) were previously stabilized with 12-mer and 20-mer oligonucleotides of different concentrations (8-20 nM for 12-mer and 5-20 nM for 20-mer). (b) Histogram resulted from the hybridization signals following AuNP wash (5 nM AuNPs were stabilized with 8 nM of 12-mer oligonucleotides) at different spinning rates. The stop-flow wash was performed by incubation of the wash buffer (2 µL) within the spiral channels of CD-NBA chip for 15 min. The dynamic-wash was performed by injection of 2 µL into the channels reservoirs and by flowing them in the channels at different spinning rates (700-1500 rpm). (c) Histogram resulted from fluorescence intensity obtained at the hybridization spots of various targets following AuNP wash (12-mer stabilizer (8 nM), spin rate of 900 rpm). For other conditions see Figure 5-8(a) and Figure 5-3.
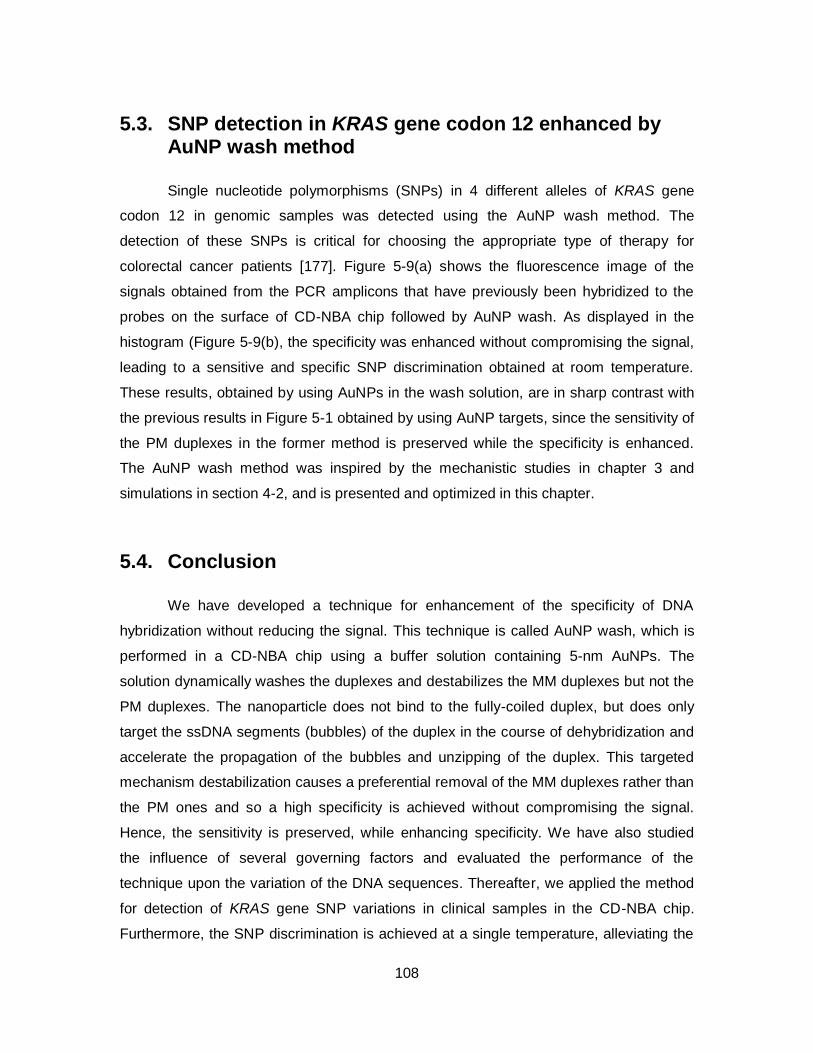
108
5.3. SNP detection in KRAS gene codon 12 enhanced by AuNP wash method
Single nucleotide polymorphisms (SNPs) in 4 different alleles of KRAS gene
codon 12 in genomic samples was detected using the AuNP wash method. The
detection of these SNPs is critical for choosing the appropriate type of therapy for
colorectal cancer patients [177]. Figure 5-9(a) shows the fluorescence image of the
signals obtained from the PCR amplicons that have previously been hybridized to the
probes on the surface of CD-NBA chip followed by AuNP wash. As displayed in the
histogram (Figure 5-9(b), the specificity was enhanced without compromising the signal,
leading to a sensitive and specific SNP discrimination obtained at room temperature.
These results, obtained by using AuNPs in the wash solution, are in sharp contrast with
the previous results in Figure 5-1 obtained by using AuNP targets, since the sensitivity of
the PM duplexes in the former method is preserved while the specificity is enhanced.
The AuNP wash method was inspired by the mechanistic studies in chapter 3 and
simulations in section 4-2, and is presented and optimized in this chapter.
5.4. Conclusion
We have developed a technique for enhancement of the specificity of DNA
hybridization without reducing the signal. This technique is called AuNP wash, which is
performed in a CD-NBA chip using a buffer solution containing 5-nm AuNPs. The
solution dynamically washes the duplexes and destabilizes the MM duplexes but not the
PM duplexes. The nanoparticle does not bind to the fully-coiled duplex, but does only
target the ssDNA segments (bubbles) of the duplex in the course of dehybridization and
accelerate the propagation of the bubbles and unzipping of the duplex. This targeted
mechanism destabilization causes a preferential removal of the MM duplexes rather than
the PM ones and so a high specificity is achieved without compromising the signal.
Hence, the sensitivity is preserved, while enhancing specificity. We have also studied
the influence of several governing factors and evaluated the performance of the
technique upon the variation of the DNA sequences. Thereafter, we applied the method
for detection of KRAS gene SNP variations in clinical samples in the CD-NBA chip.
Furthermore, the SNP discrimination is achieved at a single temperature, alleviating the
109
difficulty of temperature optimization for multiple targets of different melting
temperatures. In contrast to the other attempts to enhance the specificities of DNA
hybridization (e.g. molecular beacons), no complicated design for the DNA probe
sequence is required and specificity is achieved after DNA hybridization via a simple
wash step. This is an advantage which, together with the robustness upon sequence
variation and compatibility with multiplex analyses, makes this technique a promising
tool to be used in DNA hybridization-based microarrays in order to reduce false
positive/false negative results and improve the accuracy of their results.
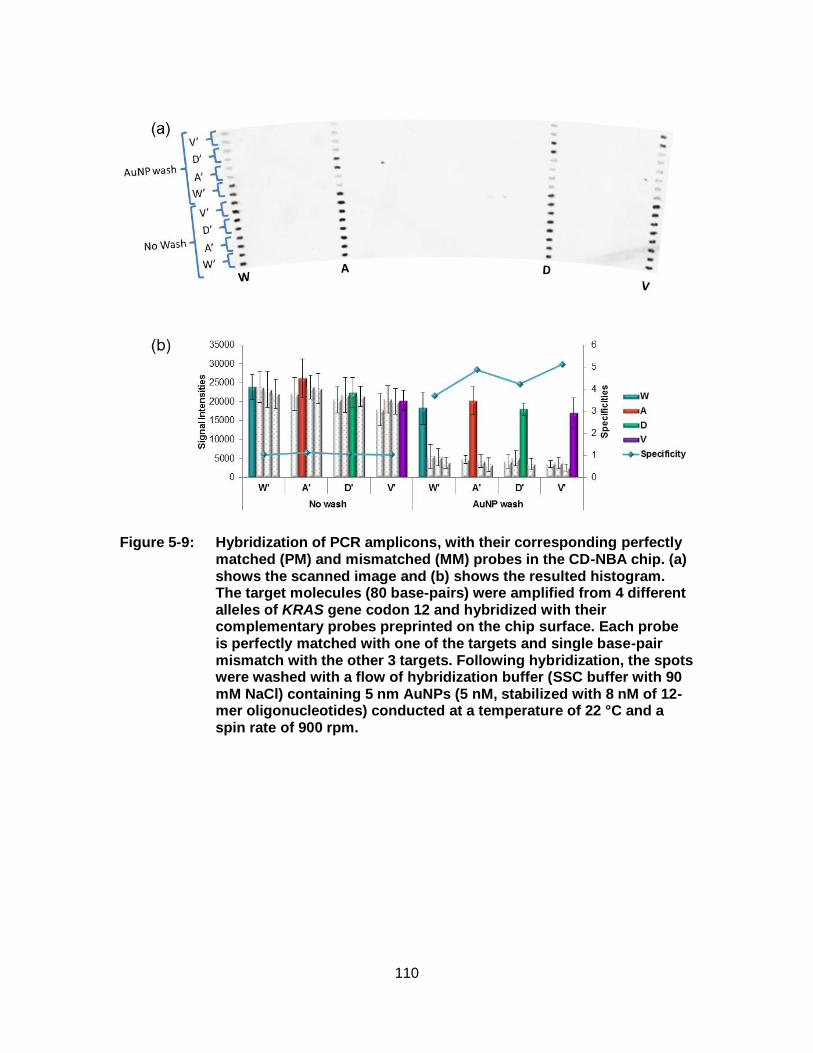
110
Figure 5-9: Hybridization of PCR amplicons, with their corresponding perfectly matched (PM) and mismatched (MM) probes in the CD-NBA chip. (a) shows the scanned image and (b) shows the resulted histogram. The target molecules (80 base-pairs) were amplified from 4 different alleles of KRAS gene codon 12 and hybridized with their complementary probes preprinted on the chip surface. Each probe is perfectly matched with one of the targets and single base-pair mismatch with the other 3 targets. Following hybridization, the spots were washed with a flow of hybridization buffer (SSC buffer with 90 mM NaCl) containing 5 nm AuNPs (5 nM, stabilized with 8 nM of 12-mer oligonucleotides) conducted at a temperature of 22 °C and a spin rate of 900 rpm.
111
Chapter 6. Concluding remarks and future work
The tremendous discoveries in genomics in the last two decades have reformed
our perception of diseases and approaches of healthcare. Effective healthcare to
patients not only requires the knowledge of diagnosis (i.e. What kind of disease?) but
also prognosis (i.e. Will the disease recur?) and prediction (i.e. Will the disease respond
to the treatment?). The answers to these questions are provided on the basis of
particular profiles of biomarkers, usually nucleic acids and proteins, and help the
treatments to be tailored to individual patients. Indeed, future healthcare will increasingly
be geared toward personalized medicine. In this perspective, tests for disease diagnosis
have to move from the centralized laboratories to the clinics at the point of care (POC).
Nucleic acid analysis is the fastest growing component of the molecular
diagnostic market. However, current techniques can only be carried out in centralized
laboratories, but not at the POC settings. Several factors need to be met in order that the
nucleic acid analysis is appropriate for POC tests. Since nucleic acids are present at low
concentrations in complex matrices of biological samples, and in the presence of highly
homologous counterparts (e.g. single nucleotide polymorphisms), POC tests must detect
these biomarkers in a sensitive and specific manner. On the other hand, POC
techniques are envisioned to be carried out in doctor’s office or clinics by medical
professionals (e.g. doctors, nurses) who are not specifically trained to perform the tests.
Therefore, the assays should be fast, portable, robust, low-cost and with high potentials
for parallelism.
With the promise of simplicity and high-throughput potential, DNA microarrays
are appropriate for developing POC techniques. However, further adaptations of
microarrays are required. Current DNA microarray platforms are bulky and require
several steps of operation, and the inherently low specificities originated from DNA
112
hybridization reactions cause discrepancies in the DNA microarray results. In this thesis,
we aimed to use gold nanoparticles (AuNPs) to enhance the specificity of DNA
hybridization in microfluidic microarray chips. While AuNPs have been widely used as
the signal transduction units in biosensing applications, the use of AuNPs to enhance
specificity is rare. Through our kinetic analysis, we discovered that the engagement of
DNA bases with the surfaces of AuNPs shifts the rate limiting step of DNA hybridization
from the mismatch-insensitive nucleation step to the mismatch-sensitive zipping step.
More importantly, we observed that AuNPs were able to target the nonspecific MM
duplexes on the chip surface and destabilize them, without affecting the specific PM
duplexes to a large extent. Based on these discoveries, we developed a microfluidic
microarray technique for SNP detection technique at room temperature that incorporates
a AuNP wash method that enhances the specificity of nucleic acid analyses without
compromising their detection sensitivity.
The results obtained in this thesis can potentially help biosensing technologies to
move toward POC diagnostics. The high specificities resulted from AuNP-assisted SNP
detection can provide the extra robustness and reliability of the results required for POC
diagnostics. Moreover, the AuNP wash method retains the simplicity of the DNA
hybridization assays and is compatible with the highly multiplexed setting of DNA
microarrays. The combination of microfluidic and microarrays considerably reduced the
analysis time from hours to minutes. On the other hand, the centrifugal force used in CD-
NBA chip promises the integration of the whole assay without a need for complex
network of tubings and pumps. The applicability of the technique for clinically relevant
analyses was demonstrated by successful analysis of SNPs in KRAS gene, which has
predictive significance in several cancers such as lung and colorectal cancers.
The developed technique is reliable and fast with high sensitivity and specificity
as well as high potential for integration; however, the NBA technology has to overcome
further challenges to be ready for the detection of nucleic acids at a POC setting. In the
following remarks, some of the challenges in the NBA chip technology for POC testing
are described and some ideas for future work are proposed.
113
6.1. Label-free SNP detection using GO layers
A potential trend for the NBA technology is toward label-free detection of nucleic
acids. Labeling of the target molecules adds complications and cost to the assays. The
efficiency of the labeling process affects the reproducibility of the results. In this regard,
Förster resonance energy transfer (FRET)-based probes can replace the current linear
oligonucleotide probes to be anchored on the surface of the NBA chip. These probes
such as molecular beacon (MB) probes use a pair of fluorophore and quencher and
generate a signal only upon its hybridization to a target strand, eliminating the need for
target labelling [178]. However, the use of MB probes adds to the complexity in probe
design (See section 1.3.2).
In a potential approach, a simple linear labelled probe oligonucleotide can be
anchored on the surface of the NBA chip coated with a top layer of graphene oxide
(GO). This GO layer, which quenches the fluorescence signal of the fluorophore label on
the probe, can be used as the quencher in a FRET-based detection. The interactions
observed between GO layers and ssDNA strands are quite similar to those of AuNP-
ssDNA, i.e. the bases of oligonucleotides bind to GO surfaces [83]. In the proposed
approach, an array of fluorescently-labeled oligonucleotide probes (PM and MM),
anchored on the GO surface is constructed. In the absence of a target, both PM and MM
probes spread on the GO surface, which results in fluorescence quenching [179]. The
fluorescent signal is only enhanced upon DNA hybridization between the target
molecules and the PM probes that causes the probes to stand up from the GO surface.
The involvement of GO-ssDNA interations in this approach can have an extra
advantage to the SNP analysis in the NBA chip. In a similar manner to AuNP targets, the
linear oligonucleotide probes that spread on the GO surface can potentially result in
higher specificities than the regular probes that stand up from the glass surface.
Therefore, the investigation of the effect of GO-ssDNA interactions on the enhancement
of the specificity of DNA hybridization reactions, occurring on GO surfaces, can be
another subject for future studies.
114
6.2. On-chip integration of DNA amplification and detection
In the current setting, the target DNAs have to be amplified prior to analysis on
the NBA chip and this limits the technique for POC applications. A crucial part in the
development of a standalone NBA chip capable of performing the whole nucleic acid
analysis is the on-chip integration of amplification and detection. Polymerase chain
reaction (PCR) is a conventionally used DNA amplification technique that can reliably
amplify even a few copies of the original targets to a detectable level. However, PCR
amplification entails thermal cycling, which adds complications to the required
instrumentation. In contrast, various isothermal amplification techniques that amplify
nucleic acids at a single temperature do not require the use of a thermocycler.
Therefore, there is a great potential to integrate isothermal amplification techniques on
the chip with the microarray detection. In this regard, some isothermal amplification
techniques, such as helicase dependent amplification (HDA) [180], and strand
displacement amplification (SDA) [181], can be considered as appropriate choices
because they possess comparatively simple primer design and also produce short and
linear DNA targets that are appropriate for microarray detection.
In order to keep the high-throughput capacities of the microarray setting, solid-
phase isothermal amplification should be considered. The current HDA and SDA
technologies have some limitations to be used for the solid-phase DNA ampliication and
new developments have to be considered. For instance, the enzymes used in these
isothermal techniques have low processivities and, thus, are not appropriate for the long
DNA strands such as human genomic DNA. A potential solution for this challenge is the
use of restriction enzymes that cut DNA strands at specific points and create short
fragments of DNA [182].
In our technique, we use AuNPs to reduce mispairing between primers and
template and enhance the specificity of SNP detection using HDA amplification. Single-
stranded DNA binding protein (SSB) is used in vivo [183], and in vitro [184], to enhance
the specificity and fidelity of DNA amplification. This enhancement is achieved via the
binding between this protein and ssDNA, but not dsDNA. As described in previous
chapters, this property of SSB is also found in AuNPs. Therefore, we aim to use AuNPs
115
in the HDA reagents to enhance its effect on the specificity of the allele-specific HDA
amplification on the surface of HDA channels.
116
References
1. Ye, S., et al., An efficient procedure for genotyping single nucleotide polymorphisms. Nucleic acids research, 2001. 29(17): p. e88-e88.
2. Kwok, P.-Y. and X. Chen, Detection of single nucleotide polymorphisms. Current issues in molecular biology, 2003. 5: p. 43-60.
3. Allegra, C.J., et al., American Society of Clinical Oncology provisional clinical opinion: testing for KRAS gene mutations in patients with metastatic colorectal carcinoma to predict response to anti–epidermal growth factor receptor monoclonal antibody therapy. Journal of Clinical Oncology, 2009. 27(12): p.
2091-2096.
4. Ng, P.C., et al., An agenda for personalized medicine. Nature, 2009. 461(7265):
p. 724-726.
5. Mamanova, L., et al., Target-enrichment strategies for next-generation sequencing. Nature methods, 2010. 7(2): p. 111-118.
6. Palomino, J.C., Molecular detection, identification and drug resistance detection in Mycobacterium tuberculosis. FEMS Immunology & Medical Microbiology, 2009. 56(2): p. 103-111.
7. Howell, W.M., et al., Dynamic allele-specific hybridization. Nature biotechnology, 1999. 17: p. 87-88.
8. Sibley, C.G. and J.E. Ahlquist, The phylogeny of the hominoid primates, as indicated by DNA-DNA hybridization. Journal of molecular evolution, 1984. 20(1):
p. 2-15.
9. SantaLucia Jr, J. and D. Hicks, The thermodynamics of DNA structural motifs. Annu. Rev. Biophys. Biomol. Struct., 2004. 33: p. 415-440.
10. Klotz, I.M., Chemical Thermodynamics; basic theory and methods. 1964.
11. Wetmur, J.G. and J. Fresco, DNA probes: applications of the principles of nucleic acid hybridization. Critical reviews in biochemistry and molecular biology, 1991. 26(3-4): p. 227-259.
117
12. Ririe, K.M., R.P. Rasmussen, and C.T. Wittwer, Product differentiation by analysis of DNA melting curves during the polymerase chain reaction. Analytical biochemistry, 1997. 245(2): p. 154-160.
13. Vizard, D.L. and A.T. Ansevin, High resolution thermal denaturation of DNA: thermalites of bacteriophage DNA. Biochemistry, 1976. 15(4): p. 741-750.
14. SantaLucia, J., A unified view of polymer, dumbbell, and oligonucleotide DNA nearest-neighbor thermodynamics. Proceedings of the National Academy of Sciences, 1998. 95(4): p. 1460-1465.
15. Chen, C., et al., Influence of secondary structure on kinetics and reaction mechanism of DNA hybridization. Nucleic acids research, 2007. 35(9): p. 2875-
2884.
16. Sibley, C.G., J.E. Ahlquist, and F.H. Sheldon, DNA hybridization and avian phylogenetics, in Evolutionary biology. 1987, Springer. p. 97-125.
17. Pörschke, D. and M. Eigen, Co-operative non-enzymatic base recognition III. Kinetics of the helix—coil transition of the oligoribouridylic· oligoriboadenylic acid system and of oligoriboadenylic acid alone at acidic pH. Journal of molecular biology, 1971. 62(2): p. 361-381.
18. Pörschke, D., O. Uhlenbeck, and F. Martin, Thermodynamics and kinetics of the helix‐coil transition of oligomers containing GC base pairs. Biopolymers, 1973. 12(6): p. 1313-1335.
19. Laidler, K.J. and K.J. Laidler, Chemical kinetics. Vol. 15. 1965: McGraw-Hill New York.
20. Okahata, Y., et al., Kinetic measurements of DNA hybridization on an oligonucleotide-immobilized 27-MHz quartz crystal microbalance. Analytical Chemistry, 1998. 70(7): p. 1288-1296.
21. Studier, F.W., Effects of the conformation of single-stranded DNA on renaturation and aggregation. Journal of molecular biology, 1969. 41(2): p. 199-209.
22. Kearns, D.R. and T.L. James, NMR Studies of Conformational States and Dynamics of DN. Critical Reviews in Biochemistry and Molecular Biology, 1984. 15(3): p. 237-290.
23. Kalosakas, G. and A. Bishop, Charge trapping in DNA due to intrinsic vibrational hot spots. The Journal of chemical physics, 2003. 118(8): p. 3731-3735.
24. Dauxois, T., M. Peyrard, and A. Bishop, Entropy-driven DNA denaturation. Physical Review E, 1993. 47(1): p. R44.
118
25. Ares, S., et al., Bubble nucleation and cooperativity in DNA melting. Physical review letters, 2005. 94(3): p. 035504.
26. Choi, C.H., et al., DNA dynamically directs its own transcription initiation. Nucleic acids research, 2004. 32(4): p. 1584-1590.
27. Laidler, K.J. and M.C. King, Development of transition-state theory. The Journal of physical chemistry, 1983. 87(15): p. 2657-2664.
28. Glazer, M., et al., Kinetics of oligonucleotide hybridization to photolithographically patterned DNA arrays. Analytical biochemistry, 2006. 358(2): p. 225-238.
29. Chu, Y.G. and I. Tinoco, Temperature‐jump kinetics of the dC‐G‐T‐G‐A‐A‐T‐T‐C‐G‐C‐G double helix containing a G· T base pair and the dC‐G‐C‐A‐G‐A‐A‐T‐T‐C‐G‐C‐G double helix containing an extra adenine. Biopolymers, 1983. 22(4): p. 1235-1246.
30. TIBANYENDA, N., et al., The effect of single base‐pair mismatches on the duplex stability of d (T‐A‐T‐T‐A‐A‐T‐A‐T‐C‐A‐A‐G‐T‐T‐G)· d (C‐A‐A‐C‐T‐T‐G‐A‐T‐A‐T‐T‐A‐A‐T‐A). European Journal of Biochemistry, 1984. 139(1): p. 19-27.
31. Zeng, Y. and G. Zocchi, Mismatches and bubbles in DNA. Biophysical journal, 2006. 90(12): p. 4522-4529.
32. Irving, D., P. Gong, and R. Levicky, DNA surface hybridization: comparison of theory and experiment. The Journal of Physical Chemistry B, 2010. 114(22): p.
7631-7640.
33. Gao, Y., L.K. Wolf, and R.M. Georgiadis, Secondary structure effects on DNA hybridization kinetics: a solution versus surface comparison. Nucleic acids research, 2006. 34(11): p. 3370-3377.
34. Henry, M.R., et al., Real-time measurements of DNA hybridization on microparticles with fluorescence resonance energy transfer. Analytical biochemistry, 1999. 276(2): p. 204-214.
35. Peterson, A.W., R.J. Heaton, and R.M. Georgiadis, The effect of surface probe density on DNA hybridization. Nucleic acids research, 2001. 29(24): p. 5163-5168.
36. Heller, M.J., DNA microarray technology: devices, systems, and applications. Annual review of biomedical engineering, 2002. 4(1): p. 129-153.
37. Majtan, T., G. Bukovska, and J. Timko, DNA microarrays—techniques and applications in microbial systems. Folia microbiologica, 2004. 49(6): p. 635-664.
119
38. Fixe, F., et al., Functionalization of poly (methyl methacrylate)(PMMA) as a substrate for DNA microarrays. Nucleic acids research, 2004. 32(1): p. e9-e9.
39. Dolan, P.L., et al., Robust and efficient synthetic method for forming DNA microarrays. Nucleic acids research, 2001. 29(21): p. e107-e107.
40. Hardiman, G., Microarray platforms-comparisons and contrasts. Pharmacogenomics, 2004. 5(5): p. 487-502.
41. Dalma‐Weiszhausz, D.D., et al., [1] The Affymetrix GeneChip® Platform: An Overview. Methods in enzymology, 2006. 410: p. 3-28.
42. Schena, M., et al., Quantitative monitoring of gene expression patterns with a complementary DNA microarray. Science, 1995. 270(5235): p. 467-470.
43. Alizadeh, A.A., et al., Distinct types of diffuse large B-cell lymphoma identified by gene expression profiling. Nature, 2000. 403(6769): p. 503-511.
44. Shaw-Smith, C., et al., Microarray based comparative genomic hybridisation (array-CGH) detects submicroscopic chromosomal deletions and duplications in patients with learning disability/mental retardation and dysmorphic features. Journal of medical genetics, 2004. 41(4): p. 241-248.
45. Jordan, B., Is there a niche for DNA microarrays in molecular diagnostics? Expert review of molecular diagnostics, 2010. 10(7): p. 875-882.
46. Chagovetz, A. and S. Blair, Real-time DNA microarrays: reality check. Biochemical Society Transactions, 2009. 37(Pt 2): p. 471.
47. Michiels, S., S. Koscielny, and C. Hill, Prediction of cancer outcome with microarrays: a multiple random validation strategy. The Lancet, 2005. 365(9458):
p. 488-492.
48. Simon, R., et al., Pitfalls in the use of DNA microarray data for diagnostic and prognostic classification. Journal of the National Cancer Institute, 2003. 95(1): p. 14-18.
49. Brazma, A., et al., Minimum information about a microarray experiment (MIAME)—toward standards for microarray data. Nature genetics, 2001. 29(4): p. 365-371.
50. Chen, J.J., et al., Reproducibility of microarray data: a further analysis of microarray quality control (MAQC) data. BMC bioinformatics, 2007. 8(1): p. 412.
51. Evertsz, E., et al., Research Report Hybridization Cross-Reactivity within Homolo-gous Gene Families on Glass cDNA Microarrays. Biotechniques, 2001. 31(5): p. 1182-1192.
120
52. Miller, N., et al., Cross-hybridization of closely related genes on high-density macroarrays. Biotechniques, 2002. 32(3): p. 620-625.
53. Xu, W., et al., Microarray-based analysis of gene expression in very large gene families: the cytochrome P450 gene superfamily of< i> Arabidopsis thaliana</i>. Gene, 2001. 272(1): p. 61-74.
54. Zhang, J., et al., Detecting false expression signals in high-density oligonucleotide arrays by an in silico approach. Genomics, 2005. 85(3): p. 297-
308.
55. Horne, M., D. Fish, and A. Benight, Statistical thermodynamics and kinetics of DNA multiplex hybridization reactions. Biophysical journal, 2006. 91(11): p. 4133-
4153.
56. Marcelino, L.A., et al., Accurately quantifying low-abundant targets amid similar sequences by revealing hidden correlations in oligonucleotide microarray data. Proceedings of the National Academy of Sciences, 2006. 103(37): p. 13629-
13634.
57. Dorris, D.R., et al., Oligodeoxyribonucleotide probe accessibility on a three-dimensional DNA microarray surface and the effect of hybridization time on the accuracy of expression ratios. BMC biotechnology, 2003. 3(1): p. 6.
58. Jayaraman, A., C.K. Hall, and J. Genzer, Computer simulation study of molecular recognition in model DNA microarrays. Biophysical journal, 2006. 91(6): p. 2227-
2236.
59. Koltai, H. and C. Weingarten-Baror, Specificity of DNA microarray hybridization: characterization, effectors and approaches for data correction. Nucleic acids research, 2008. 36(7): p. 2395-2405.
60. Sorokin, N., et al., Discrimination between perfect and mismatched duplexes with oligonucleotide gel microchips: role of thermodynamic and kinetic effects during hybridization. Journal of Biomolecular Structure and Dynamics, 2005. 22(6): p.
725-734.
61. He, Z., et al., Empirical establishment of oligonucleotide probe design criteria. Applied and environmental microbiology, 2005. 71(7): p. 3753-3760.
62. Zhang, Y., D.A. Hammer, and D.J. Graves, Competitive hybridization kinetics reveals unexpected behavior patterns. Biophysical journal, 2005. 89(5): p. 2950-
2959.
63. Wick, L.M., et al., On-chip non-equilibrium dissociation curves and dissociation rate constants as methods to assess specificity of oligonucleotide probes. Nucleic acids research, 2006. 34(3): p. e26-e26.
121
64. Wittwer, C.T., High‐resolution DNA melting analysis: advancements and limitations. Human mutation, 2009. 30(6): p. 857-859.
65. Knez, K., et al., Emerging technologies for hybridization based single nucleotide polymorphism detection. Analyst, 2014. 139(2): p. 353-370.
66. Kolpashchikov, D.M., Binary malachite green aptamer for fluorescent detection of nucleic acids. Journal of the American Chemical Society, 2005. 127(36): p. 12442-12443.
67. Tyagi, S. and F.R. Kramer, Molecular beacons: probes that fluoresce upon hybridization. Nature biotechnology, 1996(14): p. 303-8.
68. Yurke, B., et al., A DNA-fuelled molecular machine made of DNA. Nature, 2000. 406(6796): p. 605-608.
69. Zhang, Z., et al., A DNA‐Origami Chip Platform for Label‐Free SNP Genotyping Using Toehold‐Mediated Strand Displacement. Small, 2010. 6(17): p. 1854-1858.
70. Krishnan, Y. and F.C. Simmel, Nucleic acid based molecular devices. Angewandte Chemie International Edition, 2011. 50(14): p. 3124-3156.
71. Cornett, E.M., et al., Molecular logic gates for DNA analysis: detection of rifampin resistance in M. tuberculosis DNA. Angewandte Chemie, 2012. 124(36): p. 9209-
9211.
72. Kolpashchikov, D.M., A binary DNA probe for highly specific nucleic acid recognition. Journal of the American Chemical Society, 2006. 128(32): p. 10625-10628.
73. Wang, L. and P.C. Li, Gold nanoparticle-assisted single base-pair mismatch discrimination on a microfluidic microarray device. Biomicrofluidics, 2010. 4(3): p. 032209.
74. Elghanian, R., et al., Selective colorimetric detection of polynucleotides based on the distance-dependent optical properties of gold nanoparticles. Science, 1997. 277(5329): p. 1078-1081.
75. Cheng, Y., et al., Fluorescence near gold nanoparticles for DNA sensing. Analytical chemistry, 2011. 83(4): p. 1307-1314.
76. Daniel, M.-C. and D. Astruc, Gold nanoparticles: assembly, supramolecular chemistry, quantum-size-related properties, and applications toward biology, catalysis, and nanotechnology. Chemical reviews, 2004. 104(1): p. 293-346.
122
77. Park, S.-J., T.A. Taton, and C.A. Mirkin, Array-based electrical detection of DNA with nanoparticle probes. Science, 2002. 295(5559): p. 1503-1506.
78. Rosi, N.L. and C.A. Mirkin, Nanostructures in biodiagnostics. Chemical reviews, 2005. 105(4): p. 1547-1562.
79. Taton, T.A., C.A. Mirkin, and R.L. Letsinger, Scanometric DNA array detection with nanoparticle probes. Science, 2000. 289(5485): p. 1757-1760.
80. Tiwari, P.M., et al., Functionalized gold nanoparticles and their biomedical applications. Nanomaterials, 2011. 1(1): p. 31-63.
81. Zhao, X., R. Tapec-Dytioco, and W. Tan, Ultrasensitive DNA detection using highly fluorescent bioconjugated nanoparticles. Journal of the American Chemical Society, 2003. 125(38): p. 11474-11475.
82. Hayat, M.A., Colloidal gold: principles, methods, and applications. 2012: Elsevier.
83. Liu, J., Adsorption of DNA onto gold nanoparticles and graphene oxide: surface science and applications. Physical Chemistry Chemical Physics, 2012. 14(30): p.
10485-10496.
84. Saha, K., et al., Gold nanoparticles in chemical and biological sensing. Chemical Reviews, 2012. 112(5): p. 2739-2779.
85. Prasad, B., C. Sorensen, and K.J. Klabunde, Gold nanoparticle superlattices. Chemical Society Reviews, 2008. 37(9): p. 1871-1883.
86. Li, H. and L. Rothberg, Colorimetric detection of DNA sequences based on electrostatic interactions with unmodified gold nanoparticles. Proceedings of the National Academy of Sciences of the United States of America, 2004. 101(39): p.
14036-14039.
87. Li, H. and L.J. Rothberg, Label-free colorimetric detection of specific sequences in genomic DNA amplified by the polymerase chain reaction. Journal of the American Chemical Society, 2004. 126(35): p. 10958-10961.
88. Lee, H., et al., Colorimetric genotyping of single nucleotide polymorphism based on selective aggregation of unmodified gold nanoparticles. Biosensors and Bioelectronics, 2010. 26(2): p. 730-735.
89. Nelson, E.M. and L.J. Rothberg, Kinetics and mechanism of single-stranded DNA adsorption onto citrate-stabilized gold nanoparticles in colloidal solution. Langmuir, 2011. 27(5): p. 1770-1777.
90. Zhang, X., M.R. Servos, and J. Liu, Surface science of DNA adsorption onto citrate-capped gold nanoparticles. Langmuir, 2012. 28(8): p. 3896-3902.
123
91. Giese, B. and D. McNaughton, Surface-enhanced Raman spectroscopic and density functional theory study of adenine adsorption to silver surfaces. The Journal of Physical Chemistry B, 2002. 106(1): p. 101-112.
92. Jang, N.H., The coordination chemistry of DNA nucleosides on gold nanoparticles as a probe by SERS. BULLETIN-KOREAN CHEMICAL SOCIETY, 2002. 23(12): p. 1790-1800.
93. Pergolese, B., A. Bonifacio, and A. Bigotto, SERS studies of the adsorption of guanine derivatives on gold colloidal nanoparticles. Physical Chemistry Chemical Physics, 2005. 7(20): p. 3610-3613.
94. Kimura-Suda, H., et al., Base-dependent competitive adsorption of single-stranded DNA on gold. Journal of the American Chemical Society, 2003. 125(30): p. 9014-9015.
95. Li, H., et al., Selective quenching of fluorescence from unbound oligonucleotides by gold nanoparticles as a probe of RNA structure. RNA, 2007. 13(11): p. 2034-
2041.
96. Liang, A., H. Ouyang, and Z. Jiang, Resonance scattering spectral detection of trace ATP based on label-free aptamer reaction and nanogold catalysis. Analyst, 2011. 136(21): p. 4514-4519.
97. Ray, P.C., Diagnostics of Single Base‐Mismatch DNA Hybridization on Gold
Nanoparticles by Using the Hyper‐Rayleigh Scattering Technique. Angewandte Chemie International Edition, 2006. 45(7): p. 1151-1154.
98. Ray, P.C., et al., A gold-nanoparticle-based fluorescence resonance energy transfer probe for multiplexed hybridization detection: accurate identification of bio-agents DNA. Nanotechnology, 2007. 18(37): p. 375504.
99. Tan, Y.N., K.H. Lee, and X. Su, Study of Single-Stranded DNA Binding Protein–Nucleic Acids Interactions using Unmodified Gold Nanoparticles and Its Application for Detection of Single Nucleotide Polymorphisms. Analytical chemistry, 2011. 83(11): p. 4251-4257.
100. Wang, J., et al., A Gold Nanoparticle‐Based Aptamer Target Binding Readout for ATP Assay. Advanced Materials, 2007. 19(22): p. 3943-3946.
101. Wu, Y., et al., Colorimetric and electrochemical study on the interaction between gold nanoparticles and unmodified DNA. Current Nanoscience, 2011. 7(3): p.
359-365.
102. Cho, K., et al., Selective aggregation mechanism of unmodified gold nanoparticles in detection of single nucleotide polymorphism. The Journal of Physical Chemistry C, 2008. 112(23): p. 8629-8633.
124
103. Sandström, P. and B. Åkerman, Electrophoretic properties of DNA-modified colloidal gold nanoparticles. Langmuir, 2004. 20(10): p. 4182-4186.
104. Sandström, P., M. Boncheva, and B. Åkerman, Nonspecific and thiol-specific binding of DNA to gold nanoparticles. Langmuir, 2003. 19(18): p. 7537-7543.
105. Yang, J., et al., Single stranded DNA stabilization and assembly of Au nanoparticles of different sizes. Chemical physics, 2006. 323(2): p. 304-312.
106. Yang, J., et al., Dissociation of double-stranded DNA by small metal nanoparticles. Journal of inorganic biochemistry, 2007. 101(5): p. 824-830.
107. Chen, C., et al., Kinetics and thermodynamics of DNA hybridization on gold nanoparticles. Nucleic acids research, 2009. 37(11): p. 3756-3765.
108. Lagarde, A.E., DNA Microarrays: A Molecular Cloning Manual. American journal of human genetics, 2003. 73(1): p. 218.
109. Campas, M. and I. Katakis, DNA biochip arraying, detection and amplification strategies. TrAC Trends in Analytical Chemistry, 2004. 23(1): p. 49-62.
110. Liu, J., et al., Enhanced signals and fast nucleic acid hybridization by microfluidic chaotic mixing. Angewandte Chemie, 2006. 118(22): p. 3700-3705.
111. Peytavi, R., et al., Microfluidic device for rapid (< 15 min) automated microarray hybridization. Clinical chemistry, 2005. 51(10): p. 1836-1844.
112. Lee, H.J., T.T. Goodrich, and R.M. Corn, SPR imaging measurements of 1-D and 2-D DNA microarrays created from microfluidic channels on gold thin films. Analytical chemistry, 2001. 73(22): p. 5525-5531.
113. Situma, C., et al., Fabrication of DNA microarrays onto poly (methyl methacrylate) with ultraviolet patterning and microfluidics for the detection of low-abundant point mutations. Analytical biochemistry, 2005. 340(1): p. 123-135.
114. Sedighi, A. and P.C. Li, Gold nanoparticle assists SNP detection at room temperature in the nanoBioArray chip. International Journal of Materials Science and Engineering, 2013. 1(1): p. 45-49.
115. Wang, L. and P.C. Li, Flexible microarray construction and fast DNA hybridization conducted on a microfluidic chip for greenhouse plant fungal pathogen detection. Journal of agricultural and food chemistry, 2007. 55(26): p. 10509-10516.
116. Sedighi, A., L. Wang, and P.C. Li, 2D Nanofluidic bioarray for nucleic acid analysis. 2013: Tylor & Fransis, CRC press.
125
117. Lin, H., L. Sun, and R.M. Crooks, Replication of a DNA Microarray. Journal of the American Chemical Society, 2005. 127(32): p. 11210-11211.
118. Gillet, J.P., et al., Evaluation of a low density DNA microarray for small B-cell non-Hodgkin lymphoma differential diagnosis. Leukemia & Lymphoma, 2009. 50(3): p. 410-418.
119. Meneses-Lorente, G., et al., An evaluation of a low-density DNA microarray using cytochrome P450 inducers. Chemical Research in Toxicology, 2003. 16(9):
p. 1070-1077.
120. de Longueville, F., et al., Gene expression profiling of drug metabolism and toxicology markers using a low-density DNA microarray. Biochemical Pharmacology, 2002. 64(1): p. 137-149.
121. Gillet, J.P., et al., Microarray-based detection of multidrug resistance in human tumor cells by expression profiling of ATP-binding cassette transporter genes. Cancer Research, 2004. 64(24): p. 8987-8993.
122. Tejedor, D., et al., Reliable low-density DNA array based on allele-specific probes for detection of 118 mutations causing familial hypercholesterolemia. Clinical Chemistry, 2005. 51(7): p. 1137-1144.
123. Alvarez, P., et al., Transcriptional profiling of hematologic malignancies with a low-density DNA microarray. Clinical Chemistry, 2007. 53(2): p. 259-267.
124. Koch, C.A., P.C.H. Li, and R.S. Utkhede, Evaluation of thin films of agarose on glass for hybridization of DNA to identify plant pathogens with microarray technology. Analytical Biochemistry, 2005. 342(1): p. 93-102.
125. Li, C., et al., Rapid nanoliter DNA hybridization based on reciprocating flow on a compact disk microfluidic device. Analytica chimica acta, 2009. 640(1): p. 93-99.
126. Brøgger, A.L., et al., Centrifugally driven microfluidic disc for detection of chromosomal translocations. Lab on a Chip, 2012. 12(22): p. 4628-4634.
127. Wang, L. and P.C. Li, Microfluidic DNA microarray analysis: A review. Analytica chimica acta, 2011. 687(1): p. 12-27.
128. Wang, L. and P.C. Li, Optimization of a microfluidic microarray device for the fast discrimination of fungal pathogenic DNA. Analytical biochemistry, 2010. 400(2): p. 282-288.
129. Wang, L., et al., Fungal pathogenic nucleic acid detection achieved with a microfluidic microarray device. Analytica chimica acta, 2008. 610(1): p. 97-104.
126
130. Peng, X.Y.L., et al., Spiral microchannels on a CD for DNA hybridizations. Sensors and Actuators B: Chemical, 2007. 128(1): p. 64-69.
131. Wang, L., M.-C. Kropinski, and P.C. Li, Analysis and modeling of flow in rotating spiral microchannels: towards math-aided design of microfluidic systems using centrifugal pumping. Lab on a Chip, 2011. 11(12): p. 2097-2108.
132. Lee, J., Fast Detection of Low Volumes of Mouse Antibodies Using a Nanofluidic Bioarray Chip. 2013, Science: Department of Chemistry.
133. French, D., et al., KRAS mutation detection in colorectal cancer by a commercially available gene chip array compares well with Sanger sequencing. Clinica Chimica Acta, 2011. 412(17): p. 1578-1581.
134. Beebe, D.J., G.A. Mensing, and G.M. Walker, Physics and applications of microfluidics in biology. Annual review of biomedical engineering, 2002. 4(1): p.
261-286.
135. Nguyen, N.-T. and S.T. Wereley, Fundamentals and applications of microfluidics. 2002: Artech House.
136. Becker, H. and C. Gärtner, Polymer microfabrication technologies for microfluidic systems. Analytical and bioanalytical chemistry, 2008. 390(1): p. 89-111.
137. Author, A., Microfluidics in commercial applications; an industry perspective. Lab on a Chip, 2006. 6(9): p. 1118-1121.
138. Anderson, J.R., et al., Fabrication of microfluidic systems in poly (dimethylsiloxane). Electrophoresis, 2000. 21: p. 27-40.
139. Fujii, T., PDMS-based microfluidic devices for biomedical applications. Microelectronic Engineering, 2002. 61: p. 907-914.
140. Qin, D., Y. Xia, and G.M. Whitesides, Soft lithography for micro-and nanoscale patterning. Nature protocols, 2010. 5(3): p. 491-502.
141. Shin, Y., et al., Microfluidic assay for simultaneous culture of multiple cell types on surfaces or within hydrogels. Nature protocols, 2012. 7(7): p. 1247-1259.
142. Sjödin, A., H. Sjöbom, and R. Karlsson, The use of micelles as carriers for immobilization of biomolecules to carboxymethylated dextran surfaces.
143. Karlsson, R., et al., Analyzing a kinetic titration series using affinity biosensors. Analytical biochemistry, 2006. 349(1): p. 136-147.
127
144. Sedighi, A., et al., A Proposed Mechanism of the Influence of Gold Nanoparticles on DNA Hybridization. ACS nano, 2014. 8(7): p. 6765-6777.
145. Berne, B.J. and R. Pecora, Dynamic light scattering: with applications to chemistry, biology, and physics. 2000: Courier Dover Publications.
146. Gotoh, M., et al., A new approach to determine the effect of mismatches on kinetic parameters in DNA hybridization using an optical biosensor. DNA Research, 1995. 2(6): p. 285-293.
147. Ikuta, S., et al., Dissociation kinetics of 19 base paired oligonucleotide-DNA duplexes containing different single mismatched base pairs. Nucleic Acids Research, 1987. 15(2): p. 797-811.
148. Wang, W., et al., Aptamer biosensor for protein detection using gold nanoparticles. Analytical biochemistry, 2008. 373(2): p. 213-219.
149. Di Fiore, F., et al., Clinical relevance of KRAS mutation detection in metastatic colorectal cancer treated by Cetuximab plus chemotherapy. British journal of cancer, 2007. 96(8): p. 1166-1169.
150. Bouchie, A., Shift anticipated in DNA microarray market. Nature biotechnology, 2002. 20(1): p. 8-8.
151. Kim, J.H.-S., et al., Characterization of DNA hybridization kinetics in a microfluidic flow channel. Sensors and Actuators B: Chemical, 2006. 113(1): p.
281-289.
152. Gong, P. and R. Levicky, DNA surface hybridization regimes. Proceedings of the National Academy of Sciences, 2008. 105(14): p. 5301-5306.
153. Bishop, J., S. Blair, and A. Chagovetz, A competitive kinetic model of nucleic acid surface hybridization in the presence of point mutants. Biophysical journal, 2006. 90(3): p. 831-840.
154. Bishop, J., A. Chagovetz, and S. Blair, Kinetics of multiplex hybridization: mechanisms and implications. Biophysical journal, 2008. 94(5): p. 1726-1734.
155. Li, S., A. Pozhitkov, and M. Brouwer, A competitive hybridization model predicts probe signal intensity on high density DNA microarrays. Nucleic acids research, 2008. 36(20): p. 6585-6591.
156. Urakawa, H., et al., Optimization of single-base-pair mismatch discrimination in oligonucleotide microarrays. Applied and environmental microbiology, 2003. 69(5): p. 2848-2856.
128
157. Benn, J.A., et al., Comparative modeling and analysis of microfluidic and conventional DNA microarrays. Analytical biochemistry, 2006. 348(2): p. 284-
293.
158. Bishop, J., S. Blair, and A. Chagovetz, Convective flow effects on DNA biosensors. Biosensors and Bioelectronics, 2007. 22(9): p. 2192-2198.
159. Nagata, M.P.B., et al., Enhanced thermal stability and mismatch discrimination of mutation-carrying DNA duplexes and their kinetic and thermodynamic properties in microchannel laminar flow. Analytical biochemistry, 2009. 390(1): p. 38-45.
160. Roy, B., et al., Effect of fluidic transport on the reaction kinetics in lectin microarrays. Analytica chimica acta, 2011. 701(1): p. 6-14.
161. Wang, L., Microfluidic microarray for pathogenic DNA Analysis: single-base-pair-mismatch discrimination, and modeling/simulation of centrifugal flows and dynamic hybridization. 2012, Science: Department of Chemistry.
162. Stellwagen, E., Y. Lu, and N.C. Stellwagen, Unified description of electrophoresis and diffusion for DNA and other polyions. Biochemistry, 2003. 42(40): p. 11745-
11750.
163. Shchepinov, M., S. Case-Green, and E. Southern, Steric factors influencing hybridisation of nucleic acids to oligonucleotide arrays. Nucleic Acids Research, 1997. 25(6): p. 1155-1161.
164. Pappaert, K. and G. Desmet, A dimensionless number analysis of the hybridization process in diffusion-and convection-driven DNA microarray systems. Journal of biotechnology, 2006. 123(4): p. 381-396.
165. Zinsky, R., et al., Analysis of KRAS mutations of exon 2 codons 12 and 13 by SNaPshot analysis in comparison to common DNA sequencing. Gastroenterology research and practice, 2010. 2010.
166. Sedighi, A. and P.C. Li, Kras gene codon 12 mutation detection enabled by gold nanoparticles conducted in a nanobioarray chip. Analytical biochemistry, 2014. 448: p. 58-64.
167. Maekawa, M., et al., Three-Dimensional Microarray Compared with PCR–Single-Strand Conformation Polymorphism Analysis/DNA Sequencing for Mutation Analysis of K-ras Codons 12 and 13. Clinical chemistry, 2004. 50(8): p. 1322-
1327.
168. Park, J.-H., et al., Oligonucleotide microarray-based mutation detection of the K-ras gene in colorectal cancers with use of competitive DNA hybridization. Clinical chemistry, 2004. 50(9): p. 1688-1691.
129
169. Dai, H., et al., Use of hybridization kinetics for differentiating specific from non‐specific binding to oligonucleotide microarrays. Nucleic Acids Research, 2002. 30(16): p. e86-e86.
170. McCabe, P.C., Production of single-stranded DNA by asymmetric PCR. PCR Protocols: A guide to Methods and Applications, 1990: p. 76-83.
171. Sedighi, A., et al., A Proposed Mechanism of the Influence of Gold Nanoparticles on DNA Hybridization. ACS nano, 2014. 8: p. 6765-6777.
172. Lee Rodgers, J. and W.A. Nicewander, Thirteen ways to look at the correlation coefficient. The American Statistician, 1988. 42(1): p. 59-66.
173. Demidov, V.V. and M.D. Frank-Kamenetskii, Two sides of the coin: affinity and specificity of nucleic acid interactions. Trends in biochemical sciences, 2004. 29(2): p. 62-71.
174. Lomakin, A. and M.D. Frank-Kamenetskii, A theoretical analysis of specificity of nucleic acid interactions with oligonucleotides and peptide nucleic acids (PNAs). Journal of molecular biology, 1998. 276(1): p. 57-70.
175. Poulsen, L., et al., Multi-stringency wash of partially hybridized 60-mer probes reveals that the stringency along the probe decreases with distance from the microarray surface. Nucleic acids research, 2008. 36(20): p. e132-e132.
176. Demers, L.M., et al., Thermal desorption behavior and binding properties of DNA bases and nucleosides on gold. Journal of the American Chemical Society, 2002. 124(38): p. 11248-11249.
177. Parsons, B.L. and M.B. Myers, Personalized cancer treatment and the myth of KRAS wild-type colon tumors. Discovery medicine, 2013. 15(83): p. 259-267.
178. Fang, X., et al., Designing a novel molecular beacon for surface-immobilized DNA hybridization studies. Journal of the American chemical Society, 1999. 121(12): p. 2921-2922.
179. Huang, P.-J.J. and J. Liu, Molecular beacon lighting up on graphene oxide. Analytical chemistry, 2012. 84(9): p. 4192-4198.
180. Vincent, M., Y. Xu, and H. Kong, Helicase‐dependent isothermal DNA amplification. EMBO reports, 2004. 5(8): p. 795-800.
181. Walker, G.T., et al., Strand displacement amplification—an isothermal, in vitro DNA amplification technique. Nucleic acids research, 1992. 20(7): p. 1691-1696.
130
182. Zhou, X., et al., Construction of a SNP-based genetic linkage map in cultivated peanut based on large scale marker development using next-generation double-digest restriction-site-associated DNA sequencing (ddRADseq). BMC genomics, 2014. 15(1): p. 351.
183. Wold, M.S., Replication protein A: a heterotrimeric, single-stranded DNA-binding protein required for eukaryotic DNA metabolism. Annual review of biochemistry, 1997. 66(1): p. 61-92.
184. Chou, Q., Minimizing deletion mutagenesis artifact during Taq DNA polymerase PCR by E. coli SSB. Nucleic acids research, 1992. 20(16): p. 4371.
185. Berthier, J. and P. Silberzan, Microfluidics for biotechnology. 2010: Artech House.
186. Singh, R., J. Nitsche, and S.T. Andreadis, An integrated reaction-transport model for DNA surface hybridization: implications for DNA microarrays. Annals of biomedical engineering, 2009. 37(1): p. 255-269.
131
Appendix A. Simulation of DNA hybridization reaction in the NanoBioArray chip using COMSOL
In this section we provide a step-by-step procedure for simulation of surface DNA hybridization reaction in the microfluidic channels of NanoBioArray (NBA) chip. This procedure is extended from a previous study by Wang et al. [161]. The multiphasic tools created in the COMSOL program was used to obtain the time-dependent concentration profiles due to the mass transfer via convection/diffusion of target molecules in the channel (Figure 4-2(b)). The hybridization reaction between the solution-phased target molecules and the surface-bound probes were simulated by coupling of the bulk and surface geometries through a flux boundary condition at the bottom wall. This protocol was developed based on COMSOL 3.5a. The specific examples of simulated data are given in sections 4.1.2 to 4.1.4.
Construction of channel geometry
In order to obtain the concentration profile of the target molecule within the channel solution and probe-target reaction on the surface, 2 separate geometries must be defined: 2-D for solution geometry and 1-D for surface geometry.
The detailed steps for construction of the geometries are as follows:
1. Open the Model navigator window and in the Multiphysics tab.
2. Click on “add geometry”. Add a 2-D geometry named “Solution” with independent variables of Lx and Hy (See Table A1)
3. Click on “add geometry”. Add a 1-D geometry named “Surface” with an independent variable of Lx.
4. Select the “Solution” in the geometry tabs; from the “Draw/Draw_Objects tab” choose Rectangle/Square. Draw a 10 × 1 dimension rectangle with the lower left corner at the (0, 0) coordinate. The channel we draw has a normalized length (Lx) of 0 to 10 and a normalized height (Hz) of 0 to 1.
5. While in solution geometry, go to “Draw\Specify_Objects\Point” and draw 8 points with Lx coordinates of 3.0, 3.2, 4.0, 4.2, 5.0, 5.2, 6.0 and 6.2 on the lower wall.
6. Go to “Surface” geometry, draw a 10 unit-long line and specify 10 points with Lx coordinates of 0.0, 3.0, 3.2, 4.0, 4.2, 5.0, 5.2, 6.0, 6.2 and 10.
Figure A-1 shows the 1-D and 2-D geometries constructed in COMSOL.

132
Figure A-1: the image shows the 1-D and 2-D geometries constructed in COMSOL.
Physical models
The proper physical models for “Solution” and “Surface” geometries are selected as follow:
7. In the “Solution” geometry tab, Go to “Model Navigator” and select “Chemical_Engineering_Module\ Mass_Transport\ Convection_and_Diffusion\ Transient_Analysis”. Rename the default dependent variable name of the model to “Ct” to represent target concentration (C*) in the “solution” domain and click “add”.
8. In the “Surface” geometry tab, go to “Model Navigator” and select “Chemical_Engineering_Module\Mass_Transport\Diffusion\Transient_Analysis”. Rename the default dependent variable name of the model to “Theta” to represent surface duplex concentration in the “solution” domain and click “add”.
Table A-1: List of independent and dependent variables used in the model.
Variable description
Independent Lx position in x direction
Hy position in y direction
Dependent
u Flow velocity (“u” in Eq. 4-1)
Ct Target concentration in “Solution” domain. ( “C” in Eq. 4-2 divided by c0)
Theta duplex fraction in “Surface” domain. (𝜃𝑝𝑚 𝑎𝑛𝑑 𝜃𝑚𝑚 in Eq. 4-4 and 4-5)
CtS target fracrion in “Surface” domain. ( “C” in Eq. 4-2)
ThetaSol duplex fraction in “Solution” domain. (𝜃𝑝𝑚 𝑎𝑛𝑑 𝜃𝑚𝑚 in Eq. 4-4 and 4-5)
133
Coupling the 2-D and 1-D domains
In order to couple the “Solution” and “Surface” domains, “Ct” in the former is redefined in the latter as “CtS”, to represent the concentration of target molecules at the solution-surface interface. In a similar way the variable “Theta” in the “Surface” domain is redefined in the “Solution” domain as “ThetaSol” to represent the concentration of target molecules at the interface.
9. Go to “Solution” geometry tab, select “Options\Extrusion_Coupling_Variables\ Boundary_Variables”. Choose the lower wall that is the boundary to “Surface geometry and input “CtS = Ct”. In the “destination” and “origin” tabs, select “Surface” and “Solution” geometries as the destination and source, respectively. Under the “Source Vertices” tab, select all the vertices that correspond to “Surface” geometry and under the “Destination” select all 1-D vertices.
10. Repeat step 9 in “Surface” geometry and input “ThetaSol = Theta” to couple the duplex concentration at the solution-surface interface between the Solution” and Surface” domains.
Definition of parameters
A series of parameters such as constants and variables were used in our model. These values were either obtained from experimental data or extracted from the literature. From these values the non-dimensionalized parameters are also calculated. Moreover, various governing equations are used as expressions in the model. These parameters and expressions are entered in the COMSOL program as Constants, Global Expressions, Scalar Expressions and Subdomain Expressions.
11. In the “Options/Constants” enter the global constants as follow:
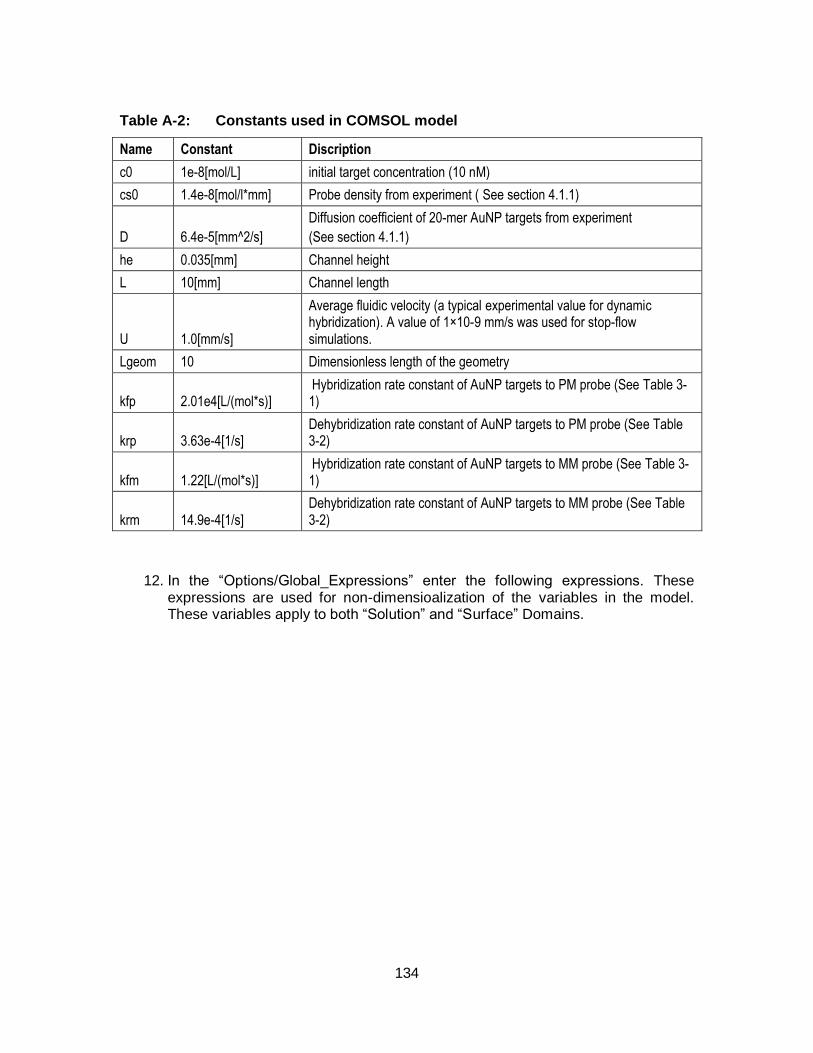
134
Table A-2: Constants used in COMSOL model
Name Constant Discription
c0 1e-8[mol/L] initial target concentration (10 nM)
cs0 1.4e-8[mol/l*mm] Probe density from experiment ( See section 4.1.1)
D 6.4e-5[mm^2/s]
Diffusion coefficient of 20-mer AuNP targets from experiment
(See section 4.1.1)
he 0.035[mm] Channel height
L 10[mm] Channel length
U 1.0[mm/s]
Average fluidic velocity (a typical experimental value for dynamic hybridization). A value of 1×10⁻⁹ mm/s was used for stop-flow simulations.
Lgeom 10 Dimensionless length of the geometry
kfp 2.01e4[L/(mol*s)] Hybridization rate constant of AuNP targets to PM probe (See Table 3-1)
krp 3.63e-4[1/s] Dehybridization rate constant of AuNP targets to PM probe (See Table 3-2)
kfm 1.22[L/(mol*s)] Hybridization rate constant of AuNP targets to MM probe (See Table 3-1)
krm 14.9e-4[1/s] Dehybridization rate constant of AuNP targets to MM probe (See Table 3-2)
12. In the “Options/Global_Expressions” enter the following expressions. These expressions are used for non-dimensioalization of the variables in the model. These variables apply to both “Solution” and “Surface” Domains.
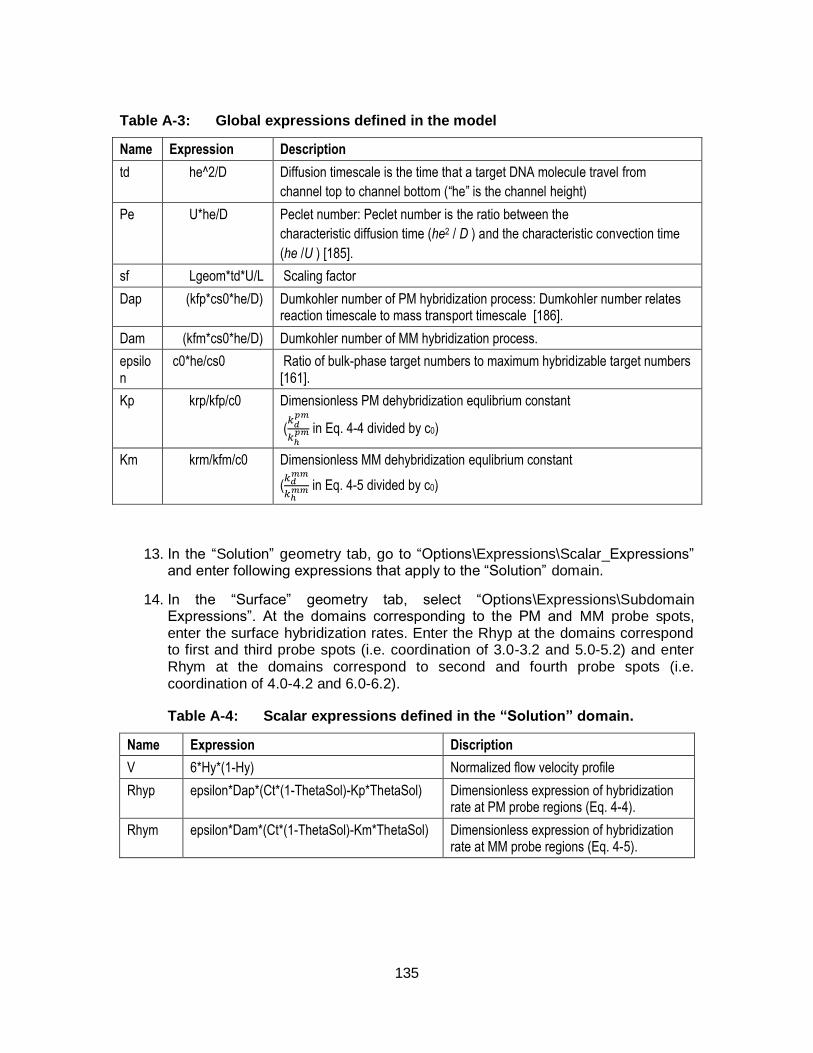
135
Table A-3: Global expressions defined in the model
Name Expression Description
td he^2/D Diffusion timescale is the time that a target DNA molecule travel from
channel top to channel bottom (“he” is the channel height)
Pe U*he/D Peclet number: Peclet number is the ratio between the
characteristic diffusion time (he2 / D ) and the characteristic convection time
(he /U ) [185].
sf Lgeom*td*U/L Scaling factor
Dap (kfp*cs0*he/D) Dumkohler number of PM hybridization process: Dumkohler number relates reaction timescale to mass transport timescale [186].
Dam (kfm*cs0*he/D) Dumkohler number of MM hybridization process.
epsilon
c0*he/cs0 Ratio of bulk-phase target numbers to maximum hybridizable target numbers [161].
Kp krp/kfp/c0 Dimensionless PM dehybridization equlibrium constant
(𝑘𝑑𝑝𝑚
𝑘ℎ𝑝𝑚 in Eq. 4-4 divided by c0)
Km krm/kfm/c0 Dimensionless MM dehybridization equlibrium constant
(𝑘𝑑𝑚𝑚
𝑘ℎ𝑚𝑚 in Eq. 4-5 divided by c0)
13. In the “Solution” geometry tab, go to “Options\Expressions\Scalar_Expressions” and enter following expressions that apply to the “Solution” domain.
14. In the “Surface” geometry tab, select “Options\Expressions\Subdomain Expressions”. At the domains corresponding to the PM and MM probe spots, enter the surface hybridization rates. Enter the Rhyp at the domains correspond to first and third probe spots (i.e. coordination of 3.0-3.2 and 5.0-5.2) and enter Rhym at the domains correspond to second and fourth probe spots (i.e. coordination of 4.0-4.2 and 6.0-6.2).
Table A-4: Scalar expressions defined in the “Solution” domain.
Name Expression Discription
V 6*Hy*(1-Hy) Normalized flow velocity profile
Rhyp epsilon*Dap*(Ct*(1-ThetaSol)-Kp*ThetaSol) Dimensionless expression of hybridization rate at PM probe regions (Eq. 4-4).
Rhym epsilon*Dam*(Ct*(1-ThetaSol)-Km*ThetaSol) Dimensionless expression of hybridization rate at MM probe regions (Eq. 4-5).
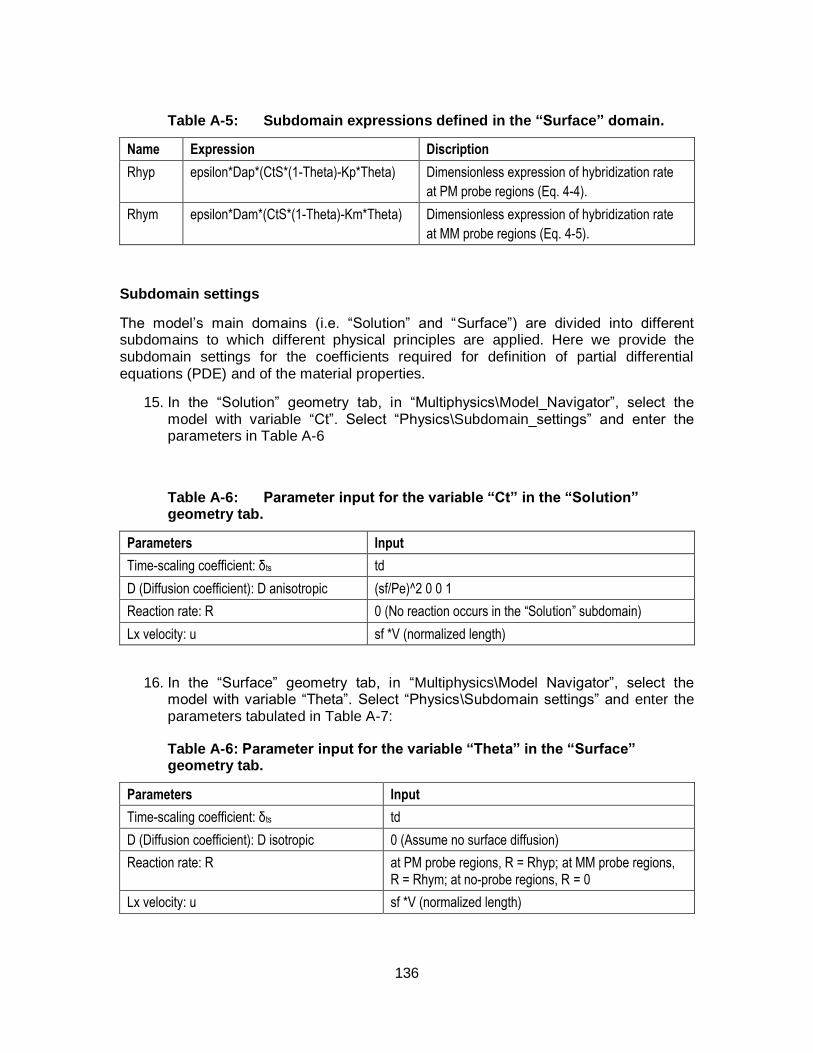
136
Table A-5: Subdomain expressions defined in the “Surface” domain.
Name Expression Discription
Rhyp epsilon*Dap*(CtS*(1-Theta)-Kp*Theta) Dimensionless expression of hybridization rate
at PM probe regions (Eq. 4-4).
Rhym epsilon*Dam*(CtS*(1-Theta)-Km*Theta) Dimensionless expression of hybridization rate
at MM probe regions (Eq. 4-5).
Subdomain settings
The model’s main domains (i.e. “Solution” and “Surface”) are divided into different subdomains to which different physical principles are applied. Here we provide the subdomain settings for the coefficients required for definition of partial differential equations (PDE) and of the material properties.
15. In the “Solution” geometry tab, in “Multiphysics\Model_Navigator”, select the model with variable “Ct”. Select “Physics\Subdomain_settings” and enter the parameters in Table A-6
Table A-6: Parameter input for the variable “Ct” in the “Solution” geometry tab.
Parameters Input
Time-scaling coefficient: δts td
D (Diffusion coefficient): D anisotropic (sf/Pe)^2 0 0 1
Reaction rate: R 0 (No reaction occurs in the “Solution” subdomain)
Lx velocity: u sf *V (normalized length)
16. In the “Surface” geometry tab, in “Multiphysics\Model Navigator”, select the model with variable “Theta”. Select “Physics\Subdomain settings” and enter the parameters tabulated in Table A-7:
Table A-6: Parameter input for the variable “Theta” in the “Surface” geometry tab.
Parameters Input
Time-scaling coefficient: δts td
D (Diffusion coefficient): D isotropic 0 (Assume no surface diffusion)
Reaction rate: R at PM probe regions, R = Rhyp; at MM probe regions, R = Rhym; at no-probe regions, R = 0
Lx velocity: u sf *V (normalized length)

137
Boundary settings
The settings at different phase boundaries are as follows:
17. In “Physics\boundary_settings enter the following boundary conditions for “Ct” and “Theta”. For “Ct” in “Solution” geometry tab, and for “Theta“ in “Surface” geometry tab, enter the values tabulated in Table A-8.
Table A-6: Boundary Settings for the variables “Ct” and “Theta”.
Parameters Input
boundary (inlet) concentration c0= 1
For variable “Ct”
In “Solution” geometry tab
boundary (upper wall) flux = 0
boundary (lower wall at PM probe regions)
flux= -Rhyp/epsilon
boundary (lower wall at MM probe regions)
flux= -Rhym/epsilon
boundary (lower wall without probe) flux= 0
boundary (outlet) convective flux
For variable “Theta”
in “Surface” geometry tab
boundary (left vertex): flux=0
boundary (right vertex) flux=0
Meshing
Meshing is partitioning of the domain into small finite elements to resolve the spatial distribution of the analyte at the entire domain. The finer the mesh size, the more computation memory will be required. Indeed, some memory will be saved if the mesh sizes can be finer at the surface and be coarser in the channel solution phase.
18. In the “Solution” geometry tab, Select “Mesh/Mesh_Parameters” and enter the following,
- In the subdomain tab: enter a maximum element size of 0.05
- In the boundary tab: enter a maximum element size of 0.005 along the walls where the reactions happen.
19. In the “Surface” geometry tab, Select “Mesh/Mesh Parameters” and enter the following,
- In the subdomain tab: enter a maximum element size of 0.004 (a different value from 0.005 was used to avoid computational noise in the simulation results [161]).
Solver Parameters and Post processing
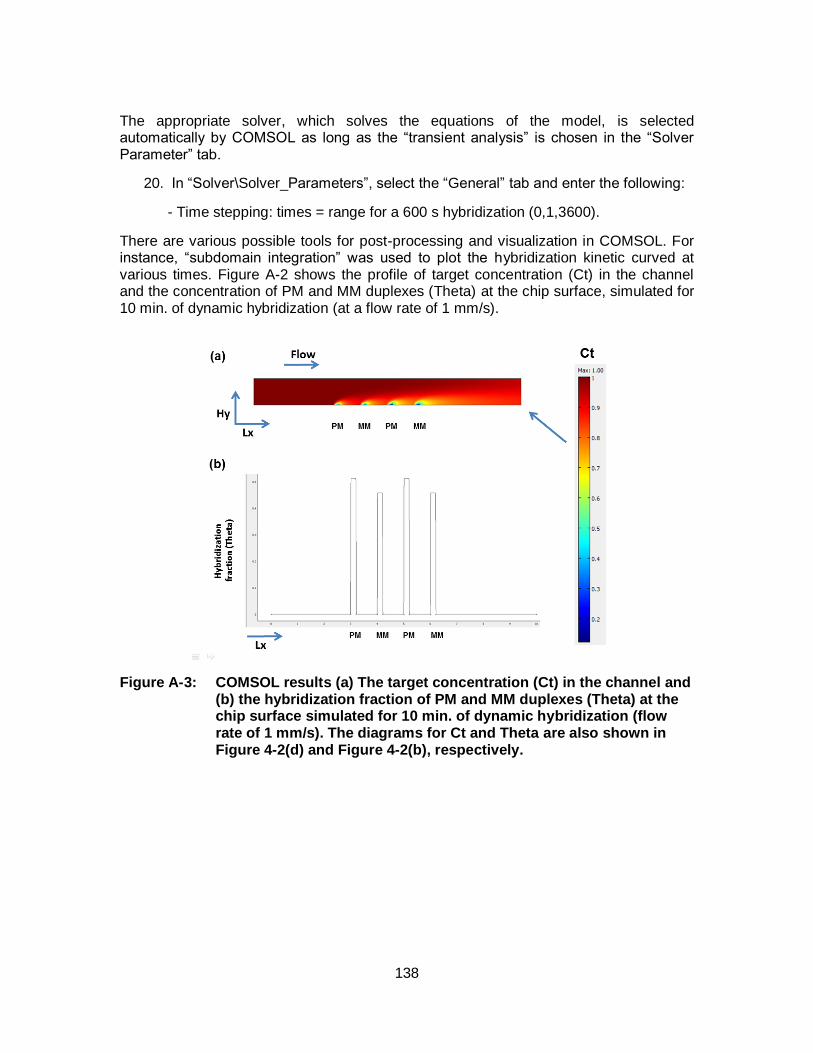
138
The appropriate solver, which solves the equations of the model, is selected automatically by COMSOL as long as the “transient analysis” is chosen in the “Solver Parameter” tab.
20. In “Solver\Solver_Parameters”, select the “General” tab and enter the following:
- Time stepping: times = range for a 600 s hybridization (0,1,3600).
There are various possible tools for post-processing and visualization in COMSOL. For instance, “subdomain integration” was used to plot the hybridization kinetic curved at various times. Figure A-2 shows the profile of target concentration (Ct) in the channel and the concentration of PM and MM duplexes (Theta) at the chip surface, simulated for 10 min. of dynamic hybridization (at a flow rate of 1 mm/s).
Figure A-3: COMSOL results (a) The target concentration (Ct) in the channel and (b) the hybridization fraction of PM and MM duplexes (Theta) at the chip surface simulated for 10 min. of dynamic hybridization (flow rate of 1 mm/s). The diagrams for Ct and Theta are also shown in Figure 4-2(d) and Figure 4-2(b), respectively.
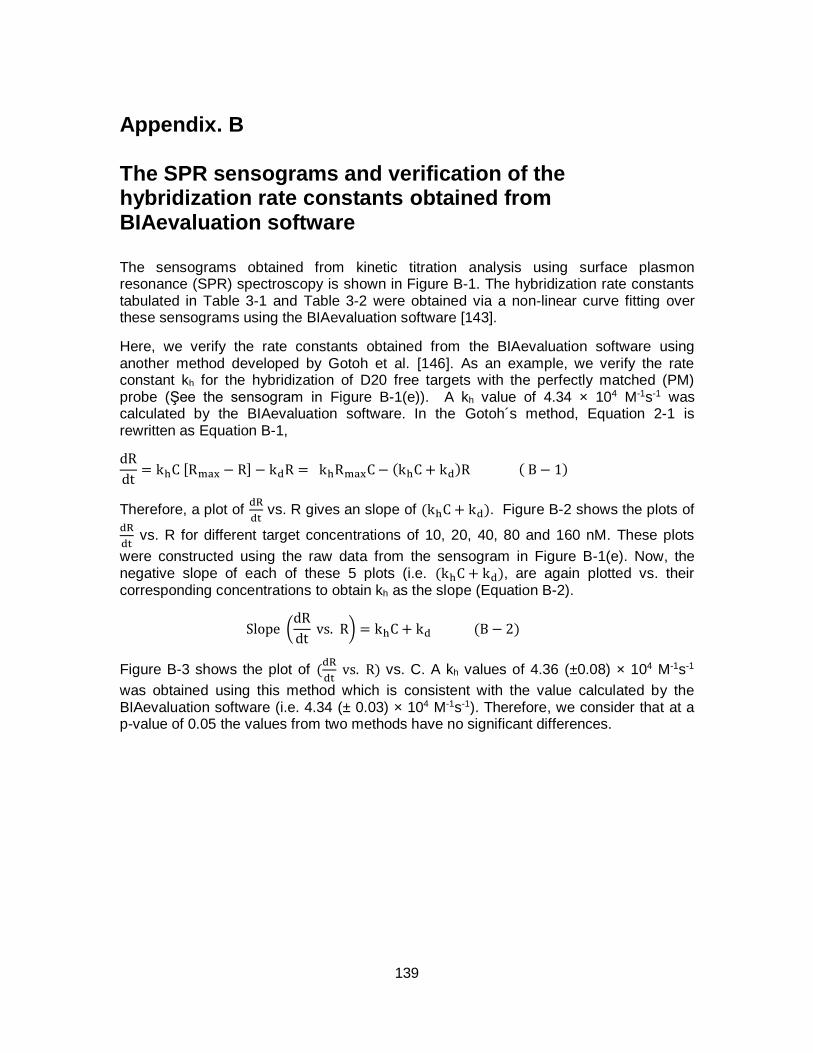
139
Appendix. B The SPR sensograms and verification of the hybridization rate constants obtained from BIAevaluation software
The sensograms obtained from kinetic titration analysis using surface plasmon resonance (SPR) spectroscopy is shown in Figure B-1. The hybridization rate constants tabulated in Table 3-1 and Table 3-2 were obtained via a non-linear curve fitting over these sensograms using the BIAevaluation software [143].
Here, we verify the rate constants obtained from the BIAevaluation software using another method developed by Gotoh et al. [146]. As an example, we verify the rate constant kh for the hybridization of D20 free targets with the perfectly matched (PM) probe (Şee the sensogram in Figure B-1(e)). A kh value of 4.34 × 10⁴ M-1s-1 was calculated by the BIAevaluation software. In the Gotoh´s method, Equation 2-1 is rewritten as Equation B-1,
dR
dt= khC [Rmax − R] − kdR = khRmaxC− (khC + kd)R ( B − 1)
Therefore, a plot of dR
dt vs. R gives an slope of (khC + kd). Figure B-2 shows the plots of
dR
dt vs. R for different target concentrations of 10, 20, 40, 80 and 160 nM. These plots
were constructed using the raw data from the sensogram in Figure B-1(e). Now, the negative slope of each of these 5 plots (i.e. (khC + kd), are again plotted vs. their corresponding concentrations to obtain kh as the slope (Equation B-2).
Slope (dR
dt vs. R) = khC + kd (B − 2)
Figure B-3 shows the plot of (dR
dt vs. R) vs. C. A kh values of 4.36 (±0.08) × 104 M-1s-1
was obtained using this method which is consistent with the value calculated by the BIAevaluation software (i.e. 4.34 (± 0.03) × 104 M-1s-1). Therefore, we consider that at a p-value of 0.05 the values from two methods have no significant differences.
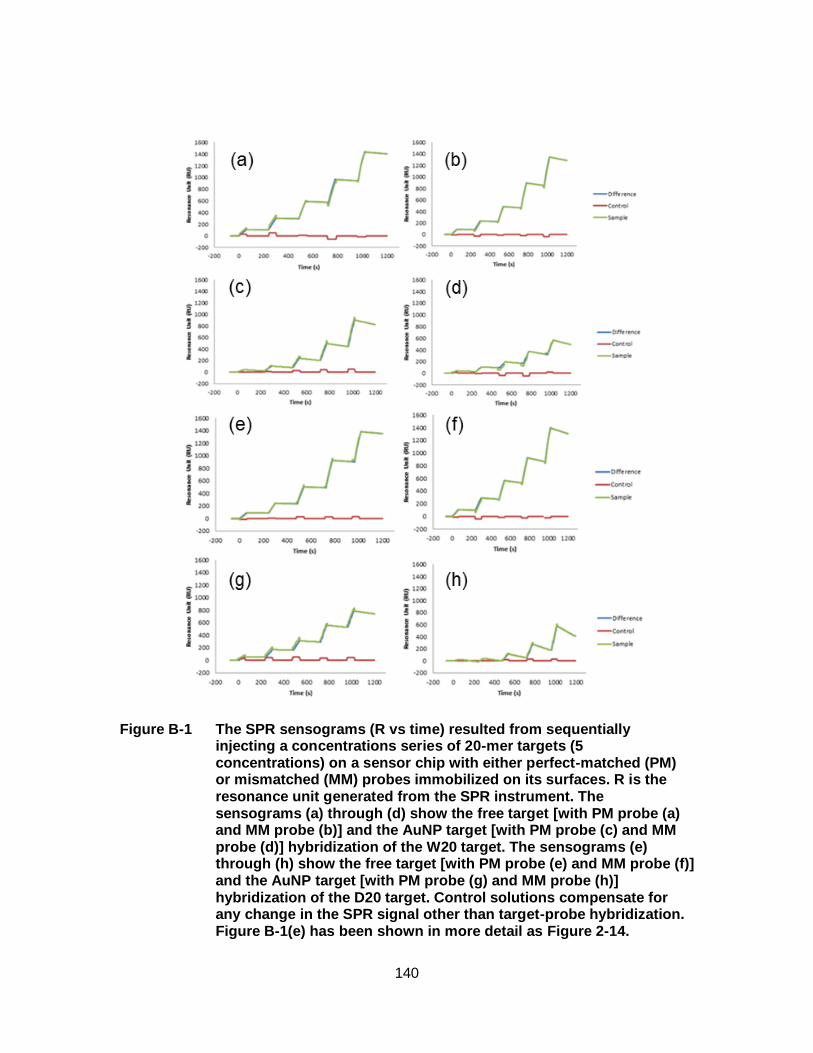
140
Figure B-1 The SPR sensograms (R vs time) resulted from sequentially injecting a concentrations series of 20-mer targets (5 concentrations) on a sensor chip with either perfect-matched (PM) or mismatched (MM) probes immobilized on its surfaces. R is the resonance unit generated from the SPR instrument. The sensograms (a) through (d) show the free target [with PM probe (a) and MM probe (b)] and the AuNP target [with PM probe (c) and MM probe (d)] hybridization of the W20 target. The sensograms (e) through (h) show the free target [with PM probe (e) and MM probe (f)] and the AuNP target [with PM probe (g) and MM probe (h)] hybridization of the D20 target. Control solutions compensate for any change in the SPR signal other than target-probe hybridization. Figure B-1(e) has been shown in more detail as Figure 2-14.
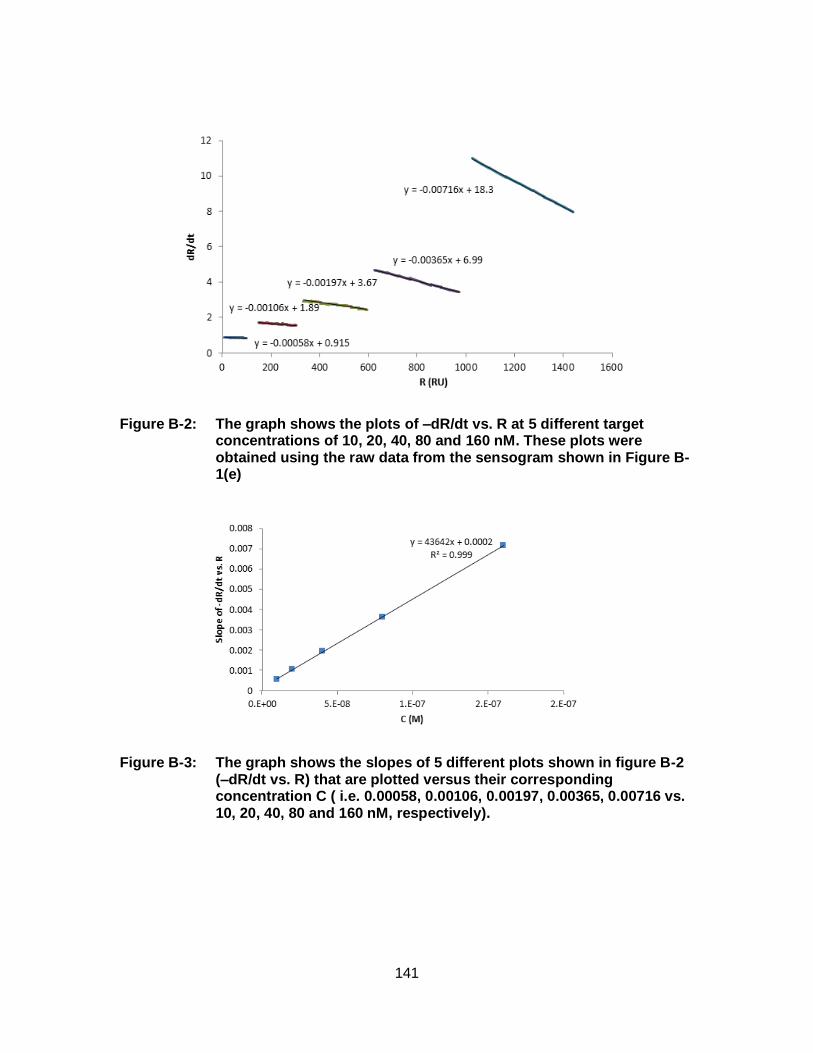
141
Figure B-2: The graph shows the plots of –dR/dt vs. R at 5 different target concentrations of 10, 20, 40, 80 and 160 nM. These plots were obtained using the raw data from the sensogram shown in Figure B-1(e)
Figure B-3: The graph shows the slopes of 5 different plots shown in figure B-2 (–dR/dt vs. R) that are plotted versus their corresponding concentration C ( i.e. 0.00058, 0.00106, 0.00197, 0.00365, 0.00716 vs. 10, 20, 40, 80 and 160 nM, respectively).
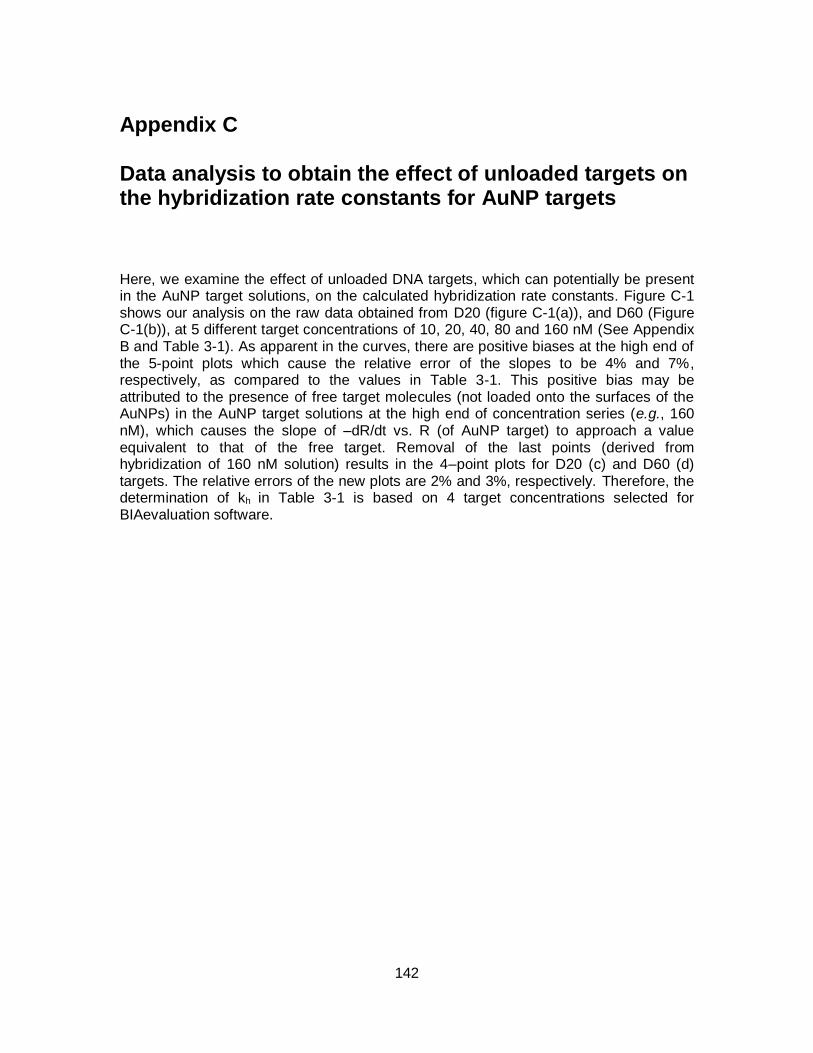
142
Appendix C Data analysis to obtain the effect of unloaded targets on the hybridization rate constants for AuNP targets
Here, we examine the effect of unloaded DNA targets, which can potentially be present in the AuNP target solutions, on the calculated hybridization rate constants. Figure C-1 shows our analysis on the raw data obtained from D20 (figure C-1(a)), and D60 (Figure C-1(b)), at 5 different target concentrations of 10, 20, 40, 80 and 160 nM (See Appendix B and Table 3-1). As apparent in the curves, there are positive biases at the high end of the 5-point plots which cause the relative error of the slopes to be 4% and 7%, respectively, as compared to the values in Table 3-1. This positive bias may be attributed to the presence of free target molecules (not loaded onto the surfaces of the AuNPs) in the AuNP target solutions at the high end of concentration series (e.g., 160 nM), which causes the slope of –dR/dt vs. R (of AuNP target) to approach a value equivalent to that of the free target. Removal of the last points (derived from hybridization of 160 nM solution) results in the 4–point plots for D20 (c) and D60 (d) targets. The relative errors of the new plots are 2% and 3%, respectively. Therefore, the determination of kh in Table 3-1 is based on 4 target concentrations selected for BIAevaluation software.
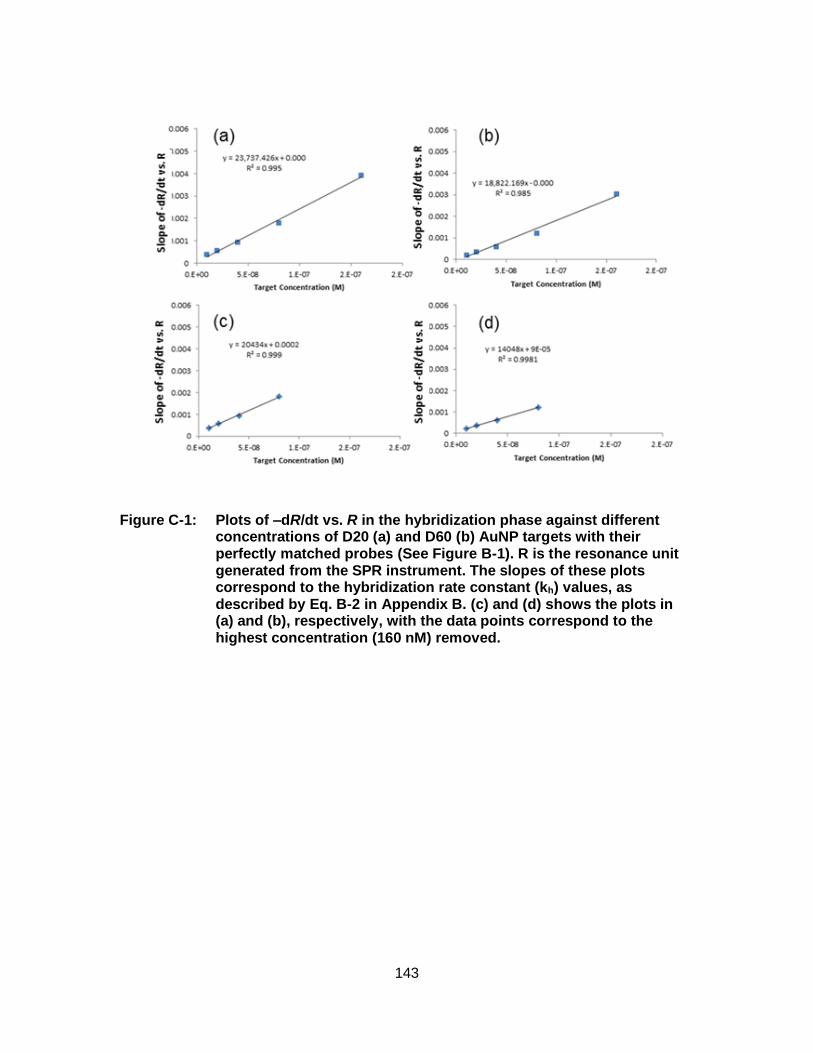
143
Figure C-1: Plots of –dR/dt vs. R in the hybridization phase against different concentrations of D20 (a) and D60 (b) AuNP targets with their perfectly matched probes (See Figure B-1). R is the resonance unit generated from the SPR instrument. The slopes of these plots correspond to the hybridization rate constant (kh) values, as described by Eq. B-2 in Appendix B. (c) and (d) shows the plots in (a) and (b), respectively, with the data points correspond to the highest concentration (160 nM) removed.
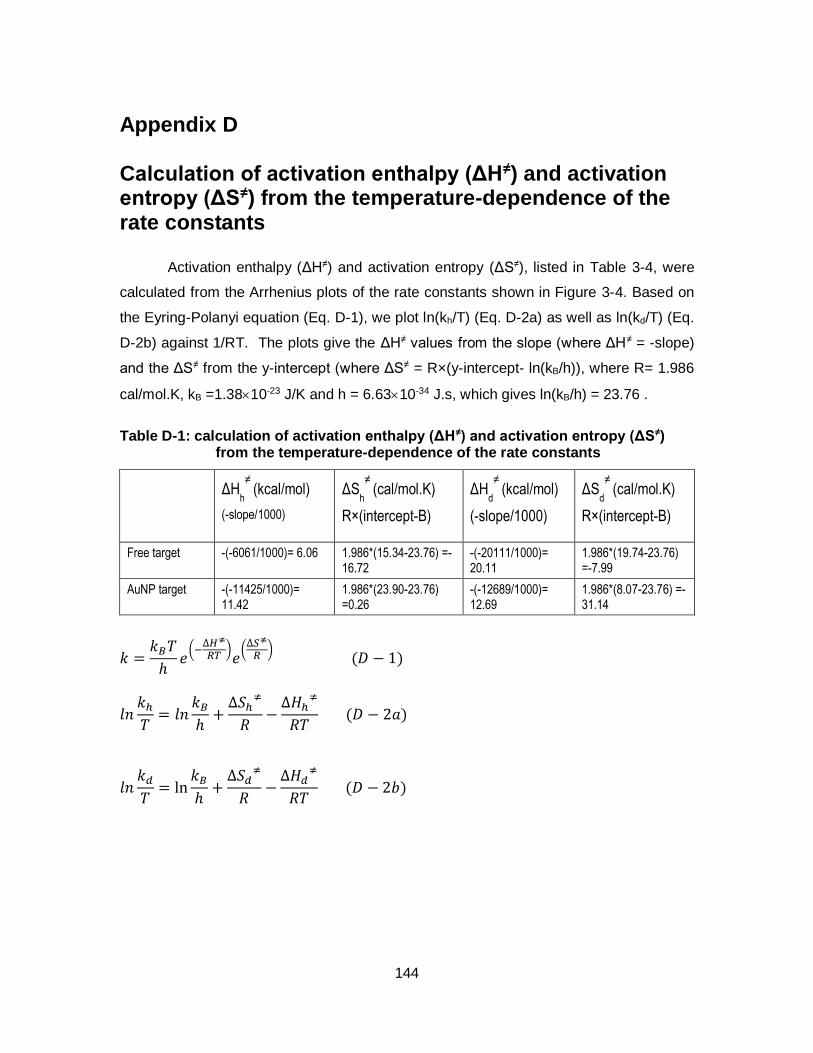
144
Appendix D Calculation of activation enthalpy (ΔH≠) and activation entropy (ΔS≠) from the temperature-dependence of the rate constants
Activation enthalpy (ΔH≠) and activation entropy (ΔS≠), listed in Table 3-4, were
calculated from the Arrhenius plots of the rate constants shown in Figure 3-4. Based on
the Eyring-Polanyi equation (Eq. D-1), we plot ln(kh/T) (Eq. D-2a) as well as ln(kd/T) (Eq.
D-2b) against 1/RT. The plots give the ΔH≠ values from the slope (where ΔH≠ = -slope)
and the ΔS≠ from the y-intercept (where ΔS≠ = R×(y-intercept- ln(kB/h)), where R= 1.986
cal/mol.K, kB =1.3810-23 J/K and h = 6.6310-34 J.s, which gives ln(kB/h) = 23.76 .
Table D-1: calculation of activation enthalpy (ΔH≠) and activation entropy (ΔS≠) from the temperature-dependence of the rate constants
ΔH
h
≠ (kcal/mol)
(-slope/1000)
ΔSh
≠ (cal/mol.K)
R×(intercept-B)
ΔHd
≠ (kcal/mol)
(-slope/1000)
ΔSd
≠ (cal/mol.K)
R×(intercept-B)
Free target -(-6061/1000)= 6.06 1.986*(15.34-23.76) =-16.72
-(-20111/1000)= 20.11
1.986*(19.74-23.76) =-7.99
AuNP target -(-11425/1000)= 11.42
1.986*(23.90-23.76) =0.26
-(-12689/1000)= 12.69
1.986*(8.07-23.76) =-31.14
𝑘 =𝑘𝐵𝑇
ℎ𝑒(−∆𝐻≠
𝑅𝑇 )𝑒(∆𝑆≠
𝑅 ) (𝐷 − 1)
𝑙𝑛𝑘ℎ𝑇= 𝑙𝑛
𝑘𝐵ℎ+∆𝑆ℎ
≠
𝑅−∆𝐻ℎ
≠
𝑅𝑇 (𝐷 − 2𝑎)
𝑙𝑛𝑘𝑑𝑇= ln
𝑘𝐵ℎ+∆𝑆𝑑
≠
𝑅−∆𝐻𝑑
≠
𝑅𝑇 (𝐷 − 2𝑏)


![[Electronic Supplementary Information] surface … · The controlled synthesis of plasmonic nanoparticle clusters for efficient surface-enhanced Raman scattering platforms ... (ANDOR,](https://img.pdfslide.us/doc/110x75/5b7496f87f8b9a924c8c4798/electronic-supplementary-information-surface-the-controlled-synthesis-of-plasmonic.jpg)