Embed Size (px)
Citation preview
Gold Derivatives: The Market View
Jessica CrossVirtual Metals Research& Consulting LtdLondon/Johannesburg
Gold Derivatives:
The market view
August 2000
123456

Gold Derivatives: The Market View
The views expressed in this study are those of the author and not necessarily theviews of the World Gold Council. While every care has been taken, neither theWorld Gold Council nor the author can guarantee the accuracy of any statementor representations made.
Published by Centre for Public Policy Studies,World Gold Council, 45 Pall Mall, London SW1Y 5JG, UK.Tel +44.(0)20.7930.5171 Fax + 44(0)20.7839.6561E-mail: [email protected] Website www.gold.org
August 2000The findings in this report were based on data available up to June 2000

Gold Derivatives: The Market View 3
CONTENTS
Foreword by Haruko Fukuda, Chief Executive, World Gold Council ...................... 7
About the author ................................................................................................... 8
Executive summary ............................................................................................. 9
Preamble ...........................................................................................................12
Overview ..........................................................................................................14The major conclusions ................................................................................18Gold derivatives: basic principles ................................................................24
The report findings in brief:Chapter 1 - The lending market ............................................................27Chapter 2 - Producer hedging ...............................................................29Chapter 3 - The commercial banks ........................................................33Chapter 4 - The funds and money under management ........................37
Chapter 1: The lending marketIntroduction and objectives .........................................................................41The data .......................................................................................................43The historical lease rate market:
• The last decade ....................................................................................46• The period June to December 1999 ..................................................48
The Washington Agreement on Gold - an interpretation ..........................49Analysis of the Washington Agreement on Gold and theprognosis for the future:• The immediate impact of the Washington Agreement on Gold .......51• The longer-term implications of the Washington Agreement on
Gold and the outlook for the future lending market ......................56
Chapter 2 : Producer hedgingIntroduction and objectives .........................................................................59The findings and recommendations ...........................................................61The findings of the statistical questionnaire ...............................................65The findings of the non-statistical questionnaire ........................................76
Chapter 3: The commercial banksThe current status of bullion banking ........................................................85The cause and effects of the gradual restructuring of bullion banking .........87The impact of the Washington Agreement on Gold ..................................92Current trading limits and exposures ..........................................................94Proprietary trading and trading to own account ........................................98

Gold Derivatives: The Market View4
5.2 The options5.2.1 The put option ......................................................................... 1135.2.2 The call option ......................................................................... 1145.2.3 The cap and collar or the min-max .......................................... 1155.2.4 The up and in barrier option (kick-in/knock-in)..................... 1165.2.5 The down and out barrier option (knock-out) ........................ 1175.2.6 The convertible ‘forward’ ........................................................ 119
5.3 The basic lease rate swap ...................................................................... 121
Chapter 6:Debating issue - the case for higher lease rates ............................................. 123
Glossary ......................................................................................................... 129
Data appendices
Appendix 1 : The lending marketCommitment to the lending markets - official sector by country:Reserves lent as of December 1999 ..................................................... 139Regional analysis .................................................................................. 139
Appendix 2 : Producer hedgingHedging at risk end-Dec 1998 for 1999 delivery ............................... 140Hedging at risk end-Dec 1998 for 2000 delivery ............................... 141Hedging at risk end-June 1999 for 1999 delivery .............................. 142Hedging at risk end-June 1999 for 2000 delivery .............................. 143Hedging at risk end-Dec 1999 for 2000 delivery ............................... 144Hedging at risk end-Dec 1999 for 2001 delivery ............................... 145
Chapter 4: The funds and money under managementIntroduction and objectives .........................................................................99The research findings ............................................................................... 101
Chapter 5: The derivative productsIntroduction and objectives ....................................................................... 105The products ............................................................................................. 1065.1 The forwards
5.1.1 The fixed forward ...................................................................... 1065.1.2 The floating gold rate forward .................................................. 1075.1.3 The floating forward ................................................................. 1085.1.4 The spot deferred ...................................................................... 1095.1.5 The participating forward ........................................................ 1105.1.6 The advance premium forward................................................. 1115.1.7 The short-term averaging forward ............................................ 112
Gold Derivatives: The Market View 5
Summary - nominal total hedging by product .................................... 146Realised prices compared to spot as of end-December 1998 .............. 147Realised prices compared to spot as of end-June 1999 ....................... 148Realised prices compared to spot as of end-December 1999 .............. 149
Appendix 3 :The bullion trading community .......................................................... 150
Appendix 4 : Money under managementAnalysis of the money-under-management data ................................. 151Definition of funds and money under management ........................... 163Hedge fund use of leverage .................................................................. 165Database status and sample analysis .................................................... 166Sectoral analysis .................................................................................... 168Annual growth of the industry - launch of the funds.......................... 170Money under management on a six-monthly basis ............................. 174Changes in capital bases on a six-monthly basis .................................. 176Minimum account levels for entry ....................................................... 180Six-monthly returns to investors .......................................................... 182Average rate of return to investor over the life of the funds ................. 186Redemption status - hedge funds ........................................................ 190
Appendix 5 : Research methodology ........................................................ 192
Appendix 6 : The Washington Agreement on Gold ................................. 194

Gold Derivatives: The Market View6

Gold Derivatives: The Market View 7
FOREWORD
The rapid growth of gold derivatives over the past 15 years has transformed thegold market. It has brought to market participants both new opportunities andnew risks. As with all derivative markets, its complexity, the rapid pace of innova-tion and the chain of transactions typically triggered by one initial operation havemade it difficult to measure or assess the market. In addition the gold derivativesmarket has differed from that of other commodities due to the existence of mas-sive above-ground stocks. This has made the gold market both operate in a differ-ent fashion from those relating to other commodities and become considerablymore extensive. These differences have also hindered understanding of the mar-ket, of the way it operates and of its interaction with the physical market.
A further problem in assessing the derivatives market has been the variable qualityof the underlying data on gold holdings and gold movements. While the opera-tions of certain participants are relatively well tracked, information about otherscan be limited or completely absent.
In the absence of firm data, estimates of the size of the derivatives market andspeculative positions have varied widely, promoting confusion and hindering theefficient operations of market participants. In 1999 the World Gold Council wastherefore requested by its members to sponsor a major research project into goldderivatives in order to try to get a better assessment of the market’s size, scope,operation and effect. This publication, by Dr Jessica Cross and her colleagues ofVirtual Metals Research and Consulting Ltd - the first results from the project -is the outcome of a major investigation, lasting nearly one year. During that yearDr Cross and her colleagues have examined in depth the gold derivatives activityof central banks, bullion banks, gold mining companies and hedge funds. A sub-stantial programme of interviews, questionnaires, data analysis and detailed studyof gold market transactions was implemented to research and report on the papergold market and the actions and views of the main participants.
The World Gold Council is grateful to Virtual Metals Research and Consultingfor the considerable care and effort that has gone into this report. We are pleasedto publish it as the most comprehensive and detailed review of the gold deriva-tives market so far. As such it should be welcomed by all who are interested in thegold market.
Haruko FukudaChief Executive

Gold Derivatives: The Market View8
About the author
Jessica Cross gained a science degree before joining the Anglo American Corpora-tion in Johannesburg in 1980. There she was trained as a commodity analystcovering the base and precious metals. In 1987, she joined Consolidated GoldFields in London to work primarily on the authoritative annual gold survey butalso to complete platinum research. She co-edited the 1989 gold survey beforejoining the economics department at The RTZ Corporation plc as their goldanalyst.
After completing an honours degree, she went on to obtain a doctorate at theUniversity of Nottingham, evaluating the financial derivative products of goldand their influence on the gold price. As a result, she published her first book:New Frontiers in Gold - The Derivatives Revolution, Rosendale Press, London.
In 1994 she launched Crosswords Research and Consulting, her own consul-tancy which today continues to research fund activity in commodity markets butfocuses also on anticrime work based in South Africa. In November 1997, Jessicalaunched a second gold consultancy via the Internet called Virtual Gold. In No-vember 1998 the consultancy, under the new name of Virtual Metals, evolvedfurther to include silver and the platinum group metals.
Virtual Metals Research and Consulting LtdLondon and Johannesburg
London:Tel: +44 20 7486 4556Fax: +44 20 7486 4556Johannesburg:Tel: +27 11 880 3139Fax: +27 11 788 9526
Website: www.virtual-gold.comE-mail: [email protected]

Gold Derivatives: The Market View 9
EXECUTIVE SUMMARY
This publication reports on major research into gold derivatives carried out fromJuly 1999 to June 2000. An extensive programme of interviews, questionnaires,data analysis and other research was put in place in order to study and report onthe paper gold market and the actions and views of the main participants. Keyfindings include the following:
• The amount of gold in the lending and swaps market (total liquidity) at theend of December 1999 is estimated at 5,230 tonnes, of which 4,710 tonnescame from central banks and other formal official holdings. The remaining 520tonnes came from undeclared or quasi official holdings or from private sources.The amount of gold lending and swaps has grown rapidly over the past decade,more than doubling every five years. Immediately after the Washington Agree-ment total liquidity reached a peak of 5,500 tonnes, up from 4,904 tonnes atend June 1999.
• The lent/swapped gold was used as follows:
Use of gold liquidityTonnes
June 1999 December 1999Producer hedging (net of deltas) 2,812 3,021Consignment and other inventory 1,135 1,465Official sector 310 350Net short position 647 394 Of which: Comex positions 254 7 Implied OTC proprietary/ carry trade 393 387Total 4,904 5,230
• The mining industry is thus the greatest user of lent gold. Short speculativepositions exist but appear to be of lesser size. The growth of derivatives hasplayed its part in price discovery but cannot be isolated as the dominant factor.
• On average, the official sector lends 14% of its declared gold holdings. How-ever the proportion varies substantially from country to country. If the USA,Japan, IMF and major European countries that do not lend are excluded theproportion rises to 25%.
• In general countries not signing or associated with the Washington Agreement

Gold Derivatives: The Market View10
have lent a significantly higher proportion of their holdings than countrieswithin or associated with the Agreement. This implies that there is only alimited quantity of additional official gold for lending available to the marketuntil September 2004. Unless Japan enters the lending market the maximum ad-ditional liquidity likely to be available from declared official holdings is 1,000tonnes. This compares with some 6,000-9,000 tonnes prior to the announcement.
• Hedging has enabled producers to realise higher than spot prices in recentyears. However the mining industry is facing a number of derivative-relatedchallenges:
- the total costs of marginal producers in North America and Australia arenot being fully covered by average realised hedge prices. South Africanproducers are faring better but their position may not be sustainable in thelonger term;
- the Washington Agreement has precipitated a review of hedging practicesby both mining companies and bullion banks. Well publicised difficultieswith two hedge books have prompted a swing away from the more complexproducts. However since the more complex products have facilitated theachievement of higher realised prices, this could render hedging moreexpensive;
- the majority of producers have not been subject to margin calls on theirhedging agreements. However the events of September 1999 have causedbullion banks to review the issue with the possibility that additional hedg-ing premiums may be levied on mining companies that are deemed lesscreditworthy;
- the sharp decline in exploration expenditure implies that the reserve base isnot being replenished. This has implications for existing credit lines andthe ability to hedge reserves in the ground;
- the introduction of the FAS133 accounting system will also influence thechoice of hedging products in the future.
• The bullion-banking industry has been subject to extensive restructuring inrecent years. This has had a substantial effect on available credit. Banks’ tradinglimits have declined in recent years and are currently collectively likely to totalsome 2.5-3.5m oz (75 to 110 tonnes) of combined short-term net exposure.
• No evidence was found of any collusive behaviour on the part of market partici-pants to manipulate the price.

Gold Derivatives: The Market View 11
A full overview of all the main findings follows. Chapters 1, 2, 3 and 4 look indetail at the lending (and swaps) market, producer hedging, bullion banking andmanaged funds sector respectively. Chapter 5 describes derivative products. Chapter6 gives the author’s personal view of the advantages and disadvantages of higherlease rates. Appendices present detailed data and other information.

Gold Derivatives: The Market View12
PREAMBLE
It has long been the case that the presence and potential impact of derivatives onthe gold market and consequently the price has generated an unprecedentedamount of interest. The level of voluntary participation in the preparation of thisstudy on the part of the commercial banks, the mining companies and the officialsector bears testimony to the global consensus that it would be in the interests ofall to understand better this component of the gold market. It is hoped that thisreport goes some way to fulfilling that need. But, as Virtual Metals noted in theinitial proposal for this study, any detailed research into the derivative phenom-enon would probably generate as many questions as it provided answers. This hasindeed been the case and consequently, it is acknowledged that further work iswarranted.
The derivative market in gold is a particularly dynamic one which requires fre-quent analysis. Trading patterns and products considered the norm five, or eventhree, years ago have now been succeeded by new mechanisms and hedging phi-losophies. This swift evolution is evidence that the derivatives are a natural andthriving concomitant of a free market in gold. Perhaps for this reason alone theirpresence should be accepted rather than eschewed.
The participants of greatest influence remain without question the central banks,primarily through their lending and the mining companies via their efforts toeliminate price risk and raise revenue. It is inevitable, therefore, that the discus-sion that follows concentrates on these sectors. This by no means reduced ourresearch efforts with respect to the roles (actual and potential) played by thecommercial banks and the hedge funds. We have considered them in detail. Tothe commercial banks we have ascribed the roles of facilitators, providers of credit,counterparties, product creators and risk takers. With the funds, we have associ-ated trend following, leverage, carry trade, aggressive short positions and, in somecases, considerable opportunistic risk taking.
The research approach in completing this work combined all available publicdomain statistics, individual and confidential interviews where market partici-pants gave freely of their collective experience and knowledge (a full description ofthe research methodologies is given in Appendix 5). The study, therefore, is notsimply a statistical review, dry and impersonal in its reading. It makes every effortto account for the more subjective opinions and views held by day-to-day marketparticipants and this inevitably leads to controversy. For years we have joked thatone can ask a New York cab driver about the price of copper or aluminium and allyou will get is a blank stare (if you are lucky). Ask him about the gold price,however, and not only will he give you the latest two-way price but offer his owntheory as to cause and effect.

Gold Derivatives: The Market View 13
Although we stopped short of interviewing the New York cab industry, this re-port is not the work of one consultant but effectively the collective consensus ofthe international gold market. To thank individually all those who so willinglygave of their time and expertise is an impossible task but in avoiding doing so, mygratitude is by no means diminished. I have long appreciated that the only way tothank the market appropriately is to deliver a balanced, comprehensive, readable,enlightening and thought-provoking study, which will be of intellectual benefitto all. That remains the ultimate objective of this project. However, a number ofindividuals need special mention. Firstly, I am deeply indebted to Kelvin Williamsand Chris Thompson for recognising the need for this work in the first place andensuring that the project came to fruition. I then single out Ted Reeve of ScotiaMocatta, Canada and Geoff Breen, of Ord Minnett, Australia for their input onhedging in their particular parts of the world as well as Mark Fellows of BrookHunt & Associates for access to cost data. And finally, I thank most sincerely NeilNewitt for assisting with the interviews and travel and Tony Warwick-Ching forholding the Virtual Metals fort while I moved across full time to this study.
Jessica Cross, Virtual Metals Research & Consulting UKJune 2000London and Johannesburg

Gold Derivatives: The Market View14
OVERVIEW
This research neither endorses nor denounces the use of derivatives in general.The brief was very specific: shed light without judging or favouring a particularline of reasoning. However, during the interviews with scores of gold market par-ticipants a number of compelling and cogent arguments both for and againstprice protection and the use of derivatives emerged. To omit them would cer-tainly detract from the potentially very lively debate which hopefully will followthe publication of this report. They have therefore been included in the discussionin the most objective way possible without, however, allowing their presence todominate the presentation of the research findings.
Before presenting a summary of the results, it is necessary for a moment to standback and place the whole derivative question into perspective. Primarily, one hasto consider why the sector has generated such debate among gold market partici-pants, sometimes even to the point of irrationality and acrimony. Contrast thiswith other commodities and financial markets, where derivatives are widely ac-cepted and generally observed to be beneficial to the markets of the underlyinginstruments. Within these markets, the active presence of the derivatives is sim-ply not an issue, let alone an all-consuming preoccupation, which commands avast amount of intellectual time and energy in its debate.
The short answer to this question is: circumstances unique to gold. Unlike anyother commodity (with the possible exception of silver), gold is subject to massiveabove-ground stocks; but more importantly perhaps much of this is in a physicalform which could readily come to market should circumstances dictate. The ironyis that the physical and chemical characteristics that originally gave gold its uniqueand revered place in Man’s history (especially its indestructibility) have now comeback to haunt the modern day bullion market.
More specifically, the unusual characteristics of the gold market have caused de-rivatives to develop in a way that favours the short side of the market. Certain ofthese features have exacerbated the unfavourable price conditions of recent years.The actions of market participants, including producers, central banks, the com-mercial banks and the hedge funds need to be considered in the light of thesecircumstances.
Firstly, these market conditions have arisen over the last two decades in the virtualabsence of the sophisticated investor, specifically the institutional portfolio man-ager in Europe and North America, who might have had an interest in maintain-ing a long, probably derivative-based, gold position. In this regard, gold equitiesas a percent of an investment portfolio are simply no substitute for physical metalor derivatives instruments based on the physical.
Gold Derivatives: The Market View 15
Secondly, over the same two decades, the official sector, the major holder of agood deal of the above-ground stocks, has been gradually implementing modernday portfolio management theory in which gold’s role as a predominantly non-interest bearing asset has been brought into question.
Thus, in attempting to secure a return on its reserves, the official sector, in addi-tion to becoming a net seller, has been mobilising its holdings. This has providedthe lending market with ample liquidity over the years, which in turn has keptgold lending rates comparatively low and ensured that the market remained incontango. This contango has served to encourage producer hedging while the lowlending rates encouraged the hedge funds and others to borrow inexpensive goldwith the intention of raising highly cost-effective dollars. Thus market circum-stances alone, rather than any orchestrated or deliberately collusive behaviour,have given rise to a derivative market highly geared to the short side. It is ourbelief that if there had been a dynamic and sophisticated investment componentto the gold market, which provided a natural counterbalance to the normal hedg-ing activities of the gold producers and any others taking short positions, then thegold market today would look completely different. In fact, if that were the case,it is most likely that the need to commission this study would never have arisen inthe first place.
The negative effects of these structural features have not been offset by comparablegrowth in physical offtake and thus the gold price has responded accordingly.The net impact on the price has generated controversy about the actions of themarket participants including the practice of producer hedging. The situation isonly exacerbated by a great deal of ambiguity and hence confusion surroundingthose official derivative statistics that are made available. In many instances, thesefigures represent grossed-up derivative positions based on substantially lower un-derlying exposures. To misconstrue these figures and consequently deduce erro-neous conclusions is then commonplace but serves only to cloud further the issue.
It is perhaps ironic that this debate is still continuing at a time when the marketitself is generating circumstances which could well herald a change in hedgingpractices. Our research has isolated a number of factors that are likely to influencethe future of global hedging. We conclude that, quite apart from opinions, thereare fundamental reasons why international hedging practices are likely to changein the short to medium term. In this context we are greatly concerned about theimpact on the short-term lending market should the mining companies elect to un-wind their hedges at short notice. All these findings are presented later in this chapter.
Before concentrating specifically on gold, I return to my initial comments withrespect to placing the derivatives into perspective. It is all too easy to become soengrossed with the intricacies of the gold lending and hedging world that oneloses sight of the bigger picture. All other markets indicate that derivatives,
Gold Derivatives: The Market View16
correctly understood and used wisely, exist to assist as much as possible in theremoval of price risk. To be totally pragmatic, they would cease to exist if they didnot serve a useful commercial function. Specific to gold, isolated and very limitedproblems aside, there is overwhelming evidence indicating the successful trackrecord of by far the majority of prudent gold hedging programmes over morethan two decades. This is particularly true if you are of the school which believesthat hedging was not the only reason for the last decade’s decline in the goldprice. It is also particularly true if you consider a mining company and its hedgebook in isolation, divorced from the rest of the industry and serving the interestsof its shareholders alone. These arguments are less compelling if hedging is con-sidered in the context of the market in general.
With respect to the impact of derivatives on the longer-term price of the underly-ing commodity, there is considerable academic research which points to the con-clusion that in the long run their influence is negated. Many argue that thehedges over full tenure must come to delivery and thus roll off the collectivehedge book. The conclusion drawn, therefore, suggests that in the long run, hedgingdoes not impact on the price.
Specific to gold, I maintain that this may indeed be true of the individual prod-ucts and their long term isolated behaviour. However, as will be discussed in thisreport, we did find evidence to suggest that the existence of hedge books has beeninfluencing long-term decision-making on the part of a number of mining compa-nies associated with sufficient tonnages of beneficial production for the results tobe deemed statistically significant. This suggests an indirect long-term impact ofhedging over and above the mere presence of the products. We conclude thereforethat the presence of hedging has more than likely delayed mine closures, prob-ably delayed mergers and the restructuring of the industry and in some cases,encouraged or even subsidised exploration and the expansion of reserve bases. Ifthis is indeed the case, then we must accept that hedging, through mining com-pany philosophy has left and will continue to leave its mark on the long-termgold market. But one can argue that any trading activity or presence in the mar-ket must impact on the cumulative industry in some way or another. How thereaders interpret these findings depends on whether they accept the contentionthat hedging has not been the only factor influencing the gold price.
Thus the debate is likely to continue. It seems more than just probable that minemanagement will make every effort to minimise as much as possible risk of alldescription as it relates to their business. The price of gold is but one element ofrisk faced by the producer. In any market, but especially one that remains incontango, mine management is hard pressed not to embark on a hedge programmeof some description. However, the future ability to hedge with the ease that char-acterised the past decade now remains to be seen. This then has very significantimplications for the lending market and future demand for liquidity.
Gold Derivatives: The Market View 17
This report raises for debate various derivative issues but a major objective of thestudy is to place the derivative question into perspective. This can only be achievedby shedding light on an under-researched and widely misunderstood area of themarket. The remainder of this section presents our major conclusions and thensummarises the findings of 12 months’ worth of research. It also puts forwardsome recommendations for further consideration not only by the mining com-pany sponsors of this report but by the gold market in general. The remainingchapters consider each sector of the derivative market in considerably more detail.Where appropriate, statistics are given in the associated appendices. Chapter 6plays devil’s advocate and raises for further debate what we have identified aspotentially fruitful avenues of further research.
Gold Derivatives: The Market View18
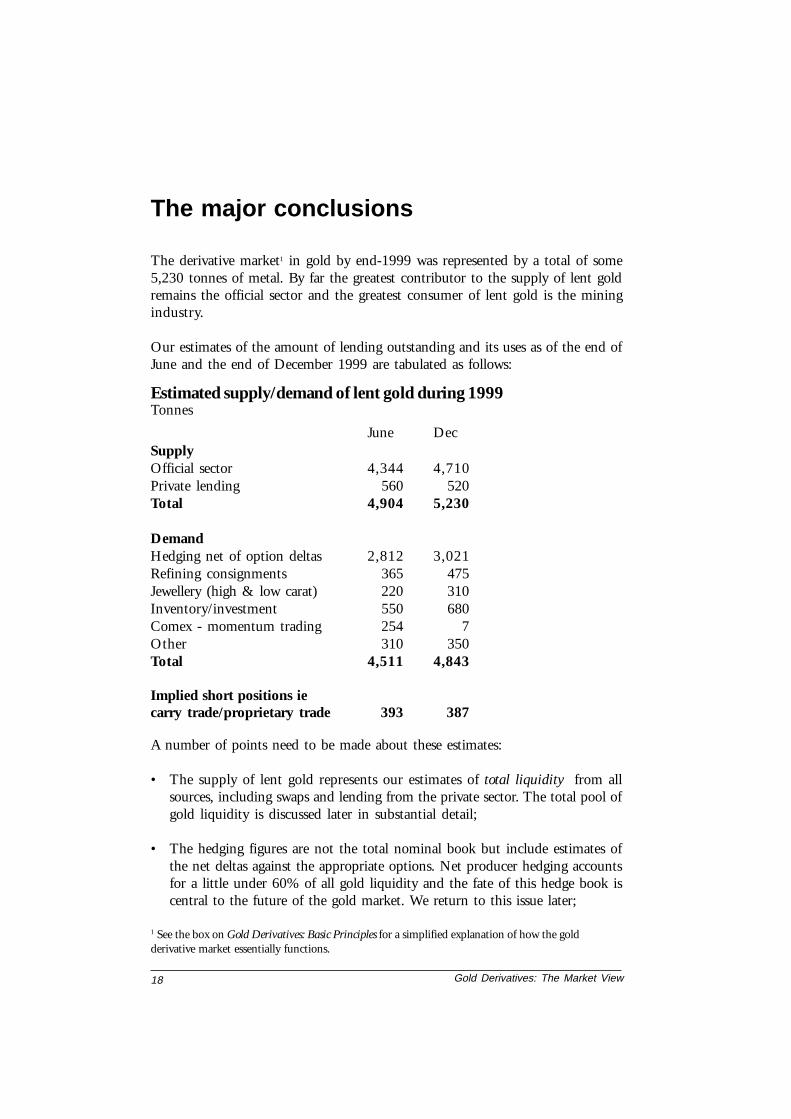
The derivative market1 in gold by end-1999 was represented by a total of some5,230 tonnes of metal. By far the greatest contributor to the supply of lent goldremains the official sector and the greatest consumer of lent gold is the miningindustry.
Our estimates of the amount of lending outstanding and its uses as of the end ofJune and the end of December 1999 are tabulated as follows:
The major conclusions
Estimated supply/demand of lent gold during 1999
A number of points need to be made about these estimates:
• The supply of lent gold represents our estimates of total liquidity from allsources, including swaps and lending from the private sector. The total pool ofgold liquidity is discussed later in substantial detail;
• The hedging figures are not the total nominal book but include estimates ofthe net deltas against the appropriate options. Net producer hedging accountsfor a little under 60% of all gold liquidity and the fate of this hedge book iscentral to the future of the gold market. We return to this issue later;
Tonnes
June DecSupplyOfficial sector 4,344 4,710Private lending 560 520Total 4,904 5,230
DemandHedging net of option deltas 2,812 3,021Refining consignments 365 475Jewellery (high & low carat) 220 310Inventory/investment 550 680Comex - momentum trading 254 7Other 310 350Total 4,511 4,843
Implied short positions iecarry trade/proprietary trade 393 387
1 See the box on Gold Derivatives: Basic Principles for a simplified explanation of how the goldderivative market essentially functions.

Gold Derivatives: The Market View 19
• The estimates of gold on refining consignment take into account installedcapacities and estimates of current capacity utilisation; the latter of course canvary considerably depending on seasonal variations and market conditions.The increase in pipeline financing of refining material reflected in the tablewas largely due to the increased throughput triggered by the September pricerally. Substantial tonnages of leased physical gold (not in good delivery form)were returned to the refiners immediately after the sharp increase in lease ratesin September. This was particularly evident from centres such as Dubai;
• The estimates of financed gold in the jewellery manufacturing process havetaken into account the very different production lead times for high-carat lowmarkup and low-carat high markup jewellery;
• The estimates of inventory include consignment stock held by jewellers, con-signment stock held by other industrial end users of gold and investment goldtraditionally held in the high-carat low markup consuming markets. The in-crease in inventories shown in the table is largely a seasonal reflection of thestock held by jewellers over the Christmas period;
• The Comex/Nymex figures are published. The sharp decline in the net shortposition held by the momentum traders is entirely in keeping with their trad-ing behaviour and the price movements during the second half of the year;
• The ‘Other’ category includes demand for lent gold associated occasionallywith the official sector itself, specifically with respect to options, swaps, short-term forward sales and upgrading;
• The residual is the implied net short position held by the major hedge fundsand any other proprietary trading. The figures for the two end periods actuallymask the dramatic changes that occurred in this sector during the fourth quar-ter of 1999. There was strong evidence of substantial short covering duringthe September price rally in which a good deal of this short position wasindeed unwound. The fact that the rally stalled at the $330/oz level and didnot break much higher levels is probably the most reliable empirical evidencesuggesting that the short position held by the hedge funds was nothing likethe levels claimed by some in the market2. The subsequent collapse in thelease rates has encouraged the re-establishment of at least a proportion of theseshort positions; a process which can be expected to continue, should the leaserates remain low and should the interest rate differential between the leaserates and the US dollar rates widen even further;
2 Furthermore, the liquidation this year of two large hedge funds known to be active in the goldmarket without any dramatic impact on the gold price is further evidence of a more conservativeshort position than otherwise claimed.
Gold Derivatives: The Market View20
• And finally on the historical data, this research could find no evidence ofcollusive behaviour in the gold market or any evidence of a conspiracy betweenthe major sectors and participants. Historical data covering at least that lastdecade confirms that the market has more often than not favoured a shortposition. If third parties believe that they have such evidence they are stronglyurged to submit this information to the appropriate judicial authorities as amatter of great urgency.
Such are the historical findings. Of more importance is the role that the deriva-tives are likely to play in future price discovery.
The second half of last year and opening months of 2000 saw a spate of publicannouncements by the mining companies with respect to their hedge positionsand their future intentions. A number of companies unwound their forward ex-posures completely and contributed to a tangible decline in the short hedgingposition. Others restructured, altering the nature of their exposure rather thanthe volume. Some added to their existing books while others adopted a “wait andsee” attitude.
The price response to many of the announcements to the effect that some miningcompanies would not be adding to their hedge books was positive but in theshort term only. This suggests an influence on sentiment alone that, by implica-tion, is unsustainable rather than signalling a structural change in the underlyingstatus quo. Since then, the gold price has once again slipped well below $300/oz,interest rates, particularly in the United States, have risen and the one monthgold lease rate dropped to well below 1%.
Sentiment and investor-relations announcements aside, our research suggests anumber of fundamental factors that are likely to precipitate a change in the inter-national hedge book. A limited number of these factors are likely to generate agreater appetite for price risk management, while a number of others could wellherald a strategic rethink on the part of the producers and could result in a con-traction of the hedge book. These are as follows:
• Our analysis of total costs3 versus average realised prices of the 1999 hedgebook suggests that the total cost of the marginal producer in North Americaand Australia is not being fully covered by those regional realised prices. SouthAfrican mines are faring better with the costs of the marginal producers fullycovered by regional realised prices. However, because of the way some of thelarger hedge books in that country have recently been restructured, it is not aforegone conclusion that this state of affairs is sustainable. This then begs the
3 Including exploration and development costs. Not cash or operating costs which we maintain do notreflect the true profitability of the industry. This said, once a mine is operational it is cash costs whichneed to be considered to determine its ongoing profitability.
Gold Derivatives: The Market View 21
question of whether the global gold producers can afford not to hedge,irrespective of sentiment. The implication is that the producers must eitherreduce their total costs by a substantial amount or maintain their hedgingpositions at higher realised prices. The extent to which costs can be reduced isan area that requires more detailed analysis. In the absence of a price rally, themaintenance of the hedge book at current realised prices may be very difficultto achieve without increasing hedge exposures;
• Since the September price rally and the problems associated with two hedgebooks, the vast majority of mining companies are studiously avoiding any useof what might be described as exotic products and are moving back to tried andtrusted vanilla instruments. However, the rationale behind the preference forthe more complex mechanisms in the first place was that they afforded theminers higher realised prices than their vanilla sisters. Thus in order merely tomaintain current realised prices, the producers are going to have to find alter-native ways of making use of the vanilla products. One way this could be achievedis to hedge to longer tenure and compound the contango over a longer contractperiod. This may indeed be possible in many cases but in other instances, thismay place pressure on existing credit arrangements, especially if these lines arecurrently unmargined. In other words, hedging to longer tenure may simplynot be a viable alternative for some companies;
• The price rally in September clearly raised the issue of margin and the factthat, over the past five years, by far the majority of mining companies havesuccessfully negotiated out of their hedging agreements most references tomargin. This is evidence of how dominant the producers have been in thehedging relationship and how competitive the bullion banks have found theprice risk management business. The question of margin and credit in generalis now very much on the agenda of the commercial banks, especially after thesharp increase in lease rates and the price movements of late September. Theextent to which they will successfully negotiate back into agreements any refer-ence to margin remains to be seen, especially with the mining industry soadamantly against margin call in any form. The most likely outcome is aninternal reassessment of individual credit and the levying of an added hedgingpremium on those mining companies which are deemed to be less creditwor-thy than others. This implies that hedging for a proportion of the industry willbecome considerably more expensive;
• The introduction of the new FAS133 (US Financial Accounting Standards BoardStatement 133) accounting system is certainly going to influence future hedg-ing decisions, primarily with respect to the choice of product and the degree ofexpected disclosure which will render the intricacies of a hedge book substan-tially more visible. Product choice will be influenced by the way in which aderivative is defined for accounting purposes. Those that are deemed to be
Gold Derivatives: The Market View22
hedge products will probably be unaffected in their use, namely the vanillaforwards and put options bought against forecast production. Those defined asnon-hedge or speculative products for accounting purposes will pose more of adilemma for the mining industry. Call options written, for example, will haveto be marked to market on at least a quarterly basis and any resultant profit orloss brought into the income statement. For this reason the industry in generalmay elect to cease writing these options. However, these calls were granted inthe first place with the specific intention of paying for downside protection viathe puts bought. This implies that the industry will either have to pay upfrontfor their puts, which will render hedging that much more expensive, or findsome other derivative based method of offsetting this cost. The alternatives atthe moment appear limited;
• As chapter 2 demonstrates, commodities in general have witnessed a very sharpdecline in exploration expenditure, especially over the past three years. Goldhas suffered not only from a decline in absolute levels of expenditure but hasalso lost to base metals its relative share of total exploration budgets. This has anumber of implications for future derivative usage. Firstly, there are currentlyvery few projects at feasibility stage which, if they came to fruition, wouldrequire derivative-based development financing. Secondly, this implies thatgrowth in gold production is certainly going to peak, if not plateau or evendecline throughout the next decade that will naturally limit the growth inhedging needs. And finally, current reserve bases are not being replenished atthe same rate as they are being depleted. This must limit the ability of somecompanies to hedge, particularly if those companies are already experiencingcredit line constraints associated with margin concerns. Moreover, the goldprice at which the producers revalue their reserves in the ground, particularlyif the gold price fails to consolidate over $300/oz, is also likely to favour adownward bias of the global reserve base.
Thus the mining industry is facing a number of derivative-based challenges. Howthese are individually and collectively addressed remains to be seen. But what wecan say about the preceding discussion is that a number of factors are comingtogether which could suggest that the peak of hedging is over. The causes are inthe main market-related rather than exogenous to the industry. The WashingtonAgreement on Gold in all fairness probably did not precipitate a fundamentalchange in hedging philosophies but more likely accelerated events and processesalready under way. This is not to say that the hedging phenomenon will simplydissipate overnight. We are saying that for the first time in fifteen years of moni-toring this industry, we can foresee a change in the fundamentals that have sup-ported and encouraged the enormous growth in hedging.
These findings then beg the question of future growth in gold lending. If one

Gold Derivatives: The Market View 23
accepts the thesis that says the period of sharpest growth in hedging is over andwe can expect a decline in the growth in volumes hedged, plus a substantially lesscomplex hedge book all round, one can argue that the demand for lent gold isgoing to decline proportionately. Less demand for lent gold negates any upwardpressure in the lease rates4 .
Chapter 1 details our analysis of the potential liquidity to the market particularlyfrom sources other than the Washington signatories. It concludes that there issufficient potential lending to meet hedging needs without placing undue pres-sure on lease rates, certainly under current circumstances and assuming that hedg-ing is not going to increase at anything like the rate seen over the last two decades.Lease rates can therefore be expected to stay low rather than tightening and con-solidating at levels above historical averages. Only a global moratorium on centralbank lending which would necessarily imply an extension of the existing Wash-ington Agreement to include the majority of gold holders of magnitude, wouldindeed place upward pressure on the lease rates. However, the extent to whichthis might encourage greater private sector lending, not so much from traditionalsources which we believe now to be largely depleted, but from new sources, par-ticularly the Indian Subcontinent, must surely be of concern.
4 I have often been asked: why do the gold lease rates not reflect other money market rates? Supply anddemand and a free market in lending, the associated cost of which will tend to find its own equilibrium.

Gold Derivatives: The Market View24
The text box sets out the basic principles of how the gold forward market works for thosereaders unfamiliar with it. It also outlines the effect of the forward market on the supply ofgold and hence on the price. It looks only at the very basic plain vanilla forward. In practicemore complex transactions are used which are described and assessed in chapter 5 of this study.
In its most simplified form, the transaction can be described as follows:
1.Gold is leased by central banks and other holders to commercial/bul-lion banks and thus earns for the lender a return in line with the goldlease rate. It is this liquidity which then allows for the execution of allfurther derivative transactions.
2. With respect to producer hedging, the bullion banks contract to buygold forward from mining companies. To fund the purchase, the bul-lion banks sell an equivalent amount of gold borrowed from centralbanks. The proceeds of this sale are invested and earn interest at moneymarket rates. Thus under these conditions, the borrowed gold is sold,which effectively adds to supply in the very short term. In the ab-sence of compensating factors, this can place pressure on the goldprice. This is why hedging of this nature is sometimes termed “accel-erated supply”. In essence it mobilises metal inventories by bringingthis metal into the active market. It also allows mining companies tosell metal ahead of their production schedules.
3. When the forward sale comes to delivery, the producer delivers eithernewly-mined gold or gold purchased in the market to the bullion bankat the contract price. In theory, the bullion bank then repays its bor-rowed gold to the central bank and the transaction is unwound in itsentirety. However, more commonly, the central bank rolls over the loan,thus maintaining the liquidity to fund further derivative transactions.
4. The transaction in respect to speculative short-selling has an identicaleffect on the gold market to that of mining companies (except possi-bly that mining transactions typically involve a longer time horizon).In this case the bullion bank, instead of contracting to buy gold for-ward from a mining company, contracts to buy gold forward from aspeculator (eg a hedge fund or a bank’s proprietary trading desk). To
Gold derivatives: basic principles

Gold Derivatives: The Market View 25
fund the transaction it once again sells the gold borrowed from thecentral bank and invests the proceeds on the money market. Whenthe forward sale comes to delivery the speculator buys gold on themarket and delivers it to the bullion bank. The transaction is then intheory unwound upon the bullion bank repaying the gold to the cen-tral bank although in practice the central bank’s loan is rolled over tofund the next transaction.
5. The above ground stocks of gold are very large and are in general heldin a form that could readily come to market. Further, the willingnesson the part of the holders of this metal to participate in the marketimplies that the cost of borrowing gold remains relatively low com-pared with money market rates. This is one of the major reasons whythe gold forward market is nearly always in contango (forward pricehigher than spot price offering a positive interest rate) and only veryrarely lapses into backwardation. This positive carry available to theproducer and speculator means that the market is implicitly biasedtowards producer hedging and speculator selling. The transaction willbe profitable for the miner or speculator unless the gold price rises ata faster rate than the contango.
6. Over the last decade new lending has outstripped repayments so thatpersistent growth in lending has added to supply and hence had acumulative effect on the gold price. The market has yet to reach astage of maturity where outstanding gold lending is stable and whenthe amount of gold sold forward as a result of new lending will broadlymatch gold delivered into maturing forward contracts.
7. Lent gold is also extensively used to form consignment stocks for jew-ellers, fabricators or refiners during the manufacturing of physical prod-ucts. This enables the user to work with gold and create a product butavoid purchasing until they have a buyer for their product. A jeweller,for example, would be able to manufacture an expensive piece of jew-ellery but avoid buying the gold until he has sold the piece, thusavoiding cash flow problems and eliminating exposure to gold pricefluctuations.

Gold Derivatives: The Market View26

Gold Derivatives: The Market View 27
The report findings in brief
Chapter 1: the lending market
• The lending market has shown rapid growth over the past decade, more thandoubling every five years;
• As of the end of 1999, total liquidity amounted to 5,230 tonnes, down from arecord high of 5,500 tonnes during the weeks after the Washington Agree-ment, announced on 26th September;
• 118 countries (those whose gold reserves were traceable either through publicstatistics or direct contact with the banks concerned) were analysed;
• When all known official reserves are accounted for, the total percentage lentstands at 14% of gold holdings. Remove from this the USA, Japan and IMF, aswell as the European countries that do not lend, and the overall percentageincreases to 25%;
• Western European lending on average stands at 15%. The associated holdings,representing 45% of total existing liquidity, demonstrate the importance ofthe Washington Agreement;
• In terms of central banking lending attitudes, a full spectrum of philosophiesand practices evidenced themselves during the research. The formal officialsector collectively is substantially less sensitive to lease rate movements thanoriginally might have been expected. Decisions whether to lend at all, and atwhat level, appear to be taken for reasons often totally divorced from the per-formance in the lease rates;
• Our interpretation of the Washington Agreement is as follows:
The total volume of metal intended for sale during the five-year period wasdecided on at the time of signature; the implication being that no memberscan now, or within the five-year Agreement change their minds and elect tooffer gold to the market;Those who have declared their intention to sell gold within the five-yearperiod are not duty bound to execute those transactions and sales could beconceivably less than the 2,000 tonne allowance;There has been subsequent confirmation that the Swiss intend to sell theirentire planned 1,300 tonnes within the five-year period and thus this salewill not extend beyond the initial Agreement period. Sales began on May1st 2000;
Gold Derivatives: The Market View28
Those members who are currently active lenders of gold are not duty boundto maintain their levels of lending. Thus the presence of the signatory coun-tries in the lending market could decline in absolute and relative terms. How-ever under the Agreement, signatory lending cannot increase beyond thelevels established at the time of signing;
• Immediately post the Washington Agreement the bullion banks attempted tocover their lending exposures, doing so by managing their risk out to the fur-ther dated months. As the lease rates at the longer dated end of the curve rose,the covering swiftly spread into the nearby months. Thus the longer datedlease rates were the very first to come under pressure, although the nearbymonths followed soon afterwards. Demand for liquidity was sufficient to tipthe gold market into backwardation;
• By midweek post the announcement, a good deal of producer business wasbeing executed as mining companies restructured their hedges. This, togetherwith additional liquidity beginning to emerge from non-Agreement countries,plus the reversal of a substantial volume of gold on consignment, was sufficientto re-establish the contango. Despite renewed surges in the gold price in thewake of further short covering, especially during the second week after theannouncement, this contango was maintained. During this process we believethat the pool of liquidity swiftly grew to an all time high of 5,500 tonnes, thusincreasing by almost 10% in the wake of a shock to the leasing market. Thecore of lending (on the part of the official sector) appeared to have remainedvirtually immune to the developments in the market. However, the marginallending from the other sources demonstrates considerable sensitivity to thelease rates. This was particularly true of the consignment industry;
• Liquidity requirements based on the producer hedge book alone (to end June1999), suggested demand of additional lending in late September early Octo-ber on the part of the commercial banks of a minimum of 100 tonnes for every$25 increase in the gold price. This relationship was linear and beyond $400/oz (although, of course, not tested), it appeared to fall away;
• The extent to which the Washington Agreement has effectively sterilised a verylarge proportion of potential new lending is all too apparent. Post the Agree-ment, we estimate that potential new lending of residual official holdings notalready on loan or swapped, stands at between 560 and 1,000 tonnes. Thiscompares with figures of over 6,000 to over 9,000 tonnes prior to the an-nouncement. Excluded in this assessment is the potential for the private sectorto become a substantially more active lender of metal;
• The Washington Agreement is also likely to influence the structure and make-up of the pool of gold liquidity. It is possible that the lending market could

Gold Derivatives: The Market View 29
become increasingly sensitive to lease rates as the other sources of lending be-come more dominant. It is also possible that the lending market will becomeless and less subject to bureaucratic decisions, which by nature are associatedwith long lead times. Should this be the case, then the gold market in generalmight be able to expect a lending market that responds more swiftly to leaserate changes than has been the historical case.
Chapter 2: producer hedging
• Seventy-seven companies representing 50% of annual mine output were ap-proached to contribute to a questionnaire covering hedging. The remaining50% of output is not in general subject to hedging and every effort was madeto cover the volume of hedging in its entirety. As of December 1999, thehedge book totalled a nominal 4,038 tonnes or 158% of total 1999 output.This compares with 3,048 tonnes and 3,908 tonnes as of December 1998 andJune 1999 respectively;
• Taking delta hedging into account, the net impact of the hedge book on theday-to-day market was substantially less than the nominal total. As of June1999, the net total was 2,812 tonnes. This had increased to 3,021 tonnes bythe end of the year (118% of total 1999 output);
• Of the total, North America represented one third of the hedge book.South Africa and Australia accounted for almost a quarter and nearly 30%respectively;
• 1999 saw realised prices that remained higher than spot prices. This was evenmore apparent when looking at the full tenure of the global book, as thesefigures show. Compared to average current spot prices, the forwards in USdollar and Australian dollar terms locked in premia of a little under 30%.South African rand hedging fared better at a 48% premium over spot duringthe first half of the year. This figure had improved to 50% by December. Higherrand denominated hedging appears to be due largely to high local interest ratesbut also a restructuring of local hedge books, which boosted realised prices inthe short term at the expense of later years. The average strike prices of putsbought (again to full tenure) showed a mixed result over average spot pricesduring the first half of the year: 39% in the case of Australian dollars, 29% forUS dollars and 63% for South African rand. During the second half of 1999,the differential had narrowed quite considerably to 28% in Australian dollars,20% in US dollars and 21% in South African rand. The reason for this changeis almost certainly the greater than expected volume of put options which werebought as the gold price fell towards $250/oz during the period of July andearly September;
Gold Derivatives: The Market View30
5 Defined as C1, C2 and C3 as described by Brook Hunt & Associates. Data used with permission.6 Products included: all forwards, spot deferred and calls written.
• An analysis of average realised prices versus total costs5 of production revealed aless healthy state of affairs. This analysis looks at which decile on the cost curveis covered by average hedge prices. Looking initially at the currency denomi-nated hedging, 80% of the total costs accrued by the North American andAustralian mining communities were covered by average realised prices during1999. The South African industry fared better with 95% of total costs beingcovered (although the higher short-term realised prices may not be sustainablein some cases). Given that we define the ninth decile as defining marginality,we then conclude that the average realised prices were not quite covering thetotal costs of the marginal producers in North America and Australia. Since,however, many South African and Australian mining companies regularly hedgein both their local currencies and US dollars, a second and more detailed analy-sis was conducted to give a more equitable comparison of regional hedging.Again, 80% of Australian total costs were covered by the hedge book as were95% of the South African costs. In North America, the forwards covered 80%of total costs but the strike price at which puts were bought covered only the fifthdecile of the cost curve.
While cash costs are crucial for considering the ongoing profitability of anexisting mine, and hence for considering issues such as potential mine closure,total costs are more relevant when assessing the overall profitability of the glo-bal industry as opposed to an individual mine. Hence the overall implication ofthis analysis suggests a higher probability of decline in production levels thansuggested by the conventional cash costs analysis. This is likely to hold true if theindustry does not get a chance in the near future to lock in attractive hedgeprices. The findings also raise the question of whether the industry can indeedafford not to hedge?
• With respect to the price-related risk of the hedge book, the most vulnerableperiod of the three studied was the end of June 1999;
• For 1999 delivery, at a spot price of $300/oz, 50% of the hedges under analysiswould have been below spot6 . This increased to between 60% and 63% atgold prices of $320-$350/oz. Over 80% of hedging for 1999 delivery wouldhave been out of the money at a gold price of $375/oz. The gold associatedwith hedge products scheduled for delivery in 2000 was substantially less atrisk. A little over 10% was below spot at $300/oz. This increased to 22% at$330/oz and reached a little under 60% at $375/oz. This nevertheless demon-strates the potential dislocation of the hedge book immediately post the Wash-ington Agreement, if the gold price had indeed stabilised over $320/oz. Withthe most exposed hedge positions now delivered into 1999, restructured, rolledover or closed out, the situation at the end of December was somewhat differ-

Gold Derivatives: The Market View 31
• As of the end of December 1999, 4.5% of the total hedge book was at risk at$300/oz. This proved to be considerably lower than the 16% at risk at the endof June. Furthermore, 12%-17% was at risk at between $320-$330/oz (19%-21% end June). A full 20% was at risk at $350/oz and 34% was at risk at$375/oz (23% and 32% respectively by June 1999). This analysis demon-strates the degree to which the miners were able to restructure their hedge booksimmediately after September 26. The cost of this restructuring is not known;
• Over and above the statistical analysis of the hedge book, over 30 mining com-panies representing 40% of global production contributed to a second, morein-depth questionnaire which explored hedging philosophies and practices;
• Results from the non-statistical interviews suggested that the need to covertotal costs and the ability to remove price risk provided the greatest incentiveto hedge;
• The majority of respondents reported favouring options (usually zero-cost col-lars) to limit the loss of upside potential of higher gold prices, although theactual hedge book is still heavily weighted in forwards;
PERCENTAGE OF HEDGING AT RISK AT SELECTED GOLD PRICE (forwards and calls written)
EXPRESSED AS % OF TOTAL BOOK
0
5
10
15
20
25
30
35
40
300 320 330 350 375
%
Dec-98
Jun-99
Dec-99
ent. By the end of the year, only 11% was out of the money at $300/oz. Thisincreased to between 30% and 47% at prices ranging from $320-$330/oz. At$375/oz, 84% was currently at risk at $375/oz;
• Since the above analysis looks exclusively at the hedging commitments for thetwo nearest years, it is necessary to place this into perspective with respect tothe total hedge book to full tenure. This is shown below.

Gold Derivatives: The Market View32
• While 75% of contributors maintained they had control over the choice ofproducts, a further 23% noted that their counterparties had some input intothis decision;
• Life of mine and set policies (in that order) provided the framework for hedg-ing tenure. The price of gold and the lease rates proved to be the most impor-tant factors with respect to how a specific hedge was executed;
• Most hedging is now dynamic and reiterative, although still embodied in aframework normally laid out by the board of directors;
• 84% of the contributors felt completely confident that they could adequatelymonitor the health of their hedge book although many made use of externalaudit expertise. This level of confidence remained intact post September 26th.70% felt that they had the in-house expertise to analyse new derivative prod-ucts on offer;
• 16% of the contributors acknowledged that their hedge book played a role inlong-term decision making, especially with respect to possible mine closuresand production plans. This percentage increased to 21% when it came to therole of the hedge book in exploration planning. There was a strong correlationbetween the reliance on the hedge book and geographical region, with Austral-ian mining companies more likely to rely on the hedge book than the SouthAfricans. There was also a strong correlation between the use of the hedge bookin long-term decision-making and the structure of the company. The morejunior the company, the more likely it was to rely on the hedge book. Theconclusions drawn from these results are very significant. Analysis to date cov-ering the impact of hedging on the gold price has been confined to the imme-diate and then longer-term influence of the products themselves and the waythey are offset into the market. Given the fact that hedging is a relatively newphenomenon, very little work had historically been completed assessing theimpact that hedging could have had on the longer term structure as a directresult of decision-making based on the existence of the global hedge book.Thus it is possible that hedging could have had a number of influences on thesupply of gold to the market which may not be immediately apparent. It cer-tainly has delayed mine closure. But less obviously, it might have influencedthe restructuring of the primary industry, delaying mergers and the acquisitionof junior companies. Furthermore there is reason to suggest that the existence ofhedge books supported (or even subsidised), at least for some while, explorationbudgets, the results of which might have materially added to reserve bases;
• Most contributors were satisfied with the service they received from the com-mercial banks. Others felt that bullion trading was still over-banked despitethe restructuring and attrition experienced in recent years and were less happy.

Gold Derivatives: The Market View 33
Sovereign risk issues, company restructuring, balance sheet constraints andproject specific problems were all issues cited as marring counterparty relation-ships. Project financing and the associated hedging requirements on the part ofthe bullion banks has often generated counterparty difficulties;
• Only half a dozen contributors were subject to margin with all theircounterparties. A generally margin-free industry, which has evolved over thepast five years, is indicative of the degree to which the producers have been thedominant partners in the hedging relationships and shows the extent to whichthe commercial banks have vied to secure hedging business;
• A little over 50% of contributors acknowledged that their collective hedgingactivities could have had a negative influence on the gold price (a number ofrespondents elected not to address this question). This, however did not pre-clude the decision to hedge nor did the concerns of shareholders. Many com-panies have gone to great lengths to educate stakeholders and keep them fullybriefed with respect to hedging;
• Mining company attitudes towards official sector sales varied across the board.Some expressed their dismay at sales programmes; others were more pragmatic.The industry in general is substantially more comfortable with central banklending, as opposed to outright sales.
Chapter 3: the commercial banks
• There are currently a little over two dozen commercial banks actively involvedin bullion banking;
• The organisation of the bullion banking community is currently very fluid andhighly competitive. Over time, very marked regional and sectoral patterns haveemerged in which various permutations and combinations of the existing banksdominate;
• Our analysis showed the following:- There are no more than eight major participants in derivatives and another
five which we would define as second tier (as opposed to market markers);- There are around nine major participants in the spot market in London;- There are up to ten major participants in the spot market in Europe, in-
cluding five which are active in the physical market;- There are nine major participants in the forward market in Europe;- There are four major participants in the Australasian markets;- There are ten participants who have a particularly or reasonably strong
presence in the fund industry;- There are seven participants who have a particularly strong presence in the

Gold Derivatives: The Market View34
official sector;- There are seven participants who have a particularly strong presence in the
mining sector;- Eight banks have particularly active proprietary trading operations;
• Derivative statistics in the public domain associated with a number of com-mercial banks should be treated with caution for fear of drawing erroneousconclusions. While enlightening in part, their limitations should be recog-nised from the outset. In particular, published data do not generally provide aguide to underlying exposure;
• The bullion banks have a number of market-related functions. They are buy-ers, sellers, stock holders and distributors of metal; a number are market mak-ers involved in the active quotation of two-way prices. They are also providersof credit, act as intermediaries in the lending market, create derivative productsand some trade to their own accounts although the levels of proprietary tradingare substantially lower than public commentary suggests;
• The bullion banking industry has been subject to considerable restructuringover the past decade. The gold price itself, but more importantly, the sharplylower gold price volatility over the years contributed largely to the changingfortunes experienced by the bullion bankers. Lower volatility combined withmarkedly lower trading ranges imply tighter bid/offer spreads and less profitmargin;
• The derivatives (as opposed to physical trading) have offered a substantiallymore rewarding profit profile for the bullion banks. Firstly, there has beenenormous demand for derivative products especially in the wake of the Austral-ian and North American mining booms of the mid-1980s. Secondly, the vari-ety of products emerging as the OTC market evolved as swiftly as it did, im-plied initially that many products being marketed were individually priced.The individual pricing provided the banks with considerable latitude withrespect to price variation. But, with time, it was inevitable that this componentof bullion banking soon became increasingly more competitive and profit mar-gins have consistently been eroded away. Since the Washington Agreement andthe very obvious move away from exotic and leverage products and back tovanilla instruments, we expect this erosion of profit margin to continue;
• The restructuring of bullion banking has manifested itself in a number of ways.The withdrawal of a bank from the business is final whereas mergers and acqui-sitions more often than not result in the duplication of services and skills. Theeffect this has on credit is probably the most important issue;
• Whichever way the restructuring manifests itself, these developments have had
Gold Derivatives: The Market View 35
both positive and negative effects on the gold market but in general we main-tain that a contraction of bullion banking is deleterious to the longer-termhealth of the industry;
• Mergers and buy-outs create fewer but larger entities and have concentratedbullion banking in the presence of a handful of existing banks. This concentra-tion increases those banks’ market shares but detracts from healthy competi-tion when it comes to product creation, pricing, marketing and perhaps evencustomer service. On the more positive side, this increased visibility and pro-file of the very large banks has given smaller banks and newcomers to the mar-ket, a window of opportunity to expand their market share and gain a footholdin a market that would otherwise have remained impenetrable. Niche marketsexist in many areas of bullion banking and this will continue to evidence itselfprovided the presence of the majors does not overwhelm their more juniorcompetitors and leave them no room for operation;
• The availability of credit to the gold industry is another area greatly influencedby the restructuring of bullion banking. The shrinkage in the number of banksactive in the gold market implies less in the way of credit lines for all the majorusers of gold-based products, derivatives or otherwise. Thus credit potential ingeneral has been on the decline. In many producing countries the credit lines,because of sovereign issues, might have been limited to begin with and therestructuring has only exacerbated the problem. Sovereignty more often thannot accounts for the lion’s share of the existing credit facilities;
• The fact that the mining industry has over the years succeeded in negotiatingout of most hedging agreements reference to margin, implies that the hedgingand lease rate exposures at risk during the fourth quarter of 1999 remainedlargely on the books of the banks. The Washington Agreement clearly gener-ated within the banking community a considerable rethink with respect tocredit analysis, risk and extension;
• Given the heightened concerns regarding margin and credit we anticipate thatthe banks will require from the mining community a substantially greater de-gree of disclosure with respect to a number of parameters associated with pricerisk management. This could include:- More formalised descriptions of the company’s hedging philosophy detail-
ing the rationale behind the decision, the overall framework of the programmeas it relates to current and planned production and, more importantly,reserves;
- A more formalised description of the reporting hierarchy and levels ofdecision-making and hedging responsibilities within the mining company;
- Greater disclosure of product usage and the overall levels of hedgingexposure. This necessarily implies exposure as it relates to other counterparties
Gold Derivatives: The Market View36
together with greater disclosure as to how the resultant hedge exposure ismonitored both internally and externally;
- Further details of accounting practices and the company’s preparedness forthe introduction of the new accounting standards;
• The price at which reserves in the ground are valued by the various miningcompanies will no doubt come into focus. The longer the gold price remainsconvincingly below $300/oz, the greater the probability of this becoming anincreasingly more important issue for the bullion banks;
• The Washington Agreement has had a profound effect on product creation.Derivative users, especially the mining companies, are already showing a dis-tinct lack of appetite for the more complex products which in turn will reducethe incentive on the part of the commercial banks to generate new and perhapsoutlandish mechanisms. This will no doubt have an impact on the profitabilityof bullion banking;
• The Washington Agreement has also probably encouraged a further and con-tinued restructuring of the industry that will concentrate the business evenmore in the hands of a few dominant trading entities;
• Over the past decade total trading limits associated with the counterpartieshave declined. While net trading limits (outright uncovered exposures) in thelate 1980s and early 1990s might have collectively totalled 10 million ounces,the state of affairs today is considerably more conservative. Our analysis of thetwo dozen banks involved yielded an estimate of 2.5 to 3.5 million ounceswith any evidence of limits collectively extending towards 5 million ounces consid-ered a possibility only under extreme circumstances. Furthermore, since itwould be most unusual for all the banks to be simultaneously either net short ornet long, the estimate of collective limits should be seen as a maximum extreme;
• These figures pertaining to outright exposures need to be compared with thegross turnover statistics that are made public. The regulator of national banksin the United States (the Office of the Comptroller of the Currency - OCC)publishes a quarterly report on the derivatives activities of US commercial banks,which has recently attracted some attention. The report for the fourth quarterof 1999 shows that the notional value of the off-balance sheet exposure of the416 commercial banks regulated by the OCC in gold derivatives stood at $87.6billion. Of this total $71.9 billion is attributable to just three banks (Chase,Morgan Guaranty and Citibank). At current gold prices, this corresponds toaround 9,600 tonnes of gold. Similar, although not entirely comparable, datapublished by the Bank for International Settlements (BIS) suggested that no-tional accounts outstanding of gold derivatives at end-December 1999 for majorcommercial banks in the G10 countries was $243 billion.

Gold Derivatives: The Market View 37
• Firstly, the limitations associated with these statistics should be noted:- They represent grossed-up total turnover figures associated with substan-
tially smaller net exposures and thus can give a very distorted picture of theactual underlying derivative positions;
- They cover commercial banks only and thus exclude partnerships and trad-ing entities not registered to take bank deposits;
- OCC data address commercial banks in the United States alone and thusexclude trading associated with European and Japanese bullion banks. BISfigures cover deposit-taking banks in the G10.
• The concept of grossed-up turnover requires further discussion since if taken atface value these figures could appear concerning. We believe that this out-standing position should not be described as “exposure”. A more objective de-scription would be a commercial banking presence in gold-based derivatives.Derivative positions are increasingly traded on the markets and each such tradeincreases the “gross notional exposure” figure, though it may be undertaken tooffset or hedge an initial risk;
• The OCC reports detailing the total trading volumes of the US commercialbanks noted that proprietary trading against all derivatives (not just gold) rep-resented 4% of the overall volume. As regards gold, our research revealed thatthere is a full spectrum of proprietary trading habits among the bullion banksand no generalisations can be made. For some whose policy it is to take onlyvery limited positions to their own account, the figure of 4% is obviously sub-stantially too high. For others, this proved to be too low and representations ofanything towards 8-10% or in limited cases, even higher, could be deemedmore appropriate. Furthermore there appears to be no correlation between thepropensity to trade to own account and size or presence in the market. Bankswith substantial market-making facilities and a large exposure to gold may ormay not be aggressive proprietary traders. Conversely, those banks with a smallerpresence in the market, lower trading limits as well as being niche marketspecialists might just as commonly be relatively aggressive proprietary traders;
• The level of proprietary trading can also vary considerably depending on themarket used. Many of those interviewed suggested that 4% in the spot or cashmarket might in fact be a little low whereas it might be overstating that truepicture with respect to the forward and options markets.
Chapter 4: The funds and money under management
• Hedge fund trading habits have been subject to much speculation over theyears and associated all too often with exaggerated claims based on precious littlein the way of fact. As a consequence, the money-under-management industryhas regularly been cited as the villain of the piece during times of markedly

Gold Derivatives: The Market View38
increased price volatility, often when there is simply a dearth of other accept-able and readily apparent explanations. This situation is compounded by theabsence of any reliable public domain data that renders such claims difficult toprove or refute;
• Without an appreciation of the money-under-management industry in its en-tirety, it makes little sense in trying to isolate and draw conclusions about thoseindividual trading entities that may be actively involved in the gold market;
• The state of health of the overall industry gives a good indication of whatmight be expected from specific funds. For example, if the industry as a wholeis in an aggressively expansionary phase with robust capital inflows respondingto a period of strong financial performance, we must acknowledge that thosefunds with an interest in gold might well be in a position to step up theiractivities. The converse also holds true;
• Recent developments within the fund industry suggest a marked change instrategic thinking on the part of some of the major trading entities. This islikely to have a far-reaching impact on their attitudes towards precious metalsand taking exposure in those markets;
• The fund industry as it influences the gold market can be subdivided into twobroad categories, namely the momentum traders and the hedge funds;
• The momentum traders or Commodity Trading Advisors (CTAs) tend tobe technically driven entities whose managers have little understanding orinterest in the commodities or instruments in which they have exposure. Theirtrading decisions are taken purely on the basis of price movements and techni-cal trends, which render their exposure to commodities usually short-term innature. They are, therefore, price followers and tend to be more active duringperiods of higher price volatility. There are several hundred of these CTAswhich have the charter to trade gold. Since they tend to have relatively smallcapital bases (although there are some very notable exceptions), their indi-vidual trading behaviour is of little consequence. However, their collective ac-tivity in the market, particularly since they are technical trend followers, can cer-tainly have a marked influence on the gold price, specifically in the short term;
• In terms of trading mechanisms, momentum traders are in general confined toExchange traded products and tend not to have the brief to make use of theOTC market, although there are again some notable exceptions. The fact thatthe majority make virtually exclusive use of the Exchanges, renders their activi-ties substantially more visible than the hedge funds. Thus their presence canbe tracked with reasonable accuracy through the Exchange statistics, which arepublished regularly;
Gold Derivatives: The Market View 39
• Since early 1995, the momentum traders have maintained an almost continu-ously short position in the gold market. As at the end of June 1999, thesetrading entities accounted for a short position of 254 tonnes. By December1999, these shorts stood at a mere 7 tonnes, having been covered in as part ofthe market’s immediate reaction to the Washington Agreement and subsequentprice rally during the fourth quarter of the year. During the first three monthsof 2000, the net short positions had been reduced even further and in factstood by mid-March at a net long position of some 46 tonnes. By mid-year,this long position has once again reversed itself and the momentum traderswere collectively short to the tune of 135 tonnes (to the end of May);
• The hedge funds represent a totally different presence in the gold market.Many of the managers of these funds are primarily fundamentalists in theiranalytical approach, often having a thorough understanding of the supply anddemand components of the markets in which they are exposed. With consider-ably higher capital bases compared with the CTAs, the ability to borrow againstthese bases to gain maximum leverage and the charters to make use of the OTCmarket, they have the potential to make their presence felt. These are theentities primarily involved with what has become known as the “carry trade”whereby the gold leasing rate has given hedge funds the incentive to borrowinexpensive metal, sell it short and raise cost-effective dollars;
• In the total absence of published data, this carry trade has given rise to claimsthat the short positions held by the hedge funds have been and still are of amagnitude sufficient to create and sustain a substantial squeeze in the goldprice. Our research has suggested that while there is indeed an element of carrytrade, the total short position that has built up as a result is nothing like thevolumes claimed by others;
• We conclude that less than a dozen major hedge funds are actively involved ingold and by end-June 1999, their collective short position (and that of anyshort position held by the commercial banks through proprietary trading) wasperhaps a little under 400 tonnes. Immediately after the Washington Agree-ment, announced on 26th September 1999, there was clear evidence of shortcovering, which generated some of the momentum behind the subsequentsurge in the gold price. Our information suggests that a good proportion,although perhaps not all, of this short exposure was indeed covered in duringthe fourth quarter of last year. The mere fact that the gold price failed tomaintain its upward momentum at $330/oz and beyond strongly suggeststhat the short positions were indeed substantially less than others have claimed.By the end of December 1999, this short position stood at a little under390 tonnes, marginally lower than the end June period. The reason for theprobable re-establishment of these short positions is most likely as a directresult of the sharp decline in the lease rates during the final months of last

Gold Derivatives: The Market View40
year. This would have no doubt encouraged renewed carry trade borrowing,particularly in the wake of higher interest rates especially in the UnitedStates;
• Early during the second quarter of 2000, the market witnessed the voluntaryliquidation of one of the major hedge funds known to be involved with theprecious metals and specifically the gold carry trade. The fact that this fund inits devolution did not have a substantial impact on the gold price is addedevidence that these enormous short positions simply did not exist;
• Subsequently there was a second press release from another major trading en-tity to the effect that it would be restructuring its numerous funds to renderthem less exposed to high risk trading strategies;
• These two public announcements have substantial bearing on the gold carrytrade. It reduces by a very large margin the amount of managed money thatcould be related to the existing carry trade since these funds accounted for alarge proportion of the associated capital bases. It might also herald a change instrategic thinking which might become commonplace among the remainingfunds which have been known to participate in the gold market. This, however,does not necessarily imply an overnight dissipation of the carry trade phenom-enon since other smaller and perhaps less leveraged funds might step into thebreach. Our research isolated a minimum of over 100 funds that could poten-tially participate in the gold market;
• While gold lease rates remain at a substantial discount to money market rates,the carry trade is likely to remain a feature of the gold market. Only when andif the cost of borrowing gold approaches and remains sustainable at or neardollar interest rates, will the incentive to borrow inexpensive gold be negated.The extent to which funds will still make use of the concept of borrowing cost-effective gold needs to be monitored on a regular basis especially in the light ofrecent developments.

Gold Derivatives: The Market View 41
Introduction and objectives
CHAPTER 1 : THE LENDING MARKET
This chapter addresses liquidity (such as gold lending and gold swaps), the life-blood of the gold derivatives market without which the paper products could notbe created, executed or managed. Our assessment of the total pool of gold liquid-ity might differ a little from that of other market commentators and there is goodreason for this. With the official sector remaining the major source of lent gold,much of the research emphasis, quite understandably, has been placed on thissector. Moreover, many of the commercial banks wishing to attract liquidity can-vass the formal central banking community to the virtual exclusion of all else.Interviews with these banks for research purposes, therefore, give insights prima-rily into this dominant area of the market. There are, however, other existing andpotential sources of lending and every effort has been made in this study to incor-porate statistics on this less visible sector of the market. These sources1 includenon-official gold inventories held by some central banks but not itemised in themainstream public domain data, holdings by quasi-official organisations, for ex-ample, in the Middle and Far East and last but not least, private inventories builtup over time and held over generations across the globe. In terms of volumes,these cumulative inventories are a fraction of official sector holdings. However,given that they are in general free of the bureaucracy and formal decision-makingassociated with the central banking community, their potential to act as the mar-ket swing factor should not be underestimated. Thus throughout this analysis,emphasis is placed on liquidity in general as opposed to total central bank lend-ing in its narrower sense.
The objectives of research into this sector are numerous but the most importantare as follows:
• Firstly, it is essential to generate a detailed database listing the existing andpotential sources of liquidity from which an estimate of the total can be de-duced. The total provides the framework for all further analysis of the deriva-tive market and the way it functions, as well as providing the link between thepool of liquidity and the lease rates. Once established, the updating of thedatabase as market conditions change and lending responds, is a relatively sim-ple matter.
• Following on from this, the second objective is to assess future trends in lend-ing and what this could imply for lease rates. This essentially lies at the heart ofthe whole derivative question and indeed is probably one of the most impor-tant factors with respect to future price discovery. The conclusions are particularly
1 Representing almost 10% of total lending by the end of 1999.

Gold Derivatives: The Market View42
important for the users of derivatives, especially the mining community, andcould well have far-reaching implications for hedging philosophies and prac-tices. Achieving this objective is more difficult than it initially appears. De-tailed analysis of central banking attitudes towards their gold holdings hasrevealed a full spectrum of philosophies. These have ranged from absolute non-participation in the gold market on any level, to board-agreed percentages oflending to specific tenure, through to active management of reserves whichmight include not only lending but also call option writing. Thus no generali-sations can be made and we would consider it totally inappropriate to try.Even the briefest of research into this sector shows very early that one mustaccept that central banks are as individual as the decision-makers that runthem and as unique as the countries which they serve. Perhaps the only com-mon factor among the official sector members is that each is, to a greater orlesser degree, a holder of gold.
• The third objective is to use the analysis of market liquidity as a benchmarkfrom which a “supply/demand” balance of lent metal can be constructed. Hav-ing established where the gold comes from and in what volume, one thenneeds to ascertain where it goes. By doing this, one can then cross-check esti-mates of trading positions held on the part of commercial banks to their ownaccounts and the hedge funds.
• A fourth objective is to analyse the Washington Agreement on Gold (WAG),announced on September 26th 1999, which has clearly already had far-reach-ing implications for the lending market and the way in which lenders perceivetheir own presence as a source of liquidity. How this is going to influence thestructure of the lending market is vital in identifying future lease rate trends.
• Finally, we raise one particular issue for further debate. Following on from anydiscussion of the lending market which incorporates an analysis of the Wash-ington Agreement, is the question of whether or not higher than average leaserates are firstly, achievable and secondly, sustainable under current market cir-cumstances? This then leads to the question of whether or not higher lease rateswould actually contribute initially to a more stable market and consequentlyto a healthier gold price? And if they do, we begin to address at what cost thiscould come to the various sectors of the gold market.
All these issues are addressed in this chapter with the exception of the supply/demand balance, which is covered in the summary of this report, and the debat-ing issue which is presented in chapter 6.

Gold Derivatives: The Market View 43
The data
The volume of gold lent into the market has shown robust growth over the lastdecade, more than doubling every five years. This is shown in the following table:
Data source: 1990 & 1995: Cross, J.H., The Changing Relationship Between the Central Banks and theGold Market in the Late 1990s, paper for the Financial Times Conference, Venice, June, 1996. 1999data: Virtual Metals Research and Consulting
As the table indicates, for direct comparison with earlier work, the year-end 1999figures exclude private sector lending. If the analysis includes these figures andother non-country specific liquidity, the total increases to 5,230 tonnes as of theend of December 1999, down from a maximum of 5,500 tonnes during the fewweeks immediately after the announcement of the Washington Agreement2 andup from 4,904 tonnes at end-June 1999. The breakdown by region is shown inthe following chart and demonstrates the importance of Europe as a lending bloc.
2The period immediately post September 26th was characterised by remarkable fluidity in the lendingmarket, the details of which are discussed later in this chapter.
Gold on deposit – tonnes% growth
1990 9001995 2,100 133End 1999* 4,709 124
* For direct comparison excludes private sector
This growth is a result of two inter-related developments, both of which havebeen features of the lending market throughout the 1990s.
GOLD LIQUIDITY BY REGION Dec 1999 Total 5,230 Tonnes
Other Countries18% Asia
12%
Europe45%Latin America
9%
Other Sources13%
Africa3%
* Other sources include the BIS (own lending only) and private lending
*
Official sector liquidity 1990-1999
Gold Derivatives: The Market View44
Firstly, within the framework of modern day portfolio management theory, thereexists a new generation of central bankers who consider that maintaining a non-interest bearing asset in a portfolio is simply no longer appropriate. Secondly, thewidespread use of derivatives has generated a growing need for lent gold and theconcept of participating in the leasing market has been actively marketed to theofficial sector by the commercial banks.
In essence, the lending market has been responding to the forces of supply anddemand and these developments are clearly reflected in the lease rates. To thisextent, one can accept that, prior to September 26th, the lending market wasoperating with reasonable efficiency, in the narrow economic sense of the word,despite the obvious inelasticity of a number of sources of supply. Post the Wash-ington Agreement, the situation has changed and this is an added reason fordiscussing the announcement in detail.
Apart from increases in the overall level of lending, there have also been someimportant changes in the structure of the market. When completing his researchin 1996, James Cross noted that 69 countries were active lenders and had on loanan average of 27% of their holdings. The research approach in this study issomewhat different and yet arrives at a result broadly in line with this earlierwork. We have assessed 118 countries (those whose gold reserves we can trackeither through public statistics or by means of direct contact with the banksconcerned) and included them all in the analysis regardless of whether they lendor not3 . This obviously has a dramatic effect on the average percentages lent byregion, especially when it comes to the inclusion of the non-lenders, for examplethe USA, Japan and the IMF. When all official reserves are accounted for, the totalpercentage lent stands at 14% of gold holdings. Remove from this calculationthe three non-lenders already mentioned, as well as the European countries thatdo not lend, and the overall percentage increases to 25%. Further details of thepercentage committed to the lending market are given in appendix 1.
This total figure actually masks some extremely interesting regional differences,which immediately give insights into the potential new lending or, indeed lackthereof, especially post the Washington Agreement. Our analysis showed thatthe Latin American countries on average have the greatest percentage of reserveson loan (or on swap), in excess of 50%. Australia and Africa averaged a little over25% and 35% respectively. The “other countries”, which included the USA, aver-aged 10%; a figure that obviously increased dramatically (to a little under 50%)when the USA was excluded from the analysis. Interestingly, within this broadcategory, the Eastern European bloc revealed a high level of lending in percentageterms, although of course from a relatively low base in volume terms. Finally with
3 The rationale behind this is that it can then easily accommodate updating changes in both lending andholding policies, such as the recent developments in Kuwait, Jordan and Malaysia respectively.

Gold Derivatives: The Market View 45
Western European lending on average at 15% and representing 45% of totalexisting liquidity, the importance of the Washington Agreement again becomesfully apparent.
As already alluded to, in terms of lending attitudes, a full spectrum of philoso-phies and practices evidenced themselves during the research. A result that wasperhaps rather surprising was confirmation that the formal official sector collec-tively is substantially less sensitive to lease rate movements than originally mighthave been expected. Decisions whether to lend at all, and at what level, appear tobe taken for reasons often totally divorced from the performance in the lease rates.Having said this, there are indeed lenders who do react swiftly to developments inthe lending market, some of which are contributors of considerable existing, aswell as potential, volume. But in terms of numbers, they are relatively few and farbetween. Substantially more widespread is an artificial and largely arbitrary limitplaced on lending in terms of volume (as opposed to percentage), which thenoperates under normal lease rate conditions. This decision is taken at board leveland then implemented, irrespective of developments in the lending market, ex-cept in most unusual circumstances. A number of countries - for example, Korea,Switzerland and the Netherlands - have reported their lending limits in just thismanner. In the absence of measurable price elasticity, the implication is a lessmarket-orientated structure and one substantially more subject to bureaucraticdecision-making.
The extent to which this situation could change, post the Washington Agree-ment, is of great relevance to future lease rate behaviour. Thus the question mustbe asked: will the Washington Agreement precipitate a re-assessment of lendingpolicies currently in place by non-Agreement countries? If so, will the Agreementrender lending policies by non-signatories more or even less lease rate sensitive?Of all the findings to come out of this study, this is one area recommended forfurther and continued research and monitoring.
With respect to tenure and the period out to which the official sector is comfort-able lending, the research also revealed some rather surprising results.
A widespread observation made by the commercial banks during interviews wasthe fact that the official sector was increasingly more willing to lend out for pro-gressively longer periods, primarily via the use of lease rates swaps4 . This appliednot only to existing lenders but also to newcomers to the market who initiallylent out mainly into the 1 month but, with time, were increasingly prepared toroll their lending into the 3 and 6 months. Intuitively, this is certainly whatmight be expected. However, statistically we could find no empirical evidence to
4 These products are discussed in detail in chapter 5. They should, however, be immediately identified asbeing very different to some of the more leveraged lease rate products used until recently by the miningindustry.
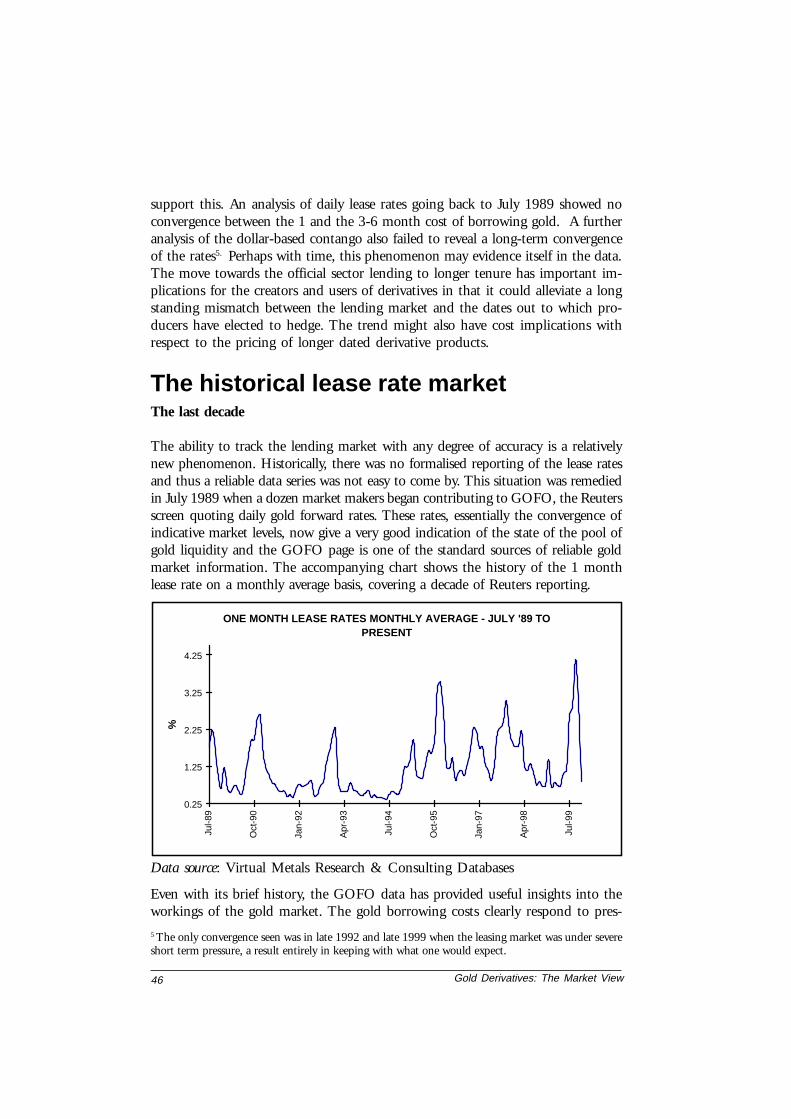
Gold Derivatives: The Market View46
Even with its brief history, the GOFO data has provided useful insights into theworkings of the gold market. The gold borrowing costs clearly respond to pres-
The historical lease rate marketThe last decade
The ability to track the lending market with any degree of accuracy is a relativelynew phenomenon. Historically, there was no formalised reporting of the lease ratesand thus a reliable data series was not easy to come by. This situation was remediedin July 1989 when a dozen market makers began contributing to GOFO, the Reutersscreen quoting daily gold forward rates. These rates, essentially the convergence ofindicative market levels, now give a very good indication of the state of the pool ofgold liquidity and the GOFO page is one of the standard sources of reliable goldmarket information. The accompanying chart shows the history of the 1 monthlease rate on a monthly average basis, covering a decade of Reuters reporting.
support this. An analysis of daily lease rates going back to July 1989 showed noconvergence between the 1 and the 3-6 month cost of borrowing gold. A furtheranalysis of the dollar-based contango also failed to reveal a long-term convergenceof the rates5. Perhaps with time, this phenomenon may evidence itself in the data.The move towards the official sector lending to longer tenure has important im-plications for the creators and users of derivatives in that it could alleviate a longstanding mismatch between the lending market and the dates out to which pro-ducers have elected to hedge. The trend might also have cost implications withrespect to the pricing of longer dated derivative products.
ONE MONTH LEASE RATES MONTHLY AVERAGE - JULY '89 TO PRESENT
0.25
1.25
2.25
3.25
4.25
Jul-8
9
Oct
-90
Jan-
92
Apr
-93
Jul-9
4
Oct
-95
Jan-
97
Apr
-98
Jul-9
9
%
Data source: Virtual Metals Research & Consulting Databases
5 The only convergence seen was in late 1992 and late 1999 when the leasing market was under severeshort term pressure, a result entirely in keeping with what one would expect.
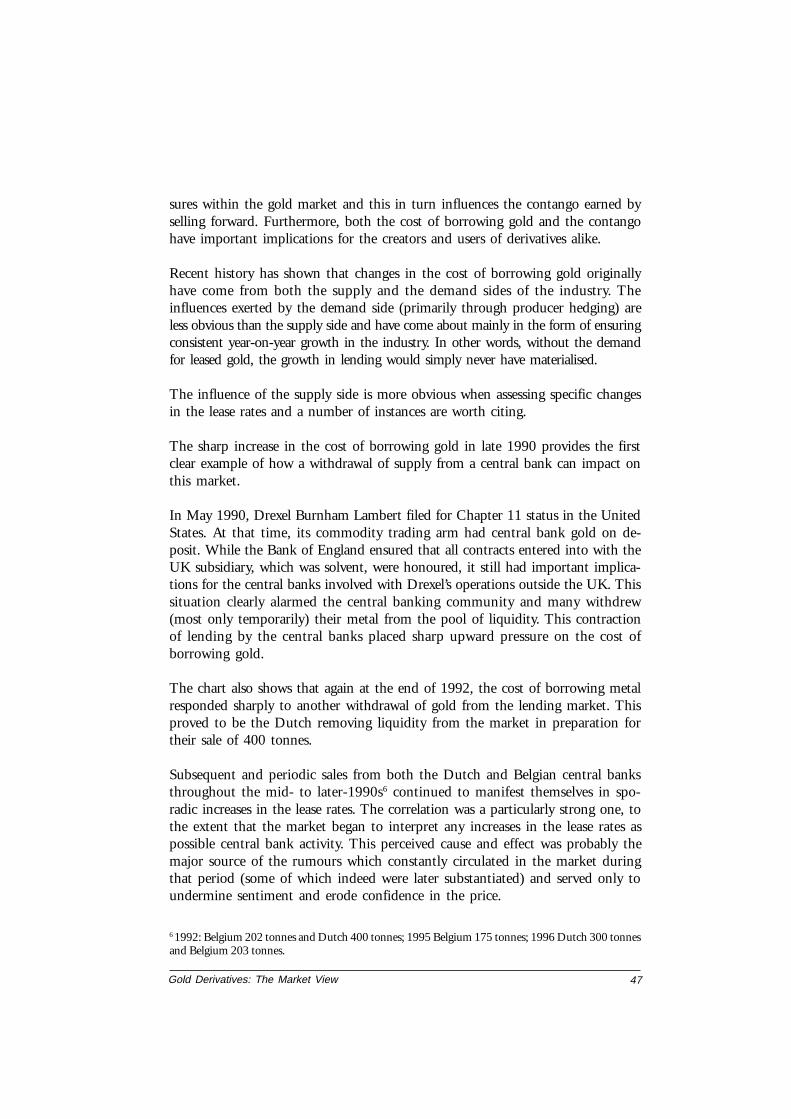
Gold Derivatives: The Market View 47
6 1992: Belgium 202 tonnes and Dutch 400 tonnes; 1995 Belgium 175 tonnes; 1996 Dutch 300 tonnesand Belgium 203 tonnes.
sures within the gold market and this in turn influences the contango earned byselling forward. Furthermore, both the cost of borrowing gold and the contangohave important implications for the creators and users of derivatives alike.
Recent history has shown that changes in the cost of borrowing gold originallyhave come from both the supply and the demand sides of the industry. Theinfluences exerted by the demand side (primarily through producer hedging) areless obvious than the supply side and have come about mainly in the form of ensuringconsistent year-on-year growth in the industry. In other words, without the demandfor leased gold, the growth in lending would simply never have materialised.
The influence of the supply side is more obvious when assessing specific changesin the lease rates and a number of instances are worth citing.
The sharp increase in the cost of borrowing gold in late 1990 provides the firstclear example of how a withdrawal of supply from a central bank can impact onthis market.
In May 1990, Drexel Burnham Lambert filed for Chapter 11 status in the UnitedStates. At that time, its commodity trading arm had central bank gold on de-posit. While the Bank of England ensured that all contracts entered into with theUK subsidiary, which was solvent, were honoured, it still had important implica-tions for the central banks involved with Drexel’s operations outside the UK. Thissituation clearly alarmed the central banking community and many withdrew(most only temporarily) their metal from the pool of liquidity. This contractionof lending by the central banks placed sharp upward pressure on the cost ofborrowing gold.
The chart also shows that again at the end of 1992, the cost of borrowing metalresponded sharply to another withdrawal of gold from the lending market. Thisproved to be the Dutch removing liquidity from the market in preparation fortheir sale of 400 tonnes.
Subsequent and periodic sales from both the Dutch and Belgian central banksthroughout the mid- to later-1990s6 continued to manifest themselves in spo-radic increases in the lease rates. The correlation was a particularly strong one, tothe extent that the market began to interpret any increases in the lease rates aspossible central bank activity. This perceived cause and effect was probably themajor source of the rumours which constantly circulated in the market duringthat period (some of which indeed were later substantiated) and served only toundermine sentiment and erode confidence in the price.
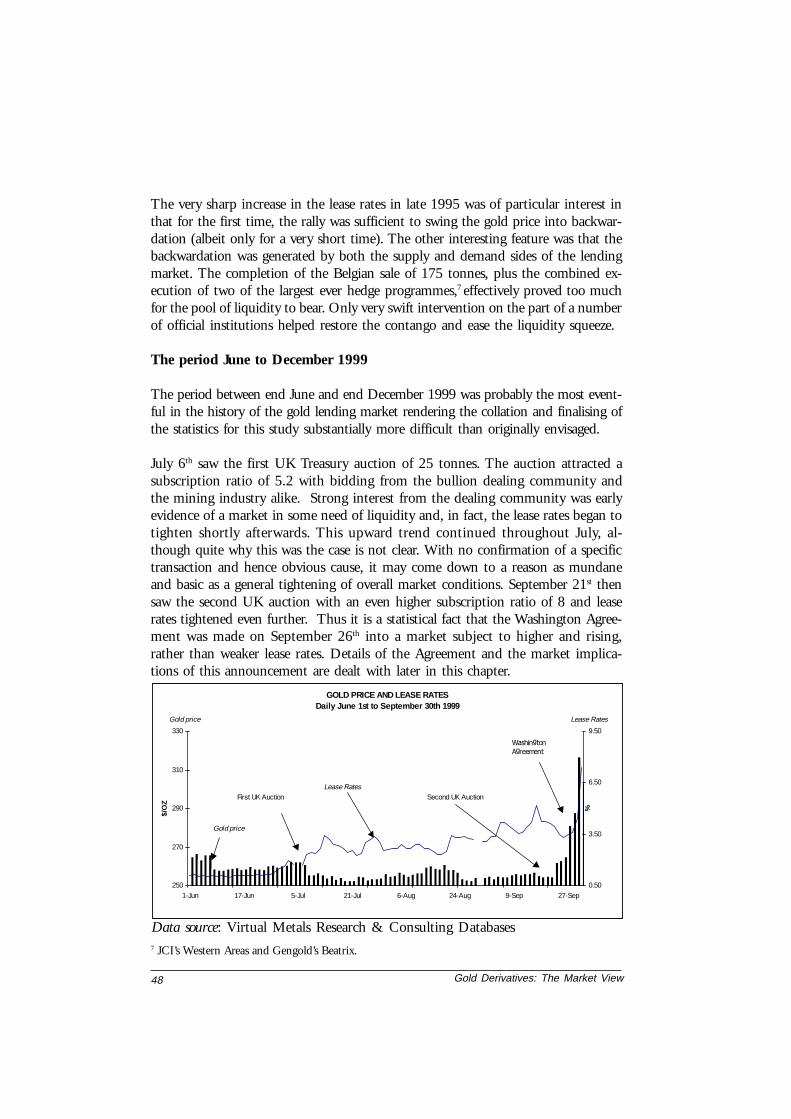
Gold Derivatives: The Market View48
The very sharp increase in the lease rates in late 1995 was of particular interest inthat for the first time, the rally was sufficient to swing the gold price into backwar-dation (albeit only for a very short time). The other interesting feature was that thebackwardation was generated by both the supply and demand sides of the lendingmarket. The completion of the Belgian sale of 175 tonnes, plus the combined ex-ecution of two of the largest ever hedge programmes,7 effectively proved too muchfor the pool of liquidity to bear. Only very swift intervention on the part of a numberof official institutions helped restore the contango and ease the liquidity squeeze.
The period June to December 1999
The period between end June and end December 1999 was probably the most event-ful in the history of the gold lending market rendering the collation and finalising ofthe statistics for this study substantially more difficult than originally envisaged.
July 6th saw the first UK Treasury auction of 25 tonnes. The auction attracted asubscription ratio of 5.2 with bidding from the bullion dealing community andthe mining industry alike. Strong interest from the dealing community was earlyevidence of a market in some need of liquidity and, in fact, the lease rates began totighten shortly afterwards. This upward trend continued throughout July, al-though quite why this was the case is not clear. With no confirmation of a specifictransaction and hence obvious cause, it may come down to a reason as mundaneand basic as a general tightening of overall market conditions. September 21st thensaw the second UK auction with an even higher subscription ratio of 8 and leaserates tightened even further. Thus it is a statistical fact that the Washington Agree-ment was made on September 26th into a market subject to higher and rising,rather than weaker lease rates. Details of the Agreement and the market implica-tions of this announcement are dealt with later in this chapter.
Data source: Virtual Metals Research & Consulting Databases
GOLD PRICE AND LEASE RATESDaily June 1st to September 30th 1999
250
270
290
310
330
1-Jun 17-Jun 5-Jul 21-Jul 6-Aug 24-Aug 9-Sep 27-Sep
$/O
Z
0.50
3.50
6.50
9.50
%
Washington
Agreement
First UK Auction Second UK Auction
Gold price Lease Rates
Gold price
Lease Rates
7 JCI’s Western Areas and Gengold’s Beatrix.

Gold Derivatives: The Market View 49
The Washington Agreement on Gold – aninterpretation
On Sunday 26th September 1999, the members of the European Community(excluding Denmark and Greece), together with Switzerland, announced the fol-lowing (referred to in this study as the Washington Agreement):
1. In future, the signatories of the Agreement would limit gold sales to thoseprogrammes already decided upon and would execute them at a rate of ap-proximately 400 tonnes per annum not exceeding 2,000 tonnes over the nextfive years. Beyond five years, the agreement would be reviewed.
2. The signatories would limit new lending to the market to the extent that theyhad already lent gold and no new gold would be placed on deposit.
Those not signing the Agreement included Canada, USA, Japan, Australia, theBIS and the IMF. Subsequent to the announcement, the USA confirmed that itwould be neither a buyer or seller. Japan confirmed its non-sale policy and theIMF and BIS confirmed that they would abide by the spirit of the Agreement.
The Agreement was entered into with the express intention of creating and en-couraging a more transparent gold market and one that exhibits greater stability.While the immediate reaction of many gold sectors may not have given the im-pression of a market moving towards greater equilibrium and stability, (in factquite the contrary!) a detailed analysis of the events and the circumstances isnecessary to place the Agreement into the correct context, particularly with re-spect to the longer term.
Our interpretation of the Agreement is as follows:
• The total volume of metal intended for sale during the five-year period wasdecided on at the time of signature; the implication being that no memberscan now, or within the five-year Agreement, change their minds and elect tooffer gold to the market;
November then witnessed the third UK Treasury auction. At 2.1 times over-subscribed, there was considerably less interest shown than in the two previoussales. If the successful bidding on the part of a major gold miner is excluded, thendemand for the UK gold was even lower than immediately apparent. The goldprice responded accordingly. Without much time to recover it was then subjectto the Dutch announcement of the intended sale of 300 tonnes over five years,with the first 100 tonnes in the first year of the Washington Agreement.

Gold Derivatives: The Market View50
• Those that have declared their intention to sell gold within the five-year periodare not duty bound to execute those transactions and sales could be conceivablyless than the 2,000 tonne allowance;
• There has been subsequent confirmation that the Swiss intend to sell their entireplanned 1,300 tonnes within the five-year period and thus this sale will notextend beyond the initial Agreement period. Sales began on May 1st, 2000;
• Those members who are currently active lenders of gold are not duty bound tomaintain their levels of lending. Thus the presence of the signatory countries inthe lending market could decline in both absolute and relative terms. How-ever, under the Agreement, signatory lending cannot increase beyond the levelsestablished at the time of signing;
• In attempting to create a more transparent gold market, we assume that the Agree-ment was signed with the intention of removing a good deal of the uncertainty thatwas associated with previous sales, especially those of the Dutch and the Belgians;
• One concept which the Agreement press release did not deal with, was how thesignatories intended to create or encourage a more stable market. Was it in-tended to be exclusively via the announced sales programme, which affordedthe market a degree of clarity and removed a good deal of the uncertainty thathad plagued the market throughout the 1990s? Or did the signatories anticipatethat the lending moratorium might equally play a role by perhaps encouraginghigher rather than lower leases? Did the signatories intend to reduce the level ofcarry trade and general speculative short selling of the market via the lease rates?In other words, can we assume that the implicit intention of the Agreement wasto encourage an environment of higher rather than lower lease rates?
Analysis of the Washington Agreement onGold and the prognosis for the future
With the benefit of some months of hindsight, it is fair to say that the Washing-ton Agreement has provided the gold market with a series of outcomes, which areintriguingly paradoxical. With respect to the producer’s approach to hedging anddevelopments within the commercial banking sector, especially as regards creditissues, the Agreement has effectively altered irrevocably the structure of the mar-ket. The consequences of this need to be assessed if we are to understand fully theimplications for the derivative industry. However, with respect to developmentsin the lease rates, the Agreement appears to have only impacted in the very shortterm. The medium-term outlook seems unchanged with a “business as usual”outcome foreseen as the most likely result.

Gold Derivatives: The Market View 51
ONE MONTH LEASE RATES Monthly Average- July 1989 to June 2000
0.25
1.25
2.25
3.25
4.25
Jul-8
9
Oct
-90
Jan-
92
Apr
-93
Jul-9
4
Oct
-95
Jan-
97
Apr
-98
Jul-9
9
%
The historical averages, low compared with the majority of money market rates,ensured, on average, a very attractive contango for gold and over the years thisencouraged the use of derivative instruments designed to secure price protectionon the short side. It also encouraged the carry trade whereby relatively inexpen-sive gold was borrowed to raise cost-effective dollars.
Data source: Virtual Metals Research & Consulting Databases
The immediate impact of the Washington Agreement on Gold
In terms of immediate market reaction (rightly or wrongly), the first statement ofthe Agreement, namely the limiting of sales to around 400 tonnes per annum,probably received substantially less response and coverage than might have beenthe case if it had been the only announcement made by the signatories. Over-shadowing the sales announcement, by an order of magnitude, was the secondpart of the announcement, that being the moratorium on new lending. It is themoratorium that is central to any assessment of the lending market.
Prior to the announcement, the lending market operated under the basic premisethat it would never be starved of liquidity for any period long enough to influencelease rates for more than a matter of days. Therefore, with the exception of thevery brief backwardation experienced in 1995, the gold market was expected toremain in contango. Consequently, and virtually without exception, all derivativeproducts that subsequently evolved were structured on this premise.
Past lease rates since the launch of GOFO are shown in the following chart.

Gold Derivatives: The Market View52
8 An analysis of the various products and their influence on the short-term gold price is set out in chapter 5.
While it is very difficult (if not impossible) to isolate the exact cause and effect,the perceived unlimited source of lent gold which in turn kept lease rates low,certainly played its role in capping the gold price. As was pointed out in theSummary of this report, this of course was not the only factor, but we must acceptthat this was an influence. Thus, this lease rate regime coupled with a pro-longed, weak and seemingly ever declining gold price only served to encour-age further short positions held primarily by the mining companies and theassociated bullion banks but also by the funds. The size of these short posi-tions gradually increased over time but, more importantly, the overall posi-tion began showing markedly increased complexity and leverage in terms ofthe products that were being favoured, particularly those being actively usedby the mining companies8 .
Faced with constantly declining prices (approaching total operating costs), themining industry felt obliged to seek ever more sophisticated ways to enhance therealised prices they could secure and report to shareholders. The data shows thatthese higher prices were achieved by entering into a combination of option strat-egies and the use of various types of products associated with the lease rates. Thelonger the financial climate remained intact, the greater the incentive for themining community to tie a greater proportion of their planned output, and insome cases, reserves to more complex derivative strategies. The total global hedgebook therefore evolved swiftly, based on the premise that lease rates would remaincomparatively low and reasonably stable.
MONTHLY AVERAGE GOLD PRICEJanuary 1990 to August 1999
250
270
290
310
330
350
370
390
410
430
1990 1991 1992 1993 1994 1995 1996 1997 1998 1999
$/OZ
Data source: Virtual Metals Research & Consulting Databases

Gold Derivatives: The Market View 53
The low lease rates also encouraged what has become known as the carry trade.Seen by a handful of large hedge funds as an inexpensive means of raising dollars,these entities were content to short the gold market particularly in a climate ofdeclining gold prices that was unlikely to place any pressure on their exposures.Declining prices in turn attracted into the market the technical or momentumfund managers who merely served to contribute to the growing short position ingold9 .
The announcement to the effect that those countries signing the WashingtonAgreement had placed a moratorium on new lending effectively forced the bul-lion banks (and the mining companies) to very rapidly reassess their lease rate andoption exposure.
This is primarily because the signatories were the major potential source of newliquidity and in their absence, the cumulative market realised that it would behard-pushed to find new and substantial sources of lending, particularly at veryshort notice. Thus, in the face of a possible shortage of liquidity to the lendingmarket, the bullion banks rushed to cover their exposures and very quickly achain reaction of events was set in motion during the first week after theannouncement.
From what we can see, it was indeed the bullion banks who initially attempted tocover their lending exposures, doing so by managing their risk out to the fur-ther dated months. One of the major reasons for this was the fact the so fewmining companies were subject to margin and this is addressed in more detailin chapter 2.
The banks’ reaction was a natural one, in the initial belief (and probably hope)that this liquidity squeeze was going to be short in duration. As it happened itwas, but without the knowledge of hindsight, the banks clearly had to assumethe worst. This triggered a series of events that placed enormous pressure on thecost of borrowing gold. As the lease rates at the longer dated end of the curverose, the covering swiftly spread into the nearby months. Thus the longer datedlease rates were the very first to come under pressure although the nearby monthsfollowed soon afterwards and the demand for liquidity was sufficient to tip thegold market into backwardation.
These series of events are shown quite clearly in the accompanying charts.
9 This is discussed in more detail in chapter 4.

Gold Derivatives: The Market View54
3 AND 12 MONTH LEASE RATESDaily 20 Sept-18 Oct 1999
2.00
3.00
4.00
5.00
6.00
7.00
8.00
20-S
ep
22-S
ep
24-S
ep
28-S
ep
30-S
ep
4-O
ct
6-O
ct
8-O
ct
12-O
ct
14-O
ct
18-O
ct
%
THREE MONTH
TWELVE MONTH
By midweek post the announcement, a good deal of producer business was beingexecuted as mining companies restructured their hedges. The way this was ex-ecuted in the market appears to have contributed to alleviating the liquidityshortage. This, together with additional liquidity beginning to emerge fromnon-Agreement countries, plus the commercial banks recalling consignment gold,was sufficient to re-establish the contango. What started as a trickle of liquiditysoon become a flood and towards the end of the year the lease rates fell backsharply in response. Despite renewed surges in the gold price in the wake of
Data source: Virtual Metals Research & Consulting Databases
Data source: Virtual Metals Research & Consulting Databases
1, 3, 6 AND 12 MONTH LEASE RATES - Daily at the time of the Washington Agreement
0.00
1.00
2.00
3.00
4.00
5.00
6.00
7.00
8.00
27-Sep 28-Sep 29-Sep 30-Sep 1-OctDAY BY DAY
%
ONE
THREE
SIX
TWELVE
FURTHEST DATES MOVED FIRST
NEARBY DATES FOLLOWED

Gold Derivatives: The Market View 55
further short covering, especially during the second week after the announce-ment, this contango was maintained. During this process we believe that thepool of liquidity swiftly increased to an all time high of 5,500 tonnes thus in-creasing by almost 10% in the wake of a shock to the leasing market. The rate atwhich the additional liquidity (largely consignment-based) ebbed away duringthe closing months of 1999, was of particular interest. The core of lending (onthe part of the official sector) appeared to have remained virtually immune to thedevelopments in the market. It was therefore the marginal lending from the othersources which we referred to in the opening remarks of this chapter that demon-strate considerable sensitivity to the lease rates. This was particularly true of theconsignment industry.
Our analysis of the liquidity requirements based on the producer hedge bookalone (to end June 1999), suggested demand of additional lending on the part ofthe commercial banks of a minimum of 100 tonnes for every $25/oz increase inthe gold price. This relationship operated during the first week all the way up tothe mid $330s and appeared to be linear rather than exponential. Beyond $400/oz (although, of course, not tested), it appeared to fall away. Obviously this canonly be an estimate and should be considered as a bare minimum since we didnot have statistics covering other components of the OTC derivative market atthat time, such as the proprietary trading on the part of the bullion banks andexposures associated with the hedge funds. One also needs to bear in mind thatsome of these additional exposures may have amplified the liquidity requirementswhile others may have partly offset them. The other important point is that sincea good deal of the lease rate exposure was covered within a matter of days of theannouncement, the 100t: $25/oz ratio ceased to apply shortly afterwards. Toreassess this continually changing liquidity requirement needs a constant re-evaluation of lease rate exposures.
The weeks and months that followed the Washington Agreement showed a con-tinued and very sharp decline in the lease rates. The closing out of a number ofproducer hedging positions only served to place further downward pressure onthe rates. Pressure was sufficient to keep rates low, particularly at a time when themarket might have normally expected some strength with year-end book squar-ing especially over the millennium period.
There appear to have been other factors, which cumulatively contributed to thisslump in the cost of borrowing gold. Unconfirmed reports of a Russian sale of 80tonnes during November might have been a contributing factor. Certainly, asalready alluded to, the reversal of consignment stock especially from the Middleand Far East appears to have been larger than originally thought. This served as asource of immediate liquidity and we have attempted to take this into account inour “supply/demand” of leased gold. But more importantly, it became very clearat an early stage post the Washington Agreement, that the official sector itself was
Gold Derivatives: The Market View56
a willing lender. Kuwait announced its participation to the tune of 79 tonnes.The country, a relative newcomer to the lending market elected to go from aposition of very low lending to 100%, a decision that surprised the market.
The longer-term implications of the Washington Agreement and theoutlook for the future lending market
The Washington Agreement raises a number of critical questions. Firstly, to whatextent will the moratorium on new lending influence or even dictate futurelease rate levels? Secondly, has the Agreement in effectively capping new lend-ing to the market, altered the nature of derivative trading and product creationand was this the specific intention of the signatories? If the answer is in theaffirmative, then the next question is: what impact does this have on future goldprices in the short, medium and longer term and what does it mean for thederivative sector?10
In attempting to address the first question, it is necessary to gain an appreciationof potential new lending to the market. The accompanying chart shows the calcu-lated level of official sector lending that could come to market at various percent-ages (of available unlent metal). A number of explanatory notes place these figuresinto perspective.
• The figures exclude the United States which maintains a policy of total inactiv-ity in the gold market;
• The figures exclude the IMF as a potential lender on the premise that theorganisation would need to alter its charter in order to do so;
• The figures do not take into account the possibility of Japan entering the lend-ing market for the first time. The country holds 754 tonnes and thus, if theauthorities elected to ease their policy of strictly no lending, it could prove tobe a source of liquidity of some magnitude. At the moment, however, thisappears to be unlikely;
• And finally, the figures exclude any estimates of increased lending from theprivate sector or quasi-official monetary authorities known to hold metal, thetotals of which are not reflected in mainstream data.
10 This last question is addressed in chapter 6.

Gold Derivatives: The Market View 57
POTENTIAL ADDITIONAL LENDING at Various Percentages
0
5,000
10,000
15,000
20,000
100 75 65 45 35 25
Percent
Ton
nes
Jun-99
Dec-99
The extent to which the Washington Agreement has effectively sterilised a verylarge proportion of potential new lending is all too apparent. One has to acceptthat it is most unlikely that a hundred percent of non-signatories’ potential hold-ings would ever come to market and the total volume that could be mobilised inreality is probably less than 50% (of residual holdings not already on loan orswapped). Should this be the case, the total potential liquidity, post the Wash-ington Agreement, now stands at between 560 and 1,000 tonnes. This compareswith figures of over 6,000 to over 9,000 tonnes prior to the announcement.
Excluded in this assessment is the potential for the private sector to become asubstantially more active lender of metal. An analysis of the total volume of goldheld in private hands is an impossible task. However, we do know that over thepast two decades, private holdings in the major developed countries have beenconsistently on the decline. At probably historical lows, the propensity for theseholdings to provide a major source of liquidity is most unlikely. A similar as-sumption can be made regarding the metal held by various private and quasi-official organisations in the Middle East. Once very apparent in the market, hav-ing been the recipients of petro-dollars, these organisations are now substantiallyless active in the gold market. The other major potential source of liquidity thenis the gold held by individuals in the Indian Subcontinent. The authorities havelong attempted to tap this source of metal for some years now but so far withoutmuch success. However, this historical lack of success does not necessarily implythat this state of affairs will continue in future and it is strongly recommendedthat this potential source of liquidity is looked into in substantially more detail.
Quite apart from the volumes of potential future lending, the Agreement is likelyto influence the structure and make-up of the pool of gold liquidity. With the
Data source: Virtual Metals Research & Consulting Databases
Gold Derivatives: The Market View58
absolute levels of signatory lending now capped, any growth in the pool of liquid-ity will imply that their presence will decline in percentage terms. Will this thenrender the lending market increasingly more subject to lease rate sensitive re-sponses as the other sources of lending become more dominant? Can we alsoexpect that the lending market will become less and less subject to bureaucraticdecisions, which by nature are associated with long lead times? If the answer tothese questions is in the affirmative, then the gold market in general might beable to expect a lending market that responds more swiftly to lease rate changesthan has been the historical case. Of all the recommendations resulting from thisstudy, it is strongly suggested that this should be an area of continued research.
Our estimates of the actual tonnages of potential non-Agreement lending thatmight come to market and the possibility of this gold being more readily avail-able, suggests probably sufficient future liquidity open to the lending marketwithout placing undue upward pressure on lease rates. In other words, any up-ward pressure on lease rates as a result of the Washington moratorium on newlending will probably serve only to provide non-signatories with an opportunityto secure a better return on their gold, even if it is only in the short to mediumterm. Thus any effort on the part of the official sector to create a climate of higheraverage lease rates will require concerted and global intervention over and abovethe existing arrangements. This of course begs the question of whether or nor thelending market will in fact need additional liquidity. Chapter 2 dealing withproducer hedging assesses current hedging practises and attempts to forecast fu-ture growth potential. It suggests a scenario in which the global hedge book islikely to change in profile and structure that might well in turn imply a need forless, rather than more, liquidity.
If the above arguments are correct, it addresses in part the second question, namelywill the Agreement alter the nature and level of derivative activity? With little orno long-term impact on the lease rates, the Agreement will not directly influencethe way derivative business is conducted. But in a sense, by triggering a pricerally and backwardation in late September and early October, the WashingtonAgreement has already been the indirect cause of a major reassessment of pro-ducer hedging practices on the part of both the mining companies and the com-mercial banks. This is discussed in more detail in chapters 2 and 3 respectively.
Gold Derivatives: The Market View 59
CHAPTER 2 : PRODUCER HEDGING
The object of this chapter is to analyse producer hedging which represents by farthe greatest consumer of lent gold. Price risk management on the part of themining community has been a function of the gold market for more than twodecades. During this time, the presence of hedging as a day-to-day feature of thegold market has increased enormously in terms of both the volume of gold com-mitted to forward sales programmes and the complexity of the products used toachieve price protection. In terms of the market’s response to hedging it is prob-ably fair to say that, perhaps second only to official sector attitudes towards goldin recent years, producer hedging has been the most controversial topic withinthe bullion industry.
The active hedgers currently maintain that what would be considered sound riskmanagement business practices in other industries have been isolated and cited asthe major reason for the constant disappointment in the performance of the goldprice. The hedging debate, in holding the attention of decision-makers across theindustry, has been raised to a level over and above its due. This, they argue, hasonly served to distract commentary and attention away from what are more rel-evant long-term market- and business-related issues, such as effective marketingand the understanding of regional physical markets. Those committed hedgersclaim that they have been pressurised into a situation where they collectively feelthe need to defend their hedging practices. This has consumed a vast amount ofmanagerial resources, time and energy, which could have served the shareholdersbetter by being channelled into more constructive areas of decision-making. Thus,they argue, we have a situation where well-managed companies have felt obligedto make public statements worded in a way that might only serve in future torender them hostages to financial fortune.
Those opposed to hedging welcome this public initiative, maintaining that theirinstitutional shareholders are now questioning more than ever the wisdom ofderivative practices which they accept as being instrumental in capping the goldprice. They argue that hedging has destroyed the mining industry’s collectiveopportunity to reap the benefits of higher gold prices. While they acknowledgethat it cannot be proved in terms of conclusive statistics, they maintain that it isself-defeating to report average realised prices that greatly exceed spot prices if themechanisms used to establish those hedge prices undermined the spot price inthe first place. They argue that the unwinding of the hedge book on a global basiscan only be supportive of the gold price and the market in general.
Introduction and objectives

Gold Derivatives: The Market View60
And between these extremes, we find those that are agnostic with respect to hedg-ing, taking the attitude: if everyone else is hedging what choice do we have?
One further area of discussion is the question of how the market would respondto a premature and deliberate unwinding of the existing hedge position. As chap-ter 2 shows, by far the greatest hedge volume is clustered into the first four yearsof the global hedge book. This implies that the natural delivery of gold into thosepositions, even in the absence of a total buyback of the entire book, would implythat the short position would unwind reasonably swiftly (provided of course thesepositions were neither replaced or rolled over into further years). The deliberateclosing out of the book over an even shorter period of time with the intention ofcreating a price rally concerns us a great deal. We fear that this sort of action couldcause a dislocation in the lending market of such magnitude as to be most dam-aging to the longer term industry. Firstly, if it were ever perceived that the goldproducers had taken a collective decision to manipulate the gold price, therewould almost certainly be anti-trust implications. Secondly, the almost instanta-neous unwinding of a hedge book that has taken more than a decade to evolvewould create a vacuum in the lending market into which the lease rates wouldcertainly implode. There is evidence to suggest that in the absence of even themost modest return on gold, the collective official sector might be inclined tobecome an even more aggressive seller of gold reserves. Furthermore, the lower thelease rates (particularly combined with higher US interest rates), the greater theincentive for the hedge funds to borrow gold, short the market and raise very cost-effective dollars. An escalation of the carry trade would be conducive to neither astable nor appreciating gold price, certainly in the medium term.
Given all this controversy, the volumes of gold involved with global producerhedging and the fact that the mining companies have shown a propensity tomake use of intricate and, in some cases, potentially volatile products, a detailedanalysis of the hedging phenomenon is central to the understanding of the de-rivative market in general. This study embarked on a two-pronged approach in anattempt to gain a fuller understanding of hedging norms and practices.
In the first instance, a database covering statistical details of the internationalhedge position was constructed. Without the support and input from the inter-national mining industry, the exercise would not have been possible. This re-search was completed on a six monthly basis covering 77 companies representing1,275 tonnes, or 50% of total production of virgin metal in 19991 . Unlike anyother research in this area to date however, this analysis placed emphasis not onlyon price-related derivative positions, but also lease rate-based exposures.
1 Part of the methodology was to cross-check results against the data collated by Scotia Mocatta andOrd Minnett. Of the 50% remaining output very little, if any, is subject to hedging.

Gold Derivatives: The Market View 61
The global hedge book has grown swiftly over the years and there are now only ahandful of mining companies that do not have some form of hedging in place.
Circumstances suggest very strongly that the nature of the global hedge book isabout to change and we cite a number of reasons for this. A limited number areworking in favour of a firmer commitment to hedging. Substantially more how-ever, are rendering the hedge decision more complex for the mining communityto the extent that the miners are being limited in their alternatives and havemarkedly less latitude to do what many still deem necessary. The difficulty, ofcourse, is taking all the factors into account and giving each its fair weighting inan attempt to forecast the direction and magnitude of the change and how thatmay influence the future gold price. This by nature remains a very subjectiveexercise and we can only hope to raise the issues for active debate and recommendstrongly that further research is undertaken as events unfold.
Thus the following aspects need to be considered:
• The Washington Agreement, the subsequent sharp increase, equally swift de-cline in the lease rates2 and the problems associated with two hedge books havefocused the minds of the miners on the real hazards of using highly leveragedand complex derivatives. The results of the non-statistical questionnaire showedan overwhelming trend to a return to vanilla, tried and trusted products. Whilethis is unlikely to affect net volumes hedged, it is probable that the global hedgebook will be rendered less complex in its make-up. Both the primary and second-ary delta hedging against the book is therefore likely to be less complex;
• In the absence of the more leveraged strategies, the mining industry will needto find more innovative ways of using vanilla products if they are going to
The findings and recommendations
On completion of this, a second questionnaire was carried out involving the face-to-face interviewing of a little over 30 companies representing 1,025 tonnes or40% of 1999 output. The questions posed were of a non-statistical nature andexplored the mining companies’ attitudes, practises and concerns pertinent tohedging and price risk management. The companies participating were selectedspecifically to give the statistical sample broad exposure to geographical trends, aswell as to enable us to distinguish between different attitudes and hedging re-quirements among mature, emerging and junior companies. The results of thiswork are laid out and discussed later in the paper.
2 Discussed in detail in chapter 1.
Gold Derivatives: The Market View62
achieve average prices which greatly exceed spot. The rationale for adopting themore complex instruments in the first place was the fact that they generatedthe additional income that their vanilla sisters did not. This leaves the miningindustry with a number of alternatives, many of which are not particularlypromising.- Firstly, the miners wait for a higher gold price; something which recent
history has proved on more than one painful occasion not to be relied on;- Secondly, the miners turn their attention to higher US interest rates, which
in turn will secure a more attractive contango;- Thirdly, the miners can hope for persistently lower lease rates, which in
turn will ensure a greater contango. An understanding of the lending mar-ket, and to put into focus how it is going to evolve, is then very importantand in fact becomes central to hedging decisions. Currently, lease rates arefavouring the hedgers. Their continued weakness at the moment looks likelybut nothing in the longer term can be guaranteed;
- The fourth alternative requires proactive management by the miners dur-ing which they engineer higher compounded contangos. In the absence ofexotic products this has to be achieved by stretching the tenure of thehedge books out as far as possible. The extent to which this could placepressure on existing credit lines remains to be seen and will no doubt varyenormously from company to company. It is, however, not a foregone con-clusion that the miners will be able to fully achieve their aims via thisfourth option;
- And finally, we could see a greater reliance on downside protection via putoptions. This is already favoured by many companies and leaves open thequestion of whether or not the cost of the options will continue to be offset,either in part or totally, via the writing of calls.
• The very sharp decline in exploration expenditure throughout the late 1990s islikely to be felt in the years to come with, firstly, less in the way of new projectswhich would otherwise require derivative-based project financing and secondlydeclining, or at least, stagnating production levels. Both will impact on thevolumes to be hedged. The last two years have seen massive cuts in explorationand gold has borne the brunt of much of these declines. The accompanyingtable shows all too clearly two distinct features. Firstly, the sharp decline incommodity exploration expenditure as a whole and more importantly the ex-tent to which gold has declined in importance as an exploration target relativeto other commodities.
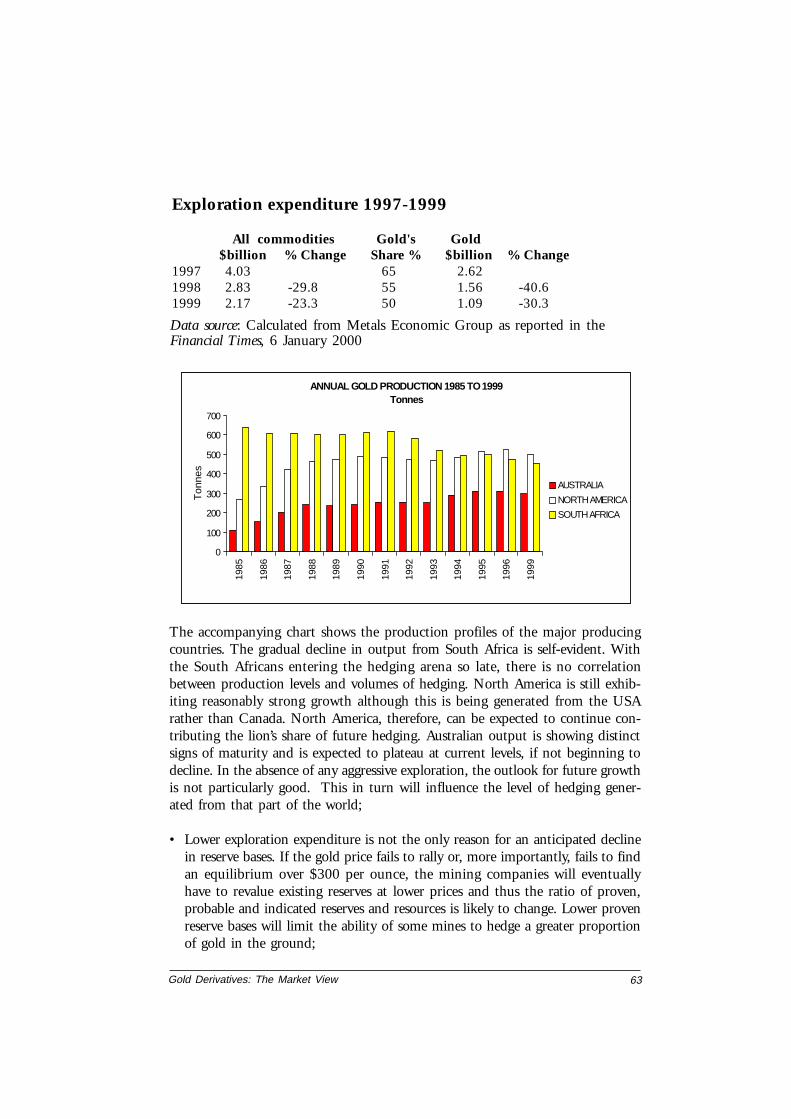
Gold Derivatives: The Market View 63
ANNUAL GOLD PRODUCTION 1985 TO 1999Tonnes
0
100
200
300
400
500
600
700
1985
1986
1987
1988
1989
1990
1991
1992
1993
1994
1995
1996
1999
Ton
nes
AUSTRALIA
NORTH AMERICA
SOUTH AFRICA
Exploration expenditure 1997-1999
All commodities Gold's Gold $billion % Change Share % $billion % Change
1997 4.03 65 2.621998 2.83 -29.8 55 1.56 -40.61999 2.17 -23.3 50 1.09 -30.3
Data source: Calculated from Metals Economic Group as reported in theFinancial Times, 6 January 2000
The accompanying chart shows the production profiles of the major producingcountries. The gradual decline in output from South Africa is self-evident. Withthe South Africans entering the hedging arena so late, there is no correlationbetween production levels and volumes of hedging. North America is still exhib-iting reasonably strong growth although this is being generated from the USArather than Canada. North America, therefore, can be expected to continue con-tributing the lion’s share of future hedging. Australian output is showing distinctsigns of maturity and is expected to plateau at current levels, if not beginning todecline. In the absence of any aggressive exploration, the outlook for future growthis not particularly good. This in turn will influence the level of hedging gener-ated from that part of the world;
• Lower exploration expenditure is not the only reason for an anticipated declinein reserve bases. If the gold price fails to rally or, more importantly, fails to findan equilibrium over $300 per ounce, the mining companies will eventuallyhave to revalue existing reserves at lower prices and thus the ratio of proven,probable and indicated reserves and resources is likely to change. Lower provenreserve bases will limit the ability of some mines to hedge a greater proportionof gold in the ground;
Gold Derivatives: The Market View64
• The Washington Agreement has raised the question of credit limits and marginwithin the commercial banking world. The non-statistical questionnaire (de-tailed later in this chapter) showed clearly that the majority of producers arecurrently margin-free and this state of affairs has been evolving gradually overthe past five years. Since the mining industry remains vociferously opposed tomargin, it is unlikely that the bullion banks will successfully renegotiate stand-ard margin clauses back into hedging agreements. However, substantially morewill be expected in terms of disclosure. The extent to which this might affecthedging decisions is debatable and in any case greater levels of disclosure willbe dictated by the new accounting practises. Of more significance is the possi-bility that the bullion banking industry will levy an increased hedging pre-mium in place of margin which could well alter substantially the cost of hedg-ing, especially for those companies deemed to be greater credit risks. Alterna-tively margin agreements might be reached whereby it can only be called aftera set of pre-agreed financial parameters are broken;
• The introduction of new accounting practices, specifically FAS133, is likely toinfluence hedging policies and practises in two ways. Firstly, it will enforce agreater level of financial disclosure associated with price risk management. Sec-ondly, it is likely to influence the choice of derivative product, depending onhow those products are defined for accounting purposes. Those defined as hedgeswill probably be favoured in future over those defined as speculative instru-ments (non-hedges) requiring quarterly accountability in the income state-ments. This implies greater reliance on forward instruments and put optionsand perhaps less in the way of call option writing and use of exotics. This inturn will influence the net impact of the hedge book on the price of gold viathe delta hedging;
• An analysis of current realised prices against total costs shows that in Australiaand North America, the costs of the marginal producers are not being fullycovered. This begs the question of whether the producers can afford not tohedge, especially in the absence of any sustained improvement in the goldprice. There is therefore an argument that says, sentiment and media pressureaside, there is the possibility that some producers may have no choice but tocontinue hedging;
• The Washington Agreement has very recently raised the question of hedging inthe minds of some institutional investors mainly in Europe and North Americabut less so in Australia. Changes in shareholder perceptions and acceptance ofhedging could well emerge as a factor of increasing importance.
All these factors suggest a particularly challenging future for the mining industrywith respect to their attitudes towards their hedge books and also with respect tothe flexibility they have with which they can remodel their hedging portfolios.
Gold Derivatives: The Market View 65
In the next few months, if we indeed see a growing trend towards public an-nouncements to the effect that companies will no longer add to hedge books andassuming that the existing contracts are not rolled but delivered into, it implies thatthe hedge book will contract sharply. However, in doing so, and as demonstratedlater in this chapter, a greater proportion of future output is swiftly going tobecome more exposed to total costs. It is most doubtful that the mining industrywill be able to pare costs to the extent that the reduction offsets completely theloss of price protection currently afforded by the hedge prices. This line of reason-ing also begs the question of whether or not the gold price would respond posi-tively to a more subdued approach to hedging. If it did, which is likely if thehedge book contracts by a substantial margin, then the higher spot price mightcounterbalance the reduced reliance on existing realised prices. If, however, thegold price failed to respond to a change in hedging norms, then the miningcompanies would be even worse off. By delivering into higher realised prices, theywould quickly become more exposed to lower spot prices, which in turn, wouldonly serve to expose them more to their total costs.
Media announcements relating to this issue certainly appear to have had an im-pact on the gold price. But this has been very short in duration and appears tohave been associated with improved market sentiment rather than a perceivedstructural improvement or a meaningful change in the status quo. Therefore, it isnot a forgone conclusion that any attempt by the mining companies to influencethe gold price via public statements relating to any limits on new hedging, willhave a lasting and sustainable impact on the gold price. Only a complete globalmoratorium on hedging, which would involve the closing out or delivery on exist-ing contracts without the establishment of new ones or the rolling forward ofexisting ones, as already mentioned would cause the hedge book to devolve swiftly.The volumes associated with the nearby delivery dates are of sufficient magnitudeto impact on the total short position in gold. Should this occur, there could wellbe far reaching implications for both the gold price and the lease rates.
The findings of the statisticalquestionnaire
The statistical questionnaire addressed hedging data covering 77 companies, rep-resenting 60% of annual production in 1999. As of the end of December 1999,the total nominal volume of gold associated with various price risk managementproducts totalled 4,038 tonnes (158% of 1999 physical production). This com-pares with a nominal total of 3,048 tonnes (120%) and 3,908 tonnes (153%) asof December 1998 and June 1999 respectively. The accompanying table showshow this has changed during the calendar year 1999. The table also details the

Gold Derivatives: The Market View66
Nominal total hedging by product
End End End End End EndHedging Dec-99 Jun-99 Dec-98 Dec-99 Jun-99 Dec-98
Tonnes Tonnes Tonnes Mn oz Mn oz Mn ozForwards 1,510 1,218 793 48.5 39.2 25.5Spot deferreds 524 756 652 16.8 24.3 21.0Floating forwards 107 74 0 3.4 2.4 0.0Convertible forwards 12 11 0 0.4 0.4 0.0Variable price forwards 36 7 7 1.2 0.2 0.2Puts bought 870 899 794 28.0 28.9 25.5Puts written* 15 12 4 0.5 0.4 0.1Calls written 832 819 665 26.7 26.3 21.4Convertible puts bought 133 115 0 4.3 3.7 0.0Knockout puts bought 14 9 9 0.5 0.3 0.3Calls bought* 429 167 64 13.8 5.4 2.1Gold loans* 0 8 6 0.0 0.2 0.2Kick in calls written 0 0 127 0.0 0.0 4.1
Total 4,038 3,908 3,048 129.8 125.7 98.0Total offset* 444 187 74 14.3 6.0 2.4
* Products offset
Nominal hedging as 158 153 120% of 1999 output
various products in use showing the marked preference for forwards and spotdeferreds as well as the common practise of buying put options and writing calls.
It should be noted that the puts written, calls bought and gold loan repaymentshave been deducted from the total since they exerted a net positive influence.
These nominal values, as reflected in the table, are actually misleading as theyover-emphasise the net impact of hedging on the market. To remedy this, it isnecessary to calculate the deltas on all options positions; a figure which can thenbe added to the sum of all the forward positions. The reason for this is because allforward products impact immediately on the market to the full 100% of theirunderlying value, whereas only a proportion of the options have an influence onthe market depending on their tenure and their strike prices relative to the spotprice. While the delta can and does vary between option strategies, overall intotal and under normal circumstances, it can be expected to be well below 50%of the total underlying option position.
As of end June 1999, we estimate that the delta on all the options was a little over40% which effectively reduced the total hedging impact during the first half of
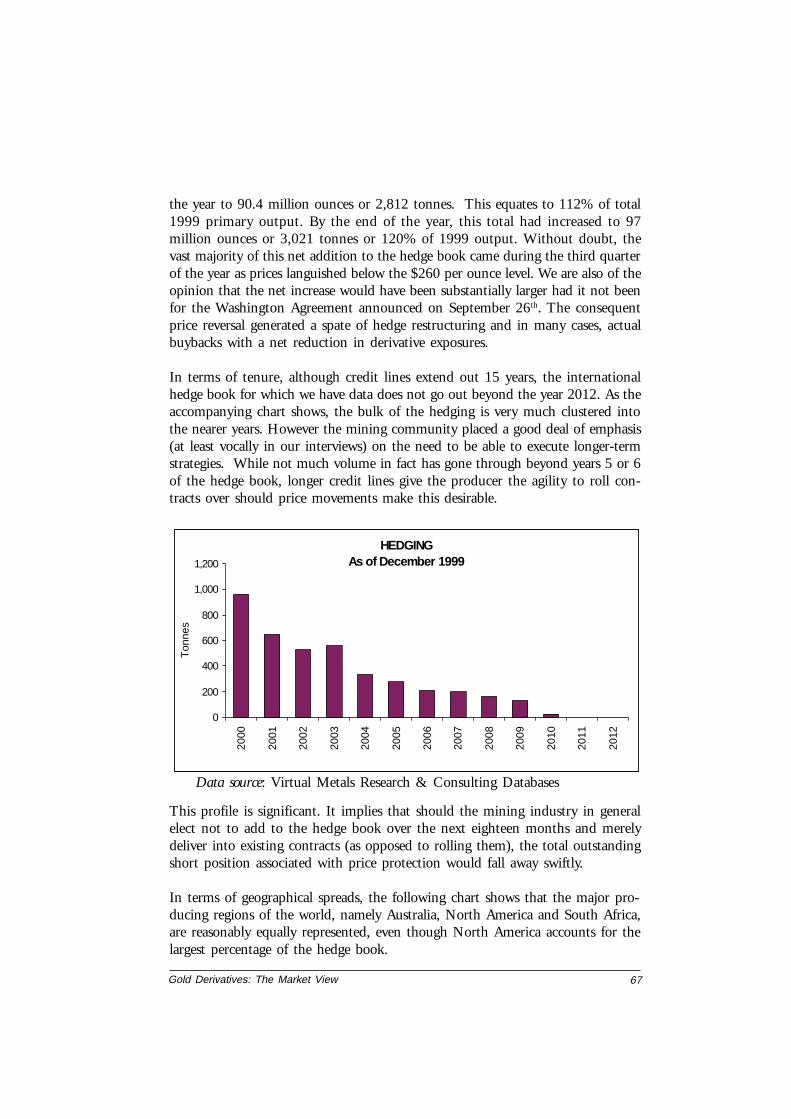
Gold Derivatives: The Market View 67
the year to 90.4 million ounces or 2,812 tonnes. This equates to 112% of total1999 primary output. By the end of the year, this total had increased to 97million ounces or 3,021 tonnes or 120% of 1999 output. Without doubt, thevast majority of this net addition to the hedge book came during the third quarterof the year as prices languished below the $260 per ounce level. We are also of theopinion that the net increase would have been substantially larger had it not beenfor the Washington Agreement announced on September 26th. The consequentprice reversal generated a spate of hedge restructuring and in many cases, actualbuybacks with a net reduction in derivative exposures.
In terms of tenure, although credit lines extend out 15 years, the internationalhedge book for which we have data does not go out beyond the year 2012. As theaccompanying chart shows, the bulk of the hedging is very much clustered intothe nearer years. However the mining community placed a good deal of emphasis(at least vocally in our interviews) on the need to be able to execute longer-termstrategies. While not much volume in fact has gone through beyond years 5 or 6of the hedge book, longer credit lines give the producer the agility to roll con-tracts over should price movements make this desirable.
This profile is significant. It implies that should the mining industry in generalelect not to add to the hedge book over the next eighteen months and merelydeliver into existing contracts (as opposed to rolling them), the total outstandingshort position associated with price protection would fall away swiftly.
In terms of geographical spreads, the following chart shows that the major pro-ducing regions of the world, namely Australia, North America and South Africa,are reasonably equally represented, even though North America accounts for thelargest percentage of the hedge book.
HEDGING As of December 1999
0
200
400
600
800
1,000
1,200
2000
2001
2002
2003
2004
2005
2006
2007
2008
2009
2010
2011
2012
Ton
nes
Data source: Virtual Metals Research & Consulting Databases
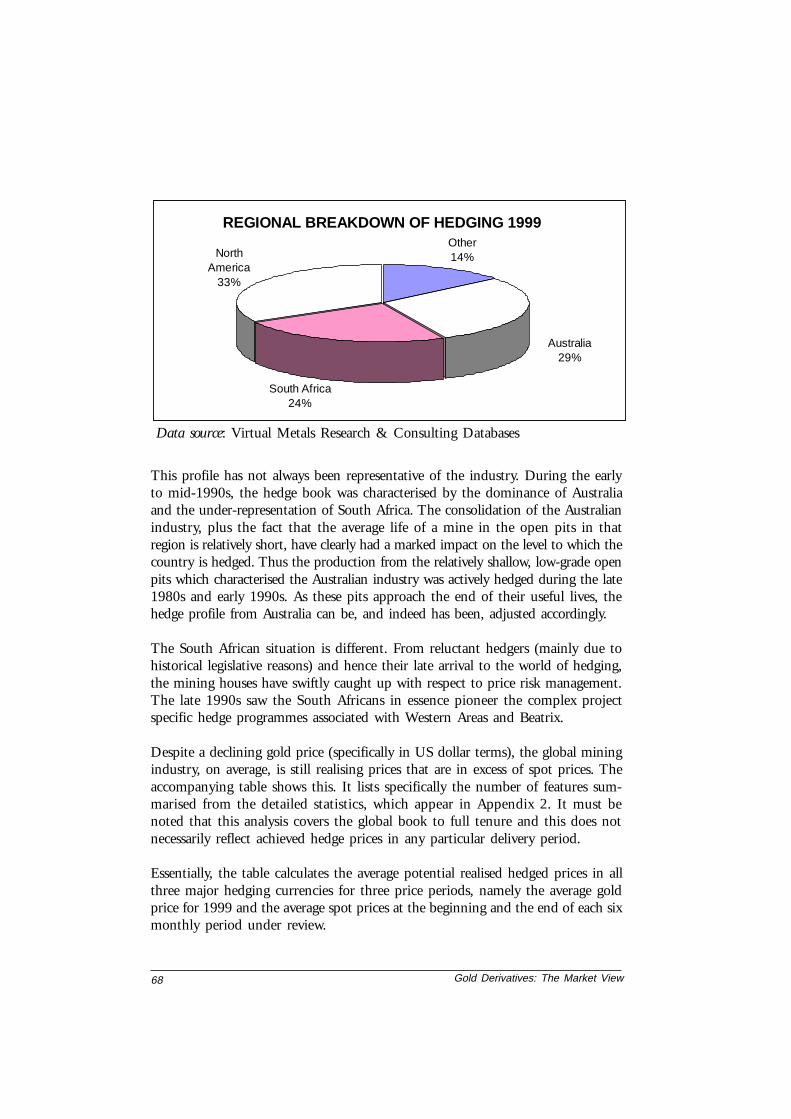
Gold Derivatives: The Market View68
This profile has not always been representative of the industry. During the earlyto mid-1990s, the hedge book was characterised by the dominance of Australiaand the under-representation of South Africa. The consolidation of the Australianindustry, plus the fact that the average life of a mine in the open pits in thatregion is relatively short, have clearly had a marked impact on the level to which thecountry is hedged. Thus the production from the relatively shallow, low-grade openpits which characterised the Australian industry was actively hedged during the late1980s and early 1990s. As these pits approach the end of their useful lives, thehedge profile from Australia can be, and indeed has been, adjusted accordingly.
The South African situation is different. From reluctant hedgers (mainly due tohistorical legislative reasons) and hence their late arrival to the world of hedging,the mining houses have swiftly caught up with respect to price risk management.The late 1990s saw the South Africans in essence pioneer the complex projectspecific hedge programmes associated with Western Areas and Beatrix.
Despite a declining gold price (specifically in US dollar terms), the global miningindustry, on average, is still realising prices that are in excess of spot prices. Theaccompanying table shows this. It lists specifically the number of features sum-marised from the detailed statistics, which appear in Appendix 2. It must benoted that this analysis covers the global book to full tenure and this does notnecessarily reflect achieved hedge prices in any particular delivery period.
Essentially, the table calculates the average potential realised hedged prices in allthree major hedging currencies for three price periods, namely the average goldprice for 1999 and the average spot prices at the beginning and the end of each sixmonthly period under review.
REGIONAL BREAKDOWN OF HEDGING 1999
South Africa24%
Other14%North
America33%
Australia29%
Data source: Virtual Metals Research & Consulting Databases
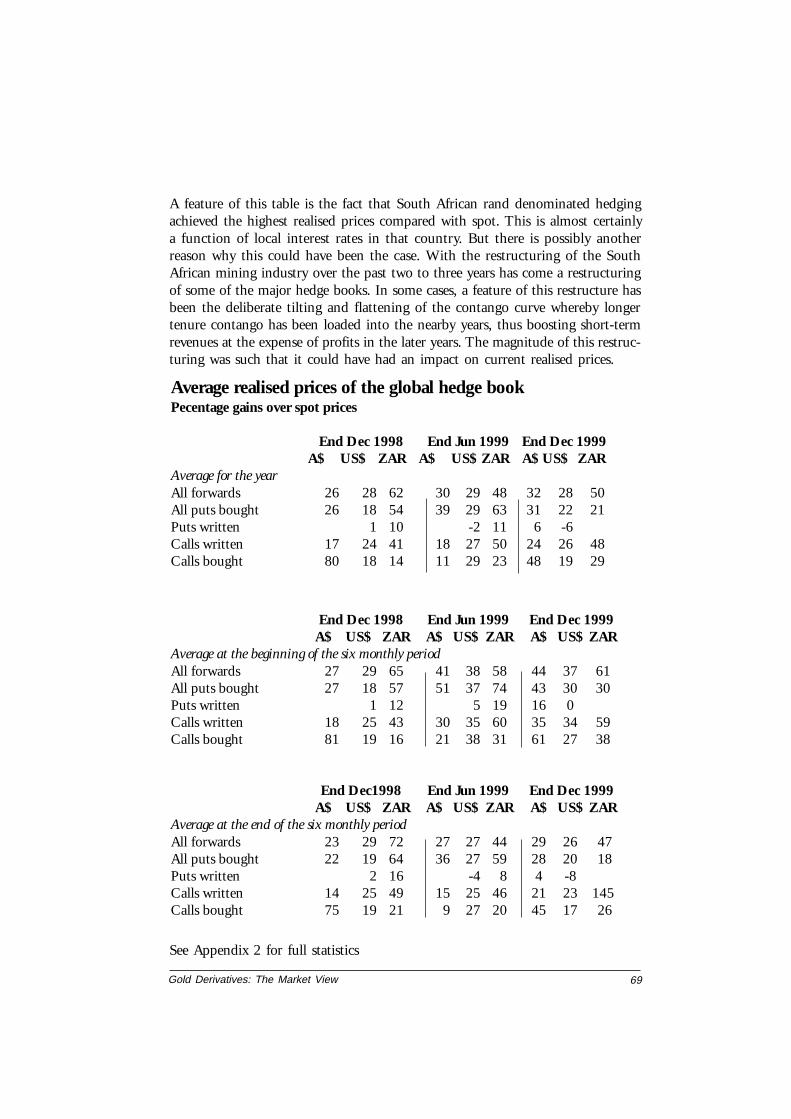
Gold Derivatives: The Market View 69
A feature of this table is the fact that South African rand denominated hedgingachieved the highest realised prices compared with spot. This is almost certainlya function of local interest rates in that country. But there is possibly anotherreason why this could have been the case. With the restructuring of the SouthAfrican mining industry over the past two to three years has come a restructuringof some of the major hedge books. In some cases, a feature of this restructure hasbeen the deliberate tilting and flattening of the contango curve whereby longertenure contango has been loaded into the nearby years, thus boosting short-termrevenues at the expense of profits in the later years. The magnitude of this restruc-turing was such that it could have had an impact on current realised prices.
See Appendix 2 for full statistics
Average realised prices of the global hedge bookPecentage gains over spot prices
End Dec 1998 End Jun 1999 End Dec 1999A$ US$ ZAR A$ US$ ZAR A$ US$ ZAR
Average for the yearAll forwards 26 28 62 30 29 48 32 28 50All puts bought 26 18 54 39 29 63 31 22 21Puts written 1 10 -2 11 6 -6Calls written 17 24 41 18 27 50 24 26 48Calls bought 80 18 14 11 29 23 48 19 29
End Dec 1998 End Jun 1999 End Dec 1999A$ US$ ZAR A$ US$ ZAR A$ US$ ZAR
Average at the beginning of the six monthly periodAll forwards 27 29 65 41 38 58 44 37 61All puts bought 27 18 57 51 37 74 43 30 30Puts written 1 12 5 19 16 0Calls written 18 25 43 30 35 60 35 34 59Calls bought 81 19 16 21 38 31 61 27 38
End Dec1998 End Jun 1999 End Dec 1999A$ US$ ZAR A$ US$ ZAR A$ US$ ZAR
Average at the end of the six monthly periodAll forwards 23 29 72 27 27 44 29 26 47All puts bought 22 19 64 36 27 59 28 20 18Puts written 2 16 -4 8 4 -8Calls written 14 25 49 15 25 46 21 23 145Calls bought 75 19 21 9 27 20 45 17 26

Gold Derivatives: The Market View70
The other interesting feature is that the average strike prices at which the minershave written calls are not quite as far-out-of-the-money as one might expect. Thisis particularly true of the calls written in Australian dollars during the first half of1999. The reason for this is a function of the higher premium earned on optionswith the strike price closer to the money, particularly if the mining communityanticipated further declines in the gold price. In other words, these strike pricesare a very clear indication of how the mining industry perceived future prices justprior to the Washington Agreement. It is interesting to see that the premium overspot at which these calls were written during the second half of the year widenedin the wake of the Washington Agreement – again a good measure of producersentiment.
The fact that the put options have been written on average at a discount, or neardiscount to spot, is exactly what would be expected.
Another interesting analysis of realised prices looked at how current hedged priceshave compared with the historical performance of the gold price in the threemajor hedging currencies. The following three charts show these comparisons forall the forward products in US dollars, Australian dollars and South African randrespectively. They demonstrate that in terms of Australian dollars and SouthAfrican rand, the realised prices over the last year have been consistently abovespot and by a wide margin. This is not the case in US dollars, with the exceptionof the last three years.
REALISED PRICES VERSUS AVERAGE SPOT US dollars - all forwards
250
300
350
400
450
500
1985 1987 1989 1991 1993 1995 1997 1999
US
$/oz AVERAGE
Dec-98
Jun-99
Dec-99
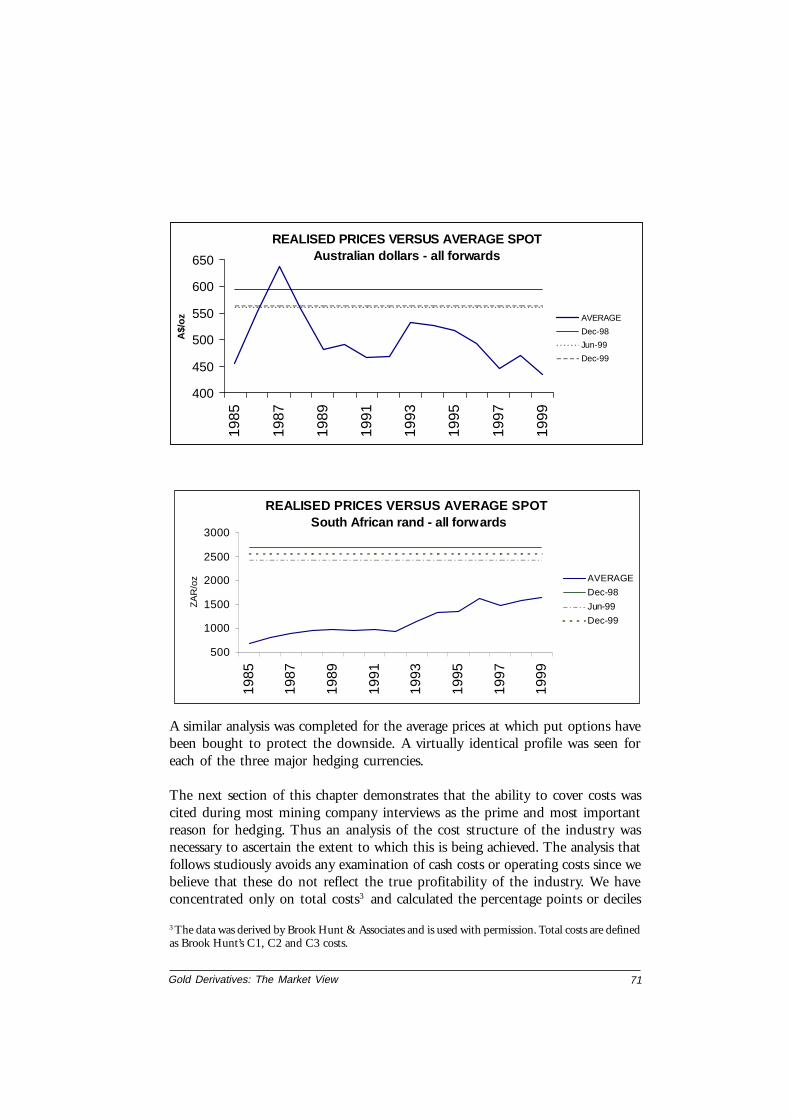
Gold Derivatives: The Market View 71
REALISED PRICES VERSUS AVERAGE SPOT Australian dollars - all forwards
400
450
500
550
600
650
1985
1987
1989
1991
1993
1995
1997
1999
A$/
oz AVERAGE
Dec-98
Jun-99
Dec-99
REALISED PRICES VERSUS AVERAGE SPOT South African rand - all forwards
500
1000
1500
2000
2500
3000
1985
1987
1989
1991
1993
1995
1997
1999
ZA
R/o
z AVERAGE
Dec-98
Jun-99
Dec-99
A similar analysis was completed for the average prices at which put options havebeen bought to protect the downside. A virtually identical profile was seen foreach of the three major hedging currencies.
The next section of this chapter demonstrates that the ability to cover costs wascited during most mining company interviews as the prime and most importantreason for hedging. Thus an analysis of the cost structure of the industry wasnecessary to ascertain the extent to which this is being achieved. The analysis thatfollows studiously avoids any examination of cash costs or operating costs since webelieve that these do not reflect the true profitability of the industry. We haveconcentrated only on total costs3 and calculated the percentage points or deciles
3 The data was derived by Brook Hunt & Associates and is used with permission. Total costs are definedas Brook Hunt’s C1, C2 and C3 costs.

Gold Derivatives: The Market View72
Currency denominated hedging expressed in US dollars
End June 1999 Weighted Decile points coveredAverage North South Australia
Price America AfricaAll forwards 363 80 95 80All puts bought 377 80 95 80
End December 1999 Weighted Decile points coveredAverage North South Australia
Price America AfricaAll forwards 365 80 95 80All puts bought 351 80 95 80
C3 CostsUS$/oz
North South AustraliaDecile America Africa
10 220 219 21420 237 231 23930 290 241 25940 308 267 27350 308 284 29760 316 290 32670 334 305 33475 342 309 34480 348 314 35190 397 338 40995 440 349 449100 604 385 852
at which the costs lie. These were then compared to the weighted average USdollar realised price by major product. The results are shown in the accompany-ing table but a number of observations need to be made about the data. Readersshould keep in mind that this analysis looks at which decile on the cost curve iscovered by the various average hedge prices.
Analysis of realised prices versus total operating costs
Realised prices of the hedge book as of 1999 as a percent of total costs

Gold Derivatives: The Market View 73
Firstly, the results may come as a surprise to those accepting the conventionalwisdom, which states that the South African industry incurs the highest costs.This might, in some cases, be true of cash costs but it is certainly not true of totalcosts. South African mines compete favourably in terms of total costs since theindustry is relatively debt free and thus incurs little in the way of the interestcharges accrued in Australia and North America.
Secondly the table shows that if the average realised prices for each product areconsidered as a benchmark for the reporting periods, then 80% of the total costsaccrued by the Australian and North American industries are covered. The onlyexception to this are Australian dollar denominated calls bought within the secondhalf of 1999. The overall picture for South Africa is healthier with 95% of totalcosts covered by realised rand denominated prices.
However, given the fact that many mining companies in South Africa and Aus-tralia hedge in both their local currencies and US dollars, a more detailed regionalanalysis was completed taking this into account. The same table shows the re-sults. The total cost coverage with respect to all forward products proved to bebroadly similar to the currency denominated analysis. The major variation in theresults came with respect to the puts bought by the North Americans. The aver-age strike price at which these puts were written only covered 50% of NorthAmerican total costs.
In any cost analysis, we would consider the ninth decile (90%) as being the cut-off which defines marginality. Thus we conclude that the average realised price forglobal hedging is not quite covering the total costs of the marginal producers. Theimplications are of considerable importance when making any assumptions about
Data Sources: Brook Hunt & Associates, Virtual Metals analysis
End December 1999Average realised pricesIn US dollar terms North South Australia
America AfricaAll forwards 372 399 365All puts bought 310 349 364
Total costs on the costs curve coveredNorth South Australia
America AfricaAll forwards 80 100 80All puts 50 90 80
Regional analysis irrespective of hedge currency

Gold Derivatives: The Market View74
4 A description of these products can be found in chapter 5
the future of the global hedge book. It is true that cash costs are the key determi-nant in assessing the profitability of an existing mine. But total costs are impor-tant over the whole life of a mine, including exploration and development. If thisstate of affairs continues, it must imply a higher probability of natural attrition inproduction levels in the years to come than the conventional cash cost analysiswould reveal (unless of course, the mining industry can continue to reduce itscosts). The analysis however also raises the question: can the mining industry atcurrent prices afford not to hedge? In the next few months, if we indeed see agrowing trend towards public announcements to the effect that companies willno longer add to hedge books, and assuming that the existing contracts are notrolled but delivered into, it implies that the hedge book will contract sharply.However, in doing so, a greater proportion of future output is swiftly going tobecome more exposed to total costs. It is most doubtful that the mining industrywill be able to reduce costs to the extent that the reduction offsets completely theloss of price protection currently afforded by the realised hedge prices. This lineof reasoning also begs the question of whether or not the gold price would re-spond positively to a more subdued approach to hedging. If it did, then thehigher spot price might counterbalance the reduced reliance on existing realisedprices. If, however, the gold price failed to respond to a change in hedging norms,then the mining companies would be even worse off. By delivering into higherrealised prices, they would quickly become more exposed to lower spot prices,which in turn, would only serve to expose them more to their total costs.
In terms of product usage, the industry still exhibits a marked preference forvanilla forwards, the buying of put options and the writing of calls. The sum-mary table shown in the introduction to this chapter shows that there has beenlimited usage of forward variants and exotic options, although in volume termsthey are by far in the minority and, in fact, are confined to a very limited numberof companies. We have separated them out in all the analyses since, especially inthe case of exotic options, their deltas can be several times the total volume of theunderlying and therefore their behaviour under volatile market conditions can beunpredictable4 .
One of the most revealing areas of the analysis was an assessment of the variousprice levels at which the hedge book was at risk of being out of the money. Twotime horizons were assessed and then compared, namely the hedge book as of theend of June 1999 and the same book at it stood at the end of December 1999.These two snapshot views provided a particularly useful comparison in that theyhighlighted the hedging reaction to the Washington Agreement of September26th. The price exposure for the forwards, spot deferreds and call options written

Gold Derivatives: The Market View 75
During the period ending June 1999, the hedging for delivery in that year wasmost at risk, especially at prices between $320-$330/oz. At $300/oz, almost athird would have been below spot. This increases to between 40% and nearly50% at gold prices of $320-$330/oz. Over 67% of hedging would have been outof the money at a gold price of $375/oz. This analysis gives a very clear picture ofthe potential dislocation of the hedge book immediately post the WashingtonAgreement, if the gold price had indeed stabilised over $320/oz. In the wake ofthe Washington Agreement, many mining companies restructured their hedgebooks and a good deal of this nearby hedging was either closed-out, delivered intoor rolled over. Thus the hedging at risk as of the end of December shows a differ-ent profile as the chart indicates. Only 11% would be out of the money at a priceof $300/oz. This increased to between 30% and 47% at prices ranging from$320-$330/oz. 84% was at risk at $375/oz.
Since the above analysis looks exclusively at the hedging commitments for thetwo nearest years, it is necessary to place this into context with respect to the totalhedge book to full tenure. The accompanying chart does this. While the profilefor hedging at risk for the three reporting periods is very similar, the percentagesat risk are very different. As of the end of December 1999, 4.5% of the totalhedge book was at risk at $300\oz. This proved to be considerably lower than the
PERCENTAGE OF HEDGING AT RISK AT SELECTED GOLD PRICES (forwards and calls written)
0102030405060708090
300 320 330 350 375
CU
M % Dec-98
Jun-99
Dec-99
were assessed for the total of the first two delivery years in each period.5 Thesewere compared to gold price levels in US dollars, Australian dollars and SouthAfrican rand. The results are listed in detail in Appendix 2 but a summary of theresults is shown graphically in the accompanying chart.
5 Only the first two deliverable periods were assessed as they represented the greatest percentage of thehedge book

Gold Derivatives: The Market View76
PERCENTAGE OF HEDGING AT RISK AT SELECTED GOLD PRICE (Forwards and Calls Written) Expressed as % of Total Book
0
5
10
15
20
25
30
35
40
300 320 330 350 375
CU
M % Dec-98
Jun-99
Dec-99
16% at risk at the end of June. Furthermore, 12%-17% was at risk at between$320-$330/oz. (19%-21% end June). A full 20% was at risk at $350/oz and34% was at risk at $375/oz (23% and 32% respectively by June 1999).
Findings of the non-statisticalquestionnaire
Regional breakdown of the non-statistical questionnaire
Number Percent Gold Percentof of production of
participants total mn oz total
South Africa 5 16.1 13.35 40.6North America 14 45.2 13.21 40.1Australia 12 38.7 6.36 19.3
Total 31 100 32.92 100(1,024 tonnes)
A breakdown of the statistical sample covered during the second questionnaire iscollated in the following table and shows that 31 mining companies representingalmost 33 million ounces of production (almost 1,025 tonnes) contributed. Thisequates to 40% of total global production during calendar 1999.
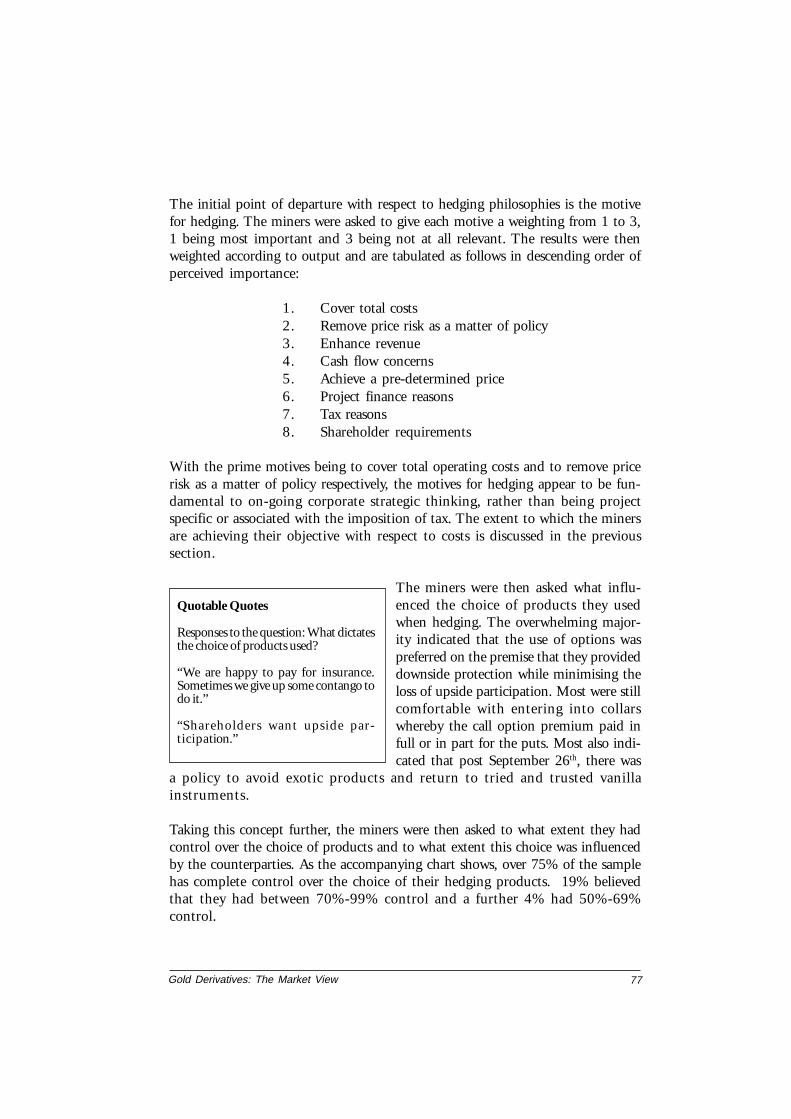
Gold Derivatives: The Market View 77
The initial point of departure with respect to hedging philosophies is the motivefor hedging. The miners were asked to give each motive a weighting from 1 to 3,1 being most important and 3 being not at all relevant. The results were thenweighted according to output and are tabulated as follows in descending order ofperceived importance:
1. Cover total costs2. Remove price risk as a matter of policy3. Enhance revenue4. Cash flow concerns5. Achieve a pre-determined price6. Project finance reasons7. Tax reasons8. Shareholder requirements
With the prime motives being to cover total operating costs and to remove pricerisk as a matter of policy respectively, the motives for hedging appear to be fun-damental to on-going corporate strategic thinking, rather than being projectspecific or associated with the imposition of tax. The extent to which the minersare achieving their objective with respect to costs is discussed in the previoussection.
The miners were then asked what influ-enced the choice of products they usedwhen hedging. The overwhelming major-ity indicated that the use of options waspreferred on the premise that they provideddownside protection while minimising theloss of upside participation. Most were stillcomfortable with entering into collarswhereby the call option premium paid infull or in part for the puts. Most also indi-cated that post September 26th, there was
a policy to avoid exotic products and return to tried and trusted vanillainstruments.
Taking this concept further, the miners were then asked to what extent they hadcontrol over the choice of products and to what extent this choice was influencedby the counterparties. As the accompanying chart shows, over 75% of the samplehas complete control over the choice of their hedging products. 19% believedthat they had between 70%-99% control and a further 4% had 50%-69%control.
Quotable Quotes
Responses to the question: What dictatesthe choice of products used?
“We are happy to pay for insurance.Sometimes we give up some contango todo it.”
“Shareholders want upside par-ticipation.”

Gold Derivatives: The Market View78
EXTENT TO WHICH MINERS CONTROL HEDGING DECISIONS AS OPPOSED TO COUNTERPARTIES
100 % MINERS77%
50-69% MINERS4%
LESS THAN 50% MINERS
0%70%-99% MINERS
19%
Interestingly, there was no correlation between the control and the size of theoperation. Companies producing 40,000 ounces a year were just as much incontrol of these decisions as the major producers. There was also no regional trendin the responses with the exception of South Africa, where all the respondentshave 100% of control.
The next point of reference related to the factors that dictate the tenure to whichproducers elect to hedge. In this case, the overwhelming concern by a wide mar-gin was the life of the mine, although set hedging policies clearly emerged as animportant issue. In terms of importance the factors were ranked as follows:
Life of mine 0.60 (scaling factor on a weighted basis)Set policy 0.46Credit issues 0.16Market conditions 0.14Price 0.13Project financing 0.08Reserves 0.06Cash flow 0.02Bank debt 0.01Bank requirements 0.00
More specific to the structuring of a hedge programme, we then attempted toisolate which market parameters most influenced how and why a particular hedgewas executed. In declining order of importance these factors are:
Gold price and lease rates (equally important)ContangoInterest ratesPrice and option volatility (equally important)Credit limitsLocal currencies

Gold Derivatives: The Market View 79
Quotable Quotes
In response to question about hedgemanagement:
“We used to set and forget but dy-namic hedging will soon be thenorm.”
Once the hedge is in place we found that theoverwhelming trend is to now view the struc-ture as dynamic and to re-iteratively adjustthe exposure according to changing marketconditions. Many mining companies still viewtheir hedging as very opportunistic, whileothers structure a specific hedge for aspecific project. With respect to the overalldecision to hedge, the boards of the mining companies still tend to agree to anoverall framework, although within these structures the treasury departments nowseem to have more latitude to make opportunistic adjustments than was the casefive years ago. Within the industry, there is a marked diversity as to how thehedging limitations are set. We saw many instances where limits were placed onthe volume hedged relative to planned and actual output, while others based thelimits on reserves. Others had limitations measured in tenure or product usageand, in some instances, hedging was limited to a specific project which requiredprice protection or, indeed, required hedging to secure financing.
Since the interviews were completed after the Washington Agreement, it was use-ful to gauge the level of confidence within the mining industry with respect tobeing able to monitor the health of their hedging programmes and their reactionsto sharp adjustments in the underlying parameters. Just under 84% of the sam-ple expressed a great deal of comfort with their ability to constantly assess theirexposures and manage them effectively, although the vast majority make extensiveuse of external expertise to audit, cross- and counter-check the analysis.
Many expressed the opinion that one of the major reasons which gave them thislevel of comfort was the fact that they studiously avoided using any product whichthey did not fully understand. Of those who felt less confident of their internaltreasury’s ability to stress-test their hedge book, many were relative newcomers tohedging and this positive correlation came as no surprise. This led onto specificquestions relating to product confidence. We asked the miners if they felt thatthey understood the products that they are, firstly, using and, secondly, beingoffered. There was virtually unanimous agreement that they fully understood theproducts currently existing in their portfolios. As expected there was less consen-sus when it came to products that they are being offered. A little under 70% feltthey had the analytical capabilities to assess new products. The remaining 30%were wary of exotic products, some in the extreme and avoided their use.
This study then needed to assess the degree to which the mining industry de-pends on hedging and if hedging influences long-term business decisions. Thecompanies were asked whether or not the existence of their hedge book influ-enced their decision-making with respect to mine closures, production plans andexplorations plans. The results were as follows:

Gold Derivatives: The Market View80
The influence of the hedge book on long-term decisions
By tonnage By number of respondents yes no yes no
Closure of a mine 15.5% 84.5% 16 15Production plans 15.9% 84.1% 14 11Exploration plans 20.7% 79.3% 11 20
We interpreted the fact that a minimum of 15% by tonnage responded in theaffirmative, representing 5 million ounces of production, as being significantenough to warrant further investigation. This revealed some other very interest-ing observations. Firstly, there was a positive correlation between the size of thecompany and its response. For this reason we have reported the results in theabove table both in terms of volume and by number of respondents. The major,mature companies almost without exception place no reliance on the hedge bookwhen taking longer-term decisions regarding mine closure, production and ex-ploration plans. The smaller, more junior companies displayed a fundamentaldifference in that the hedge book plays a more central role in decision-making ofthis nature. But secondly, there was also a strong regional divergence in the re-sponses. We do not believe that we would be breaking a confidence in reportingthat the South African houses, without exception, reported that they place abso-lutely no weight on the hedge book for long-term decision-making of any sort.This was not true of Australia and to a lesser extent, North America. A closerassessment reveals that this, in fact, has nothing to do with national idiosyn-crasies, but rather mining techniques. Clearly when confronted with deep,capital-intensive hard rock mining with very long lead and development times,plus long life of mine expectancy, the hedge book plays a lesser role comparedwith the shallow open pit operations with relatively restricted reserve bases.
But the conclusions drawn from these results are very significant indeed. Analysisto date covering the impact of hedging on the gold price has been confined to theimmediate and then longer-term influence of the products themselves and theway they are offset into the market. Very little work has been completed assessingthe impact that hedging could have had on the longer-term structure as an indi-rect result of decision-making based on the existence of the global hedge book.Thus it is possible that hedging could have had a number of influences on thesupply of gold to the market which may not be immediately apparent. It cer-tainly has delayed mine closure. But, less obviously, it might have influenced therestructuring of the primary industry, delaying mergers and the acquisition ofjunior companies. Furthermore there is reason to suggest that the existence ofhedge books supported (or even subsidised), at least for some while, explorationbudgets which might well have materially added to reserve bases.

Gold Derivatives: The Market View 81
The questionnaire then turned to the structure of the market and how the min-ing companies perceive the service they are getting from the counterparties. Interms of whether the market offered sufficient depth and liquidity for the minersto execute their hedging, especially the longer dated contracts, the response wasvery positive indeed. In fact only three companies, representing 1.1% of the sam-ple expressed concerns to the effect that the market was controlled now by ahandful of banks and hence was not as liquid as hoped. This applied primarily
when attempting to execute hedging inlocal currency terms and not US dollars.Looking longer-term, the miners wereasked if they thought that the Washing-ton Agreement would influence their hedg-ing policies. A third of the sample felt thingswould continue unchanged while the bal-ance was uncertain. Interestingly, manyvolunteered comments to the effect thatthe Washington Agreement had high-lighted the need to be substantially moreconscious of lease rate behaviour and ex-posure to the cost of borrowing gold.
This then led to the question of the industry’s relationship with the counterpartiesand whether or not the on-going restructuring of the bullion banking industryhad affected their working relationship. Here the responses were mixed, although92% of the sample felt that the restructuring had not adversely affected their
ability to complete their risk managementprogrammes. This, however, did not nec-essarily imply that the mining industry ingeneral is happy with the service, market-ing approach and the quotes, as the accom-panying text box reveals. What did emergefrom this line of questioning was the grow-ing concern about credit, in some caseswhere sovereign risk played a role. Whenasked if the companies had ever experi-enced difficulties securing the necessarycredit lines, again the sovereign risk issuewas cited as being a problem. Nine of therespondents, representing just under 30%of the sample, confirmed that this atsome stage had been a problem. Apart from
sovereign risk, company restructuring, balance sheets, mining costs and projectspecific problems were cited as influencing the ability to secure lines. Many
Quotable Quotes
Responses to the question: Havecounterparty relationships been affectedby the restructuring in banking?
“The market is still over-banked althoughthere are less one-stop shops”.
“Declining liquidity hinders our abilityto trade large tranches”.
“We are concerned about the fair weatherservice we get from some counterparties”.
Quotable Quotes
In response to question about attitudestowards counterparties:
“They are very sophisticated and meet ourneeds well”.
“Vultures!”
“They do not have a divine right to ourbusiness”.
“Only a handful can do the structureddeals we want”.
“Continued strong relationships haveserved us very well”.

Gold Derivatives: The Market View82
expressed the view that the banks were inflexible and limiting especially when itcame to the question of margin.
And it was margin that proved to be the most emotive issue among the industry.With the exception of half a dozen mines, the respondents to our questionnaireare currently free from margin. This is a new phenomenon. Five years ago marginwas the norm rather than the exception, albeit an unwelcome one. The extent towhich the miners have succeeded in negotiating out of their agreements any ref-erence to margin is an indication of just how much the industry has been the
dominant partner in the hedging relation-ship. It also shows the extent to which thebullion banks have clamoured to securehedging business. With the majority of themining companies vehemently against anyform of margin to the degree that somewould prefer to sever and lose lines of creditrather than accept margin, the bullionbanks are now facing a most thorny ques-tion and one that could have a materialimpact on their ability to secure producerbusiness. Those banks which adamantly
maintain margin requirements could see their market share decline. On the otherhand, not many mining houses can afford the loss of credit lines and walk awayfrom what have probably been long and successful banking relationships. But theextent to which the industry is going to remain unmargined in any form, or not,as the case may be, could have a substantial bearing on the profile and structureof the future hedge book. The absence of margin over time has encouraged theleverage of hedging exposures and, in some cases, beyond the limitations of acompany’s balance sheet. Any renewal of margin, if at all possible and in whateverform is acceptable to the producers, is likely to necessitate a different approach torisk management. It does, however, appear unlikely that the commercial bankswill successfully re-introduce margin into existing agreements, certainly in itsmost standard least flexible form. It is more likely that they will impose a greaterdegree of financial disclosure and perhaps the levying of some sort of hedgingpremium in place of margin. This could have substantial implications for the costof hedging incurred by the miners and influence their hedging policies.
Turning to the final leg of the questionnaire, we asked the mining industry toshare their views on a number of market related issues. In the first instance, weasked them whether their actual or potential to influence the gold price adverselythrough hedging concerned them at all. Eight companies elected not to respond.Three, representing less than 1% of the sample, indicated that their impact wasreal but of no concern. Thus, a little over 50% of the sample acknowledgedthat they were firstly aware, and secondly, concerned about their hedging activities.
Quotable Quotes
In response to question about the issue ofmargin:
“Never have and never will!”“No, thank you.”“Under no circumstances”.“We accept it but very reluctantly”.“We understand the need but would pre-fer to avoid it”.“We accept it within reason”.

Gold Derivatives: The Market View 83
Under these circumstances, the next ques-tion was logically: What are your share-holders’ attitudes towards hedging? Attitudeshere seem just as diverse as those of minemanagement. Certainly, the shareholderswant the ability to participate in any up-ward movement of the gold price butjust prior to the Washington Agreement, an
emerging trend was the fact that shareholders are increasingly viewing hedging aspart and parcel of a well managed company which has the capability of address-ing risk of any sort and not just that of price. This was probably the result of twointerrelated factors. Firstly, shareholders are acutely aware of the fact that, forwhatever reasons, the gold price has failed in any sustained rally in recent years.Hence hedging has returned to them substantial returns that otherwise mightnot have been enjoyed. In a sense, this is acircular argument and antagonists of hedg-ing will maintain that it was hedging inthe first place that placed downward pres-sure on the gold price. These argumentsare set out in more detail in chapter 2, butmaintain that to isolate hedging as the vil-lain of the piece addresses a symptom andnot the cause. There are other structuralreasons endemic to the gold marketwhich have created the price profile of the pasttwo decades. How shareholders’ attitudes develop, especially post the Washing-ton Agreement, is one area of study that we suggest requires further monitoring.
Secondly, management is very conscious of the views and wants of their share-holders. Many reported that they are spending a good deal of time and energyeducating their shareholders and keeping them fully briefed with respect to pricerisk management. In general, there is a very marked trend towards fuller report-ing of hedge programmes with the corresponding explanatory notes. In the caseswhere shareholders are not particularly comfortable with hedging policies, manyreported that they took these views on board but it did not preclude or preventthe management going ahead with hedging in any case.
One area that generated a fair amount of comment was the question: what do themining companies feel about the level of hedging expected by the bullion banksin the context of project financing? In a number of instances this issue was of no
Quotable Quotes
Responses to the question: Are miners con-cerned that their hedging affects the goldprice?
“We try to stand back in price weaknesss”.“We have to look after ourselves andhedge anyway”.“Miners should only hedge to cover costs”.“Our collective activity does affect theprice”.
But within this sample, the level of con-cern varied, as the comments in the accom-panying text box shows.
Quotable Quotes
Responses to the question: What are share-holders’ attitudes toward hedging?
“Our shareholders accept that our policyis one of ensuring downside protectionand not one of revenue enhancing”.“Our shareholders want an ideal combi-nation of low costs and prudent hedg-ing”.

Gold Derivatives: The Market View84
relevance. Of those who had been subject to this, a number felt comfortable withthe requirements, provided they were accounted for in the initial financial discus-sions. Others felt more strongly, implying that what the banks required was tooonerous relative to the mines’ in-house hedging policies. Others felt they wererestrictive and, in general, attempted to avoid involvement. One company admit-ted to walking away from a financial package because of the hedging requirementsimposed by the commercial bank involved.
On a global basis, the industry was in gen-eral extremely critical and concerned aboutproposed changes to the accounting sys-tem as the accompanying text box indicates.It is premature to assess how the introduc-tion of the new accounting requirementswill eventually impact on the collective de-cision to hedge and this is one area of thestudy which will require further assessmentas the accounting practices are introduced.As discussed in the summary chapter, weconclude that a good deal of the potentialimpact on hedging decisions will dependon exactly how the various products are de-fined for accounting purposes and whetherthey will be treated as hedge products.
And the final question we put to the min-ers was probably the most obvious, that be-ing: what are their attitudes towards cen-tral bank selling and lending of gold? Ingeneral, the industry’s attitude towardssales was a little less negative than one mighthave expected although a number of com-panies were vehemently against the salesprogrammes both historic and planned.Others were more accepting and the accom-panying text box displays a full spectrumof opinions. As expected, the companies’ at-
titudes towards lending were, in general, more accommodating. Many perceivedlending as a very acceptable alternative to sales and a necessary precursor to themining industry being able to execute their hedging programmes. A numberexpressed the view that for gold to remain a viable reserve asset, considerable li-quidity was necessary, which of course predicated lending. Others believed thatthe level of lending should be limited. Only one company acknowledged that itwould gladly trade the ability to hedge for a contraction in the lending market.
Quotable Quotes
Responses to the question of new account-ing requirements:
“It’s overkill and excessive”.“The authorities are removing the incen-tives to mine”.“It’s driving us crazy”.“Disclosure is very necessary but this is tooonerous”.“It fails to recognise risk management”.“FAS133 is poorly prepared and in gen-eral unreasonable”.
Quotable Quotes
Responses to the question: What is youropinion of central bank sales?
“No problem if they are orderly”.“They are entitled but they need to un-derstand the impact on the market”.“We can live with the sales - they are free todo what they want”.“They are their own worst enemy”.“We are dismayed by the salesprogrammes”.“Sales into price weakness are myopic”.

Gold Derivatives: The Market View 85
CHAPTER 3 : THE COMMERCIAL BANKS
This chapter looks at the bullion banking industry which, essentially, has servedas the conduit for derivatives. The commercial banks have collectively been asupplier of credit, the creator of derivative products, the executor of price riskmanagement strategies and a securer of liquidity. While most banks involved ingold have some relations with each sector of the market, distinct sectoral andregional strengths are readily apparent. These are discussed in as much detail asthe confidential sector will allow. Furthermore, the commercial banks involved ingold have been subject to far-reaching structural changes over the past decade.The impact this might have had on the industry is also discussed in detail. Fur-ther, the Washington Agreement of September last year brought into stark reliefsome of the issues now faced by the bullion banks, particularly with respect tocredit and margin. At the time of writing, it was still not quite clear how theseissues would resolve themselves and it is recommended that further monitoring ofthis is warranted. And finally, this chapter assesses the turnover statistics coveringderivative exposures which are in the public domain and compares those to esti-mates of the net trading limits associates with the collective bullion dealing com-munity. It also attempts to review the levels of proprietary trading.
The current status of bullion banking
There are currently a little over two dozen commercial banks who are to a greateror lesser degree actively involved in bullion banking. These are listed in alphabeti-cal order in Appendix 3. The five current occupants of the fixing seats comparedwith those of ten years ago are tabulated as follows:
Current Fixing Members Members of a Decade Ago
NM Rothschild NM RothschildScotiaMocatta Mocatta and Goldsmid *1HSBC* Samuel Montagu *2Deutsche Bank* Sharps Pixley *3CSFB* Mase Westpac *4
*1: Mocatta via Standard Chartered and then Bank of Nova Scotia to becomeScotiaMocatta.
*2: Samuel Montagu via Midland to HSBC.*3: Sharps Pixley via Kleinwort Benson to Deutsche Bank.*4: Johnson Matthey Bankers via Mase Westpac to become Republic National
Bank of New York and then HSBC. Seat sold to CSFB.

Gold Derivatives: The Market View86
The organisation of the bullion banking community is currently very fluid, highlycompetitive and, as a consequence, confidential in the extreme. Over time, verymarked regional and sectoral patterns have emerged in which various permuta-tions and combinations of the existing banks dominate. This structure is particu-larly dynamic. It can and does change with time and circumstance. Most bankshave some business with each sector of the market. Many have found marketniches and deliberately specialise in servicing a particular sector. A good propor-tion of the banks have a global, 24-hour presence although most national deskshave developed regional expertise and interests.
Our analysis showed the following:
• There are no more than eight major participants in derivatives and perhapsanother five which we would define as second tier (as opposed to market markers);
• There are no more than nine major participants in the spot market in London;
• There are fewer than ten major participants in the spot market in Europe (in-cludes the UK), including at least four which are active in the physical market;
• There are nine major participants in the forward market in Europe;
• There are at least four major participants in the Australasian markets;
• There are fewer than ten participants who have a particularly strong presencein the fund industry;
• There are seven participants who have a particularly strong presence in theofficial sector;
• There are seven participants who have a particularly strong presence in themining sector;
• Perhaps eight banks have particularly active proprietary trading operations.
Traditionally, the role of the commercial banks in the gold market has remainedbroadly unchanged, only the sectoral and product emphasis has evolved as thegold market becomes increasingly more sophisticated.
Originally, the emphasis was on the physical market and the banks acted as buy-ers, sellers, stock holders and distributors of metal. The twice-daily London goldfixing has historically represented the essence of these functions. A natural com-ponent of this was, and still is a trading role involving the active quotation of two-way prices.
Gold Derivatives: The Market View 87
The cause and effects of the gradualrestructuring of bullion banking
The structure of the London gold fixing as tabulated at the beginning of thischapter has changed over the last ten years, certainly in name if not so much inactual seat ownership. If considered a microcosm of the greater market, it pro-vides a good indication of the extent to which the bullion banking industry hasrestructured.
This transformation of the industry has come about for several reasons, someinternal to the gold market itself and others as a result of changes within bankingin general. The gold price itself, but more importantly the sharply lower goldprice volatility over the years contributed largely to the changing fortunes experi-enced by the bullion bankers. One year average volatility since 1976 is shown inthe following chart.
The second major function is the provision of credit for all bullion banking trans-actions. This includes trade finance for consumers, lines of credit for investors andproject financing and day-to-day hedging facilities for the producers.
The third function applies to the lending market in which the bullion banks haveacted as intermediaries and have aggressively attracted liquidity to lubricate theswiftly evolving derivative market.
This necessarily provided a fourth function, which was the creation of derivativeproducts and the marketing of gold-base financial packages designed specificallyfor the end user. Project financing (usually derivative-based) provided much ofthe stimulus behind bullion banking throughout the 1980s as mine productionin Australia and North America expanded very sharply. The subsequent growthin the global hedge book has largely sustained this profitable component of bul-lion banking.
The fifth function is associated with proprietary trading and risk taking to thebanks’ own accounts. This has and always will remain an area of bullion bankingleast discussed. For this very reason, it has been vulnerable to much rumour-mongering; being one of those market sectors, like the short positions held by thehedge funds, in which alleged activities can be neither proved or refuted. Whilevery much in evidence, the volumes of trading associated with this role have prob-ably been overdone by the media and over-estimated by market observers. Ourestimates of the volume of proprietary trading are deduced from our supply anddemand balance of the lending market, which is presented in the summary chap-ter of this report.

Gold Derivatives: The Market View88
GOLD PRICE ONE YEAR VOLATILITY ANNUAL AVERAGE 1978-1999
0
10
20
30
40
50
60
1976
1978
1980
1982
1984
1986
1988
1990
1992
1994
1996
1998
PE
RC
EN
T
Lower volatility combined with markedly lower trading ranges has implied tighterbid/offer spreads and contracting profit margins. The next chart shows the an-nual average gold price since 1986 but more tellingly, the price range associatedprice with the years’ highs and lows. Initially, it was the physical market that wasadversely affected by the very narrow price ranges and bid/offer spreads. The profitmargins were progressively squeezed and this was probably a primary reason why thebanks began to place so much marketing and trading emphasis on the derivatives.
But when faced with a similar price regime, why should the derivatives haveoffered a substantially more rewarding profit profile? We can suggest two major
Data source: Virtual Metals Research & Consulting Databases
Data source: Virtual Metals Research & Consulting Databases
GOLD PRICE RANGE ANNUALLY 1968-1999
0
200
400
600
800
1000
1968
1973
1978
1983
1988
1993
1998
US
$/O
Z
HIGHLOWAVERAGE

Gold Derivatives: The Market View 89
reasons. Firstly, there was enormous demand for derivative products especially inthe wake of the Australian and North American mining booms of the mid-1980s.Initially the gold loan industry and then more complex derivative-based projectfinancing provided business opportunities for the bullion banks in a way not seenin the physical market. And secondly, the variety of products emerging as theOTC market evolved as swiftly as it did, implied that many products being mar-keted were individually priced. This provided the banks with considerable lati-tude with respect to price variation. But with time, it was inevitable that thiscomponent of bullion banking soon became increasingly competitive and profitmargins have consistently been eroded. Since the Washington Agreement, andthe very obvious move away from exotic and leverage products and back tovanilla instruments, we expect this erosion of profit margin to continue.
Over the years the restructuring of bullion banking has manifested itself in anumber of ways: total withdrawal from the market on the part of some banks;mergers and acquisitions; and finally the internal contraction and re-design ofexisting operations.
The withdrawal of a bank from the business is final, whereas mergers and acqui-sitions inevitably result in the duplication of services and skills. The effect thatboth these outcomes have on the availability of credit is probably the most im-portant issue and is returned to later in this chapter. However the restructuringmanifests itself, it has addressed cost cutting and the question of profitability andthese developments have had both positive and negative effects on the gold mar-ket. In general, we maintain that a contraction of bullion banking is deleteriousto the longer-term health of the industry.
In a number of instances the market has seen internal restructuring. The golddesks have been greatly reduced to the extent that they have been absorbed intoother trading desks, typically foreign exchange or fixed income. Very often thishas occurred when decisions are taken at board level, far removed from the day-to-day bullion dealing, but more importantly, when that particular board doesnot have a member who is prepared to champion the cause of gold and act as amentor to the gold team. Without that active support, the decision to reducegold’s role within the organisation by absorbing it into another area of business isa logical consequence and is then a relatively easy decision. While this may securequite substantial cost savings, it does have the psychologically negative impact ofreducing gold’s status and role in the minds of all those within the bank but moreimportantly in the minds of its clients. The bullion dealers run the risk of losingtheir identity as well as their status. Thus often a vicious circle is set in motionwhich simply further reduces gold’s role and perceived status in the particularbank and thus an initial decision to reduce the banks exposure to gold then be-comes self-fulfilling.

Gold Derivatives: The Market View90
Many interpret the restructuring as a proactive response on the part of the banksin their adjustment to meet the demands of the changing and dynamic marketfrom which a healthier state of affairs will emerge. In many cases there have oftenbeen advantageous synergies between merging businesses. Others have resultedin massive economies of scale allowing for the streamlining of what used to becumbersome cost centres.
On the more negative side, cost cutting exercises have yielded short-term gainsbut perhaps at the expense of longer-term commitment to the business and theability to service the clients’ needs. Non-income generating areas of activities,especially research, tend to be the first areas to suffer. Ironically with only mini-mal cost savings the true cost of cutting back on research eventually becomesapparent. It undermines the flow of information to and from the bullion tradingdesks. The knock-on effect is that the flow of market insights and opinions to theclient is markedly reduced.
Restructuring, but primarily cost-cutting exercises, also often result in a dilutionof expertise and experience. More often than not, when a cost saving exercise isimplemented, it is the more senior experienced staff members that are the first toexit, leaving the younger less experienced staff in place who command lower sala-ries. This can also unsettle the client and some mining companies did expressconcern about the long-term commitment on the part of some banks to the goldbusiness. The sudden staff turnover, leaving more junior personnel at the helm, isnormally seen as the first indication of a changing attitude towards gold on thepart of the banks. On the positive side, these redundancies create opportunitiesfor those banks taking a contrarian attitude and expanding while others are cut-ting back. Recruitment from a large pool of redundancies gives access to experi-enced, often highly valued, team players who bring to their new partners a wealthof knowledge, coupled with respect and reputations which stand them in verygood stead with the client base.
Reduced staffing in general greatly increases the remaining staff ’s workload. Asresponsibilities increase, less attention can be paid to detail and with respect toderivatives, perhaps less time is then being spent on the creation of new andinnovative products1 . When traders are over-stretched they will naturally tend torely on tried and trusted off-the-shelf products with a proven track record ofreliability and stability.
The upshot of all these factors suggests a deterioration in the bank/client relation-ship, unless of course the individual bank works hard at maintaining client rela-tionships which many do very diligently. Some of the very positive commentsmade by the mining industry during the course of our interviews are evidence of1 Those cynics among us could well argue that this is not a bad thing, particularly in the wake of the
Washington Agreement!

Gold Derivatives: The Market View 91
this. Because of its size, the gold market remains very much a personal one, basedon relationships which have often taken years to establish. Discussions with themining industry suggest that this is felt most when complex project specific hedgingis in place, where the two counterparties have worked closely together for manymonths in structuring complex strategies specific to a mine or company. A sud-den hiatus in that continuity because of a restructuring or merger can often set abank-client relationship back many months. In some cases, the relationship mightbe seriously damaged, possibly even irrevocably, and business is lost as a result.Ironically, this tends to further undermine that bank’s presence in the industry.
Over the past five years, mergers that create fewer but larger trading entities, haveconcentrated the presence in the market of a handful of existing banks. This con-centration increases those banks’ market shares but probably overall detracts fromhealthy competition when it comes to product creation, pricing, marketing andperhaps even customer service. This concentration of business has the additionaldisadvantage of attracting attention to the larger banks making it that much moredifficult for those banks to operate in the market without attracting undue comment.On the more positive side, this increased visibility and profile of the very large bankshas given smaller banks and newcomers to the market, a window of opportunity toexpand their market share and gain a foothold in a market that would otherwise haveremained impenetrable. Niche markets exist in many areas of bullion banking andthis will continue to evidence itself provided the presence of the majors do not over-whelm their more junior competitors and leave them no room for operation.
The availability of credit to the gold industry is another area greatly influencedby the restructuring of bullion banking. The shrinkage in the number of banksactive in the gold market implies less in the way of credit lines for all the majorusers of gold-based products, derivatives or otherwise. Here more so than perhapsanywhere else in the industry, the one plus one not equalling two principle ap-plies. This is particularly true with respect to the numerous banking mergers wehave seen as opposed to the withdrawal of banks from the industry. The creditfacilities of a newly merged banking entity almost certainly do not equal the sumof the credit facilities previously enjoyed by the two merging organisations. Thuscredit potential in general has been on the decline. Furthermore, some expressedthe view that the problem may indeed be more widespread than specific goldtransactions. In many producing countries, but specifically countries like Ghanaand South Africa, the credit lines, because of sovereign issues, might be limited tobegin with and the restructuring has only exacerbated the problem. Sovereigntymore often than not accounts for the lion’s share of the existing credit facilities.Therefore, it is not necessarily only the smaller mining companies that may expe-rience the lower credit ceiling and a limit to what they may be able to establishand maintain in terms of price protection programmes. How the bullion bankswill address this question remains to be seen. One must expect them to leave nostone unturned in their efforts to unlock every bit of credit capacity.

Gold Derivatives: The Market View92
The Washington Agreement and the resultant price and lease rate response dur-ing the fourth quarter of last year had a profound influence on the bullion bank-ing community. The fact that the mining industry has over the years succeeded innegotiating out of most hedging agreements with the commercial banks mostreferences to margin, implies that the hedging and lease rate exposures at riskduring the fourth quarter remained largely on the books of the banks. The dailyresponse to the lease rate increase immediately after the September 26th is de-scribed in more detail in chapter 1. The whole episode clearly generated withinthe banking community a considerable rethink with respect to credit analysis,risk and extension.
The full outcome and implications are still to manifest themselves although wecan even at this early stage suggest ways in which the banks are likely to respondto increasing credit concerns.
Firstly we anticipate that the banks will require from the mining community asubstantially greater degree of disclosure with respect to a number of parametersassociated with price risk management. Where hedging agreements have been inplace for some time, this information has probably already been supplied eitherdirectly, but in most cases probably indirectly, through the gradual establish-ment of the bank/mining company relationship. Where new agreements are be-ing initiated or existing agreements being extended, the request for informationwill probably be more formal. This could entail a number of issues including:
• A more formalised description of the company’s hedging philosophy detailingthe rationale behind the decision, the overall framework of the programme as itrelates to current and planned production and more importantly, reserves. Withrespect to the overall hedging plan, the banks will probably want details re-garding the motives for hedging: whether the mining companies perhaps in-tend hedging a proportion of planned production on a day-to-day basis, orwhether the hedging is project specific;
• A more formalised description of the reporting hierarchy and levels of decisionmaking and hedging responsibilities within the mining company. This wouldinclude details of lines of reporting from board level though to the treasurydepartments, with details of how much trading latitude the treasury has with-out recourse to the board;
• Greater disclosure of product usage and the overall levels of hedging exposure.This necessarily implies exposure as it relates to other counterparties together
The impact of the WashingtonAgreement On Gold

Gold Derivatives: The Market View 93
with greater disclosure as to how the resultant hedge exposure is monitoredboth internally and externally. Perhaps a greater degree of comfort with respectto the mining company’s ability to stress-test the hedge book might be deemednecessary;
• Further details of accounting practices and the company’s preparedness for theintroduction of the new accounting standards;
• The price at which reserves in the ground are valued by the various miningcompanies will no doubt come into focus. This will be particularly true ofcompanies which over the years have tended to hedge reserves in the ground, asopposed to annual planned production. The longer the gold price remainsconvincingly below $300/oz, the greater the probability of this becoming anincreasingly important issue for the bullion banks.
From this, it seems likely that the commercial banks are going to re-rate themining companies relative to each other and relative to the rest of the bank’scredit exposures, if they have not already done so. This implies a greater hedgingpremium likely to be levied on those mining companies with relatively weakerbalance sheets and less advantageous cost and production profiles.
Where margin can be re-introduced into hedging agreements, this will be a prior-ity although, as we point out in chapter 2, the mining industry collectively isvehemently opposed to margin. Overall, we believe that while margin will remaina major issue for the commercial banks, this is one battle that they cannot winand alternative ways to reduce their hedging risk will have to be found.
The Washington Agreement has also no doubt had a profound affect on productcreation, especially any instrument that might be deemed overly leveraged oreven marginally exotic. Derivative users, especially the mining companies, arealready showing a distinct lack of appetite for the more complex products that, inturn, will reduce the incentive on the part of the commercial banks to generatenew and perhaps outlandish mechanisms. If the derivative emphasis remains onthe use of vanilla products, the overall global derivative book is likely to becomesubstantially less complex in its make up. The marketers of complex products aregoing to find it difficult to persuade clients to make use of new products and thuswill have to focus on the tried and trusted instruments. This is likely to render thederivative side of bullion banking even more competitive than before and is likelyto reduce commissions and profit margins even further. Thus it seems likely thatone of the effects of the Washington Agreement has been to render bullion bank-ing an even more difficult industry in which to make money. Many will arguethat this is not necessarily a bad thing. However, it could generate a further andcontinued restructuring of the industry that will concentrate the business evenmore in the hands of a few dominant trading entities. The advantages and

Gold Derivatives: The Market View94
disadvantages of a potential further consolidation of the industry were discussedin detail earlier in this chapter but our overall conclusion is that the pros areoutweighed by the cons and this is, in general, not a good sign for the interna-tional gold market.
Current trading limits and exposuresGiven the confidentiality associated with trading limits, an assessment of thebullion banking community’s collective net exposure during any period is a par-ticularly difficult area of research. This is compounded by the fact that any statis-tics referring to trading and exposures, especially derivatives, that are made publictend to be grossed-up total turnover figures which if misinterpreted can give anextremely distorted view of reality.
While the bullion banks were understandably not forthcoming about their owntrading limits, they were prepared to enter into open discussions about the col-lective total allowing us to reach a consensus. Without doubt, over the past dec-ade total trading limits associated with the counterparties have declined. This hasa good deal to do with the restructuring and consolidation of the industry whichwas discussed in detail earlier in this chapter. But it also became apparent thatindividual banks have reduced their limits. Thus, while net trading limits in thelate 1980s and early 1990s might have collectively totalled 10 million ounces,the state of affairs today is considerably more conservative2 . Currently, undernormal circumstances, our analysis of the two dozen banks involved yielded anestimate of 2.5 to 3.5 million ounces (78-110 tonnes) with any evidence of limitscollectively extending towards 5 million ounces considered a possibility only un-der extreme circumstances. By net limits of 3.5 million ounces we are referring toa collective net short or long position (outright uncovered exposure) over a givenperiod of time, perhaps overnight. Furthermore, since it would be most unusualfor all the banks to be simultaneously either net short or net long, the estimate ofcollective limits should be seen as a maximum extreme. Thus, for example, abank may be running a substantial derivative book consisting of many millions ofounces’ worth of producer hedging or options. These exposures would have beensquared away - in the case of forwards offset in full and in the case of options offsetthrough delta neutrality. Thus the net exposure (outright risk) would be consid-erably smaller, perhaps in the order of 150,000-200,000 ounces.
These figures pertaining to outright exposures need to be compared with thegross turnover statistics that are made public. Most recently it has been the OCCfigures that have attracted the most attention as well as those statistics publishedby the Bank For International Settlements.
2 All these estimates of net exposures assume that the collective market is all trading in one direction(either all short or all long)– something that rarely if ever occurs.

Gold Derivatives: The Market View 95
Firstly, the limitations:
• The figures address commercial banks in the United States alone. Thus thederivative trading associated with European and Japanese bullion banks, forexample, are not included. The figures published by the BIS, while in stricteststatistical terms not quite comparable with the OCC figures, do go some wayto remedy this;
• The figures cover commercial banks only and thus exclude partnerships orthose trading entities that are not registered to take bank deposits. Some of thelarger names therefore are excluded;
• The figures represent grossed-up total turnover statistics associated with sub-stantially smaller net exposures and thus, if misconstrued, can give a very dis-torted picture of the actual underlying derivative positions.
The concept of grossed-up turnover requires further discussion since if taken atface value an exposure of 9,600 tonnes could appear worrying. (Together with theUS$243 billion or some 25,000 tonnes of derivative “exposures” reported by theBIS covering major banks and dealers in the G10 the figures look even morealarming). In this regard we believe that this outstanding position should not bedescribed as “exposure” as it certainly could have negative if not alarmist connota-tions. A more objective reference would be a commercial banking presence ingold-based derivatives. A worked example demonstrates how these figures couldbe derived.
Consider for example, in a particular quarter, a mining company that elects to sell10 tonnes forward. The counterparty (the commercial bank) takes onto its book along position of 10 tonnes that it immediately offsets by selling forward 10 tonnesto the proposed delivery date. The net position on the book of the commercialbank is zero but the turnover associated with the position is 20 tonnes. This 20tonnes will be reflected in the OCC numbers. Now perhaps in that quarter the
The regulator of national banks in the United States (the Office of the Comptrol-ler of the Currency) publishes a quarterly report on the derivatives activities of UScommercial banks. The report for the fourth quarter of 1999 shows that the no-tional value of the off-balance sheet exposure of the 416 commercial banks regu-lated by the OCC in gold derivatives stood at $87.6 billion. Of this total $71.9billion is attributable to just three banks (Chase, Morgan Guaranty and Citibank).At current gold prices, this corresponds to around 9,600 tonnes of gold.
In the light of our estimates of net trading limits, a more detailed analysis of thesefigures gives some insights into gold derivatives provided the statistics are inter-preted correctly, placed into perspective and their limitations acknowledged.
Gold Derivatives: The Market View96
mining company elects to buy back 5 tonnes of its forward sale. The commercialbank will unwind the exposure in both legs of the original transaction. Thus themining company has sold forward 5 tonnes, the commercial bank’s net exposureis still zero but the turnover against the whole strategy in that quarter is now 30tonnes.
Options result in even more paper trading. When a mining company buys a putoption for price protection, the commercial bank in writing the option takes thefull value of the underlying onto its books. It then delta hedges a percent of thatexposure depending on the strike price relative to the spot price at the time ofwriting, but usually around 40%. This primary delta is recorded in turnover.Then on a virtually daily basis as the spot price moves relative to the option strikeprice, the commercial bank continues to buy or sell a small percentage of theexposure in order to render the exposure delta neutral. But all this buying andselling is clocking up turnover - all of which will be reflected in the OCCnumbers. With a global hedge book well in excess of a nominal 4,000 tonnes, a simplegrossing up of merely the forwards and options with an initial delta (not evenconsidering secondary delta hedging) brings the total to in excess of at least 7,000tonnes of turnover. Thus the OCC figure of derivative “exposure” of in the orderof 10,000 tonnes should not be cause for concern. In fact, this figure should beconsidered an absolute minimum. As already noted, excluded from the total arenon-deposit taking banks and the figures associated with the non-USA commercialbanks.
In a sense, these figures are very similar to the enormous trading volumes reportedby Comex/Nymex where we know one ounce of gold gets traded over and overagain but delivered or settled for only once.
The OCC numbers do, however, demonstrate a close and positive correlationbetween turnover and price volatility. The accompany chart shows this clearly,using the 1-month volatility, particularly the sharp increase in derivative turnoverin the second half of 1999 as a direct result of higher volatility in the wake of theWashington Agreement.

Gold Derivatives: The Market View 97
ONE MONTH PRICE VOLATILITY VERSUS TOTAL US COMMERICIAL GOLD DERIVATIVES
0
5
10
15
20
25
30
1995 1996 1997 1998 1999
PE
RC
EN
T
10
30
50
70
90
110
$BIL
L
VOL
GOLD
Data sources: OCC Quarterly Reports, Virtual Metals Research & ConsultingDatabases
ANNUAL PERCENT GROWTH IN US COMMERCIAL BANK DERIVATIVES (GROSS)
0
10
20
30
40
1991 1993 1995 1997 1999
PE
RC
EN
T
TOTAL
GOLD
Data Sources: OCC Quarterly Reports
It shows that the growth in all derivative turnover has greatly exceeded gold (withthe exception of 1999). The implication is that between 1996 and 1998, goldhas been accounting for a declining proportion of total derivative turnover. Thisdata therefore does not support the theory of large derivative-based exposuresbuilt up by the US commercial banks. The exception was 1999 where derivativeturnover in gold increased sharply. Again this is evidence of a response to thesurge in price volatility in the wake of the Washington Agreement.
The other interesting result of an analysis of the OCC numbers relates to thegrowth in gold derivative turnover relative to growth in all derivative activity inthe USA. The following chart shows this.
Gold Derivatives: The Market View98
Proprietary trading and trading to ownaccount
If trading limits proved to be an area of confidentiality then obtaining any statis-tics pertaining to the level of proprietary trading on the part of individual banksproved difficult in the extreme. Compounding the problem of confidentiality isthe fact that most derivative books are dynamic and managed very actively on aday-to-day basis. It is therefore difficult to draw any conclusions about a compo-nent of the industry that is constantly undergoing change. A snapshot viewfrozen in time might be possible but only to be rendered inappropriate soonafterwards. However, our research did reveal some trends which shed a little lighton the issue.
Firstly, the OCC reports noted that proprietary trading against all derivatives(not just gold) represented 4% of the volume. With respect to how this order ofmagnitude might apply to gold, detailed discussions with the bullion bankingcommunity revealed the following:
• There is a full spectrum of proprietary trading habits among the bullion banksand no generalisations can be made. For some whose policy it is to take onlyvery limited positions to their own account, the figure of 4% is obviously sub-stantially too high. For others, this proved to be too low and representations ofanything towards 8-10% or in limited cases, even higher, could be deemedmore appropriate. Furthermore there appears to be no correlation between thepropensity to trade to own account and size or presence in the market. Bankswith substantial market-making facilities and a large exposure to gold may ormay not be aggressive proprietary traders. Conversely, those banks with a smallerpresence in the market, lower trading limits as well as being niche marketspecialists might just as commonly be relatively aggressive proprietary traders;
• The level of proprietary trading can also vary considerably depending on themarket used. Many of those interviewed suggested that 4% in the spot or cashmarket might in fact be a little low whereas it might be overstating the truepicture with respect to the forward and options markets.

Gold Derivatives: The Market View 99
CHAPTER 4 : THE FUNDS AND MONEYUNDER MANAGEMENT
Introduction and objectives
The hedge funds and commodity trading advisors have long been a dynamiccomponent of the gold industry. Their presence, however, does not imply thattheir activities are well understood or readily apparent, in fact the contrary is true.Hedge fund trading habits, metal exposure and day-to-day influence on the mar-ket have been subject to much speculation over the years and associated all toooften with wildly exaggerated claims based on precious little in the way of fact. Asa consequence, the money-under-management industry has regularly been citedas the villain of the piece during times of markedly increased price volatility, oftenwhen there is simply a dearth of other acceptable and readily apparent explana-tions. This situation is compounded by the absence of any reliable public domaindata that renders such claims difficult to prove or refute.
A primary objective of this chapter and its associated appendices is to present astatistical analysis of the data covering the fund industry for the purposes of un-derstanding the nature, structure and health of what has become a major partici-pant in currency and commodities markets. Without an appreciation of the money-under-management industry in its entirety, it makes little sense in trying to iso-late and draw conclusions about those individual trading entities which may beactively involved in the gold market. Furthermore, the state of health of the over-all industry gives a good indication of what might be expected from specific funds.For example, if the industry as a whole is in an aggressively expansionary phasewith robust capital inflows responding to a period of strong financial perform-ance, we must acknowledge that those funds with an interest in gold might wellbe in a position to step up their activities. The converse also holds true. A climatein which the funds yield below average returns and hence are subject to investorredemptions is unlikely to be conducive to an aggressive and indeed risky forayinto the precious metals markets and in fact may be forced liquidators of preciousmetals exposures. Thus the overall analysis of the industry provides a backdropand point of initial reference from where all other research into those funds whichare or might be involved in gold can be completed. The results of this analysisare summarised in this chapter but detailed in Appendix 4 together with all thestatistical tables supporting the analysis.
Once the fund population in general has been placed into context, the secondobjective of this study can be addressed, that being an attempt to isolate thosefunds which are or could be active in the gold market. The discussion that follows

Gold Derivatives: The Market View100
The Research Findings
The fund industry as it influences the gold market can be subdivided into twobroad categories, namely the momentum traders and the hedge funds.
The momentum traders, primarily Commodity Trading Advisers (CTAs), tend tobe technically driven entities whose managers have little understanding, or in-deed interest, in the commodities or instruments in which they have exposure.Their trading decisions are taken purely on the basis of price movements andtechnical trends, which render their exposure to commodities usually short-termin nature. They are, therefore, very much price followers rather than setters andtend to be more active during periods of higher price volatility.
Within the fund population, there are several hundred of these CTAs which havethe charter to trade gold. Experience in dealing with the data has allowed us toidentify these funds quite readily. Since they tend to have relatively small capitalbases (although there are some very notable exceptions), their individual tradingbehaviour is of little consequence. However, their collective activity in the market,particularly since they are technical trend followers, can certainly have a markedinfluence on the gold price, specifically in the short term.
In terms of trading mechanisms, momentum traders are in general confined toExchange traded products and tend not to have the brief to make use of the OTCmarket, although there are again some notable exceptions. The fact that the ma-jority makes virtually exclusive use of the Exchanges, renders their activities sub-stantially more visible than the hedge funds. Thus their presence can be trackedwith reasonable accuracy through the Exchange statistics, which are publishedregularly.
details our findings. Very recent developments within the fund industry suggesta marked change in strategic thinking on the part of some of the major tradingentities. This is likely to have a far-reaching impact on their attitudes towardsprecious metals and taking exposure in those markets. These developments arediscussed in more detail in this chapter.

Gold Derivatives: The Market View 101
COMMITMENT OF TRADERS DATA (NON-COMMERCIAL) Net long/short
Month end-March 1995 to January 2000
-100000
0
100000
Mar
-95
Aug
-95
Jan-
96
Jun-
96
Nov
-96
Apr
-97
Sep
-97
Feb
-98
Jul-9
8
Dec
-98
May
-99
Oct
-99
Con
trac
ts
ABOVE THE LINE =LONGSBELOW THE LINE=SHORTS
WASHINGTON AGREEMENT ANNOUNCED
Data Source: CFTC Website
The accompanying chart shows all too clearly that since early 1995, the momen-tum traders have maintained an almost continuously short position in the goldmarket. As at the end of June 1999, these trading entities accounted for a shortposition of 254 tonnes. By December 1999, these shorts stood at a mere 8 tonnes,having been covered in as part of the market’s immediate reaction to the Wash-ington Agreement and subsequent price rally during the fourth quarter of theyear.1 During the first three months of 2000, the net short positions had beenreduced even further and in fact stood by mid-March at a net long position ofsome 46 tonnes. By the end of May, this long position had yet again reverseditself and momentum traders collectively held a short position of 135 tonnes, thehighest level recorded during the year.
The hedge funds represent a totally different presence in the gold market. Manyof the managers of these funds are primarily fundamentalists in their analyticalapproach. More often than not they have a thorough understanding of the supplyand demand components of the markets in which they are exposed. Their invest-ment decisions tend therefore to be strategic and hence they maintain an interestin a commodity for a substantially longer period than the CTAs. With consider-ably higher capital bases compared with the CTAs, the ability to borrow againstthese bases to gain maximum leverage and the charters to make use of the OTCmarket, they have the potential to make their presence felt and in no uncertainterms. These are the entities primarily involved with what has become known asthe “carry trade” whereby the gold leasing rate has given hedge funds the incen-tive to borrow inexpensive metal, sell it short and raise cost-effective dollars.
1 These figures have been taken into account in the supply/demand balance appearing in the summarychapter.
Gold Derivatives: The Market View102
In the absence of published data2 , this carry trade has given rise to claims that theshort positions held by the hedge funds have been and still are of a magnitudesufficient to create and sustain a substantial squeeze in the gold price3 . Our re-search has suggested that while there is indeed an element of carry trade, the totalshort position that has built up as a result is nothing like the volumes claimed byothers.
We conclude that fewer than a dozen major hedge funds are actively involved ingold and by the end June 1999, their collective short position (and that of anyshort position held by the commercial banks through proprietary trading) wasperhaps a little under 400 tonnes4 . Immediately after the Washington Agree-ment announced on 26th September 1999, there was clear evidence of short cov-ering, which generated some of the momentum behind the subsequent surge inthe gold price. Our information suggests that a good proportion, although per-haps not all, of this short exposure was indeed covered in during the fourth quar-ter of last year. The mere fact that the gold price failed to maintain its upwardmomentum at $330/oz and beyond is compelling empirical evidence to suggestthat the short positions were indeed substantially less than others have claimed.Further analysis of the lending market suggests that by the end of December1999, this short position stood at a little under 390 tonnes, marginally lowerthan the end June period. The reason for the probable re-establishment of theseshort positions is most likely as a direct result of the sharp decline in the leaserates during the final months of last year. This would have no doubt encouragedrenewed carry trade borrowing, particularly in the wake of higher interest ratesespecially in the United States.
Early during the second quarter of 2000, the market witnessed the voluntaryliquidation of Tiger Management, one of the major hedge funds known to beinvolved with the precious metals and specifically the gold carry trade5 . The factthat this fund in its devolution did not have a substantial impact on the goldprice is added empirical evidence that these enormous short positions simply didnot exist. Not long after this announced liquidation, came a second press releasefrom the Soros trading entity to the effect that it would be restructuring its nu-merous funds to render them less exposed to high risk trading strategies. Againthis announcement came without any upward pressure on the gold price. Thesetwo public announcements have substantial bearing on the gold carry trade. Itreduces by a very large margin the amount of managed money that could berelated to the existing carry trade since these funds accounted for a large
2 Analysis of annual accounts published by the hedge funds yield little in the way of meaningful detail.3 Claims of short positions in excess of 3,000 tonnes have been commonplace.4 In the absence of any reliable data, we have had to deduce the implied short position by eliminating allother identified destinations of lent gold. This analysis appears in the summary chapter of this report.5 Last year prior to the September price rally, rumoured short positions associated with this fund alonetotalled anything up to 800 tonnes of gold.
Gold Derivatives: The Market View 103
proportion of the associated capital bases. It might also herald a change in strate-gic thinking which might become commonplace among the remaining fundswhich have been known to participate in the gold market. Historically, these twofunds have been trendsetters and where they go others have usually followed.This, however, does not necessarily imply an overnight dissipation of the carrytrade phenomenon since other smaller and perhaps less leveraged funds mightstep into the breach. Our research isolated a minimum of over 100 funds whichcould potentially participate in the gold market.
While gold lease rates remain at a substantial discount to money market rates, thecarry trade is likely to remain a feature of the gold market and one that should notbe forgotten when assessing the impact an artificial unwinding of the producerhedge book could have on market conditions. (This is discussed in more detail inchapter 2.) Only when the cost of borrowing gold approaches and remains sus-tainable at or near dollar interest rates, will the incentive to borrow inexpensivegold be negated6 . The extent to which funds will still make use of the concept ofborrowing cost-effective gold needs to be monitored on a regular basis especiallyin the light of recent developments.
6 The prognosis for the lending market and the cost of borrowing gold is discussed in more detail inchapter 1 and the summary chapter. A case for higher lease rates is debated in chapter 6.

Gold Derivatives: The Market View104

Gold Derivatives: The Market View 105
CHAPTER 5: THE DERIVATIVEPRODUCTS
Introduction and objectivesThis chapter is a stand-alone section of the study which sets out to explain in alittle more detail than one usually sees the structure and behaviour of some of therisk management products that have been marketed. It is not our intention to gointo lengthy mathematical descriptions of these products. Instead we are moreconcerned about what these products mean for the global hedge book and theinternational gold industry in a practical way, particularly under stress conditionslike those the market experienced in last September and early October last year.
We have attempted to describe as many products are we could, essentially to givethe reader an appreciation of the many permutations and combinations of hedg-ing mechanisms available. The list is by no means complete and should be con-sidered as illustrative rather than exhaustive. For example, we have not gone intodetails regarding variable volume and price forwards or binary options. Despitethis acknowledgement, our analysis of the hedge book that appears in chapter 2shows that the majority of these products are not in active use and the miningcommunity has distinct preferences for only a handful of tried and trusted products.
It should be noted that the following product descriptions are indicative only. Inmany instances the underlying parameters are essentially pre-agreed between theuser and the creator and thus are flexible in the extreme. For example in many ofthe more complex forward products, where we have listed lease rates as floating,they could just as commonly be fixed and vice versa. Additionally, where we havelisted vanilla options in the more complex strategies, they could be either Euro-pean or American which complicates both the description and the market impactof the product.
The products have been described in order of increasing complexity and manydescriptions build on those preceding products.
Those products that are not described in this chapter are defined in the Glossary.

Gold Derivatives: The Market View106
The products
5.1. The forwards
5.1.1 The fixed forward
Definition: The most basic forward contract that allows the seller to deliver anagreed volume of gold for an agreed price at a future agreed date.
Underlying financial parameters:
Price: Fixed based on spot at execution.US$ (local) interest rate: Fixed – compounded annually.Gold lease rate: Fixed – compounded annually.Contango: Calculated from the above two parameters and fixed.Maturity: Fixed.
Application and usage: Best selected when interest rates 1 are high and not likelyto rise further or could even fall during the life of the contract. Best selectedwhen gold lease rates are low and are unlikely to fall further but could actuallyrise during the life of the contract. The two situations will yield the optimallevel of contango. From the miner’s point of view best selected when delivery ofmetal is guaranteed.
Advantages to the user: Offers guaranteed contango and price protection in theevent of declining gold prices. All financial parameters associated with the con-tract are known. Does not require active management after it is executed unlessthe miner elects to restructure. Can be unwound before delivery.
Disadvantages to the user: Inflexible delivery dates. The user cannot put intopractice any specific views on either the lease rate or interest rates. Can lock inunfavourable contango if the lease rates and/or interest rates move against thehedger. For fixed forwards beyond 12 months, the executing bank quotes for aperiod beyond which gold borrowing can readily be hedged; a factor which isultimately reflected in the price. Can incur an opportunity cost should themarket price consolidate at levels higher than the contract price (includingcontango).
Impact on the gold price:
Immediate impact: 100% - the executing bank borrows the equivalent amountof gold and sells it immediately into the market.
1 Interest rates refer throughout this chapter to dollar or local currency interest rates as opposed to goldlease rates.

Gold Derivatives: The Market View 107
Subsequent impact: On delivery, the executing bank unwinds the short positionand delivers gold back to the original lender.
Cost to the user: Bank commission and any cost of restructuring. Potential op-portunity costs as described above.
5.1.2 The floating gold rate forward
Definition: Standard forward contract in which the gold price and interest ratesare pre-agreed and locked-in. The gold lease rate is allowed to float and iscalculated at maturity based on its performance during the life of the contract.It is most common for the three-month lease rate to be used.
Underlying financial parameters:
Price: Fixed based on spot at execution.US$ (local) interest rate: Fixed – compounded annually.Gold lease rate: Floating – calculated on maturity. Renewal date is flexible butusually done quarterly or bi-annually.Contango: Calculated from the above two parameters at maturity.Maturity: Fixed.
Application and usage: Best selected when interest rates are high and not likelyto rise further or could even fall during the life of the contract. Best selectedwhen gold lease rates are high and could fall during the life of the contract. Thetwo situations will yield the optimal level of contango. From the miner’s pointof view best selected when delivery of metal is guaranteed.
Advantages to the user: Offers guaranteed contango and price protection in theevent of declining gold prices. More flexible than the fixed forward with re-spect to the user’s views on future lease rates. Does not require active manage-ment after it is executed unless the miner elects to restructure. Can be un-wound before delivery. Three-month lease rates appear more cost effective thanother rates. Allows greater flexibility than the fixed forward in that interestrates can be locked-in but lease rates float. Beyond 12 months, the problemassociated with the fixed forward is overcome as the gold lease rates are quotedfor periods shorter than the contract life.
Disadvantages to the user: Inflexible delivery dates. The user cannot put intopractice any specific views on future interest rates. Can lock-in unfavourablecontango if the interest rates move against the hedger. If the lease rates riseduring the life of the contract, the cash adjustment is payable by the hedger.Settlement is payable on maturity. Final contango is confirmed only on maturity.

Gold Derivatives: The Market View108
Can incur an opportunity cost should the market price consolidate at levelshigher than the contract price (including contango).
Impact on the gold price:
Immediate impact: 100% - the executing bank borrows the equivalent amountof gold and sells it immediately into the market.Subsequent impact: On delivery, the executing bank unwinds the short positionand delivers gold back to the original lender.
Cost to the user: Bank commission and any cost of restructuring. Potential op-portunity costs as described above.
5.1.3 The floating forward
Definition: Forward contract in which the gold price is pre-agreed but the in-terest rates and gold lease rates are allowed to float and are calculated at matu-rity based on their performance during the life of the contract.
Underlying financial parameters:
Price: Fixed based on spot at execution.US$ (local) interest rate: Floating – calculated on maturity. Renewal date isflexible but usually done quarterly or bi-annually.Gold lease rate: Floating – calculated on maturity. Renewal date is flexible butusually done quarterly or bi-annually.Contango: Calculated from the above two parameters at maturity.Maturity: Fixed.
Application and usage: Best selected when interest rates are likely to rise furtherand gold lease rates are likely to fall during the life of the contract. The twosituations will yield the optimal level of contango. From the miner’s point ofview best selected when delivery of metal is guaranteed.
Advantages to the user: Offers guaranteed contango and price protection in theevent of declining gold prices. Allows user to put into practice specific viewswith respect to future lease rates and interest rates. Does not require activemanagement after it is executed unless the miner elects to restructure. Can beunwound before delivery. Allows greater flexibility than preceding forwards inthat interest rates and lease rates float. Beyond 12 months, the problem associ-ated with the fixed forward is overcome as the gold lease rates are quoted forperiods shorter than the contract life.
Disadvantages to the user: Inflexible delivery dates. Can lock-in unfavourable

Gold Derivatives: The Market View 109
contango if the interests rates and/or lease rates move against the hedger. Slightlymore after-execution attention is required with respect to interest rate and leaserate renewals. Settlement is payable on maturity. Final contango is confirmedon maturity. Can incur an opportunity cost should the market price consoli-date at levels higher than the contract price (including contango).
Impact on the gold price:
Immediate mpact: 100% - the executing bank borrows the equivalent amountof gold and sells it immediately into the market.Subsequent impact: On delivery, the executing bank unwinds the short positionand delivers gold back to the original lender.
Cost to the user: Bank commission and any cost of restructuring. Potential op-portunity costs as described above.
5.1.4 The spot deferred
Definition: Forward contract in which the gold price is pre-agreed; interestrates and gold lease rates are allowed to float. The maturity date is deferrable.
Underlying financial parameters:
Price: Fixed based on spot at execution.US$ (local) interest rate: Floating – calculated on maturity. Renewal date isflexible but usually done quarterly or bi-annually.Gold lease rate: Floating – calculated on maturity. Renewal date is flexible butusually done quarterly or bi-annually.Contango: Calculated from the above two parameters at maturity. Varies witheach roll over or deferral.Maturity: Flexible with indefinite deferral subject to a pre-agreed notice period,commonly 45 days. Notice is usually one full interest period.
Application and usage: Best selected when interest rates are likely to rise furtherand gold lease rates are likely to fall during the life of the contract. Best selectedwhen delivery of metal is not guaranteed.
Advantages to the user: Offers guaranteed contango and price protection in theevent of declining gold prices. Can be unwound before delivery. Allows theuser to put into practice specific views with respect to future lease rates andinterest rates. No fixed delivery date and metal can be delivered on or beforematurity or deferred indefinitely. Flexible delivery reduces loss of upside par-ticipation into a price rally. If spot prices exceed the contract price (includingcontango), delivery is deferred.

Gold Derivatives: The Market View110
Disadvantages to the user: Executing bank can eventually request delivery andserve notice. The bank might serve notice if the mine is in default on othercontracts, exceeds credit limits or operates at a substantial loss. Slightly moreafter-execution attention is required with respect to interest rate and lease raterenewals. Settlement is payable on maturity.
Impact on the gold price:
Immediate impact: 100% - the executing bank borrows the equivalent amountof gold and sells it immediately into the market.Subsequent impact: On delivery, the executing bank unwinds the short positionand delivers gold back to the original lender.
Cost to the user: Bank commission plus the cost of any restructuring. The moreregular the renewal period, the greater the cost of deferral and the shorter thedelivery notice.
5.1.5 The participating forward
Definition: Forward contract with a purchased call option 2 attached.
Underlying financial parameters:
Price: Fixed based on spot at execution.US$ (local) interest rate: Fixed – compounded annually.Gold lease rate: Fixed – compounded annually.Contango: Calculated from the above two parameters and fixed.Maturity: Fixed.Option strike price: Pre-agreed – depending on potential forward contango andintended volume of options.Option maturity: Pre-agreed usually matched to forward maturity.
Application and usage: Best used when the potential loss of upside participationis a major concern. Used mostly during periods of high price volatility. Bestselected when interest rates are high and when gold lease rates are low. The twosituations will yield the optimal level of contango. From the miner’s point ofview best selected when delivery of metal is guaranteed.
Advantages to the user: Offers guaranteed price protection in the event of declin-ing gold prices. All financial parameters associated with the contract are known.Does not require active management after it is executed unless the miner electsto restructure. Can be unwound before delivery. Loss of upside participation is
2 Options are defined later in this chapter.
Gold Derivatives: The Market View 111
reduced by the call option which is exercised if the spot price on maturityexceeds option strike price. Most contracts offer the ability to re-write the con-tract thus locking-in higher prices as the spot rallies which is an advantage overmin-max (collars) strategies.
Disadvantages to the user: Inflexible delivery dates. No contango is earned sincethe contango pays for the call options. Slightly more after-execution attentionrequired if the option is to be exercised. The option is exercisable only if it is in-the-money. If the spot price exceeds the contract price but the options are out-of-the-money the option expires worthless and the contango is lost. On usingthe rewriting facility, the upside participation is reduced. There is an opportu-nity cost if the gold lease rates fall and/or the interest rates rise during the lifeof the contract since the option buying power is reduced.
Impact on the gold price:
Immediate impact:: 100% of the forward leg of the contract - the executingbank borrows the equivalent amount of gold and sells it immediately into themarket. The call option writer is initially a buyer of gold depending on thedelta.Subsequent impact: On delivery, the executing bank unwinds the short positionand delivers gold back to the original lender. The call option writer becomes asubsequent buyer of gold if the gold price rises and a seller if the gold price fallsdepending on the delta. The delta hedging against the options cannot be greaterthan 100% of the underlying volume of gold associated with the options (notnecessarily equal to the volume associated with the forwards).
Cost to the user: Bank commission and cost of any restructuring. Price of theoptions (forgone contango). Cost of the rewrite facilities.
5.1.6 The advance premium forward
Definition: A forward contract in which the contango is partly payable in ad-vance. Also known as the flat rate forward or the stablised contango.
Underlying financial parameters:
Price: Fixed based on spot at execution.US$ (local) interest rate: Fixed – compounded annually.Gold lease rate: Variable.Contango: Calculated from the above two parameters.Maturity: Fixed.
Application and usage: Best selected when interest rates are high and not likelyto rise further or could even fall during the life of the contract. Best selected
Gold Derivatives: The Market View112
when gold lease rates are high and could fall during the life of the contract. Thetwo situations will yield the optimal level of contango. From the miner’s pointof view best selected when delivery of metal is of no concern. Best used in theearly years of a project when the greater contango can coincide with cash flowrequirements. Most effective for long-term hedging.
Advantages to the user: Offers guaranteed contango and price protection in theevent of declining gold prices. Contango paid upfront has cash flow advan-tages. Conversion of a standard forward into an advance premium forward al-lows for early realisation of hedging profits. Does not require active manage-ment after it is executed unless the miner elects to restructure. Can be un-wound before delivery.
Disadvantages to the user: Inflexible delivery dates. Can lock-in unfavourablecontango if the interests rates move against the hedger. Settlement is payableon maturity. Slightly more after-execution attention required because of con-tango payments. The early payment of the contango is at the expense of yieldin the later years of the contract. Can incur an opportunity cost should themarket price consolidate at levels higher than the contract price (includingcontango).
Impact on the gold price:
Immediate impact: 100% - the executing bank borrows the equivalent amountof gold and sells it immediately into the market.Subsequent impact: On delivery, the executing bank unwinds the short positionand delivers gold back to the original lender.
Cost to the user: Bank commission plus the cost of any restructuring. Opportu-nity costs as described above.
5.1.7 The short-term averaging forward
Definition: A forward contract locking in an average, not the spot price.
Underlying financial parameters:
Price: Average of the am/pm London gold fixes over a pre-selected period.US$ (local) interest rate: Fixed – compounded annually.Gold lease rate: Variable.Contango: Calculated from the above two parameters.Maturity: Fixed.

Gold Derivatives: The Market View 113
Application and usage: Best selected when maximising revenue from short-termproduction. Best selected when interest rates are high and not likely to risefurther or could even fall during the life of the contract. Best selected whengold lease rates are high and could fall during the life of the contract. The twosituations will yield the optimal level of contango.
Advantages to the user: Offers guaranteed contango and price protection in theevent of declining gold prices. Does not require active management after it isexecuted unless the miner elects to restructure. Can be unwound before deliv-ery. Reduces the probability of the contract price being the low for the period.With the contango, the achieved price is guaranteed to exceed the average ofthe London fixes for the duration of the contract. Averaging slightly reducesthe opportunity costs incurred with other forward products if the market pricesstabilises above the contract price (including contango).
Disadvantages to the user: Inflexible delivery dates. Can lock-in unfavourablecontango if the interest rates move against the hedger. Possible opportunitycost incurred in averaging rather than attempting to lock-in the highs.
Impact on the gold price:
Immediate impact: 100% - the executing bank borrows the equivalent amountof gold and sells it immediately into the market.Subsequent impact: On delivery, the executing bank unwinds the short positionand delivers gold back to the original lender.
Cost to the user: Bank commission plus the cost of any restructuring. Opportu-nity costs as described above.
5.2. The options
5.2.1 The put option
Definition: A contract that gives the buyer the right but not the obligation tosell gold at a pre-agreed price at an agreed date. There is an obligation on thepart of the option writer to take delivery of gold at the agreed price on theagreed date should the option be exercised.
Underlying financial parameters:
Strike price: Pre-agreed at the time of execution.US$ (local) interest rate: Pre-agreed at the time of execution.

Gold Derivatives: The Market View114
Gold lease rate: Pre-agreed at the time of execution.Maturity: Pre-agreed at the time of execution.Implied price volatility: Quoted by the option writer.
Application and usage: Widely bought by the mining industry since the putoffers price protection on the downside at finite cost without limiting upsideparticipation in any rally in the gold price.
Advantages to the user: Costs of the hedge are limited to the premium paid forthe option. Since the product offers price protection on the downside withoutlimiting potential participation in a price rally, it is a mechanism that is clearlymore acceptable than forwards to many shareholders and boards.
Disadvantages to the user: Price of options can be high depending on how closeto the money they are at the time of writing. Price protection has to be paid forwithout the earning of any contango as in a forward.
Impact on the gold price:
Immediate impact: Put option buyers will tend not to delta hedge 3 any of theexposure. The writer (the commercial banks) will initially be a seller depend-ing on the delta. Primary delta hedging is normally around 40-45% of theunderlying volume.Subsequent impact: The bank will remain a seller into any price declines but willbecome a buyer into any price rises depending on the delta. The delta hedgingagainst the options cannot be greater than 100% of the underlying volume ofgold.
Cost to the user: Initial premium and any cost associated with restructuring.
5.2.2 The call option
Definition: A contract that gives the buyer the right but not the obligation tobuy gold at a pre-agreed price at an agreed date. There is an obligation on thepart of the option writer to deliver gold at the agreed price on the agreed dateshould the option be exercised.
Underlying financial parameters:
Strike price: Pre-agreed at the time of execution.US$ (local) interest rate: Pre-agreed at the time of execution.Gold lease rate: Pre-agreed at the time of execution.
3 See Glossary for a definition of delta hedging.
Gold Derivatives: The Market View 115
Maturity: Pre-agreed at the time of execution.Implied price volatility: Quoted by the commercial bank generating the calls.
Application and usage: Widely written by the mining industry in order to earna premium. Also written by a number of central banks. The premium eitherpays for put options bought or enhances average realised prices of the balanceof the hedging (in the case of the miners) or renders gold holdings incomebearing (in the case of the official sector). The calls are left naked to maximisethe premium earned.
Advantages to the user: Offers additional revenue particularly if the hedger is ofthe opinion that the spot price will not exceed the strike price of the calls. Thehedger (especially the central banks) may be willing to deliver against the callsshould they be exercised.
Disadvantages to the user: Since these options are sold by the hedger althoughcreated by the commercial banks, the potential loss should the price moveagainst the contract is unlimited. Loss of upside participation emerges once themarket price exceeds the option strike price.
Impact on the gold price:
Immediate impact: Calls written by the hedger are deliberately left naked andthus the hedger does not delta hedge this position in any way. The executingbank as the call option buyer, is initially a seller depending on the delta.Subsequent impact: The bank will be a seller into any price rises and will becomea buyer into any price falls depending on the delta. The delta hedging againstthe options cannot be greater than 100% of the underlying volume of gold.
Cost to the user: Initially nothing to the option granter since the calls writtengenerate income. Subsequently, any restructuring may incur a cost dependingon the nature of the transaction.
5.2.3 The cap and collar or the min-max
Definition: An option strategy in which the user buys put options and writescall options.
Underlying financial parameters:
Strike prices: Pre-agreed at the time of execution.US$ (local) interest rate: Pre-agreed at the time of execution.Gold lease rate: Pre-agreed at the time of execution.

Gold Derivatives: The Market View116
Maturity: Pre-agreed at the time of execution.Implied price volatility: Quoted by the issuing commercial bank.
Application and usage: Widely used by the mining companies to secure downsideprotection in the gold price (via put options) but to offset the cost of thatprotection via the granting of call options. The premium earned by the callspays either in part or totally for the puts options bought. The calls are leftnaked to maximise the premium earned.
Advantages to the user: Offers price protection at either no or greatly reducedcosts. The miner can stipulate the levels at which the call options are written.The ratio of put options bought to call options written is usually 1:3.
Disadvantages to the user: Since the call options are written by the miner, thepotential loss should the price move against the contract is unlimited. Loss ofupside participation when the market price exceeds the call option strike price.The further out-of-the-money the call options are written the lower the pre-mium paid and hence the greater volumes that have to written to secure thedesired cost saving. The closer into-the-money the calls are written, the greaterthe premium earned but the greater the possibility of them being exercised.
Impact on the gold price:
Immediate impact: The miner or user does not delta hedge either the put op-tions bought or the calls options written. With respect to the put optionswritten and the call options bought, the executing bank is an initial seller.Subsequent impact: The bank’s subsequent delta hedging will be as follows:With respect to the calls bought: a seller into a price rise and a buyer into price falls;With respect to the puts written: a buyer into a price rise and a seller into price falls.The delta hedging against the options cannot be greater than 100% of theunderlying volume of gold.
Cost to the user: Initially, either nothing or minimal since the calls are writtenwith the express intention of funding the puts. Costs incurred in any subse-quent restructuring depending on the transaction. Unlimited loss potentialvia call option writing.
5.2.4 The up and in barrier option (kick/knock-in)
Definition: An option strategy in which the options (either calls or puts) aretriggered and come into being if a pre-agreed price level is broken at any stageof the contract life. Up and in put options have little use to the mining industry.

Gold Derivatives: The Market View 117
Underlying financial parameters:
Trigger prices (knock-in) boundary: Pre-agreed at the time of execution.US$ (local) interest rate: Pre-agreed at the time of execution.Gold lease rate: Pre-agreed at the time of execution.Maturity: Pre-agreed at the time of execution.Implied price volatility: Quoted by the issuing commercial bank.
Application and usage:Most commonly up and in call options are written by the mining industrywith trigger prices at intervals above spot at the time of the transaction. Thecalls then only come into being once the spot price hits the trigger price. Thekick-ins are usually bought in conjunction with other option strategies, com-monly put options in which case the calls offer some upside participation in aprice rally but only until the trigger price.
Advantages to the user:Affords the mining industry upside participation in the gold price betweenany put option strike price (existing price protection) and the trigger price ofthe kick-ins.
Disadvantages to the user:Upside participation into a price rally is limited only through to the triggerbeyond which the calls come into being. The premium earned is less than thatearned by writing a vanilla call since the buyer forfeits some time value. Verycommonly the trigger is valid only for a certain usually limited period throughoutthe option life which in turn can limit the window of opportunity duringwhich the options can be brought into existence.
Impact on the gold price:
Immediate impact: The option buyer (in this case the commercial bank) willbe an initial delta hedge seller.Subsequent impact: The option buyer will then remain a delta hedge seller intoa rising gold price but a delta hedge buyer into price declines. The level of deltahedging increases very sharply as the spot price approaches the trigger priceespecially if the contract is close to maturity. Thus the delta hedging againstthese options can and often does greatly exceed 100% of the underlying vol-ume. Deltas of 150-200% are commonplace. Once the trigger price is breached,all the delta hedge selling that has been done is then suddenly reversed and theoption buyer will buy back all the delta hedge selling that has taken place.This can have a marked impact on short-term price movements if the optionsexist in sufficient volume at specific price levels.

Gold Derivatives: The Market View118
Cost: The proximity of the kick-in boundary to the spot price and the strikeprice at the time of writing greatly affects the price of the option. The furtheraway the boundary, the less the probability of kick-in therefore the more thecost will resemble a vanilla option. Kick-ins tend to be cheaper than ordinaryoptions since the buyer is potentially giving up time value.
5.2.5 The down and out barrier option (knock out)
Definition: An option strategy (can be either calls or puts) in which the optionscease to exist if a pre-agreed price level is broken at any stage of the contract life.A rebate is usually payable if the option is knocked-out, the amount depend-ing on the remaining life of the contract. Down and in options also exist buthave little application of the mining industry.
Underlying financial parameters:
Knock-out boundary: Pre-agreed at the time of execution.US$ (local) interest rate: Pre-agreed at the time of execution.Gold lease rate: Pre-agreed at the time of execution.Maturity: Pre-agreed at the time of execution.Implied price volatility: Quoted by the generating bank.
Application and usage:Calls are used by the mining industry to generate a premium to pay for putoptions. Put knock-out boundary is usually substantially higher than put strikeand spot prices. Most barrier options are priced more on contango rather thanspot price.
Advantages to the user:Call options that can cease to exist if the spot price falls. Put options whichcease to exist with the spot price rises substantially above the boundary ortrigger level.
Disadvantages to the user:Less premium is earned by the writer compared with writing vanilla calls. Verycommonly the trigger is valid only for a certain usually limited period throughoutthe option life which in turns limits the window of opportunity during whichthe options can be knocked-out.
Impact on the gold price:
Immediate impact:With respect to calls: if the mining industry has written the calls, the buyer

Gold Derivatives: The Market View 119
(the commercial bank) will be an initial seller depending on the delta.With respect to puts: if the mining industry has bought the puts, then thebuyer (the commercial bank) will be an initial seller depending on the delta.Subsequent impact:With respect to the calls as written above: the commercial bank will remain adelta hedge seller into a price rise but will turn a delta hedge buyer into a pricefall.With respect to the puts as written above: the commercial bank will become adelta hedge buyer into a price rally but will turn a delta hedge seller into aprice decline.The level of delta hedging increases very sharply as the spot price approachesthe trigger price especially if the contract is close to maturity. Thus the deltahedging against these options can and often does greatly exceed 100% of theunderlying volume. Deltas of 150-200% are commonplace. Once the triggerprice is breached, all the delta hedge selling (buying) that has been done isthen suddenly reversed and the option buyer will buy (sell) back all the deltahedge selling (buying) that has taken place. This can have a marked effect onshort-term price movements if the options exist in sufficient volume at specificprice levels.
Cost: The proximity of the knock-out boundary to the spot price and the strikeprice at the time of writing greatly affects the price of the option. The furtheraway the boundary, the less the probability of knock-out and therefore themore the cost will resemble a vanilla option. Knock-outs tend to be cheaperthan ordinary options since the buyer is potentially giving up time value.
5.2.6 The convertible ‘forward’
Definition: This in fact is not a forward at all but an option strategy that in-volves the mining industry in buying a vanilla put option and selling a kick-incall option. A feature of this strategy is that the options have the same strikeprice. A variant of this product is the purchase of the vanilla put with thewriting of a knock-out call at a trigger level that is substantially below theoption strike price.
Underlying financial parameters:
Strike price: Pre-agreed at the time of execution.US$ (local) interest rate: Pre-agreed at the time of execution.Gold lease rate: Pre-agreed at the time of execution.Maturity: Pre-agreed at the time of execution.Trigger price: Pre-agreed at the time of execution.Implied price volatility: Quoted by the generating bank.
Gold Derivatives: The Market View120
Application and usage:A complex structure that mimics a forward transaction but offers added (al-though perhaps limited) flexibility where loss of upside participation is consid-ered an issue.
Advantages to the user:Offers the miners the standard price protection via the put option. It generatesa premium via the calls options that in turn offer participation into a price rallyto the point at which the option kicks in. Put options can be converted into aforward.
Disadvantages to the user:Upside participation is limited to the trigger point. Window of opportunity isusually limited to a period of the entire option life.
Impact on the gold price:
Immediate impact:The mining company leaves both the puts bought and the calls writtenunhedged. The counterparty hedges the strategy as follows:The puts: an initial seller depending on the deltaThe calls: an initial seller depending on the deltaSubsequent impact:With respect to the puts:The counterparty buys into a price rise and continues to sell into a price fall.Given that the puts are vanilla the total delta hedging cannot exceed 100% ofthe underlying volume;With respect to the calls:The counterparty remains a seller into price rises but turns a buyer into adecline in the price. The level of delta hedging increases very sharply as thespot price approaches the trigger price especially if the contract is close tomaturity. Thus delta hedging of 150-200% of the volume of the underlying iscommonplace. Once the trigger price is breached, all the delta hedge sellingthat has been done is then suddenly reversed and the option buyer will buyback all the delta hedge selling that has taken place. This can have a markedaffect on short-term price movements if the options exist in sufficient volumeat specific price levels.
Cost to the user: Bank commission plus cost of any restructuring. Cost of the putoptions. Probably less cost effective than a forward sale.
5.3. The basic lease rate swap

Gold Derivatives: The Market View 121
Definition: A basic agreement in which gold is lent at a pre-agreed lease rate for apre-agreed period (usually 3 months). At the end of the period the average leaserate is compared to the contract rate and the differential is paid by the party indebit. The contract is then usually rolled for a further period.
Underlying financial parameters:
Volume: Pre-agreed at the time of execution.Gold lease rate: Pre-agreed at the time of execution.Maturity: Pre-agreed at the time of execution.
Application and usage:Used increasingly by the official sector for the purposes of lending gold.
Advantages to the user:Allows roll over of short term lending. Overcomes the tenure mismatch experi-enced by the bullion banks between their gold on deposit and the length out towhich the miners wish to hedge.
Disadvantages to the user: Possible cost incurred if the lease rate moves against theswap during the contract life.
Impact on the gold price:
No direct impact on the gold price per se. But has considerable implications forthe lending market since the swap allows the official sector to begin taking alonger-term view with respect to their lending policies.

Gold Derivatives: The Market View122

Gold Derivatives: The Market View 123
CHAPTER 6 : A DEBATING ISSUE
A hypothetical case for higher lease rates– the implications for the gold market –supportive or not of the long term goldprice?
The Washington Agreement, and the market’s initial response, raises for debatethe concept of higher than average lease rates and what this might imply for thelonger-term gold price. This chapter deliberately plays devil’s advocate since alltoo often during interviews conducted in the preparation of this study we cameacross the attitude: if only the central banks would stop lending. Lease rates wouldrise and then begin to reflect that of other money markets. This would discouragehedging and the gold price would stabilise at higher levels. In other words, lowlease rates are essentially at the root of all gold woes. Well are they?
In beginning to tackle the issue, four questions need investigation. These are asfollows:
• Under current and future market circumstances are higher lease rates achievable?
• If they are achievable, are they sustainable?
• If they are sustainable, would they indeed exert a positive influence on the goldprice?
• How would the various market sectors be affected by them?
Two factors have created the historical situation whereby a vicious circle has beengenerated in which many market participants have had a vested interest in main-taining a short position. Firstly, the predominant market participants are by na-ture long of physical gold and above ground stocks of metal exist in volumes notseen in other commodity markets (with the exception of silver). And secondly,the low historical cost of borrowing gold (relative to borrowing dollars for exam-ple) has had a lot to do with maintaining this vested interest of a constant shorttrading position held against long physical holdings.
Thus it appears logical to argue for higher lease rates that would gradually un-wind the shorts and discourage further position taking. With less in the way ofcarry trade by the hedge funds, short trading on the part of the commercial banks

Gold Derivatives: The Market View124
and more subdued producer hedging, the market would see less in the way ofdemand for lent gold. Intuitively, this implies that sentiment would begin toimprove and attitudes towards gold would gradually change, eventually reversingthe vicious circle and establishing a virtuous circle of a more confident and stableoutlook for the industry. But at what cost would this come to various marketparticipants and would higher lease rates simply generate new problems as itsolved existing ones?
These are very complex questions to which there is no clear-cut answer. The bestthis study can offer at this stage is a strong recommendation for continued andfurther research into developments relating to these issues and highlight the ques-tions for active debate. But perhaps a constructive starting point is a tentativelook at how each market sector might be affected and might respond to a tighterlending market.
Of primary importance is the official sector since it remains the single largestholder of metal. As already alluded to, higher lease rates could well generate areassessment of existing lending policies among the non-signatories of the Wash-ington Agreement within the official community. Potentially more attractive yieldsmay result in either newcomers to the lending market or existing lenders increas-ing any limits that may have applied under a lower lease rate regime. Those lend-ers who do not impose specific limits and remain sensitive to lease rate move-ments will obviously tend to increase their lending activity as lease rates remaincomparatively high. Thus in the absence of a global moratorium on lending, higherlease rates are merely likely to provide lending opportunities to those who mightotherwise remain non-lenders or lenders of minimal amounts. Chapter 1 detailsour analysis of the potential level of new lending that could come to marketshould lease rates encourage it.
For the purposes of debate, one can take the whole question of lending to anextreme. Assume for one moment a total global moratorium on lending throughwhich no further official sector gold could go out on loan. How would this affectofficial sector holdings? At the moment, the ability to lend out gold and hencerender interest-bearing what otherwise would have to remain a sterile asset, is butone of the options open to the central banks. In the total absence of this alterna-tive, what are the other avenues open to the official sector, especially given thereluctance of some members to continue holding a non-interest bearing asset?They are the following:
• At the one extreme: sell gold to reduce the level of sterile assets. Clearly somehave opted for this over the years but many others have not;
• At the other extreme: do nothing. Maintain the gold reserves and accept that theywill remain non-interest bearing. However, this does not address the problem;
Gold Derivatives: The Market View 125
• And somewhere in-between: sell volatility to earn a premium – in other words,write call options against gold reserves, a proportion of which will be deltahedged into the market or;
• Issue warrants against reserves which again implies option granting of sort, aproportion of which will be delta hedged into the market.
Each of these alternatives obviously has very different implications for the short-,medium- and longer-term gold price and this highlights the need to address thequestion of whether or not reduced lending, in solving some issues, will merelycreate new or added problems for the gold market.
The final question that needs to be raised with respect to the official sector is: towhat extent would lease rates influence the official sector’s collective thinking vis-à-vis holding gold? As alluded to elsewhere in this report, we believe that a numberof central banks maintain their holdings because they can lend them out and earna return, albeit a small one, under current market circumstances. We expressedthe concern that if lease rates collapsed even further, then the rationale for lendinggold would be negated and this might cause the official sector to reconsider theirreasons for maintaining those reserves. In this context, the converse should thenbe asked. If the lease rates were to be sustained at higher rates, would this encour-age the official sector to hold more loyally onto their existing holdings?
The primary industry will also be directly affected by a tighter lending marketand the developments post September 26th have already indicated that the min-ing community has embarked on a total re-look at hedging norms and practices.The fundamental question of whether to hedge or not is already being re-visitedat board level. The extent to which shareholders enter the debate would dependon individual companies and the make-up of their share registers. The outcome ofsuch debates might indeed herald the exit of some mining companies from thehedging world. The extent to which this might occur is extremely difficult, if notimpossible, to assess since the decision will come from board level where personalexperiences, views and opinions come very much into play.
If a large percentage of previously hedged producers withdraw from the derivativemarket in any volume, this of course, would reiteratively reduce the need forborrowed gold and alleviate some of the lease rate pressures in the lending mar-ket. The same will be true if mining companies elect to unwind their hedgepositions, even if it is only in the short term. However, given that the gold wouldprobably maintain its contango (although greatly reduced if lease rates strengthen)and given the success of hedging over the years and the substantial returns hedg-ing has afforded companies, we believe that the majority would probably elect tocontinue with risk management programmes in some form or another. Havingsaid this, we would expect producers who did to exhibit a more cautious

Gold Derivatives: The Market View126
approach to hedging and while price risk management would remain an integralpart of corporate philosophy, its role might well be reduced or simplified throughthe greater use of vanilla products. Thus, if the mining industry is hoping thathigher lease rates would encourage and support an improvement in the gold price,it will have collectively to accept a trade-off, that being the possible inability toexecute sophisticated, large and long-term price risk management programmes.There simply cannot be a “two-tier” market. We cannot have a situation in whichthe official sector is discouraged to lend but where the producers can still hedge atwill. Higher lease rates will imply a less attractive contango for the miners and anilliquid lending market will imply the inability to participate in the derivativemarket in anything like the volumes and tenures currently accepted as the norm.
With respect to the commercial banks, the Washington Agreement revealed instark relief the exposures held by some of these banks through the lease rates.Clearly some very painful lessons have been learnt and these have come at a pricefor bullion banking in general1.
Regardless of the absolute levels of lending, the worst case scenario is that bulliondesks could close and the associated bank withdraws from the gold market ingeneral. A contraction of the number of banks actively involved in the gold mar-ket would only serve to detract from the general competitiveness of bullion bank-ing and undermine the health of the industry in general. Moreover, the fewer thebanks directly involved, the less the lines of credit, the fewer the counterpartiesthrough which risk can be offset and the less the overall competitiveness of thebusiness.
As with the mining companies, again irrespective of future lease rate trends, thebullion banks are clearly going to embark on a strategic re-think of their activitiesand their approach to their bullion activities. Credit issues and the evaluation ofexisting and future risk will obviously be areas of major concentration. Marginclauses within legal agreements are another area which will no doubt attract muchattention and this may result in a reassessment of credit with some of the miningcompanies. These issues are discussed in more detail in chapter 3.
In assessing the impact of higher lease rates on the collective money-under-management industry, it is necessary to distinguish between the technical ormomentum traders and those hedge funds that take fundamental and strategicpositions in a commodity.
The momentum traders, as evidenced primarily in the Commitment of Tradersreports, would no doubt continue to trade on price technicalities as they have for
1 These are discussed in more detail in chapter 3.

Gold Derivatives: The Market View 127
decades. Their presence, or lack thereof, will be dictated not by lease rates but byprice volatility.
The approach adopted by the large hedge funds, which are more inclined to takelonger term strategic positions in a chosen commodity, would most likely besomewhat different but certainly no easier to anticipate. Historically we acknowl-edge the incentive to borrow relatively inexpensive gold to raise dollars. Higheraverage lease rates in the longer term would discourage this carry trade and theremight be less incentive for the large hedge funds to short the gold market. Recentdevelopments in this sector suggest a fundamental change in the structure of thehedge fund industry and this could alleviate to some extent the potential forincreased carry trade. This is discussed in detail in chapter 4.
Of considerable importance is the potential reaction to higher lease rates on thepart of private holders of gold. In this regard we are referring mainly to privateinvestors of physical metal in the Indian Subcontinent who to date have had littleincentive to mobilise their substantial cumulative holdings. Repeated efforts onthe part of the authorities in that area have so far failed to encourage active partici-pation in the national or international gold markets. Can the collective gold in-dustry assume that this state of affairs is likely to continue or could a higher leaserate regime precipitate a change in thinking and philosophy in that region of theworld? One recommendation of this study is for further research into this par-ticular questions.
The final industry participants, whose importance should not be under-estimated,are the fabricators many of whom are active borrowers of gold to fund pipelinemanufacturing. Higher lease rates would have a major impact on the economicsof the fabrication business whether it is the manufacture of jewellery or invest-ment products. Those most affected are likely to be the fabricators of high caratlow mark-up gold products serving the Middle and Far Eastern consumers asopposed to the fabricators of low carat goods who enjoy a very high retail pricemark-up. This could have a serious and detrimental impact on the fabricationbusiness in those very areas which are serving as the mainstay of physical offtakeand which need to be supported and encouraged if the market in general is tobenefit from a sustainable higher gold price.

Gold Derivatives: The Market View128

Gold Derivatives: The Market View 129
ACCELERATED SUPPLY: Gold reaching the market through lending and leas-ing before it is physically produced.
ACTUAL VOLATILITY: Actual measured price volatility from the historical datarecords. See volatility and contrast implied volatility.
ADVANCE PREMIUM FORWARD: Forward contract offering a constant con-tango throughout contract life; similar to flat rate forward and stabilised con-tango.
AMERICAN STYLE: (Option) that can be exercised at any stage during its life,in other words at or before expiration date. Contrast European style.
ASIAN OPTIONS: A history-dependent option where the outcome is not onlyreliant on whether or not the option is in-the-money at expiry, but also dependson the average price of the underlying throughout the option life. They are usedmostly in the base metal markets to reduce exposure or incentives to manipulatethe underlying price at expiry. Asian options are also used by market participantswho are obliged to have frequent exposure to the underlying asset over time. Theoptions are then useful in capping the overall cost of the physical exposure.
ASSET-OR-NOTHING CALLS (PUTS): History-independent exotic optionswhich have no income if the price of the underlying at expiry is below (above) thestrike price.
AT-THE-MONEY OPTION: An option with a strike price equal to that of thecurrent price of the underlying.
AVERAGE STRIKE OPTIONS: Asian options where the income depends onan average strike price rather than an average underlying asset price.
BACKWARDATION: A market situation where the spot price trades at a pre-mium to the forward price. Opposite of contango.
BARRIER OPTIONS: Unlike standard European options where the incomedepends only on the price of the underlying at expiration, barrier options arehistory-dependent. In other words, their outcome depends on the performanceof the price of the underlying during the life of the option and whether that pricebreaches some predetermined barrier or level. See ‘in’ barrier and ‘out’ barrieroptions.
GLOSSARY

Gold Derivatives: The Market View130
BINARY OPTIONS: Unlike standard options which have a constant income,binary options have variable (usually all or nothing) pay backs depending onwhether or not the price of the underlying meets some pre-agreed condition.Binary options can be either history-dependent or history-independent.
BIS: Bank for International Settlements
BONDS: Means of raising debt through the capital markets. See also Gold-BackedBonds.
BOSTON OPTIONS: See Break forward options.
BREAK FORWARD OPTION: Similar to the standard call option, except thatit has no initial cost.
CALL OPTION: Option giving the purchaser the right but not the obligationto buy gold at a predetermined (strike) price.
CASH-OR-NOTHING CALLS (PUTS): The simplest, history-independentbinary options which have no pay out if the price of the underlying is below(above) the strike price at expiry. They yield a constant sum if the price of theunderlying is above (below) the strike price.
CBOT: The Chicago Board of Trade
CCA: Comex Clearing Association
CFTC: Commodity Futures Trading Commission, the futures and options watch-dog.
CHOOSER OPTIONS: An option bought and paid for immediately but afteran agreed time, the buyer can elect whether the option is to be a put or call withan equal strike price and equal remaining time to expiry. The chosen put or call isa standard European option.
COLLARS: Options which have the same pay out as the standard call exceptthat the upside is not unlimited. It is subject to a maximum. The option buyerforegoes any further income above this maximum.
COMEX: The Commodity Exchange in New York. Merged with New YorkMercantile Exchange (NYMEX).
COMPLEX CHOOSERS: Similar to plain chooser options except that eitherthe put/call strike prices or the put/call time to expiry (or both) are not equal.

Gold Derivatives: The Market View 131
COMPOUND OPTIONS: These are options on options. The underlying assetis an option rather than a tangible commodity or security. Valuation of the optionis complicated by the fact that two expiry dates must be accounted for: the timeto expiration of the compound and the time to expiration of the underlying option.
CONTANGO: A market situation where the spot price is lower than the forwardquotation; the differential representing the carrying (financing) costs and prevail-ing interest rates. Opposite of backwardation.
CONTRACT: Basic unit of a derivative product.
COST CURVE: Graphical representation of the costs of producing a metal for anentire primary industry. Usually cumulative output expressed in percent plottedagainst unit operating costs.
COUPON: Annual interest rate associated with capital market bond issues.
DELTA: A measure of the instantaneous rate of change in the value of an optionfor a one-unit change in the price of the underlying commodity or asset.
DELTA HEDGING: The probability of an option being exercised against theholder, with changes in the spot price relative to the option strike price.
DERIVATIVE (INSTRUMENT): A financial instrument or paper product whichhas a value based on an underlying asset.
DOWN-AND-IN CALLS: A barrier option where the call is paid for up frontbut not received until the knock-in barrier is reached. See also up-and-in calls.
DOWN-AND-OUT CALLS: A barrier option where the standard calls are paidfor and exist until such time as the price of the underlying falls below a predeter-mined barrier after which the options cease to exist.
DOWN-AND-IN PUTS: A barrier option where the put is paid for up front butnot received until the knock-in barrier is reached. See also up-and-in puts.
DOWN-AND-OUT PUTS: A barrier option where the standard puts are paidfor and exist until such time as the price of the underlying falls below the prede-termined barrier, after which the options cease to exist.
EUROPEAN STYLE: An option that can only be exercised on the date of expiry.
EXCHANGE OPTIONS (1): An option offered by an exchange. It is a standardcontract subject to the rules and regulations of the governing exchange. The

Gold Derivatives: The Market View132
COMEX option offers the buyer a COMEX futures contract should the optionbe exercised.
EXCHANGE OPTIONS (2): An exotic option which allows the holder to ex-change one underlying asset for another.
EXERCISING AN OPTION: The option purchaser holds the writer (seller) ofan option to the agreed contract.
EXOTIC OPTIONS: Generic term for the more sophisticated option strategywhich has features over and above the basic contracts.
EXPIRY DATE: The date on which a derivative product expires or ceases toexist. Exchange products have set expiry dates. OTC expiry dates are agreed be-tween the principals.
EXPLOSIVE OPTIONS: See knock-out options
FORWARD STARTS: Options that are paid for upfront but are only received ata pre-agreed future date. The buyer, after the pre-determined date can at no extracost receive an option with the usual life length but at a strike price that will beat-the-money on expiry. Major application in company share option schemes.
GAMMA: A measure of the instantaneous rate of change in the delta of an optionbased on a one-unit change on the price of the underlying commodity or asset.
GAP OPTIONS: Options that place emphasis on the role played by the strikeprice of a standard option. The strike price not only determines if the option is in-or out-of-the-money at expiry but also the magnitude of the resultant payoff.The gap is the difference between the strike price and the resultant payoff.
GOFO: Reuters screen code for the daily gold lease rates.
GOLD-BACKED BONDS: Debt raised through the capital markets issued witha gold option alternative to enhance the value/attraction of the investment.
GOLD LOAN: A means of raising capital for project financing which involvesmonetising gold. Feature of the mid to late 1980s.
HEDGING RATIO: The proportion in which the option or the underlying assetor commodity needs to be traded to eliminate sensitivity to movements in theprice of the underlying.
HISTORY-DEPENDENT OPTIONS: Options whose outcome at expiry is

Gold Derivatives: The Market View 133
dependent on the price performance of the underlying throughout the life of theoption. Sometimes also called path dependent. See also history-independent op-tions.
HISTORY-INDEPENDENT OPTIONS: Options whose outcome is based en-tirely on the price of the underlying at expiration date. The price performance ofthe underlying during the life of the option is irrelevant. Standard European andAmerican options are history independent. Sometimes also called path inde-pendent. See also history-dependent options.
IFS: International Financial Statistics published by the International MonetaryFund.
IMPLIED VOLATILITY: The degree of price volatilty inferred or implied fromoption market values. This is the only subjective component of option pricing.Contrast actual volatility.
‘IN’ BARRIER OPTIONS: Options which are paid for at the time of the initialtransaction but are not received until a specified price level (the barrier or theknock-in boundary) is broken. If the barrier is broken at some stage during theoption’s life, then the buyer receives a standard European option with a strikeprice and time to expiration. If the barrier is not broken, then at expiry, theholder receives a cash rebate.
IN-THE-MONEY OPTION: An option which has a positive intrinsic value issaid to be in the money. In the case of a call, it is in-the- money when the strikeprice is lower than the current price. A put option is in the money when thestrike price is higher than the current price.
INTRINSIC VALUE: (of an option) The difference between the strike price andcurrent price of the underlying commodity.
KAPPA: A measure of the responsiveness in the option premium to changes inprice volatility of the underlying commodity or asset. Known also as the vega orlambda.
KNOCK-OUT OPTIONS: Exotic option whereby the contract is cancelled ifthe spot price breaks through an agreed price. See up-and-out puts and down-and-out calls. The knock-out option is priced differently since it can explode orbe cancelled while theoretically it still has time value.
LAMBDA: See kappa
LIMIT DOWN: Arbitrary price level below which trading on a Futures and

Gold Derivatives: The Market View134
Options Exchange ceases during that trading day. Imposed to prevent very sharpprice declines in futures prices and are adjusted from time to time at the discre-tion of the Exchange. See Limits.
LIMITS: Arbitrary price barriers imposed by Futures and Options Exchanges tolimit severe price movements during a trading day. There are no limits in the spotmarket. See Limit Up and Limit Down.
LIMIT UP: Arbitrary price level above which trading on a Futures and OptionExchange ceases during that trading day. Imposed to prevent very sharp priceincreases in futures prices and adjusted from time to time at the discretion of theExchange.
LIQUIDITY: The volume of business or turnover on an exchange or any marketforum; can be applied to either the paper market or the physical.
LOAN DRAW DOWN: Mechanism by which gold used for financing is monetisedusually with a sale of gold into the spot market or delivery against a forwardcontract.
LOCO: Physical location of metal. Unless otherwise stated, price quotations im-ply delivery loco London.
LONG: To be long of a commodity or associated futures or options contract is tohave been a buyer or to be a holder of physical metal. Contrast short.
LONG VOLATILITY: To have been a buyer of either a put or a call option.Contrast short volatility.
LOOKBACK OPTIONS: A history-dependent option where the income is re-liant not only on whether the option is in-the-money at expiry, but also on themaximum or minimum price achieved by the underlying during at least somepart of the option life.
MARKET MAKER: A counterparty or bullion banker offering both bid andoffer prices.
MARK TO MARKET: A regular (usually daily) re-evaluation of open positionsor derivative exposures based on the closing price (midprice) (between the bidand offer prices) of the underlying commodity.
MATURITY DATE: Date on which options mature; when it is either exercisedor it expires worthless. Also known as expiration date.

Gold Derivatives: The Market View 135
MARGIN: The cash deposit against a paper contract payable as a guarantee. Aninitial payment is usually made and thereafter further margin requirements mayhave to be met depending on the performance of the contract throughout its life.
MID PRICE: The price between the bid (quoted by the buyer) and offer (quotedby the seller) prices.
MULTIPLE OPTION FINANCING: Term used in bullion financing in whichthe gold loan agreement is flexible, in that the borrower can elect to make capitaland interest payments in either gold or currency.
NAKED OPTIONS: Options granted and left unhedged or exposed to potentialexercising.
NYMEX: New York Mercantile Exchange. Now merged with COMEX.
OPEN OUTCRY: Method of trading any commodity where dealers face eachother in a dealing ring or pit and there is direct communication. Contrast: ScreenTrading.
OUT-OF-THE-MONEY (Option): An option that has no intrinsic value is saidto be out-of-the-money. A call is out-of-the-money when the strike price is higherthan the current price. A put is when the strike price is lower than the currentprice.
OTC: Over-the-counter; term used to describe an option that is written andtraded through principals rather than an Exchange.
‘OUT’ BARRIER OPTIONS: Options which are paid for immediately and ex-ist until, during the option life, a predetermined barrier is broken, after whichthe options are rendered null and void - they cease to exist. If the barrier is notbreached, the holder receives standard European options. If the barrier is brokenand the options are extinguished, the holder is then paid a rebate.
PRINCIPAL-TO-PRINCIPAL: Bullion transactions executed directly betweenthe client and the bullion banks without being channelled through an exchange.Used primarily by market participants who have actual physical transactions tocomplete rather than the speculators. Speculative business tends to be channelledvia the exchanges.
PREMIUM: The cost which the buyer of an option pays to the writer or seller ofthe option; normally only a very small fraction of the value of the underlyingcommodity.

Gold Derivatives: The Market View136
PUT OPTION: Option giving the purchaser the right but not the obligation tosell gold at a particular strike price.
RANGE FORWARDS: Options similar to collars except that they have zero ini-tial cost.
RHO: A measure of the instantaneous rate of change in the value of an option fora one-unit change in the relevant interest rate.
SCREEN TRADING: Method of trading via computer screens and telephones inwhich there is no direct contact between dealers. Contrast: open outcry.
SETTLEMENT DATE: Usually the full business day after expiry date or afterthe closing of a contract.
SHORT: To be short of a commodity or associated futures or options contract isto have been a seller. Contrast long.
SHORT VOLATILITY: To have been a grantor or writer of either put or calloptions. Contrast long volatility.
SPOT DEFERRED: Hybrid forward contract offering floating interest rates andno fixed delivery. More flexible than a conventional forward, but without the costof an option.
SPOT MARKET: The immediate market where delivery obligations usually oc-cur no more than two days after the transaction.
STABILISED CONTANGO: Forward contract historically offered by the SouthAfrican Reserve Bank to the marginal SA mines. See flat-rate forward or advancepremium forward.
STRIKE PRICE: The agreed price at which the option can be exercised whichwill be equal to, higher or lower than the current price of the underlying.
SWAP: A spot sale with a simultaneous equal forward purchase of equal tonnage.This is the definition of a gold or bullion swap which may differ from the termused by the foreign exchange markets.
SYNTHETIC GOLD LOAN: A means of raising finance using the gold forwardmarket but does not result in the monetising of physical metal.
THETA: A measure of the instantaneous rate of change in the value of an optionfor a one-unit change in the time to expiry.

Gold Derivatives: The Market View 137
TIME VALUE: Option value associated with the time left to maturity since dur-ing its life an option can move in and out of the money.
UNDERLYING: Shortened term for the underlying commodity upon whichfutures and options are traded (See Derivative Instrument).
UP-AND-IN CALLS: A barrier option where the call is paid for at the time oftransaction but is not received until the predetermined knock-in barrier is reached.Differs from down-and-in calls in that the price of the underlying is initiallybelow the barrier.
UP-AND-IN PUTS: A barrier option where the put is paid for immediately butis not received until the predetermined knock-in barrier is reached. Differs fromdown-and-in puts in that the price of the underlying is initially below the barrier.
UP-AND-OUT CALLS: A barrier option where the standard calls are paid forimmediately exist until such time as the price of the underlying rises above apredetermined barrier after which the options cease to exist.
UP-AND-OUT PUTS: A barrier option where the standard options are paid forimmediately and exist until such time as the price of the underlying rises abovethe predetermined barrier, after which the options cease to exist.
VEGA: see kappa
VOLATILITY: The rate of change in the price of the underlying commodity. Seeactual volatility and implied volatility.
WARRANT: Option attached usually to a bond issue designed to give the holdera highly leveraged exposure to the underlying commodity.
WINDOW OPTIONS: Suite of history-dependent exotic options in whichpreagreed parameters are valid only for an agreed period of time within the optionlife.
WRITING OPTIONS: Selling someone else the right to buy or sell gold at aparticular price.
ZERO COST COLLAR: See collars.
10K REPORT: Set of audited annual accounts published and issued to share-holders. Differs from an annual report only in detail.

Gold Derivatives: The Market View138
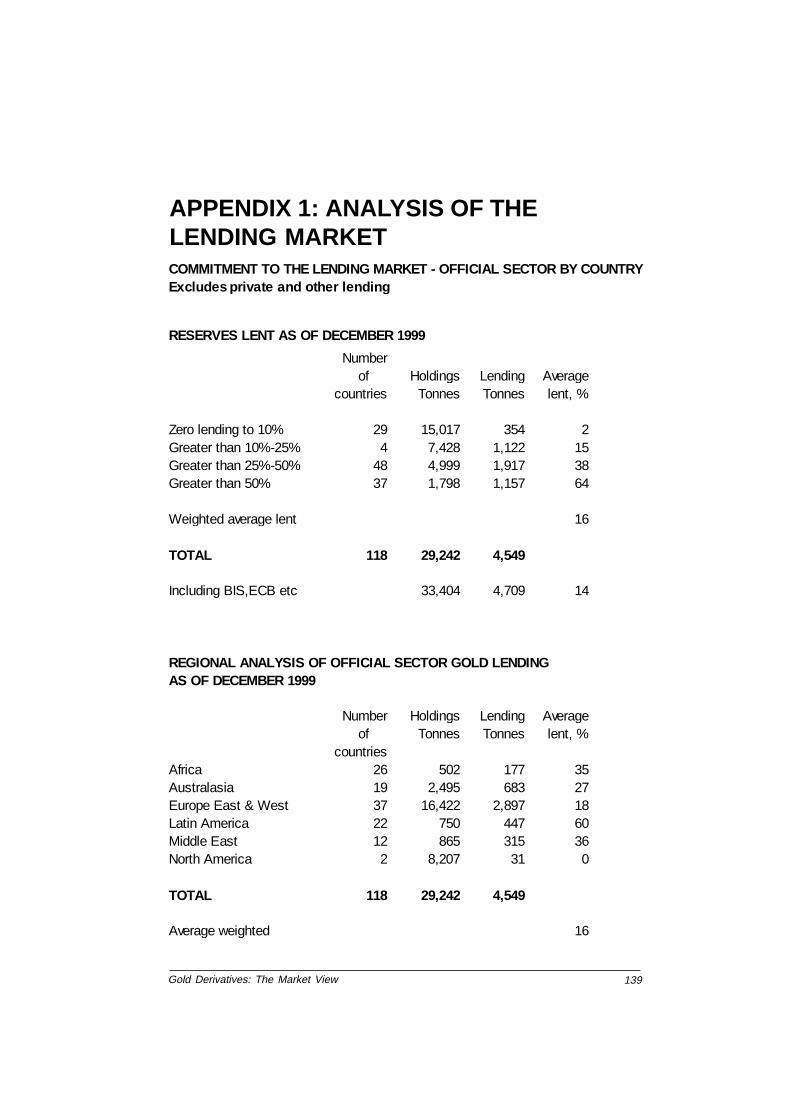
Gold Derivatives: The Market View 139
COMMITMENT TO THE LENDING MARKET - OFFICIAL SECTOR BY COUNTRYExcludes private and other lending
RESERVES LENT AS OF DECEMBER 1999
Numberof Holdings Lending Average
countries Tonnes Tonnes lent, %
Zero lending to 10% 29 15,017 354 2Greater than 10%-25% 4 7,428 1,122 15Greater than 25%-50% 48 4,999 1,917 38Greater than 50% 37 1,798 1,157 64
Weighted average lent 16
TOTAL 118 29,242 4,549
Including BIS,ECB etc 33,404 4,709 14
REGIONAL ANALYSIS OF OFFICIAL SECTOR GOLD LENDINGAS OF DECEMBER 1999
Number Holdings Lending Averageof Tonnes Tonnes lent, %
countriesAfrica 26 502 177 35Australasia 19 2,495 683 27Europe East & West 37 16,422 2,897 18Latin America 22 750 447 60Middle East 12 865 315 36North America 2 8,207 31 0
TOTAL 118 29,242 4,549
Average weighted 16
APPENDIX 1: ANALYSIS OF THELENDING MARKET

Gold D
erivatives: The M
arket View
140
APPENDIX 2
HEDGING AT RISK AT VARIOUS US DOLLAR, AUSTRALIAN DOLLAR AND S AFRICAN RAND PRICESAS OF END DECEMBER 1998 - FOR DELIVERY IN 1999
PRICE FIXED FORWARDS PRICE SPOT DEFERREDS PRICE CALLS WRITTEN PRICE TOTAL AT RISK
AT CUMULATIVE AT CUMULATIVE AT CUMULATIVE AT CUMULATIVE
RISK OUNCES % TOTAL % TOTAL RISK OUNCES % TOTAL % TOTAL RISK OUNCES % TOTAL % TOTAL RISK OUNCES % TOTAL % TOTAL
TOTAL 6,093,012 TOTAL 5,239,575 TOTAL 5,479,945 TOTAL 16,812,532
US$300 62,546 US$300 14,025 US$300 360,500 US$300 6,467,537
A$450 0 A$450 0 A$450 0 A$450 0
R1800 0 R1800 0 R1800 0 R1800 62,546
TOTAL 62,546 1.0 1.0 TOTAL 14,025 0.3 0.3 TOTAL 360,500 6.6 6.6 TOTAL 6,530,083 38.8 38.8
US$320 203,184 US$320 423,950 US$320 1,352,700 US$320 1,979,834
A$480 0 A$480 6,487 A$480 0 A$480 6,487
R1930 324,800 R1930 0 R1930 0 R1930 324,800
TOTAL 527,984 8.7 9.7 TOTAL 430,437 8.2 8.5 TOTAL 1,352,700 24.7 31.3 TOTAL 2,311,121 13.7 52.6
US$330 2,539,282 US$330 0 US$330 0 US$330 2,539,282
A$500 0 A$500 0 A$500 150,000 A$500 150,000
R1990 0 R1990 0 R1990 0 R1990 0
TOTAL 2,539,282 41.7 51.4 TOTAL 0 0.0 8.5 TOTAL 150,000 2.7 34.0 TOTAL 2,689,282 16.0 68.6
US$350 89,655 US$350 16,000 US$350 2,090,630 US$350 2,196,285
A$530 30,154 A$530 0 A$530 44,000 A$530 74,154
R2110 0 R2110 R2110 0 R2110 0
TOTAL 119,809 2.0 53.3 TOTAL 16,000 0.3 8.8 TOTAL 2,134,630 39.0 73.0 TOTAL 2,270,439 13.5 82.1
US$375 455,508 US$375 0 US$375 73,400 US$375 528,908
A$565 102,047 A$565 78,193 A$565 45,000 A$565 225,240
R2260 367,974 R2260 R2260 845,255 R2260 1,213,229
TOTAL 925,529 15.2 68.5 TOTAL 78,193 1.5 10.3 TOTAL 963,655 17.6 90.5 TOTAL 1,967,377 11.7 93.8
TOTAL 4,175,150 68.5 TOTAL 538,655 10.3 TOTAL 4,961,485 90.5 TOTAL 15,768,302 93.8
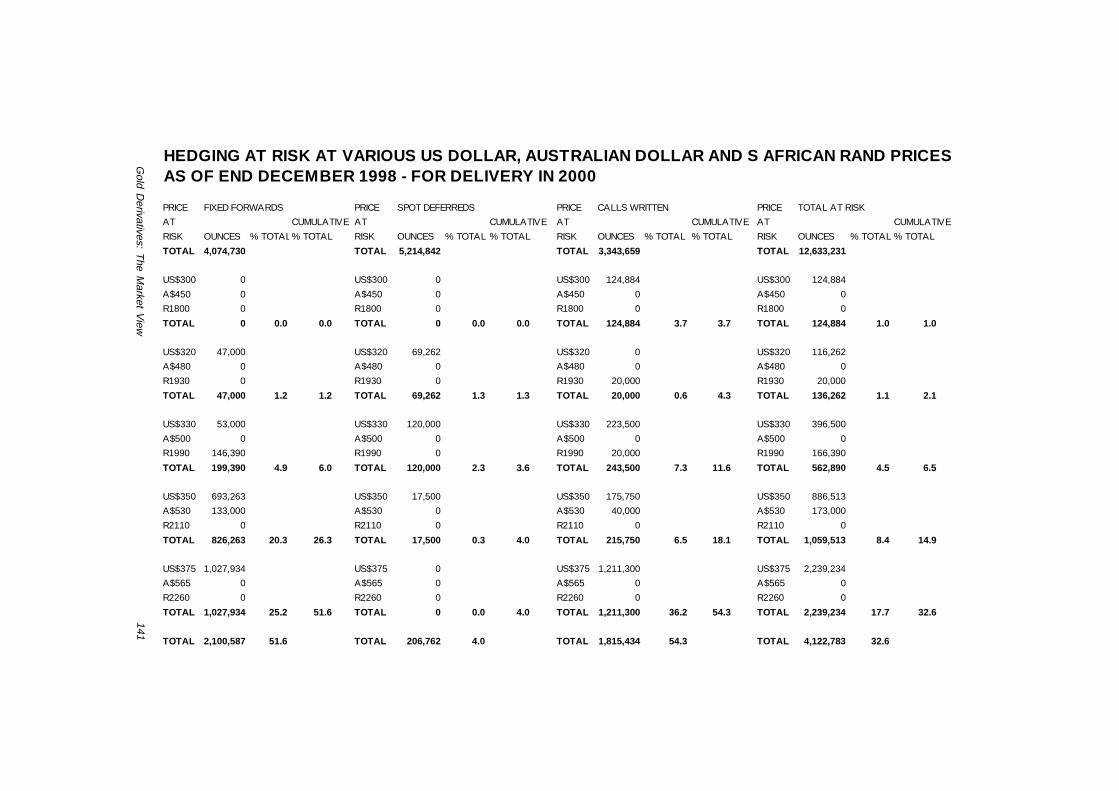
Gold D
erivatives: The M
arket View
141
HEDGING AT RISK AT VARIOUS US DOLLAR, AUSTRALIAN DOLLAR AND S AFRICAN RAND PRICESAS OF END DECEMBER 1998 - FOR DELIVERY IN 2000
PRICE FIXED FORWARDS PRICE SPOT DEFERREDS PRICE CALLS WRITTEN PRICE TOTAL AT RISK
AT CUMULATIVE AT CUMULATIVE AT CUMULATIVE AT CUMULATIVE
RISK OUNCES % TOTAL% TOTAL RISK OUNCES % TOTAL % TOTAL RISK OUNCES % TOTAL % TOTAL RISK OUNCES % TOTAL % TOTAL
TOTAL 4,074,730 TOTAL 5,214,842 TOTAL 3,343,659 TOTAL 12,633,231
US$300 0 US$300 0 US$300 124,884 US$300 124,884
A$450 0 A$450 0 A$450 0 A$450 0
R1800 0 R1800 0 R1800 0 R1800 0
TOTAL 0 0.0 0.0 TOTAL 0 0.0 0.0 TOTAL 124,884 3.7 3.7 TOTAL 124,884 1.0 1.0
US$320 47,000 US$320 69,262 US$320 0 US$320 116,262
A$480 0 A$480 0 A$480 0 A$480 0
R1930 0 R1930 0 R1930 20,000 R1930 20,000
TOTAL 47,000 1.2 1.2 TOTAL 69,262 1.3 1.3 TOTAL 20,000 0.6 4.3 TOTAL 136,262 1.1 2.1
US$330 53,000 US$330 120,000 US$330 223,500 US$330 396,500
A$500 0 A$500 0 A$500 0 A$500 0
R1990 146,390 R1990 0 R1990 20,000 R1990 166,390
TOTAL 199,390 4.9 6.0 TOTAL 120,000 2.3 3.6 TOTAL 243,500 7.3 11.6 TOTAL 562,890 4.5 6.5
US$350 693,263 US$350 17,500 US$350 175,750 US$350 886,513
A$530 133,000 A$530 0 A$530 40,000 A$530 173,000
R2110 0 R2110 0 R2110 0 R2110 0
TOTAL 826,263 20.3 26.3 TOTAL 17,500 0.3 4.0 TOTAL 215,750 6.5 18.1 TOTAL 1,059,513 8.4 14.9
US$375 1,027,934 US$375 0 US$375 1,211,300 US$375 2,239,234
A$565 0 A$565 0 A$565 0 A$565 0
R2260 0 R2260 0 R2260 0 R2260 0
TOTAL 1,027,934 25.2 51.6 TOTAL 0 0.0 4.0 TOTAL 1,211,300 36.2 54.3 TOTAL 2,239,234 17.7 32.6
TOTAL 2,100,587 51.6 TOTAL 206,762 4.0 TOTAL 1,815,434 54.3 TOTAL 4,122,783 32.6

Gold D
erivatives: The M
arket View
142 HEDGING AT RISK AT VARIOUS US DOLLAR, AUSTRALIAN DOLLAR AND S AFRICAN RAND PRICESAS OF END JUNE 1999 - FOR DELIVERY IN 1999
PRICE FIXED FORWARDS PRICE SPOT DEFERREDS PRICE CALLS WRITTEN PRICE TOTAL AT RISK
AT CUMULATIVE AT CUMULATIVE AT CUMULATIVE AT CUMULATIVE
RISK OUNCES % TOTAL % TOTAL RISK OUNCES % TOTAL% TOTAL RISK OUNCES % TOTAL % TOTAL RISK OUNCES % TOTAL % TOTAL
TOTAL 16,934,718 TOTAL 2,777,751 TOTAL 6,962,102 TOTAL 26,674,571
US$300 8,813,892 US$300 792,700 US$300 1,934,733 US$300 11,541,325
A$450 369,469 A$450 0 A$450 200,000 A$450 569,469
R1800 0 R1800 0 R1800 0 R1800 0
TOTAL 9,183,361 54.2 54.2 TOTAL 792,700 28.5 28.5 TOTAL 2,134,733 30.7 30.7 TOTAL 12,110,794 45.4 45.4
US$320 143,254 US$320 30,500 US$320 1,276,620 US$320 1,450,374
A$480 213,000 A$480 4,125 A$480 0 A$480 217,125
R1930 695,168 R1930 0 R1930 0 R1930 695,168
TOTAL 1,051,422 6.2 60.4 TOTAL 34,625 1.2 29.8 TOTAL 1,276,620 18.3 49.0 TOTAL 2,362,667 8.9 54.3
US$330 23,456 US$330 0 US$330 0 US$330 23,456
A$500 549,640 A$500 0 A$500 0 A$500 549,640
R1990 171,101 R1990 0 R1990 0 R1990 171,101
TOTAL 744,197 4.4 64.8 TOTAL 0 0.0 29.8 TOTAL 0 0.0 49.0 TOTAL 744,197 2.8 57.0
US$350 0 US$350 14,966 US$350 0 US$350 14,966
A$530 4,838 A$530 0 A$530 503,000 A$530 507,838
R2110 0 R2110 0 R2110 0 R2110 0
TOTAL 4,838 0.0 64.9 TOTAL 14,966 0.5 30.3 TOTAL 503,000 7.2 56.2 TOTAL 522,804 2.0 59.0
US$375 1,049,825 US$375 0 US$375 158,000 US$375 1,207,825
A$565 2,443,250 A$565 0 A$565 567,000 A$565 3,010,250
R2260 0 R2260 0 R2260 R2260 0
TOTAL 3,493,075 20.6 85.5 TOTAL 0 0.0 30.3 TOTAL 725,000 10.4 66.6 TOTAL 4,218,075 15.8 74.8
TOTAL 14,476,893 85.5 TOTAL 842,291 30.3 TOTAL 4,639,353 66.6 TOTAL 19,958,537 74.8

Gold D
erivatives: The M
arket View
143
HEDGING AT RISK AT VARIOUS US DOLLAR, AUSTRALIAN DOLLAR AND S AFRICAN RAND PRICESAS OF END JUNE 1999 - FOR DELIVERY IN 2000
PRICE FIXED FORWARDS PRICE SPOT DEFERREDS PRICE CALLS WRITTEN PRICE TOTAL AT RISK
AT CUMULATIVE AT CUMULATIVE AT CUMULATIVE AT CUMULATIVE
RISK OUNCES % TOTAL % TOTAL RISK OUNCES % TOTAL % TOTAL RISK OUNCES % TOTAL% TOTAL RISK OUNCES % TOTAL % TOTAL
TOTAL 7,363,065 TOTAL 5,211,030 TOTAL 3,696,251 TOTAL 16,270,346
US$300 1,376,403 US$300 60,000 US$300 215,300 US$300 1,651,703
A$450 0 A$450 0 A$450 166,000 A$450 166,000
R1800 0 R1800 0 R1800 0 R1800 0
TOTAL 1,376,403 18.7 18.7 TOTAL 60,000 1.2 1.2 TOTAL 381,300 10.3 10.3 TOTAL 1,817,703 11.2 11.2
US$320 276,440 US$320 206,000 US$320 489,942 US$320 972,382
A$480 0 A$480 0 A$480 0 A$480 0
R1930 0 R1930 0 R1930 0 R1930 0
TOTAL 276,440 3.8 22.4 TOTAL 206,000 4.0 5.1 TOTAL 489,942 13.3 23.6 TOTAL 972,382 6.0 17.1
US$330 0 US$330 0 US$330 223,500 US$330 223,500
A$500 135,282 A$500 0 A$500 0 A$500 135,282
R1990 480,000 R1990 0 R1990 0 R1990 480,000
TOTAL 615,282 8.4 30.8 TOTAL 0 0.0 5.1 TOTAL 223,500 6.0 29.6 TOTAL 838,782 5.2 22.3
US$350 663,255 US$350 70,000 US$350 27,000 US$350 760,255
A$530 653,550 A$530 0 A$530 0 A$530 653,550
R2110 100,000 R2110 0 R2110 10,000 R2110 110,000
TOTAL 1,416,805 19.2 50.0 TOTAL 70,000 1.3 6.4 TOTAL 37,000 1.0 30.6 TOTAL 1,523,805 9.4 31.7
US$375 1,061,514 US$375 0 US$375 1,123,600 US$375 2,185,114
A$565 482,350 A$565 0 A$565 0 A$565 482,350
R2260 860,438 R2260 0 R2260 0 R2260 860,438
TOTAL 2,404,302 32.7 82.7 TOTAL 0 0.0 6.4 TOTAL 1,123,600 30.4 61.0 TOTAL 3,527,902 21.7 53.4
TOTAL 6,089,232 82.7 TOTAL 336,000 6.4 TOTAL 2,255,342 61.0 TOTAL 8,680,574 53.4

Gold D
erivatives: The M
arket View
144 HEDGING AT RISK AT VARIOUS US DOLLAR, AUSTRALIAN DOLLAR AND S AFRICAN RAND PRICESAS OF END DECEMBER 1999 - FOR DELIVERY IN 2000
PRICE FIXED FORWARDS PRICE SPOT DEFERREDS PRICE CALLS WRITTEN PRICE TOTAL AT RISK
AT CUMULATIVE AT CUMULATIVE AT CUMULATIVE AT CUMULATIVE
RISK OUNCES % TOTAL % TOTAL RISK OUNCES % TOTAL % TOTAL RISK OUNCES % TOTAL % TOTAL RISK OUNCES % TOTAL % TOTAL
TOTAL 12,506,458 TOTAL 4,843,900 TOTAL 5,307,904 TOTAL 22,658,262
US$300 718,190 US$300 265,000 US$300 478,520 US$300 1,461,710
A$450 508,807 A$450 18,000 A$450 117,797 A$450 644,604
R1800 21,000 R1800 0 R1800 0 R1800 21,000
TOTAL 1,247,997 10.0 10.0 TOTAL 283,000 5.8 5.8 TOTAL 596,317 11.2 11.2 TOTAL 2,127,314 9.4 9.4
US$320 3,788,423 US$320 0 US$320 1,493,994 US$320 5,282,416
A$480 1,278,628 A$480 10,900 A$480 0 A$480 1,289,528
R1930 0 R1930 0 R1930 0 R1930 0
TOTAL 5,067,050 40.5 50.5 TOTAL 10900 0.2 6.1 TOTAL 1,493,994 28.1 39.4 TOTAL 6,571,944 29.0 38.4
US$330 147,123 US$330 0 US$330 992,000 US$330 1,139,123
A$500 503,451 A$500 0 A$500 0 A$500 503,451
R1990 0 R1990 0 R1990 0 R1990 0
TOTAL 650,574 5.2 55.7 TOTAL 0.0 6.1 TOTAL 992,000 18.7 58.1 TOTAL 1,642,574 7.2 45.6
US$350 137,760 US$350 0 US$350 102,500 US$350 240,260
A$530 197,724 A$530 0 A$530 125,000 A$530 322,724
R2110 12,303 R2110 0 R2110 0 R2110 12,303
TOTAL 347,787 2.8 58.5 TOTAL 0.0 6.1 TOTAL 227,500 4.3 62.4 TOTAL 575,287 2.5 48.2
US$375 1,610,981 US$375 3,700,000 US$375 687,500 US$375 5,998,481
A$565 496,635 A$565 0 A$565 642,000 A$565 1,138,635
R2260 0 R2260 0 R2260 648,093 R2260 648,093
TOTAL 2,107,616 16.9 75.3 TOTAL 3,700,000 76.4 82.5 TOTAL 1,977,593 37.3 99.6 TOTAL 7,785,209 34.4 82.5
TOTAL 9,421,024 75.3 TOTAL 3,993,900 82.5 TOTAL 5,287,404 99.6 TOTAL 18,702,328 82.5

Gold D
erivatives: The M
arket View
145
HEDGING AT RISK AT VARIOUS US DOLLAR, AUSTRALIAN DOLLAR AND S AFRICAN RAND PRICESAS OF END DECEMBER 1999 - FOR DELIVERY IN 2001
PRICE FIXED FORWARDS PRICE SPOT DEFERREDS PRICE CALLS WRITTEN PRICE TOTAL AT RISK
AT CUMULATIVE AT CUMULATIVE AT CUMULATIVE AT CUMULATIVE
RISK OUNCES % TOTAL% TOTAL RISK OUNCES % TOTAL % TOTAL RISK OUNCES % TOTAL% TOTAL RISK OUNCES % TOTAL% TOTAL
TOTAL 8,146,758 TOTAL 4,362,000 TOTAL 2,785,062 TOTAL 15,293,820
US$300 829,702 US$320 250,000 US$300 211,520 US$300 1,291,222
A$450 156,000 A$480 A$450 135,000 A$450 291,000
R1800 440,000 R1930 R1800 0 R1800 440,000
TOTAL 1,425,702 17.5 17.5 TOTAL 250,000 5.7 5.7 TOTAL 346,520 12.4 12.4 TOTAL 2,022,222 13.2 13.2
US$320 666,584 US$320 0 US$320 0 US$320 666,584
A$480 69,000 A$480 0 A$480 0 A$480 69,000
R1930 22,404 R1930 0 R1930 0 R1930 22,404
TOTAL 757,988 9.3 26.8 TOTAL 0 0.0 5.7 TOTAL 0 0.0 12.4 TOTAL 757,988 5.0 18.2
US$330 1,809,487 US$330 0 US$330 222,404 US$330 2,031,891
A$500 297,125 A$500 0 A$500 83,000 A$500 380,125
R1990 0 R1990 0 R1990 0 R1990 0
TOTAL 2,106,612 25.9 52.7 TOTAL 0 0.0 5.7 TOTAL 305,404 11.0 23.4 TOTAL 2,412,016 15.8 33.9
US$350 239,787 US$350 0 US$350 110,060 US$350 349,847
A$530 760,507 A$530 0 A$530 440,000 A$530 1,200,507
R2110 0 R2110 0 R2110 68,000 R2110 68,000
TOTAL 1,000,294 12.3 64.9 TOTAL 0 0.0 5.7 TOTAL 618,060 22.2 45.6 TOTAL 1,618,354 10.6 44.5
US$375 1,054,000 US$375 3,700,000 US$375 948,568 US$375 5,702,568
A$565 480,550 A$565 0 A$565 0 A$565 480,550
R2260 0 R2260 0 R2260 0 R2260 0
TOTAL 1,534,550 18.8 83.8 TOTAL 3,700,000 84.8 90.6 TOTAL 948,568 34.1 79.7 TOTAL 6,183,118 40.4 85.0
TOTAL 6,825,146 83.8 TOTAL 3,950,000 90.6 TOTAL 2,218,552 79.7 TOTAL 12,993,698 85.0

Gold Derivatives: The Market View146
SUMMARY - NOMINAL TOTAL HEDGING BY PRODUCT
End End End End End EndHedging Dec-99 Jun-99 Dec-98 Dec-99 Jun-99 Dec-98
Tonnes Tonnes Tonnes Mn Oz Mn Oz Mn Oz
Forw ards 1,510 1,218 793 48.5 39.2 25.5Spot deferreds 524 756 652 16.8 24.3 21.0Floating forw ards 107 74 0 3.4 2.4 0.0Convertible forw ards 12 11 0 0.4 0.4 0.0Variable price forw ards 36 7 7 1.2 0.2 0.2Puts bought 870 899 794 28.0 28.9 25.5Puts w ritten* 15 12 4 0.5 0.4 0.1Calls w ritten 832 819 665 26.7 26.3 21.4Convertible puts bought 133 115 0 4.3 3.7 0.0Knockout puts bought 14 9 9 0.5 0.3 0.3Calls bought* 429 167 64 13.8 5.4 2.1Gold Loans* 0 8 6 0.0 0.2 0.2Kick in calls w ritten 0 0 127 0.0 0.0 4.1
Total 4,038 3,908 3,048 129.8 125.7 98.0Total offset* 444 187 74 14.3 6.0 2.4
* Products offset
Nominal hedging as 158 153 120% of 1999 output

Gold Derivatives: The Market View 147
REALISED PRICES OF THE HEDGE BOOK AS OF END DEC 1998
Mn Aust Mn US Mn Rand TotalOz Dollars Oz Dollars Oz
Gold price end June 98 468 292 1,631Gold price end Dec 98 484 292 1,567Gold price average 98 471 294 1,662Forwards 11.79 582 11.77 361 1.95 2,688 25.51Spot deferreds 0.08 541 20.87 385 0.00 20.96Floating forwards 0.00 0.00 0.00 0.00Convertible forwards 0.32 663 0.03 506 0.00 0.35Variable price forwards 0.24 1,161 0.00 0.00 0.24Puts bought 12.32 592 12.39 344 0.84 2,563 25.54Puts written 0.00 0.04 296 0.08 1,824 0.12Calls written 2.50 551 15.28 364 3.59 2,339 21.37Kick in calls written 4.09 545 0.00 0.00 4.09Convertible puts 0.00 0.00 0.00 0.00Knock out puts 0.00 0.30 456 0.00 0.30Calls bought 0.38 846 1.16 346 0.52 1,889 2.06
PERCENTAGE GAINS ON SPOT PRICE Aust US Rand
Dollars Dollars
Average for 1998All forwards 26.3 27.9 61.7All puts bought 25.9 17.6 54.2Puts written 0.6 9.7Calls written 17.0 23.7 40.7Calls bought 79.7 17.8 13.6
End December 1998All forwards 22.8 29.0 71.6All puts bought 22.4 18.6 63.6Puts written 1.5 16.4Calls written 13.8 24.8 49.3Calls bought 74.8 18.8 20.5
End June 1998All forwards 26.9 28.7 64.8All puts bought 26.5 18.3 57.1Puts written 1.3 11.8Calls written 17.6 24.5 43.4Calls bought 80.6 18.5 15.8

Gold Derivatives: The Market View148
REALISED PRICES OF THE HEDGE BOOK AS OF END JUNE 1999
Mn Aust Mn US Mn Rand TotalOz Dollars oz Dollars Oz
Gold price end June 99 398 261 1,539Gold price end Dec 99 443 284 1,687Gold price average 99 433 279 1,649Forwards 12.27 549 19.01 321 3.92 2,434 35.19Spot deferreds 0.02 543 24.27 381 0.00 0 24.29Floating forwards 0.00 0 2.38 447 0.00 0 2.38Convertible forwards 0.32 663 0.03 506 0.00 0 0.35Variable price forwards 0.21 1,104 0.00 0 0.00 0 0.21Puts bought 14.56 589 13.54 357 0.64 2,679 28.74Puts written 0.00 0 0.30 273 0.10 1,825 0.40Calls written 5.11 509 17.28 353 3.36 2,469 25.75Convertible puts 3.70 653 0.00 0 0.00 0 3.70Knock out puts 0.00 0 0.30 457 0.00 0 0.30Calls bought 0.09 482 3.61 360 0.51 2,022 4.20
PERCENTAGE GAINS ON SPOT PRICEAust US Rand
Dollars Dollars
Average for 1999All forwards 29.6 29.1 47.6All puts bought 39.1 28.8 62.5Puts written -1.9 10.7Calls written 17.6 26.8 49.8Calls bought 11.3 29.2 22.6
End December 1999All forwards 26.6 26.9 44.3All puts bought 35.9 26.6 58.8Puts written -3.6 8.2Calls written 14.9 24.7 46.4Calls bought 8.7 27.0 19.9
End June 1999All forwards 40.9 37.7 58.2All puts bought 51.3 37.4 74.1Puts written 4.6 18.6Calls written 27.9 35.3 60.4Calls bought 21.0 37.8 31.4

Gold Derivatives: The Market View 149
REALISED PRICES OF THE HEDGE BOOK AS OF END DEC 1999Mn Austr Mn US Mn Rand TotalOz Dollars Oz Dollars Oz
Gold price end June 99 398 261 1,589Gold price end Dec 99 443 283 1,743Gold price average 99 433 279 1,704Forwards 17.95 564 25.89 344 4.70 2,556 48.54Spot deferreds 0.03 448 16.80 364 0.00 16.83Floating forwards 0.00 3.45 432 0.00 3.45Convertible forwards 0.32 663 0.05 495 0.00 0.37Variable price forwards 0.18 1,187 0.98 334 0.00 1.16Puts bought 14.37 557 13.10 340 0.27 2,063 27.74Puts written 0.05 460 0.44 261 0.00 0.49Calls written 6.68 538 17.66 350 2.40 2,519 26.74Kick in calls written 0.00 0.00 0.00 0.00Convertible puts 4.28 627 0.00 0.00 4.28Knock out puts 0.44 400 0.00 0.00 0.44Calls bought 2.19 641 10.10 331 1.50 2,193 13.79
PERCENTAGE GAINS ON SPOT PRICE Austr US Rand
Dollars DollarsAverage for 1999All forwards 32 28 50All puts bought 31 22 21Puts written 6 -6Calls written 24 26 48Calls bought 48 19 29
End December 1999All forwards 29 26 47All puts bought 28 20 18Puts written 4 -8Calls written 21 23 45Calls bought 45 17 26
End June 1999All forwards 44 37 61All puts bought 43 30 30Puts written 16 0Calls written 35 34 59Calls bought 61 27 38

Gold Derivatives: The Market View150
APPENDIX 3
The bullion trading community
ABN AmroAIG InternationalBarclays BankChase ManhattanCitibankCommerzbankCredit Suisse First BostonDeutsche BankDresdner BankGoldman Sachs/J AronHSBC/RepublicJP MorganMacQuarie BankMitsubishiMitsuiMKSMorgan StanleyNM RothschildPhibro BullionPrudential-BacheRabobankScotiaMocattaSociété GénéraleStandard BankSumitomoUBSWest LB

Gold Derivatives: The Market View 151
APPENDIX 4
Analysis of the Money-under-management data
The analysis that follows is the result of a detailed examination of the ManagedAccount Reports (MAR), which are published on a six-monthly basis. MAR isone of the primary sources of money-under-management data, presenting de-tailed statistical information covering a full spectrum of trading entities. A numberof points about the data need to be made to place the analysis into its correctstatistical perspective:
• The period under review covers the four six-monthly reports between June1998 and December 1999;
• The MAR data is collated with the express intention of providing users with adirectory for the financial comparison of the various funds. Thus, it is usedprimarily by potential investors. For this reason, there is a strong incentive forthe funds to report when their performance is favourable and not to reportwhen they consider their returns to be below average. This skews the data infavour of overall stronger than expected financial performances relative to otherinvestment vehicles;
• The MAR data covers the hedge funds, commodity trading advisors (CTAs)and the funds of funds. This analysis excludes the funds of funds. Since theyinvest in indices of the CTAs and hedge funds, their exposure and indeed inter-est in the gold market is indirect and already covered in the analysis of theother funds;
• The data excludes pension funds, mutual funds, CTA pool operators and pub-lic funds. Some pension and mutual funds might allocate capital to CTAs andhedge funds and therefore the analysis covers this indirectly;
• One of the major problems associated with any fund analysis is the lack ofconsistent definitions and fund category types. The terms “funds”, “hedge funds”and “commodity funds”, for example, are used very loosely by the media and inthe literature, sometimes even interchangeably without any due regard to spe-cific definitions. In mitigation, this is often no fault of the media in that defi-nitions of the fund business on various levels are ambiguous and vague. Thisresearch adopts the definitions as laid out by MAR and Van Hedge (listed inAppendix 4) and while some might be open to debate, every attempt has beenmade to remain consistent in the use of terminology ;

Gold Derivatives: The Market View152
• Reporting to MAR is not consistent over time. The regularity with which afund manager elects to declare data appears to be down to a personal decisionon the part of that manager. Thus a fund may exist and be part of the databasealthough the manager might not have submitted financial data for three, fouror even five reporting periods. This does not imply that the fund is dormant orhas been dissolved. It therefore remains a part of the overall database but willnot appear in the latest statistical analysis except to be recorded as an entityshowing no data. Throughout 1999 this lack of reporting proved to be a leadindicator of the health of the industry;
• Of the data sample, without question the sector of greatest interest remains thehedge funds but more specifically the global macro funds (a subsector of thehedge funds), which are the trading entities most likely to have the charters toinvest in the commodities;
• The data covers 2,250 funds managing cumulatively $145 billion. In terms ofthe overall fund population, it is thought that this database is reasonably rep-resentative of the industry in general. With the swift ebb and flow of money-under-management and the equally rapid creation and liquidation of funds, itis difficult to obtain a reliable estimate of the total fund population. Mediaestimates have placed the total fund population at around 4,000 funds cover-ing $3 trillion. Discussions with MAR suggest that the funds not covered bythe database will not materially alter any of the conclusions drawn from theanalysis and, in terms of chasing the unlisted funds, the law of diminishingreturns certainly applies. Any further research will, however, make every effortto continue expanding the database to increase the coverage;
• It should be noted that the $145 billion under management is a minimumfigure since of the 2,250 funds existing on the database, 39% did not submitany figures for the second half of 1999. Nevertheless these funds are known tohave cumulatively substantial capital under management. This $145 billion isalso a minimum in that this is an unleveraged estimate of the total. Given thathedge funds can and do borrow against their capital bases to gain the maxi-mum leverage, the multiplier effect implies that this potential amount of moneywhich could be invested is much greater. To place the potential presence of thefunds into the context of the commodity markets, their $145 billion repre-sents seven times the value of total mine production of gold in 1999. It alsorepresents about 45% of the value of total official sector gold holdings.
A defining characteristic of the money-under-management industry is its ten-dency to be subject to very mixed fortunes over relatively short periods of timeand what can only be described as a roller coaster with respect to financial per-formance and general health. This cycle of feast or famine has manifested itself alltoo clearly, even in the very short period covered in this study. The mid 1990s

Gold Derivatives: The Market View 153
were characterised by very strong capital inflows, healthy financial returns and anoverall prosperous outlook. By the end of June 1998, the situation had alreadybegun to change. Within six months, the industry experienced a marked turnaround in its fortunes. As the emerging market and related currency crises deep-ened, the fortunes of the funds reversed and in some cases very sharply indeed.The most obvious example, of course, was the threatened collapse of Long TermCapital Management. Apart from LTCM, many reported to investors loss mak-ing results and as a consequence there was evidence of capital redemptions andoutflows. By the first half of 1999, there was evidence of a recovery in the indus-try that gained momentum throughout the remainder of the year.
Thus the financial performance during a specific reporting period can and doesvary greatly from previous or indeed future periods. For this reason, attempting todraw long-term trends from a single reporting period is not only meaningless butalso misleading. Consequently, emphasis in this analysis is placed on the averagereturns to investors over the entire life of the funds. Interestingly, as this analysiswill show, the poor performance of the funds during the second half of 1998 wasindeed of sufficient magnitude to begin eroding away the long-term track recordof the funds. Fortunately for the industry, the data covering 1999 revealed thatthe funds managed to recover and largely re-establish their long-term averages.
The overall structure and performance during 1998 and 1999
Of the 2,250 funds managing $145 billion as of the end of December 1999, thehedge funds maintained their dominance, representing 82% of the total capitalbase. The remainder were the Commodity Trading Advisors (CTAs), greater innumber but commanding a substantially smaller capital base.
Looking more closely at the hedge funds, the global macros (those funds whichare most likely to be involved in the gold market) represented a good proportionof the money under management (16%) although the sector is less important interms of the number of funds (5%).
In terms of its evolution, the accompanying chart shows the years in which thefunds were launched, indicating the swift development of the industry in the lastdecade. The fund business has indeed been a feature of the 1990s, but especiallyduring the later half of the decade.

Gold Derivatives: The Market View154
And the next chart simply shows the growth cumulatively. The data does indicatea marked slowing-down in the number of new funds launched over the past twoyears. This is probably a combination of two factors. Firstly, it is likely to be afunction of recent and rather uncertain market conditions especially in 1998,which did not favour the inflow of new capital and hence did not encourage thelaunch of new funds. But it might also be the initial sign of a longer-term trend inwhich we are seeing the maturation of the industry in general.
CUMULATIVE GROWTH IN THE MONEY UNDER MANAGEMENT INDUSTRY 1973-1999
0
500
1,000
1,500
2,000
2,500
1973 1978 1983 1988 1993 1998
FU
ND
SGROWTH IN THE FUND INDUSTRY - NUMBER OF
FUNDS LAUNCHED 1973-1999
0
50
100
150
200
250
300
350
400
1973 1978 1983 1988 1993 1998
FU
ND
S
Data source: Virtual Metals Research & Consulting analysis of MAR data to end-December 1999
Data source: Virtual Metals Research & Consulting analysis of MAR data to end-December 1999
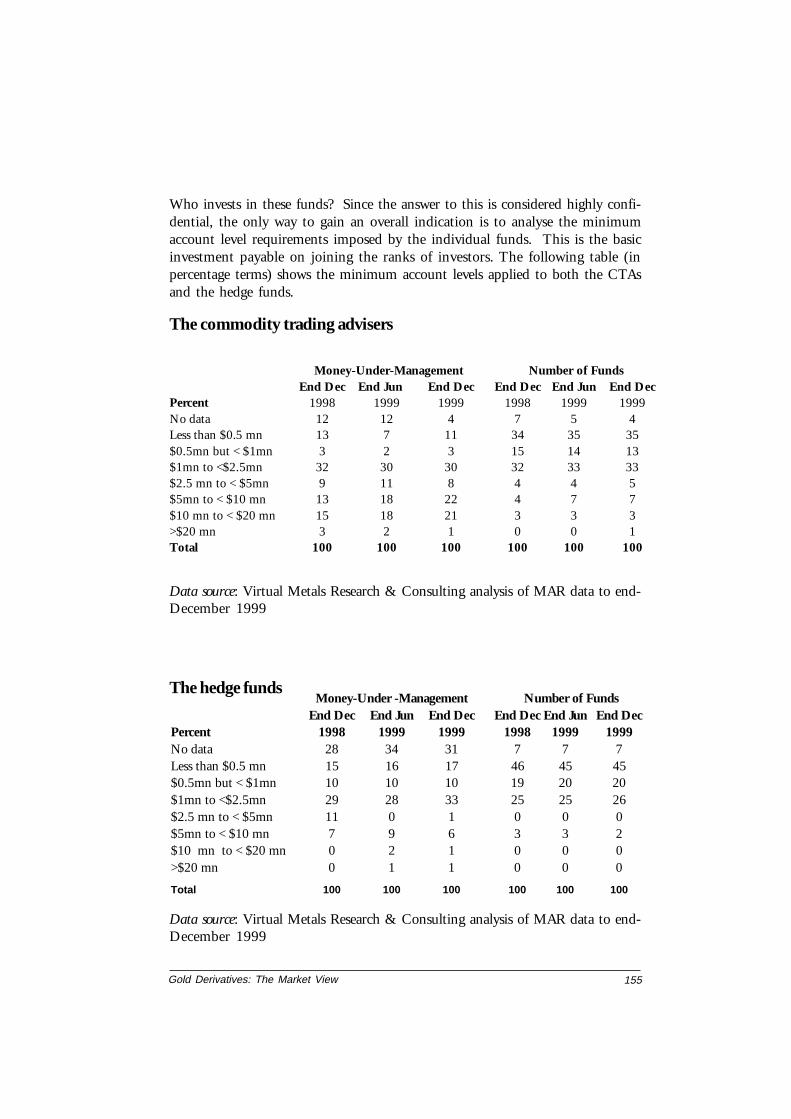
Gold Derivatives: The Market View 155
Money-Under-Management Number of FundsEnd Dec End Jun End Dec End Dec End Jun End Dec
Percent 1998 1999 1999 1998 1999 1999No data 12 12 4 7 5 4Less than $0.5 mn 13 7 11 34 35 35$0.5mn but < $1mn 3 2 3 15 14 13$1mn to <$2.5mn 32 30 30 32 33 33$2.5 mn to < $5mn 9 11 8 4 4 5$5mn to < $10 mn 13 18 22 4 7 7$10 mn to < $20 mn 15 18 21 3 3 3>$20 mn 3 2 1 0 0 1Total 100 100 100 100 100 100
Who invests in these funds? Since the answer to this is considered highly confi-dential, the only way to gain an overall indication is to analyse the minimumaccount level requirements imposed by the individual funds. This is the basicinvestment payable on joining the ranks of investors. The following table (inpercentage terms) shows the minimum account levels applied to both the CTAsand the hedge funds.
The commodity trading advisers
Data source: Virtual Metals Research & Consulting analysis of MAR data to end-December 1999
The hedge fundsMoney-Under -Management Number of Funds
End Dec End Jun End Dec End Dec End Jun End DecPercent 1998 1999 1999 1998 1999 1999No data 28 34 31 7 7 7Less than $0.5 mn 15 16 17 46 45 45$0.5mn but < $1mn 10 10 10 19 20 20$1mn to <$2.5mn 29 28 33 25 25 26$2.5 mn to < $5mn 11 0 1 0 0 0$5mn to < $10 mn 7 9 6 3 3 2$10 mn to < $20 mn 0 2 1 0 0 0>$20 mn 0 1 1 0 0 0
Total 100 100 100 100 100 100
Data source: Virtual Metals Research & Consulting analysis of MAR data to end-December 1999

Gold Derivatives: The Market View156
The size of capital and amount under management
There are not very many truly enormous funds. In fact, there are only 53 withcapital bases in excess of $500 million and 24 with bases in excess of $1 billion.This represents 2% and 1% of the sample respectively. Almost a fifth of the fundshave between $10 million and $50 million under management. Of the 40% forwhich there is no data, the sample is thought to be spread reasonably evenlythroughout the database.
The sectoral breakdown of capital bases is more revealing as this next table shows.It also shows that the hedge fund sector, and more specifically the global macros,tend to house the larger capital bases and the CTAs tend to maintain smaller
This information indicates that relatively more capital invested with the CTAs isassociated with minimum account levels in excess of $10 million than the hedgefunds; a result that actually flies in the face of conventional wisdom. The datadoes not support the general belief that it remains the prerogative of the largehedge funds to expect large minimum account levels. It also suggests that institu-tional money is destined for both the CTAs and the hedge funds, which againdisproves conventional wisdom, which argues that the CTAs serve specificallyprivate investors or the retail end of the industry.
With respect to the actual amount of money under management, the resultsagain belied the media image which seems to be perpetuated: that of many fundscommanding huge capital bases. This next table demonstrates the current posi-tion.
All Funds End Dec End Jun End DecPercent 1998 1999 1999No data 31 39 40Excess of $1 bn 1 1 1$500 mn - <$1 bn 1 1 1$150 mn - <$500 mn 6 6 6$50 mn - <$500 mn 12 11 12$10 mn To <$50 mn 24 24 20$5 mn To <$10 mn 8 6 70 - <$5 mn 16 12 12Total 100 100 100
Data source: Virtual Metals Research & Consulting analysis of MAR data to end-December 1999

Gold Derivatives: The Market View 157
Capital bases: number of funds
Putting all this together, this data analysis confirms a market structure in whichthere are a handful of very large powerful funds servicing professional investorswho historically have been the ones most likely to participate aggressively in acommodity market. The recent developments in the form of the liquidation andrestructuring of two of the largest global macro funds is thus of great importanceto the global gold industry.
Capital flows are a lead indicator of the health of the industry and redemptionsappear to be very sensitive to the financial performance. A major feature of thefund industry during the first half of 1998 was the fact that the industry virtuallyacross the board saw substantial reductions in its capital base and the majority offunds were subject to investor redemptions; in most cases on a very large scale.Occasionally, these redemptions were more than offset by the inflow of new capi-tal but in most cases, not. This net capital outflow continued throughout theremainder of 1998 as investors responded to the rather poor financial perform-ance of many of the funds in the wake of the Asian currency crisis. The exceptionwas 2% of the sample which enjoyed strong and renewed investment.
Hedge CTAs Total GlobalPercent Funds MacrosNo data 40 42 40 38Excess of $1 bn 1 1 1 5$500 mn - <$1 bn 1 1 1 1$150 mn - <$500 mn 6 6 6 5$50 mn - <$500 mn 14 9 12 7$10 mn to <$50 mn 21 16 20 25$5 mn to <$10 mn 7 6 7 70 - <$5 mn 9 19 12 13Total 100 100 100 100
Data source: Virtual Metals Research & Consulting analysis of MAR data to end-December 1999
capital bases although there are some exceptions to this. The fact that the globalmacros have commanded the very high capital bases has been of importance tothe precious metals markets in that these were the bases from where the fundswould have access to leverage.
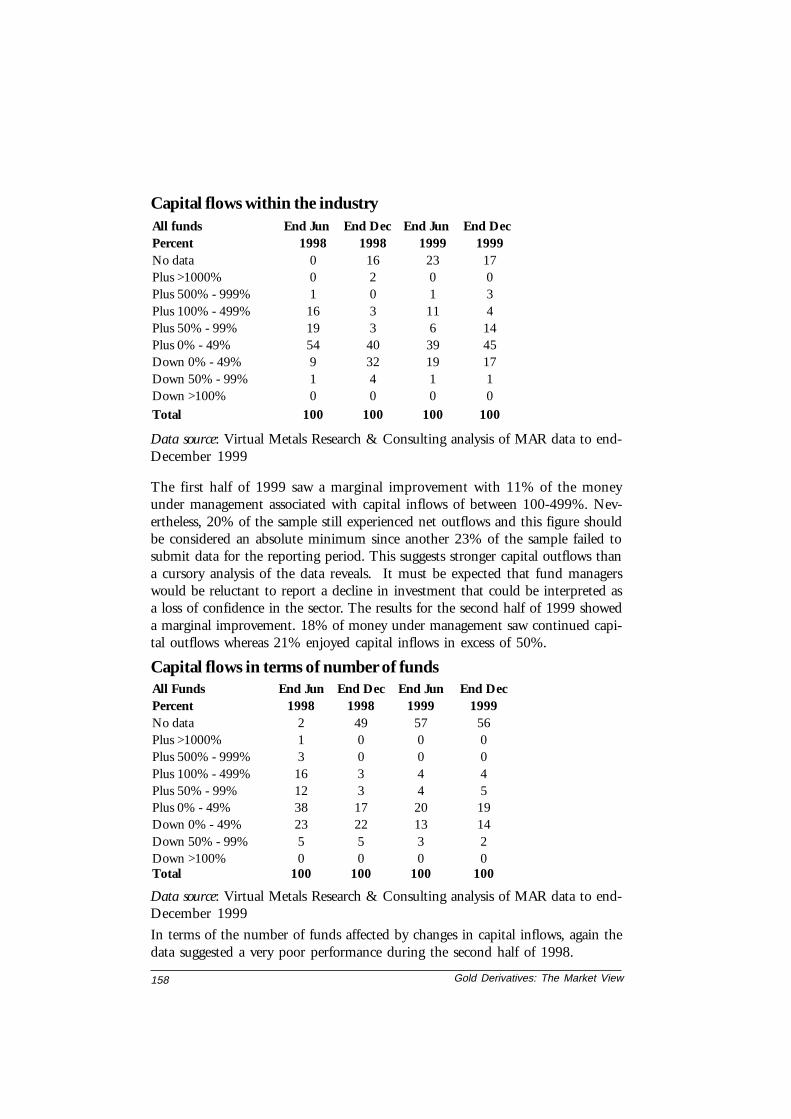
Gold Derivatives: The Market View158
Capital flows within the industry
The first half of 1999 saw a marginal improvement with 11% of the moneyunder management associated with capital inflows of between 100-499%. Nev-ertheless, 20% of the sample still experienced net outflows and this figure shouldbe considered an absolute minimum since another 23% of the sample failed tosubmit data for the reporting period. This suggests stronger capital outflows thana cursory analysis of the data reveals. It must be expected that fund managerswould be reluctant to report a decline in investment that could be interpreted asa loss of confidence in the sector. The results for the second half of 1999 showeda marginal improvement. 18% of money under management saw continued capi-tal outflows whereas 21% enjoyed capital inflows in excess of 50%.
Capital flows in terms of number of funds
All funds End Jun End Dec End Jun End DecPercent 1998 1998 1999 1999No data 0 16 23 17Plus >1000% 0 2 0 0Plus 500% - 999% 1 0 1 3Plus 100% - 499% 16 3 11 4Plus 50% - 99% 19 3 6 14Plus 0% - 49% 54 40 39 45Down 0% - 49% 9 32 19 17Down 50% - 99% 1 4 1 1Down >100% 0 0 0 0
Total 100 100 100 100
All Funds End Jun End Dec End Jun End DecPercent 1998 1998 1999 1999No data 2 49 57 56Plus >1000% 1 0 0 0Plus 500% - 999% 3 0 0 0Plus 100% - 499% 16 3 4 4Plus 50% - 99% 12 3 4 5Plus 0% - 49% 38 17 20 19Down 0% - 49% 23 22 13 14Down 50% - 99% 5 5 3 2Down >100% 0 0 0 0Total 100 100 100 100
Data source: Virtual Metals Research & Consulting analysis of MAR data to end-December 1999
Data source: Virtual Metals Research & Consulting analysis of MAR data to end-December 1999
In terms of the number of funds affected by changes in capital inflows, again thedata suggested a very poor performance during the second half of 1998.

Gold Derivatives: The Market View 159
The data for the first half of 1999 showed no improvement whatsoever and thevery high level of non-disclosure suggests that the majority of trading entitieshave been subject to declining capital bases of substantial magnitude. The latestfigures to December 1999 reveal very little in the way of any form of improve-ment. The reason for the reluctance on the part of the funds to report becomesfully apparent when their financial performance is examined in more detail.
This analysis looked at their returns for, firstly, the half yearly reporting periodsand then, but more importantly, how these results affected the average financialperformance over the life of each fund. The following table shows the six monthlyperformance of the funds to the end of 1999.
In terms of the amount of money under management, the majority of capital stillreceived a positive return on investments. However, the four reporting periodshave shown a marked change in the fortunes of the funds. The first half of 1998was a rather dismal one with 61% of the capital returning only up to 9% to theinvestor. By the second half of the 1998, the situation had improved marginallyfor some funds but deteriorated substantially for others. No less than 27% of themoney was associated with loss making returns. The first half of 1999 saw theirfortunes improve dramatically with only 1% associated with losses. Almost halfthe capital (45%) returned to the investor gains of 10%-25% and another 36%yielded 25%-49%. By the second half of 1999, the situation had shown a markedimprovement. While there were still losses associated with 11% of the capital, noless than 20% saw returns in excess of 50%; a result not seen before during thefour reporting periods.
Financial performance during the six-month reporting period to end-December 1999All Funds End Jun End Dec End Jun End DecPercent 1998 1998 1999 1999No data 0 1 0 0Returns >100% 0 0 1 5Returns >50% but <99% 0 1 6 15Returns >25% but <49% 6 11 36 27Returns >10% but <24% 25 26 45 23Returns >0 but <9% 61 35 11 20Losses >0 but <9% 5 12 1 6Losses >10% but <24% 2 9 0 5Losses >25% but <49% 1 5 0 0Losses >50% but <99% 0 1 0 0Losses >100% 0 0 0 0Total 100 100 100 100
Data source: Virtual Metals Research & Consulting analysis of MAR data to end-December 1999

Gold Derivatives: The Market View160
Average financial performance over the life of the funds
All Funds End Jun End Dec End Jun End DecPercent 1998 1998 1999 1999No data 0 2 1 0Returns >100% 0 0 0 3Returns >50% but <99% 3 2 4 4Returns >25% but <49% 17 9 21 35Returns >10% but <24% 43 56 56 44Returns >0 but <9% 36 27 16 12Losses >0 but <9% 1 3 1 1Losses >10% but <24% 0 2 0 0Losses >25% but <49% 0 0 0 0Losses >50% but <99% 0 0 0 0Losses >100% 0 0 0 0Total 100 100 100 100
During the first half of 1998, 60% of capital returned on average 10%-50% toinvestors and 37% returned up to 9% per annum. The truly impressive returnson which the fund business has built a reputation were actually confined to a verysmall percentage of the fund industry. Only 3% of capital has enjoyed annual
Thus a characteristic of the fund industry is this roller-coaster profile when itcomes to its financial performance. As the recent data has shown, between anyreporting periods, returns can swing dramatically from positive to negative andback again. Furthermore, for individual funds, the magnitude of the swings canbe truly enormous, measured often in 100’s if not 1000s of percentage points.Thus a specific move in any direction during a particular reporting period neednot necessarily imply anything meaningful with respect to long term trends andreading too much into a short term phenomenon will no doubt lead to spuriousand misleading conclusions. Consequently the only way to objectively examinethe financial health of the industry is to analyse the average financial performanceover the life of each fund.
In terms of money under management, this following table shows that by far thevast majority of funds have indeed returned positive results to their investors overthe life of the funds. This stands to reason since a fund that consistently reportslosses will eventually be liquidated.
Data source: Virtual Metals Research & Consulting analysis of MAR data to end-December 1999

Gold Derivatives: The Market View 161
returns of between 50% and 99%. Interestingly, the very poor six monthly per-formance during the second half 1998 was actually sufficient to erode away theaverage and very good track record throughout the life of the funds. Loss makingreturns were recorded by 5% of the capital and those funds returning 25%-49%on average slipped from 17% during the first half to 9% during the second halfof 1998. The state of affairs improved dramatically during the first half of 1999with 77% of capital returning 10%-49% on average. Furthermore, the capitalassociated with loss making positions declined to 1%. The second half of 1999showed a continued consolidation of improved average results. 3% of the capi-tal bases returned to investors on average in excess of 100%.
In keeping with this generally good track record, despite the decline during thesecond half of 1998, the level of non-disclosure has remained very low.
Furthermore, the data yielded a strong correlation between the extent of the lossesand the age of the fund. Those who recorded the greatest losses were the youngerfunds, launched mainly in the last three years. If they continue to yield negativereturns, they can be expected to close in the near future.
The final area of overall analysis of importance is the redemption status of theindustry and the degree to which investors can withdraw their capital. A commonmisconception is that investors have instant access to their capital and can with-draw their funds at very short notice. The implication is that the capital basemanaged by the funds can react swiftly to systemic shocks, as experienced by themarket in 1998 with the threatened collapse of Long Term Capital Management.This is not necessarily the case and in many instances capital can be tied up withthe funds for prolonged periods, even after the investor has served notice of in-tended redemption. This, in general, renders the fund industry less responsive toglobal market developments which might precipitate a withdrawal of funds fromthe industry.
The accompanying table shows the redemption requirements imposed by thefunds on their investors in terms of both money under management and thenumber of funds. It shows that 22% of capital and 26% of the funds are associ-ated with what might be considered illiquid notice periods, namely anythingfrom quarterly to annually with further waiting periods of greater than 60 days.Some 33% of the capital and 28% of the funds are associated with quarterlynotice periods and less than a 60 day wait. The remainder (around 34% of capitaland 37% of the funds) are on what might be considered “call” in that the inves-tors are required to give a maximum of a month’s notice with less than a 60 daywait for their funds.
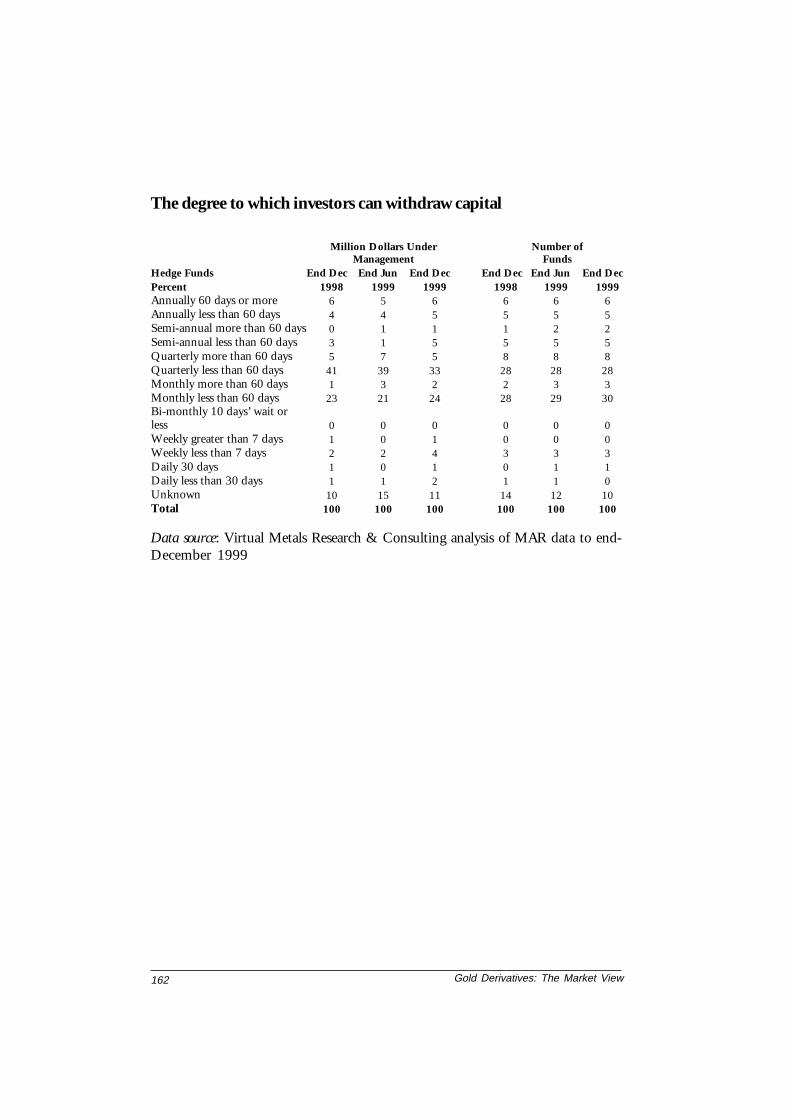
Gold Derivatives: The Market View162
Million Dollars UnderManagement
Number ofFunds
Hedge Funds End Dec End Jun End Dec End Dec End Jun End DecPercent 1998 1999 1999 1998 1999 1999Annually 60 days or more 6 5 6 6 6 6Annually less than 60 days 4 4 5 5 5 5Semi-annual more than 60 days 0 1 1 1 2 2Semi-annual less than 60 days 3 1 5 5 5 5Quarterly more than 60 days 5 7 5 8 8 8Quarterly less than 60 days 41 39 33 28 28 28Monthly more than 60 days 1 3 2 2 3 3Monthly less than 60 days 23 21 24 28 29 30Bi-monthly 10 days’ wait orless 0 0 0 0 0 0Weekly greater than 7 days 1 0 1 0 0 0Weekly less than 7 days 2 2 4 3 3 3Daily 30 days 1 0 1 0 1 1Daily less than 30 days 1 1 2 1 1 0Unknown 10 15 11 14 12 10Total 100 100 100 100 100 100
Data source: Virtual Metals Research & Consulting analysis of MAR data to end-December 1999
The degree to which investors can withdraw capital

Gold Derivatives: The Market View 163
Definitions of Funds and Money-Under-ManagementDATA SOURCES: Managed Account Reports (MAR), Van Hedge, Virtual Metals
Aggressive Growth: (Stock-based) Investment in equity in which the fund man-ager identifies potentially very swift growth in earnings per share. These are usu-ally small or newly capitalised companies in which strong growth potential mightbe expected.
Distressed: (Stock-based) Investment in equity that is exhibiting financial orstructural problems. The fund manager invests at a low-base in the hope that thecompany can be restructured and turned around. A very high-risk investment.
Emerging Markets: (Country-based) Investment in either equity or debt of emerg-ing markets as defined by the World Bank: that is having a per capita GDP of lessthan $8,000 per annum. Investment targets are usually in Africa, South America,Eastern Europe and former CIS States and parts of Asia and the Pacific. Tongue-in-cheek definition by the fund managers themselves especially after the Asiancurrency crisis: an emerging market is something from which you cannot emergein an emergency!
Financial Services: (Banking, Savings and Loans-based) The fund invests inbank securities, thrifts, savings and loans institutions, building societies and otherentities which can be defined as financial institutions.
Funds of Funds: (Fund-based) The fund invests in other funds or indices of otherfunds. The funds of funds may concentrate on specific sector funds or a combina-tion of strategies adopted by other funds. These funds have been excluded froman analysis in this report since their presence would represent double counting.Their influence on the gold market is in any case only indirect.
Healthcare: (Stock-based) The fund invests in a wide range of equities associatedwith healthcare for example pharmaceuticals, medical equipment and services,biotechnology and so on.
Income: (Financial-based) Investment in a range of yield bearing financial in-struments in which capital appreciation is not of primary importance.
Macro or Global Macro: (Commodity/Stock or Financial-based) Broad spec-trum strategy in which the fund manager takes a strategic decision regardingglobal macro economic trends and commodity cycles and attempts to capitaliseon major shifts in country fortunes, commodity developments and interest rate
Gold Derivatives: The Market View164
trends. Decision-making is top down and usually involves a long-term strategyespecially with respect to exit. These are the funds most likely to be exposed toprecious metals.
Market Neutral: (Various instruments) Investment in a market from both thelong and the short side on the premise that that the net impact is neutral orvirtually zero. Managers attempt to select the long side from an undervaluedposition and the short side from an overvalued position.
Market Timing: (Various instruments) Investments which attempt to pre-emptmarket shifts and trends in order to maximise on financial and economicdevelopments.
Opportunistic: (Various instruments) Investment which attempts to capitaliseon developments by using a number of strategies and approaches. Requires agood deal of flexibility.
Short Selling: (Stock-based) Investments that seek out overvalued equities be-fore selling the stock short. Stock is borrowed from brokers and not initially ownedby the fund.
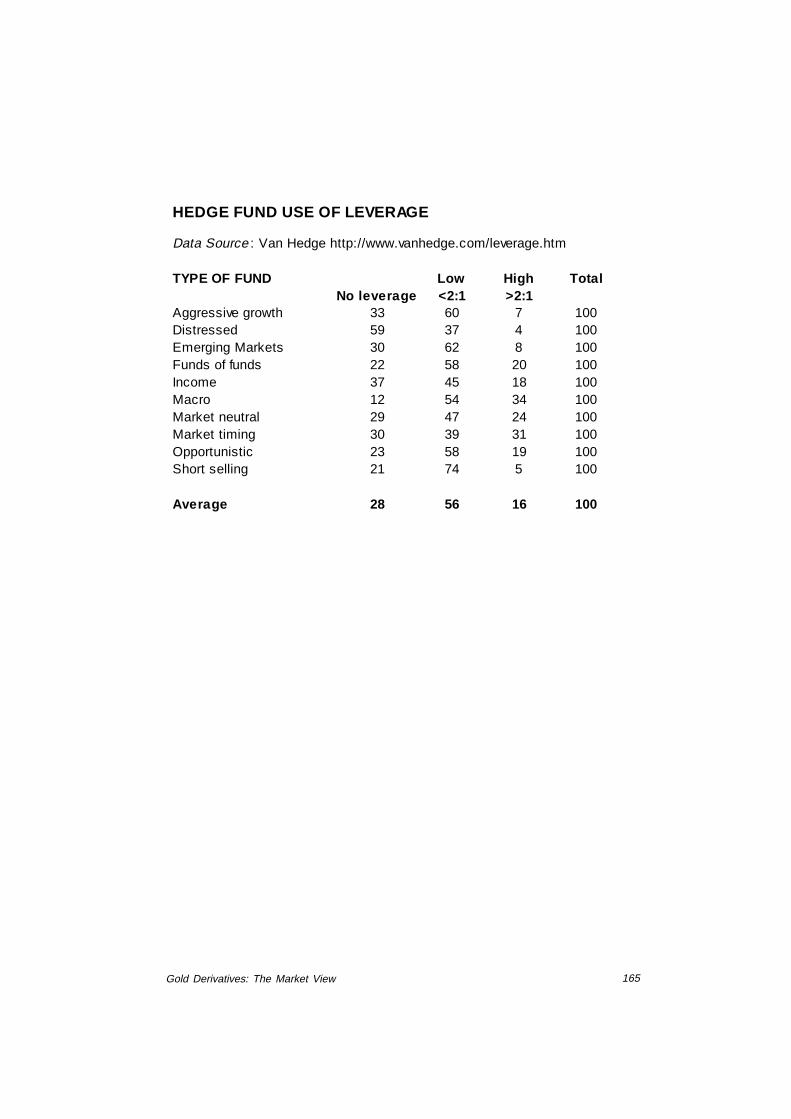
Gold Derivatives: The Market View 165
HEDGE FUND USE OF LEVERAGE
Data Source : Van Hedge http://www.vanhedge.com/leverage.htm
TYPE OF FUND Low High TotalNo leverage <2:1 >2:1
Aggressive growth 33 60 7 100Distressed 59 37 4 100Emerging Markets 30 62 8 100Funds of funds 22 58 20 100Income 37 45 18 100Macro 12 54 34 100Market neutral 29 47 24 100Market timing 30 39 31 100Opportunistic 23 58 19 100Short selling 21 74 5 100
Average 28 56 16 100

Gold D
erivatives: The M
arket View
166 DATA BASE STATUS AND SAMPLE ANALYSIS Mn US Dollars Number of FundsEnd Dec End Jun End Dec End Dec End Jun End Dec
HEDGE FUNDS 1998 1999 1999 1998 1999 1999Existing and covered during reporting period 80,891 77,795 105,343 637 720 798Existing but new to database 11,416 18,258 12,375 171 206 159Existing but not covered during reporting period 0 308 263 415 494 634Newly launched 0 332 1,510 10 70TOTAL 92,307 96,693 119,490 1,223 1,430 1,661
HEDGE FUNDSPercentExisting and covered during reporting period 88 80 88 52 50 48Existing but new to database 12 19 10 14 14 10Existing but not covered during reporting period 0 0 0 34 35 38Newly launched 0 0 1 0 1 4TOTAL 100 100 100 100 100 100
End Dec End Jun End Dec End Dec End Jun End DecCTAs 1998 1999 1999 1998 1999 1999
Existing and covered during reporting period 21,398 20,850 22,693 249 291 288Existing but new to database 5,043 4,202 2,895 92 55 49Existing but not covered during reporting period 0 0 14 112 175 233Newly launched 265 2 309 15 1 20TOTAL 26,706 25,053 25,911 468 522 590
CTAsPercentExisting and covered during reporting period 80 83 88 53 56 49Existing but new to database 19 17 11 20 11 8Existing but not covered during reporting period 0 0 0 24 34 39Newly launched 1 0 1 3 0 3TOTAL 100 100 100 100 100 100
Cont'd/…

Gold D
erivatives: The M
arket View
167
DATA BASE STATUS AND SAMPLE ANALYSIS …/cont'd
End Dec End Jun End Dec End Dec End Jun End DecGLOBAL MACROS 1998 1999 1999 1998 1999 1999
Existing and covered during reporting period 24,867 20,290 24,689 52 45 61Existing but new to database 5,272 2,314 145 5 19 4Existing but not covered during reporting period 0 3 40 19 34 39Newly launched 68 66 28 4 3 3TOTAL 30,207 22,672 24,902 80 101 107
GLOBAL MACROSPercentExisting and covered during reporting period 82 89 99 65 45 57Existing but new to database 17 10 1 6 19 4Existing but not covered during reporting period 0 0 0 24 34 36Newly launched 0 0 0 5 3 3TOTAL 100 100 100 100 100 100
End Dec End Jun End Dec End Dec End Jun End DecALL FUNDS 1998 1999 1999 1998 1999 1999Existing and covered during reporting period 102,289 98,644 128,036 886 1,011 1,086Existing but new to database 16,459 22,460 15,270 263 261 208Existing but not covered during reporting period 0 308 277 527 669 867Newly launched 265 333 1,819 15 11 90TOTAL 119,013 121,745 145,401 1,691 1,952 2,251
ALL FUNDS PercentExisting and covered during reporting period 86 81 88 52 52 48Existing but new to database 14 18 11 16 13 9Existing but not covered during reporting period 0 0 0 31 34 39Newly launched 0 0 1 1 1 4TOTAL 100 100 100 100 100 100

Gold Derivatives: The Market View168
SECTORAL ANALYSIS
Mn Dollars Under Management Number of Funds
HEDGE FUNDS End Dec End Jun End Dec End Dec End Jun End Dec1998 1999 1999 1998 1999 1999
Stock NA 38 56 NA 2 2Event driven 9,975 11,928 12,995 168 180 194Global 25,654 20,063 21,448 506 441 437Global emer 468 2,207 2,709 13 45 64Global est NA 11,655 20,950 128 204Global int 2,199 3,826 4,799 44 25 33Global macro 30,245 22,672 24,902 82 101 107Long only 323 388 697 23 28 35Market neutral 21,383 20,227 26,063 296 362 439Sector 1,415 2,473 3,814 73 89 119Short sales 611 926 1,029 17 22 23US opportunity 34 36 29 1 1 1No data 0 254 0 0 6 3TOTAL 92,307 96,693 119,490 1,223 1,430 1,661
HEDGE FUNDS End Dec End Jun End Dec End Dec End Jun End DecPercent 1998 1999 1999 1998 1999 1999
Stock 0 0 0 NA 0 0Event driven 11 12 11 14 13 12Global 28 21 18 41 31 26Global emer 1 2 2 1 3 4Global est 0 12 18 0 9 12Global int 2 4 4 4 2 2Global macro 33 23 21 7 7 6Long only 0 0 1 2 2 2Market neutral 23 21 22 24 25 26Sector 2 3 3 6 6 7Short sales 1 1 1 1 2 1US opportunity 0 0 0 0 0 0No data 0 0 0 0 0 0TOTAL 100 100 100 100 100 100
Cont'd/…
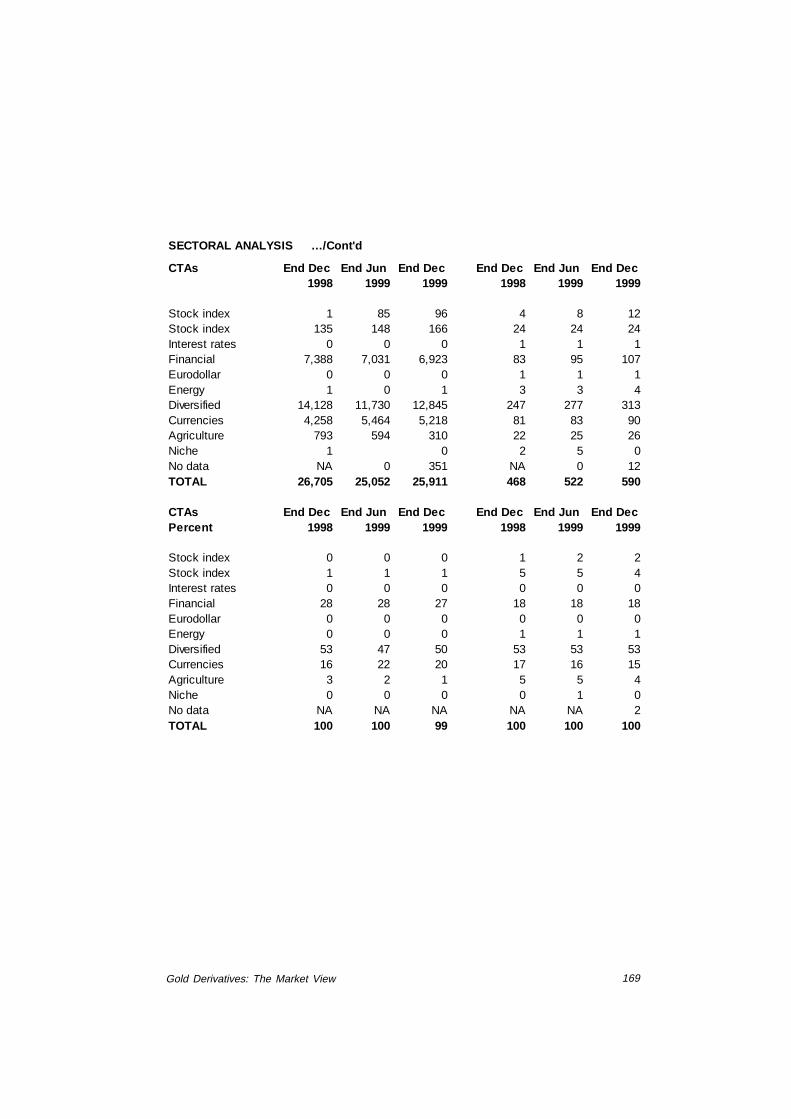
Gold Derivatives: The Market View 169
SECTORAL ANALYSIS …/Cont'd
CTAs End Dec End Jun End Dec End Dec End Jun End Dec1998 1999 1999 1998 1999 1999
Stock index 1 85 96 4 8 12Stock index 135 148 166 24 24 24Interest rates 0 0 0 1 1 1Financial 7,388 7,031 6,923 83 95 107Eurodollar 0 0 0 1 1 1Energy 1 0 1 3 3 4Diversified 14,128 11,730 12,845 247 277 313Currencies 4,258 5,464 5,218 81 83 90Agriculture 793 594 310 22 25 26Niche 1 0 2 5 0No data NA 0 351 NA 0 12TOTAL 26,705 25,052 25,911 468 522 590
CTAs End Dec End Jun End Dec End Dec End Jun End DecPercent 1998 1999 1999 1998 1999 1999
Stock index 0 0 0 1 2 2Stock index 1 1 1 5 5 4Interest rates 0 0 0 0 0 0Financial 28 28 27 18 18 18Eurodollar 0 0 0 0 0 0Energy 0 0 0 1 1 1Diversified 53 47 50 53 53 53Currencies 16 22 20 17 16 15Agriculture 3 2 1 5 5 4Niche 0 0 0 0 1 0No data NA NA NA NA NA 2TOTAL 100 100 99 100 100 100

Gold Derivatives: The Market View170
AN
NU
AL
GR
OW
TH O
F TH
E IN
DU
STR
Y - L
AU
NC
H O
F TH
E FU
ND
S
LAU
NC
HC
UM
ULA
TIV
E
Milli
on D
olla
rs U
nder
Man
agem
ent
Num
ber
of F
unds
Milli
on D
olla
rs U
nder
Man
agem
ent
Num
ber
of F
unds
End
Dec
End
Jun
End
Dec
End
Dec
End
Jun
End
Dec
End
Dec
End
Jun
End
Dec
End
Dec
End
Jun
End
Dec
HED
GE
FUN
DS
1998
1999
1999
1998
1999
1999
1998
1999
1999
1998
1999
1999
19
73
5,1
96
3,8
04
5,8
27
11
15
,19
63
,80
45
,82
71
11
19
74
00
00
00
5,1
96
3,8
04
5,8
27
11
11
97
50
00
00
05
,19
63
,80
45
,82
71
11
19
76
00
00
00
5,1
96
3,8
04
5,8
27
11
11
97
71
,36
21
,38
61
,50
82
22
6,5
58
5,1
90
7,3
34
33
31
97
80
00
00
06
,55
85
,19
07
,33
43
33
19
79
00
00
00
6,5
58
5,1
90
7,3
34
33
31
98
02
01
03
39
11
16
,75
95
,19
07
,67
34
44
19
81
00
00
00
6,7
59
5,1
90
7,6
73
44
41
98
22
26
13
61
13
11
16
,98
55
,32
67
,78
65
55
19
83
53
85
66
11
26
66
7,5
23
5,8
92
7,8
99
11
11
11
19
84
1,9
60
2,0
43
1,8
37
10
11
11
9,4
83
7,9
35
9,7
35
21
22
22
19
85
14
,46
14
,35
94
,53
68
77
23
,94
41
2,2
94
14
,27
12
92
92
91
98
61
,36
73
,35
94
,23
01
01
31
62
5,3
11
15
,65
41
8,5
01
39
42
45
19
87
4,3
56
4,5
95
5,6
31
16
17
18
29
,66
72
0,2
49
24
,13
25
55
96
31
98
81
52
83
08
05
10
91
02
9,8
19
21
,07
92
4,9
38
65
68
73
19
89
5,2
52
5,2
39
5,1
42
26
34
34
35
,07
12
6,3
18
30
,07
99
11
02
10
71
99
06
,08
41
0,9
30
12
,70
14
54
65
14
1,1
55
37
,24
84
2,7
80
13
61
48
15
81
99
15
,29
64
,47
04
,48
74
85
35
54
6,4
51
41
,71
84
7,2
67
18
42
01
21
31
99
26
,97
87
,91
11
1,2
00
71
81
85
53
,42
94
9,6
29
58
,46
72
55
28
22
98
19
93
8,6
43
8,0
68
8,6
74
10
91
25
13
26
2,0
72
57
,69
76
7,1
41
36
44
07
43
01
99
41
0,3
55
11
,27
41
4,6
57
16
31
78
18
57
2,4
27
68
,97
18
1,7
98
52
75
85
61
51
99
56
,64
37
,24
48
,06
11
71
18
92
03
79
,07
07
6,2
15
89
,85
96
98
77
48
18
19
96
5,7
88
7,7
62
9,1
21
24
12
67
28
68
4,8
58
83
,97
79
8,9
80
93
91
,04
11
,10
41
99
76
,11
67
,82
11
0,5
05
21
12
43
26
59
0,9
74
91
,79
81
09
,48
51
,15
01
,28
41
,36
91
99
81
,21
34
,29
87
,99
06
91
36
21
09
2,1
87
96
,09
61
17
,47
51
,21
91
,42
01
,57
91
99
90
33
22
,01
60
10
82
92
,18
79
6,4
28
11
9,4
90
1,2
19
1,4
30
1,6
61
UN
KN
OW
N1
21
26
50
40
09
2,3
08
96
,69
31
19
,49
01
,22
31
,43
01
,66
1
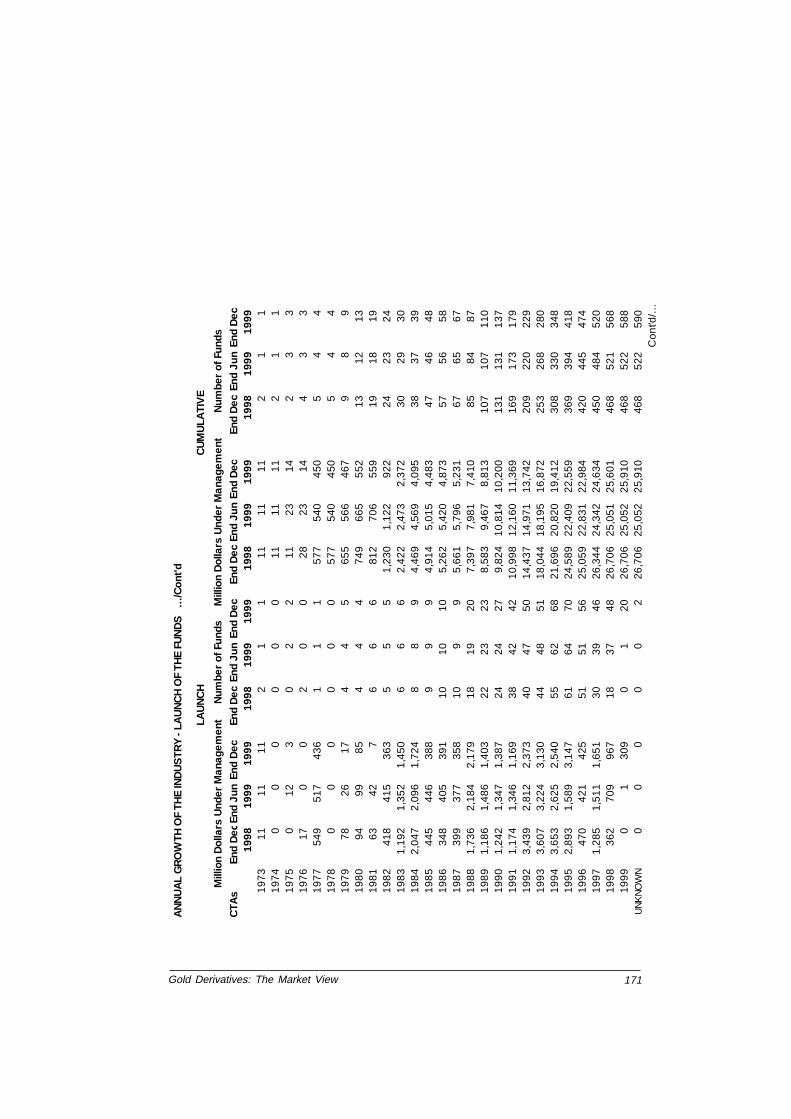
Gold Derivatives: The Market View 171
AN
NU
AL
GR
OW
TH O
F TH
E IN
DU
STR
Y - L
AU
NC
H O
F TH
E FU
ND
S
…/C
ont'd
LAU
NC
HC
UM
ULA
TIV
E
Milli
on D
olla
rs U
nder
Man
agem
ent
Num
ber
of F
unds
Milli
on D
olla
rs U
nder
Man
agem
ent
Num
ber
of F
unds
CTA
sEn
d D
ec
End
Jun
End
Dec
End
Dec
End
Jun
End
Dec
End
Dec
End
Jun
End
Dec
End
Dec
End
Jun
End
Dec
1998
1999
1999
1998
1999
1999
1998
1999
1999
1998
1999
1999
197
311
1111
21
111
1111
21
119
74
00
00
00
1111
112
11
197
50
123
02
211
2314
23
319
76
170
02
00
2823
144
33
197
754
951
743
61
11
577
540
450
54
419
78
00
00
00
577
540
450
54
419
79
7826
174
45
655
566
467
98
919
80
9499
854
44
749
665
552
1312
1319
81
6342
76
66
812
706
559
1918
1919
82
418
415
363
55
51,
230
1,12
292
224
2324
198
31,
192
1,35
21,
450
66
62,
422
2,47
32,
372
3029
3019
84
2,04
72,
096
1,72
48
89
4,46
94,
569
4,09
538
3739
198
544
544
638
89
99
4,91
45,
015
4,48
347
4648
198
634
840
539
110
1010
5,26
25,
420
4,87
357
5658
198
739
937
735
810
99
5,66
15,
796
5,23
167
6567
198
81,
736
2,18
42,
179
1819
207,
397
7,98
17,
410
8584
8719
89
1,18
61,
486
1,40
322
2323
8,58
39,
467
8,81
310
710
711
019
90
1,24
21,
347
1,38
724
2427
9,82
410
,814
10,2
0013
113
113
719
91
1,17
41,
346
1,16
938
4242
10,9
9812
,160
11,3
6916
917
317
919
92
3,43
92,
812
2,37
340
4750
14,4
3714
,971
13,7
4220
922
022
919
93
3,60
73,
224
3,13
044
4851
18,0
4418
,195
16,8
7225
326
828
019
94
3,65
32,
625
2,54
055
6268
21,6
9620
,820
19,4
1230
833
034
819
95
2,89
31,
589
3,14
761
6470
24,5
8922
,409
22,5
5936
939
441
819
96
470
421
425
5151
5625
,059
22,8
3122
,984
420
445
474
199
71,
285
1,51
11,
651
3039
4626
,344
24,3
4224
,634
450
484
520
199
836
270
996
718
3748
26,7
0625
,051
25,6
0146
852
156
819
99
01
309
01
2026
,706
25,0
5225
,910
468
522
588
UN
KN
OW
N0
00
00
226
,706
25,0
5225
,910
468
522
590
Con
t'd/…

Gold Derivatives: The Market View172
AN
NU
AL
GR
OW
TH O
F TH
E IN
DU
STR
Y -
LAU
NC
H O
F TH
E F
UN
DS
…
/Con
t'd
LAU
NC
HC
UM
ULT
AT
IVE
Mill
ion
Dol
lars
Und
er M
anag
eme
ntN
umbe
r of
Fun
dsM
illio
n D
olla
rs U
nder
Man
agem
ent
Num
ber
of F
unds
GLO
BA
LEn
d D
ecEn
d Ju
nEn
d D
ecEn
d D
ec
End
Jun
End
Dec
End
Dec
End
Jun
End
Dec
End
Dec
End
Jun
End
Dec
MA
CR
OS
199
819
99
199
919
98
199
919
99
199
819
99
199
919
98
199
919
99
19
73
5,1
96
05
,82
71
11
5,1
96
05
,82
71
11
19
74
00
00
00
5,1
96
05
,82
71
11
19
75
00
00
00
5,1
96
05
,82
71
11
19
76
00
00
00
5,1
96
05
,82
71
11
19
77
00
00
00
5,1
96
05
,82
71
11
19
78
00
00
00
5,1
96
05
,82
71
11
19
79
00
00
00
5,1
96
05
,82
71
11
19
80
00
00
00
5,1
96
05
,82
71
11
19
81
00
00
00
5,1
96
05
,82
71
11
19
82
00
00
00
5,1
96
05
,82
71
11
19
83
00
00
00
5,1
96
05
,82
71
11
19
84
31
80
02
11
5,5
14
05
,82
73
22
19
85
14
,00
00
4,0
00
22
21
9,5
14
09
,82
75
44
19
86
88
20
55
23
33
20
,39
60
10
,37
88
77
19
87
25
01
12
22
20
,42
10
10
,38
91
09
91
98
80
00
00
02
0,4
21
01
0,3
89
10
99
19
89
90
12
42
22
20
,43
00
10
,51
31
21
11
11
99
04
,04
40
9,0
00
33
32
4,4
74
01
9,5
13
15
14
14
19
91
3,2
07
02
,85
66
88
27
,68
10
22
,36
92
12
22
21
99
22
79
04
74
44
27
,96
00
22
,41
52
52
62
61
99
31
,42
41
,84
11
,00
21
01
41
52
9,3
83
1,8
41
23
,41
73
54
04
11
99
41
24
18
31
08
77
62
9,5
07
2,0
23
23
,52
54
24
74
71
99
52
71
4,0
98
25
58
89
29
,77
86
,12
12
3,7
80
50
55
56
19
96
19
91
1,7
07
30
01
41
61
52
9,9
77
17
,82
82
4,0
80
64
71
71
19
97
16
24
,57
22
93
11
14
16
30
,13
92
2,4
00
24
,37
37
58
58
71
99
86
82
06
22
45
13
14
30
,20
72
2,6
06
24
,59
68
09
81
01
19
99
06
63
06
03
63
0,2
07
22
,67
22
4,9
02
80
10
11
07
UN
KN
OW
N0
00
00
03
0,2
07
22
,67
22
4,9
02
80
10
11
07
Co
nt'd
/…

Gold Derivatives: The Market View 173
AN
NU
AL
GR
OW
TH
OF
TH
E IN
DU
ST
RY
- L
AU
NC
H O
F T
HE
FU
ND
S
…/C
ont'd
LAU
NC
HC
UM
ULT
AT
IVE
Mill
iion
Dol
lars
Und
er M
anag
emen
tN
umbe
r of
Fun
dsM
illio
n D
olla
rs U
nder
Man
agem
ent
Num
ber
of F
unds
ALL
FU
ND
SE
nd D
ecE
nd J
unE
nd D
ecE
nd D
ecE
nd J
unE
nd D
ecE
nd D
ecE
nd J
unE
nd D
ecE
nd D
ecE
nd J
unE
nd D
ec19
9819
9919
9919
9819
9919
9919
9819
9919
9919
9819
9919
9919
735,
207
3,81
65,
837
32
25,
207
3,81
65,
837
32
2
1974
00
00
00
5,20
73,
816
5,83
73
22
1975
012
30
22
5,20
73,
827
5,84
13
44
1976
170
02
00
5,22
43,
827
5,84
15
44
1977
1,91
11,
903
1,94
43
33
7,13
55,
730
7,78
48
77
1978
00
00
00
7,13
55,
730
7,78
48
77
1979
7826
174
45
7,21
35,
756
7,80
112
1112
1980
295
9942
45
55
7,50
85,
855
8,22
517
1617
1981
6342
76
66
7,57
15,
897
8,23
223
2223
1982
644
551
476
66
68,
215
6,44
88,
708
2928
29
1983
1,73
01,
918
1,56
212
1212
9,94
58,
365
10,2
7041
4041
1984
4,00
74,
139
3,56
018
1920
13,9
5212
,505
13,8
3159
5961
1985
14,9
064,
805
4,92
317
1616
28,8
5817
,309
18,7
5476
7577
1986
1,71
53,
764
4,62
120
2326
30,5
7321
,073
23,3
7496
9810
3
1987
4,75
54,
972
5,98
926
2627
35,3
2826
,045
29,3
6312
212
413
0
1988
1,88
83,
014
2,98
428
2830
37,2
1629
,059
32,3
4815
015
216
0
1989
6,43
86,
725
6,54
548
5757
43,6
5435
,785
38,8
9219
820
921
7
1990
7,32
612
,278
14,0
8869
7078
50,9
7948
,062
52,9
8026
727
929
5
1991
6,47
05,
816
5,65
686
9597
57,4
4953
,878
58,6
3635
337
439
2
1992
10,4
1710
,722
13,5
7311
112
813
567
,866
64,6
0072
,209
464
502
527
1993
12,2
5011
,291
11,8
0415
317
318
380
,116
75,8
9284
,013
617
675
710
1994
14,0
0813
,899
17,1
9721
824
025
394
,123
89,7
9110
1,21
083
591
596
3
1995
9,53
68,
833
11,2
0823
225
327
310
3,65
998
,624
112,
418
1,06
71,
168
1,23
6
1996
6,25
88,
184
9,54
529
231
834
210
9,91
710
6,80
812
1,96
31,
359
1,48
61,
578
1997
7,40
19,
332
12,1
5624
128
231
111
7,31
811
6,13
913
4,11
91,
600
1,76
81,
889
1998
1,57
55,
007
8,95
687
173
258
118,
893
121,
147
143,
075
1,68
71,
941
2,14
7
1999
033
32,
325
011
102
118,
893
121,
480
145,
400
1,68
71,
952
2,24
9
UN
KN
OW
N12
126
50
40
211
9,01
412
1,74
514
5,40
01,
691
1,95
22,
251
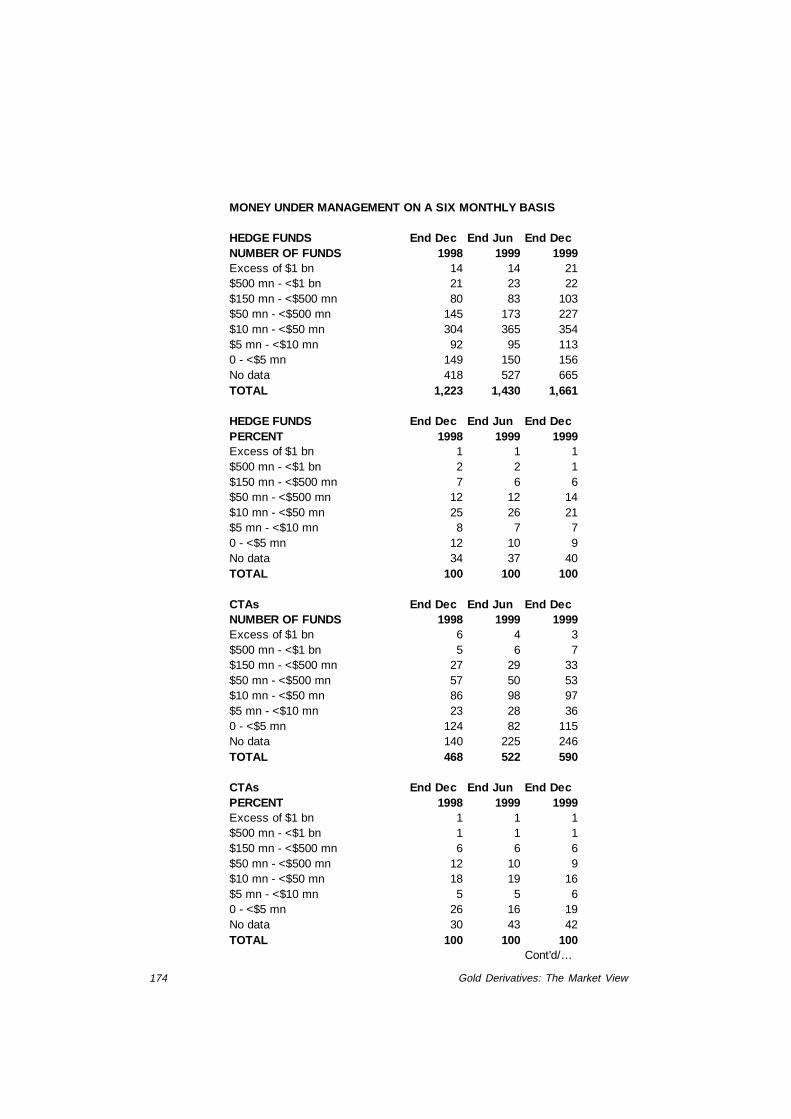
Gold Derivatives: The Market View174
MONEY UNDER MANAGEMENT ON A SIX MONTHLY BASIS
HEDGE FUNDS End Dec End Jun End DecNUMBER OF FUNDS 1998 1999 1999Excess of $1 bn 14 14 21$500 mn - <$1 bn 21 23 22$150 mn - <$500 mn 80 83 103$50 mn - <$500 mn 145 173 227$10 mn - <$50 mn 304 365 354$5 mn - <$10 mn 92 95 1130 - <$5 mn 149 150 156No data 418 527 665TOTAL 1,223 1,430 1,661
HEDGE FUNDS End Dec End Jun End DecPERCENT 1998 1999 1999Excess of $1 bn 1 1 1$500 mn - <$1 bn 2 2 1$150 mn - <$500 mn 7 6 6$50 mn - <$500 mn 12 12 14$10 mn - <$50 mn 25 26 21$5 mn - <$10 mn 8 7 70 - <$5 mn 12 10 9No data 34 37 40TOTAL 100 100 100
CTAs End Dec End Jun End DecNUMBER OF FUNDS 1998 1999 1999Excess of $1 bn 6 4 3$500 mn - <$1 bn 5 6 7$150 mn - <$500 mn 27 29 33$50 mn - <$500 mn 57 50 53$10 mn - <$50 mn 86 98 97$5 mn - <$10 mn 23 28 360 - <$5 mn 124 82 115No data 140 225 246TOTAL 468 522 590
CTAs End Dec End Jun End DecPERCENT 1998 1999 1999Excess of $1 bn 1 1 1$500 mn - <$1 bn 1 1 1$150 mn - <$500 mn 6 6 6$50 mn - <$500 mn 12 10 9$10 mn - <$50 mn 18 19 16$5 mn - <$10 mn 5 5 60 - <$5 mn 26 16 19No data 30 43 42TOTAL 100 100 100
Cont'd/…

Gold Derivatives: The Market View 175
MONEY-UNDER-MANAGEMENT ON A SIX-MONTHLY BASIS …/Cont'd
GLOBAL MACROS End Dec End Jun End DecNUMBER OF FUNDS 1998 1999 1999Excess of $1 bn 6 5 5$500 mn - <$1 bn 2 1 1$150 mn - <$500 mn 6 4 5$50 mn - <$500 mn 7 7 7$10 mn - <$50 mn 21 27 27$5 mn - <$10 mn 4 6 70 - <$5 mn 15 14 14No data 19 37 41TOTAL 80 101 107
GLOBAL MACROS End Dec End Jun End DecPERCENT 1998 1999 1999Excess of $1 bn 8 5 5$500 mn - <$1 bn 3 1 1$150 mn - <$500 mn 8 4 5$50 mn - <$500 mn 9 7 7$10 mn - <$50 mn 26 27 25$5 mn - <$10 mn 5 6 70 - <$5 mn 19 14 13No data 24 37 38TOTAL 100 100 100
ALL FUNDS End Dec End Jun End DecNUMBER OF FUNDS 1998 1999 1999Excess of $1 bn 20 18 24$500 mn - <$1 bn 26 29 29$150 mn - <$500 mn 107 112 136$50 mn - <$500 mn 202 223 280$10 mn - <$50 mn 390 463 451$5 mn - <$10 mn 115 123 1490 - <$5 mn 273 232 271No data 558 752 911TOTAL 1,691 1,952 2,251
ALL FUNDS End Dec End Jun End DecPERCENT 1998 1999 1999Excess of $1 bn 1 1 1$500 mn - <$1 bn 2 1 1$150 mn - <$500 mn 6 6 6$50 mn - <$500 mn 12 11 12$10 mn - <$50 mn 23 24 20$5 mn - <$10 mn 7 6 70 - <$5 mn 16 12 12No data 33 39 40TOTAL 100 100 100

Gold D
erivatives: The M
arket View
176 CHANGES IN CAPITAL BASES ON A SIX-MONTHLY BASIS
Million Dollars Under Management Number of FundsHEDGE FUNDS End Jun End Dec End Jun End Dec End Jun End Dec End Jun End Dec
1998 1998 1999 1999 1998 1998 1999 1999No data 240 11,501 23,504 19,056 16 585 820 917Plus >1000% 517 55 328 115 10 2 5 2Plus 500% - 999% 3,109 318 878 3,921 26 6 3 5Plus 100% - 499% 35,043 2,263 12,823 5,767 160 26 54 76Plus 50% - 99% 41,721 2,279 5,864 19,510 123 29 53 87Plus 0% - 49% 120,561 37,032 35,138 57,378 355 195 285 363Down 0% - 49% 15,124 34,859 17,697 13,124 185 312 175 177Down 50% - 99% 619 4,000 460 619 32 64 35 34Down >100% 0 0 0 4 0 0TOTAL 216,934 92,307 96,693 119,490 907 1,223 1,430 1,661
HEDGE FUNDS End Jun End Dec End Jun End Dec End Jun End Dec End Jun End DecPERCENT 1998 1998 1999 1999 1998 1998 1999 1999No data 0 12 24 16 2 48 57 55Plus >1000% 0 0 0 0 1 0 0 0Plus 500% - 999% 1 0 1 3 3 0 0 0Plus 100% - 499% 16 2 13 5 18 2 4 5Plus 50% - 99% 19 2 6 16 14 2 4 5Plus 0% - 49% 56 40 36 48 39 16 20 22Down 0% - 49% 7 38 18 11 20 26 12 11Down 50% - 99% 0 4 0 1 4 5 2 2Down >100% 0 0 0 0 0 0 0 0TOTAL 100 100 100 100 100 100 100 100
Cont'd/…
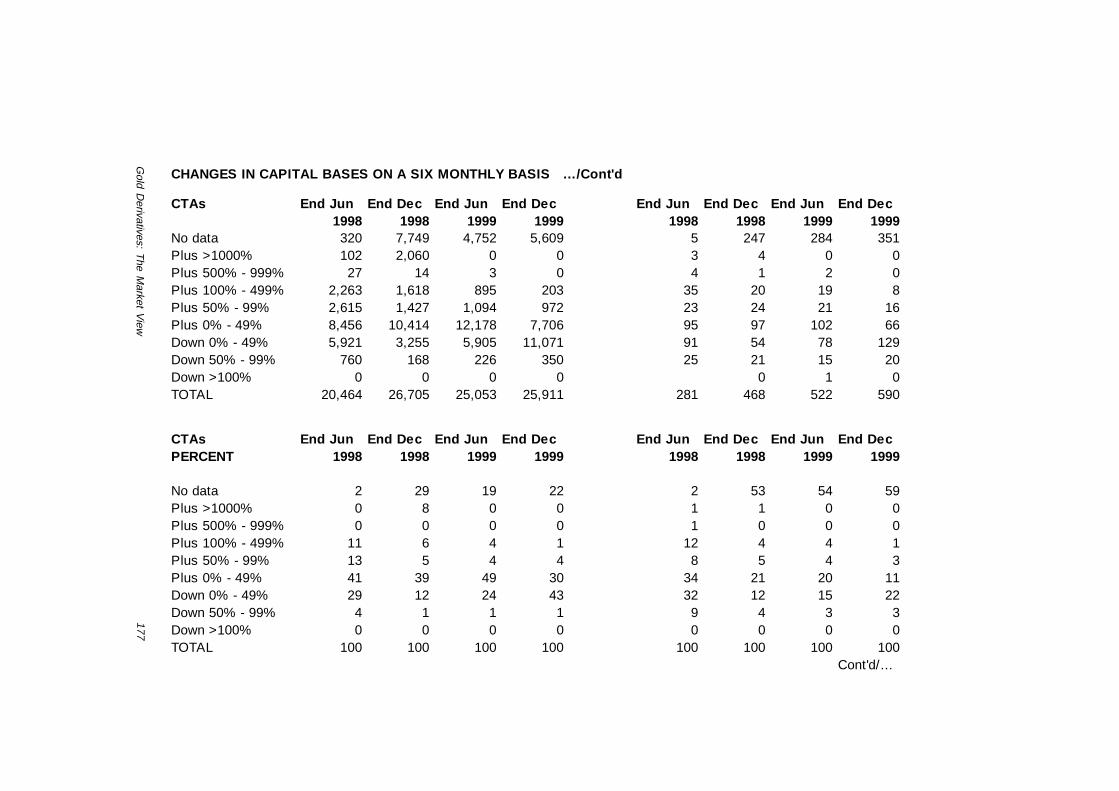
Gold D
erivatives: The M
arket View
177
CHANGES IN CAPITAL BASES ON A SIX MONTHLY BASIS …/Cont'd
CTAs End Jun End Dec End Jun End Dec End Jun End Dec End Jun End Dec1998 1998 1999 1999 1998 1998 1999 1999
No data 320 7,749 4,752 5,609 5 247 284 351Plus >1000% 102 2,060 0 0 3 4 0 0Plus 500% - 999% 27 14 3 0 4 1 2 0Plus 100% - 499% 2,263 1,618 895 203 35 20 19 8Plus 50% - 99% 2,615 1,427 1,094 972 23 24 21 16Plus 0% - 49% 8,456 10,414 12,178 7,706 95 97 102 66Down 0% - 49% 5,921 3,255 5,905 11,071 91 54 78 129Down 50% - 99% 760 168 226 350 25 21 15 20Down >100% 0 0 0 0 0 1 0TOTAL 20,464 26,705 25,053 25,911 281 468 522 590
CTAs End Jun End Dec End Jun End Dec End Jun End Dec End Jun End DecPERCENT 1998 1998 1999 1999 1998 1998 1999 1999
No data 2 29 19 22 2 53 54 59Plus >1000% 0 8 0 0 1 1 0 0Plus 500% - 999% 0 0 0 0 1 0 0 0Plus 100% - 499% 11 6 4 1 12 4 4 1Plus 50% - 99% 13 5 4 4 8 5 4 3Plus 0% - 49% 41 39 49 30 34 21 20 11Down 0% - 49% 29 12 24 43 32 12 15 22Down 50% - 99% 4 1 1 1 9 4 3 3Down >100% 0 0 0 0 0 0 0 0TOTAL 100 100 100 100 100 100 100 100
Cont'd/…

Gold D
erivatives: The M
arket View
178 CHANGES IN CAPITAL BASES ON A SIX-MONTHLY BASIS …/Cont'd
GLOBAL MACROS End Jun End Dec End Jun End Dec End Jun End Dec End Jun End Dec1998 1998 1999 1999 1998 1998 1999 1999
No data 5,340 2,444 256 28 55 51Plus >1000% 0 0 0 0 0 0Plus 500% - 999% 0 0 0 0 0 0Plus 100% - 499% 0 9,169 63 0 8 5Plus 50% - 99% 316 0 6,003 2 0 5Plus 0% - 49% 15,214 5,960 17,581 16 18 21Down 0% - 49% 7,226 5,045 908 27 16 17Down 50% - 99% 2,111 55 91 7 4 8Down >100% 0 0 0 0 0 0TOTAL 0 30,207 22,672 24,902 0 80 101 107
GLOBAL MACROS End Jun End Dec End Jun End Dec End Jun End Dec End Jun End DecPERCENT 1998 1998 1999 1999 1998 1998 1999 1999
No data 18 11 1 35 54 48Plus >1000% 0 0 0 0 0 0Plus 500% - 999% 0 0 0 0 0 0Plus 100% - 499% 0 40 0 0 8 5Plus 50% - 99% 1 0 24 3 0 5Plus 0% - 49% 50 26 71 20 18 20Down 0% - 49% 24 22 4 34 16 16Down 50% - 99% 7 0 0 9 4 7Down >100% 0 0 0 0 0 0TOTAL 100 100 100 100 100 100
Cont'd/…
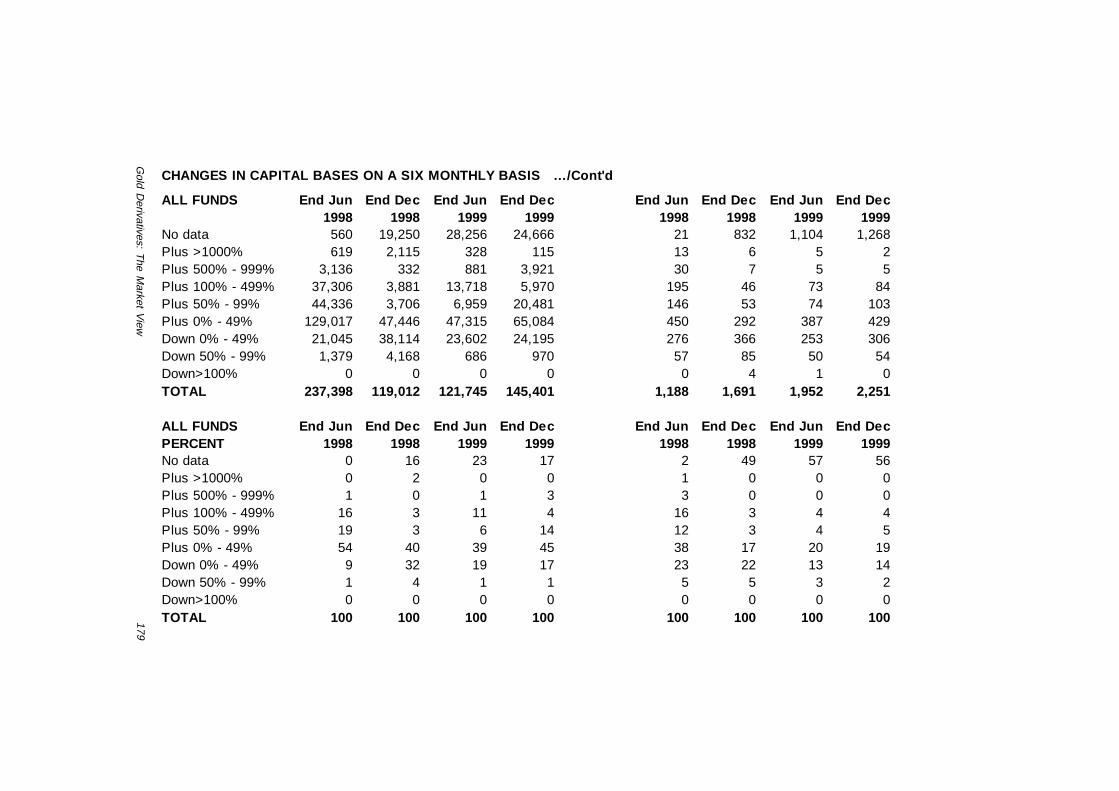
Gold D
erivatives: The M
arket View
179
CHANGES IN CAPITAL BASES ON A SIX MONTHLY BASIS …/Cont'd
ALL FUNDS End Jun End Dec End Jun End Dec End Jun End Dec End Jun End Dec1998 1998 1999 1999 1998 1998 1999 1999
No data 560 19,250 28,256 24,666 21 832 1,104 1,268Plus >1000% 619 2,115 328 115 13 6 5 2Plus 500% - 999% 3,136 332 881 3,921 30 7 5 5Plus 100% - 499% 37,306 3,881 13,718 5,970 195 46 73 84Plus 50% - 99% 44,336 3,706 6,959 20,481 146 53 74 103Plus 0% - 49% 129,017 47,446 47,315 65,084 450 292 387 429Down 0% - 49% 21,045 38,114 23,602 24,195 276 366 253 306Down 50% - 99% 1,379 4,168 686 970 57 85 50 54Down>100% 0 0 0 0 0 4 1 0TOTAL 237,398 119,012 121,745 145,401 1,188 1,691 1,952 2,251
ALL FUNDS End Jun End Dec End Jun End Dec End Jun End Dec End Jun End DecPERCENT 1998 1998 1999 1999 1998 1998 1999 1999No data 0 16 23 17 2 49 57 56Plus >1000% 0 2 0 0 1 0 0 0Plus 500% - 999% 1 0 1 3 3 0 0 0Plus 100% - 499% 16 3 11 4 16 3 4 4Plus 50% - 99% 19 3 6 14 12 3 4 5Plus 0% - 49% 54 40 39 45 38 17 20 19Down 0% - 49% 9 32 19 17 23 22 13 14Down 50% - 99% 1 4 1 1 5 5 3 2Down>100% 0 0 0 0 0 0 0 0TOTAL 100 100 100 100 100 100 100 100
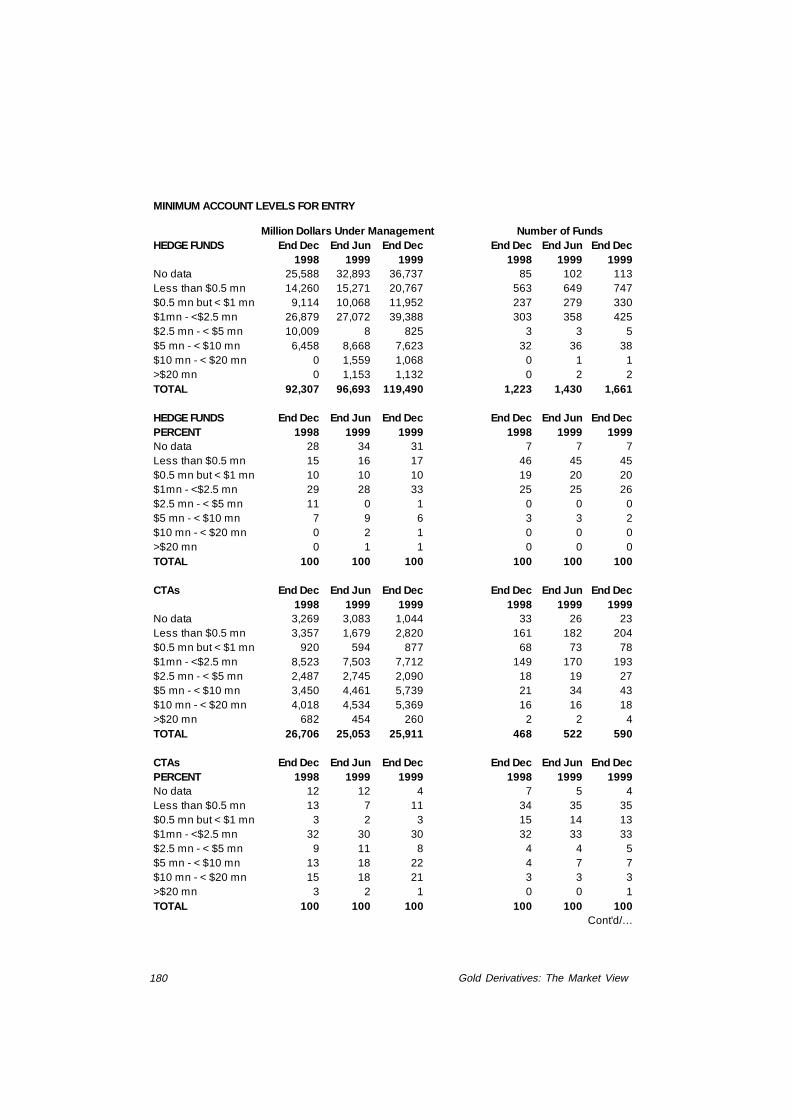
Gold Derivatives: The Market View180
MINIMUM ACCOUNT LEVELS FOR ENTRY
Million Dollars Under Management Number of FundsHEDGE FUNDS End Dec End Jun End Dec End Dec End Jun End Dec
1998 1999 1999 1998 1999 1999No data 25,588 32,893 36,737 85 102 113Less than $0.5 mn 14,260 15,271 20,767 563 649 747$0.5 mn but < $1 mn 9,114 10,068 11,952 237 279 330$1mn - <$2.5 mn 26,879 27,072 39,388 303 358 425$2.5 mn - < $5 mn 10,009 8 825 3 3 5$5 mn - < $10 mn 6,458 8,668 7,623 32 36 38$10 mn - < $20 mn 0 1,559 1,068 0 1 1>$20 mn 0 1,153 1,132 0 2 2TOTAL 92,307 96,693 119,490 1,223 1,430 1,661
HEDGE FUNDS End Dec End Jun End Dec End Dec End Jun End DecPERCENT 1998 1999 1999 1998 1999 1999No data 28 34 31 7 7 7Less than $0.5 mn 15 16 17 46 45 45$0.5 mn but < $1 mn 10 10 10 19 20 20$1mn - <$2.5 mn 29 28 33 25 25 26$2.5 mn - < $5 mn 11 0 1 0 0 0$5 mn - < $10 mn 7 9 6 3 3 2$10 mn - < $20 mn 0 2 1 0 0 0>$20 mn 0 1 1 0 0 0TOTAL 100 100 100 100 100 100
CTAs End Dec End Jun End Dec End Dec End Jun End Dec1998 1999 1999 1998 1999 1999
No data 3,269 3,083 1,044 33 26 23Less than $0.5 mn 3,357 1,679 2,820 161 182 204$0.5 mn but < $1 mn 920 594 877 68 73 78$1mn - <$2.5 mn 8,523 7,503 7,712 149 170 193$2.5 mn - < $5 mn 2,487 2,745 2,090 18 19 27$5 mn - < $10 mn 3,450 4,461 5,739 21 34 43$10 mn - < $20 mn 4,018 4,534 5,369 16 16 18>$20 mn 682 454 260 2 2 4TOTAL 26,706 25,053 25,911 468 522 590
CTAs End Dec End Jun End Dec End Dec End Jun End DecPERCENT 1998 1999 1999 1998 1999 1999No data 12 12 4 7 5 4Less than $0.5 mn 13 7 11 34 35 35$0.5 mn but < $1 mn 3 2 3 15 14 13$1mn - <$2.5 mn 32 30 30 32 33 33$2.5 mn - < $5 mn 9 11 8 4 4 5$5 mn - < $10 mn 13 18 22 4 7 7$10 mn - < $20 mn 15 18 21 3 3 3>$20 mn 3 2 1 0 0 1TOTAL 100 100 100 100 100 100
Cont'd/…
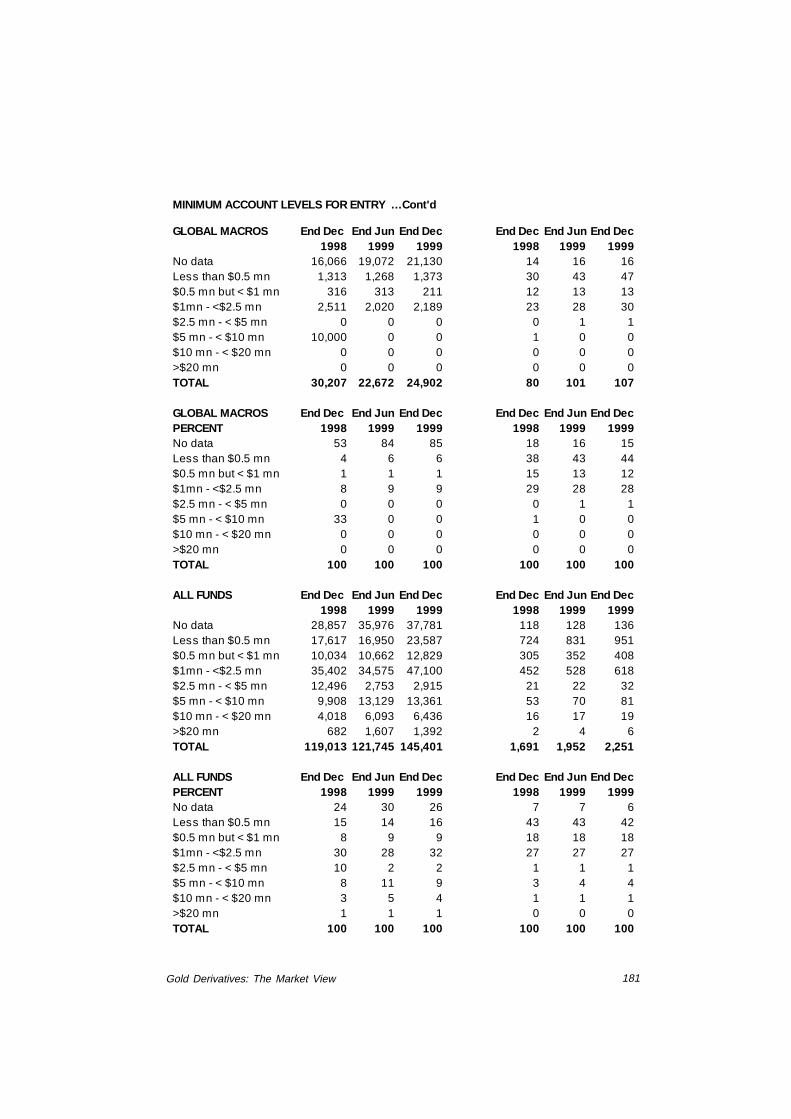
Gold Derivatives: The Market View 181
MINIMUM ACCOUNT LEVELS FOR ENTRY …Cont'd
GLOBAL MACROS End Dec End Jun End Dec End Dec End Jun End Dec1998 1999 1999 1998 1999 1999
No data 16,066 19,072 21,130 14 16 16Less than $0.5 mn 1,313 1,268 1,373 30 43 47$0.5 mn but < $1 mn 316 313 211 12 13 13$1mn - <$2.5 mn 2,511 2,020 2,189 23 28 30$2.5 mn - < $5 mn 0 0 0 0 1 1$5 mn - < $10 mn 10,000 0 0 1 0 0$10 mn - < $20 mn 0 0 0 0 0 0>$20 mn 0 0 0 0 0 0TOTAL 30,207 22,672 24,902 80 101 107
GLOBAL MACROS End Dec End Jun End Dec End Dec End Jun End DecPERCENT 1998 1999 1999 1998 1999 1999No data 53 84 85 18 16 15Less than $0.5 mn 4 6 6 38 43 44$0.5 mn but < $1 mn 1 1 1 15 13 12$1mn - <$2.5 mn 8 9 9 29 28 28$2.5 mn - < $5 mn 0 0 0 0 1 1$5 mn - < $10 mn 33 0 0 1 0 0$10 mn - < $20 mn 0 0 0 0 0 0>$20 mn 0 0 0 0 0 0TOTAL 100 100 100 100 100 100
ALL FUNDS End Dec End Jun End Dec End Dec End Jun End Dec1998 1999 1999 1998 1999 1999
No data 28,857 35,976 37,781 118 128 136Less than $0.5 mn 17,617 16,950 23,587 724 831 951$0.5 mn but < $1 mn 10,034 10,662 12,829 305 352 408$1mn - <$2.5 mn 35,402 34,575 47,100 452 528 618$2.5 mn - < $5 mn 12,496 2,753 2,915 21 22 32$5 mn - < $10 mn 9,908 13,129 13,361 53 70 81$10 mn - < $20 mn 4,018 6,093 6,436 16 17 19>$20 mn 682 1,607 1,392 2 4 6TOTAL 119,013 121,745 145,401 1,691 1,952 2,251
ALL FUNDS End Dec End Jun End Dec End Dec End Jun End DecPERCENT 1998 1999 1999 1998 1999 1999No data 24 30 26 7 7 6Less than $0.5 mn 15 14 16 43 43 42$0.5 mn but < $1 mn 8 9 9 18 18 18$1mn - <$2.5 mn 30 28 32 27 27 27$2.5 mn - < $5 mn 10 2 2 1 1 1$5 mn - < $10 mn 8 11 9 3 4 4$10 mn - < $20 mn 3 5 4 1 1 1>$20 mn 1 1 1 0 0 0TOTAL 100 100 100 100 100 100

Gold D
erivatives: The M
arket View
182 SIX-MONTHLY RETURNS TO INVESTORS
Million dollars under management Number of FundsHEDGE FUNDS End Jun End Dec End Jun End Dec End Jun End Dec End Jun End Dec
1998 1998 1999 1999 1998 1998 1999 1999No data 0 23 120 60 0 415 499 631Returns >100% 52 105 473 6,667 4 5 15 91Returns >50% but <99% 249 1,066 4,856 21,078 8 30 44 169Returns >25% but <49% 10,975 9,565 23,483 38,696 43 106 224 217Returns >10% but <24% 50,997 21,783 52,498 29,349 192 168 396 288Returns >0 but <9% 138,190 31,113 13,390 15,409 445 212 156 134Losses >0 but <9% 9,193 12,853 1,454 3,527 104 99 51 76Losses >10% but <24% 4,843 9,546 289 4,492 63 89 31 36Losses >25% but <49% 2,237 5,424 54 205 34 67 13 16Losses >50% but <99% 128 769 76 8 7 29 1 3Losses >100% 70 60 0 0 7 3 0 0TOTAL 216,934 92,307 96,693 119,490 907 1,223 1,430 1,661
HEDGE FUNDS End Jun End Dec End Jun End Dec End Jun End Dec End Jun End DecPERCENT 1998 1998 1999 1999 1998 1998 1999 1999No data 0 0 0 0 0 34 35 38Returns >100% 0 0 0 6 0 0 1 5Returns >50% but <99% 0 1 5 18 1 2 3 10Returns >25% but <49% 5 10 24 32 5 9 16 13Returns >10% but <24% 24 24 54 25 21 14 28 17Returns >0 buts <9% 64 34 14 13 49 17 11 8Losses >0 but <9% 4 14 2 3 11 8 4 5Losses >10% but <24% 2 10 0 4 7 7 2 2Losses >25% but <49% 1 6 0 0 4 5 1 1Losses >50% but <99% 0 1 0 0 1 2 0 0Losses >100% 0 0 0 0 1 0 0 0TOTAL 100 100 100 100 100 100 100 100
Cont'd/…

Gold D
erivatives: The M
arket View
183
SIX-MONTHLY RETURNS TO INVESTORS …/Cont'd
CTAs End Jun End Dec End Jun End Dec End Jun End Dec End Jun End Dec1998 1998 1999 1999 1998 1998 1999 1999
No data 1 1,137 0 9 1 114 175 234Returns >100% 1 52 420 3 1 4 1 2Returns >50% but <99% 332 512 2,124 93 6 13 8 10Returns >25% but <49% 2,299 3,333 20,489 489 34 49 52 19Returns >10% but <24% 8,411 9,146 2,020 3,553 90 98 168 56Returns >0 but <9% 6,170 10,159 0 13,379 98 91 94 91Losses >0 but <9% 2,979 1,464 0 5,019 40 48 19 97Losses >10% but <24% 271 864 0 3,096 11 36 4 67Losses >25% but <49% 0 23 0 269 0 10 1 12Losses >50% but <99% 0 18 0 0 0 5 0 2Losses >100% 0 0 0 0 0TOTAL 20,464 26,706 25,053 25,910 281 468 522 590
CTAs End Jun End Dec End Jun End Dec End Jun End Dec End Jun End DecPERCENT 1998 1998 1999 1999 1998 1998 1999 1999No data 0 4 0 0 0 24 34 40Returns >100% 0 0 2 0 0 1 0 0Returns >50% but <99% 2 2 8 0 2 3 2 2Returns >25% but <49% 11 12 82 2 12 10 10 3Returns >10% but <24% 41 34 8 14 32 21 32 9Returns >0 buts <9% 30 38 0 52 35 19 18 15Losses >0 but <9% 15 5 0 19 14 10 4 16Losses >10% but <24% 1 3 0 12 4 8 1 11Losses >25% but <49% 0 0 0 1 0 2 0 2Losses >50% but <99% 0 0 0 0 0 1 0 0Losses >100% 0 0 0 0 0 0 0 0TOTAL 100 100 100 100 100 100 100 100
Cont'd/…
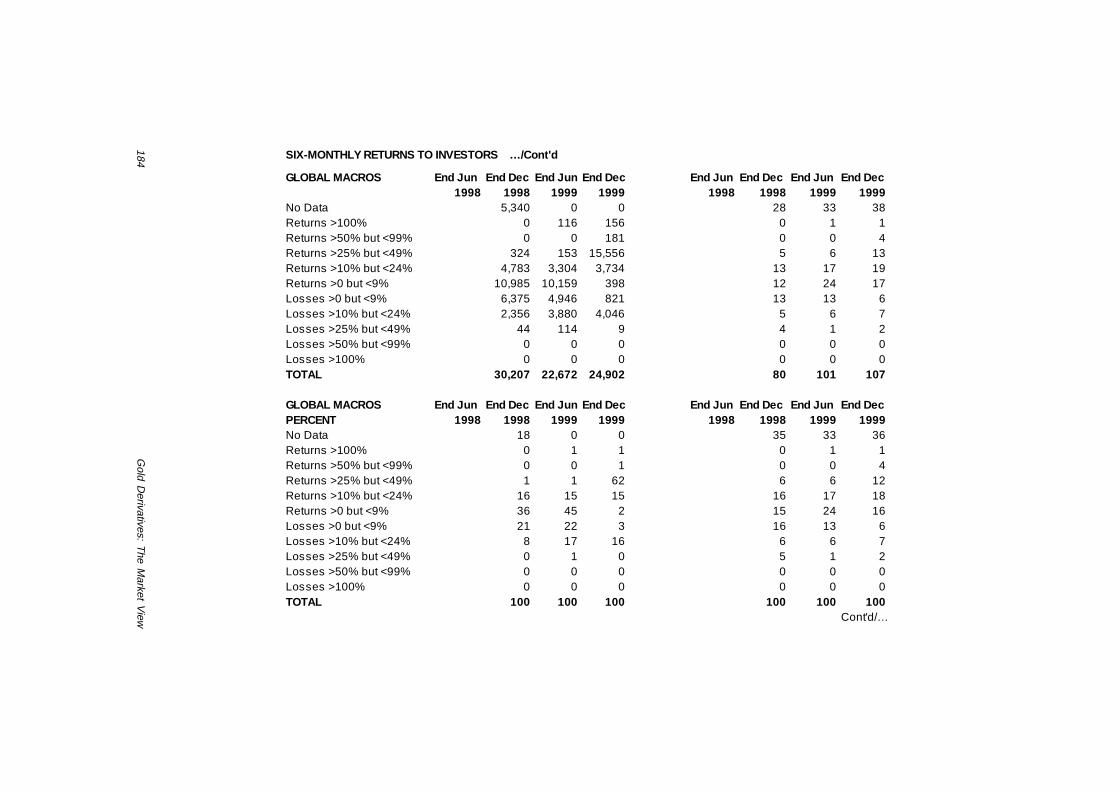
Gold D
erivatives: The M
arket View
184 SIX-MONTHLY RETURNS TO INVESTORS …/Cont'd
GLOBAL MACROS End Jun End Dec End Jun End Dec End Jun End Dec End Jun End Dec1998 1998 1999 1999 1998 1998 1999 1999
No Data 5,340 0 0 28 33 38Returns >100% 0 116 156 0 1 1Returns >50% but <99% 0 0 181 0 0 4Returns >25% but <49% 324 153 15,556 5 6 13Returns >10% but <24% 4,783 3,304 3,734 13 17 19Returns >0 but <9% 10,985 10,159 398 12 24 17Losses >0 but <9% 6,375 4,946 821 13 13 6Losses >10% but <24% 2,356 3,880 4,046 5 6 7Losses >25% but <49% 44 114 9 4 1 2Losses >50% but <99% 0 0 0 0 0 0Losses >100% 0 0 0 0 0 0TOTAL 30,207 22,672 24,902 80 101 107
GLOBAL MACROS End Jun End Dec End Jun End Dec End Jun End Dec End Jun End DecPERCENT 1998 1998 1999 1999 1998 1998 1999 1999No Data 18 0 0 35 33 36Returns >100% 0 1 1 0 1 1Returns >50% but <99% 0 0 1 0 0 4Returns >25% but <49% 1 1 62 6 6 12Returns >10% but <24% 16 15 15 16 17 18Returns >0 but <9% 36 45 2 15 24 16Losses >0 but <9% 21 22 3 16 13 6Losses >10% but <24% 8 17 16 6 6 7Losses >25% but <49% 0 1 0 5 1 2Losses >50% but <99% 0 0 0 0 0 0Losses >100% 0 0 0 0 0 0TOTAL 100 100 100 100 100 100
Cont'd/…

Gold D
erivatives: The M
arket View
185
SIX-MONTHLY RETURNS TO INVESTORS …/Cont'd
ALL FUNDS End Jun End Dec End Jun End Dec End Jun End Dec End Jun End Dec1998 1998 1999 1999 1998 1998 1999 1999
No data 1 1,160 120 69 1 529 674 865Returns >100% 53 157 893 6,670 5 9 16 93Returns >50% but <99% 581 1,578 6,980 21,171 14 43 52 179Returns >25% but <49% 13,274 12,898 43,972 39,185 77 155 276 236Returns >10% but <24% 59,408 30,929 54,517 32,902 282 266 564 344Returns >0 but <9% 144,360 41,272 13,390 28,788 543 303 250 225Losses >0 but <9% 12,172 14,317 1,454 8,546 144 147 70 173Losses >10% but <24% 5,114 10,410 289 7,588 74 125 35 103Losses >25% but <49% 2,237 5,447 54 474 34 77 14 28Losses >50% but <99% 128 787 76 8 7 34 1 5Losses >100% 70 60 0 0 7 3 0 0TOTAL 237,398 119,013 121,745 145,400 1,188 1,691 1,952 2,251
ALL FUNDS End Jun End Dec End Jun End Dec End Jun End Dec End Jun End DecPERCENT 1998 1998 1999 1999 1998 1998 1999 1999No data 0 1 0 0 0 31 35 38Returns >100% 0 0 1 5 0 1 1 4Returns >50% but <99% 0 1 6 15 1 3 3 8Returns >25% but <49% 6 11 36 27 6 9 14 10Returns >10% but <24% 25 26 45 23 24 16 29 15Returns >0 but <9% 61 35 11 20 46 18 13 10Losses >0 but <9% 5 12 1 6 12 9 4 8Losses >10% but <24% 2 9 0 5 6 7 2 5Losses >25% but <49% 1 5 0 0 3 5 1 1Losses >50% but <99% 0 1 0 0 1 2 0 0Losses >100% 0 0 0 0 1 0 0 0TOTAL 100 100 100 100 100 100 100 100
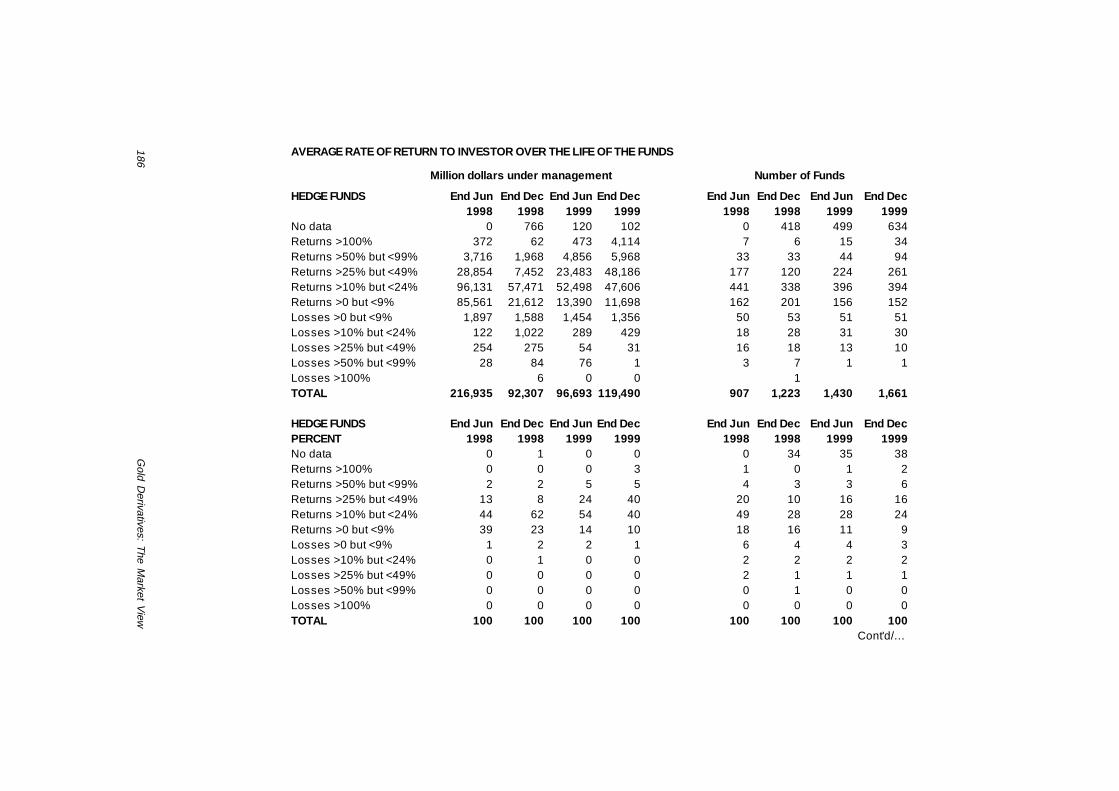
Gold D
erivatives: The M
arket View
186 AVERAGE RATE OF RETURN TO INVESTOR OVER THE LIFE OF THE FUNDS
Million dollars under management Number of Funds
HEDGE FUNDS End Jun End Dec End Jun End Dec End Jun End Dec End Jun End Dec1998 1998 1999 1999 1998 1998 1999 1999
No data 0 766 120 102 0 418 499 634Returns >100% 372 62 473 4,114 7 6 15 34Returns >50% but <99% 3,716 1,968 4,856 5,968 33 33 44 94Returns >25% but <49% 28,854 7,452 23,483 48,186 177 120 224 261Returns >10% but <24% 96,131 57,471 52,498 47,606 441 338 396 394Returns >0 but <9% 85,561 21,612 13,390 11,698 162 201 156 152Losses >0 but <9% 1,897 1,588 1,454 1,356 50 53 51 51Losses >10% but <24% 122 1,022 289 429 18 28 31 30Losses >25% but <49% 254 275 54 31 16 18 13 10Losses >50% but <99% 28 84 76 1 3 7 1 1Losses >100% 6 0 0 1TOTAL 216,935 92,307 96,693 119,490 907 1,223 1,430 1,661
HEDGE FUNDS End Jun End Dec End Jun End Dec End Jun End Dec End Jun End DecPERCENT 1998 1998 1999 1999 1998 1998 1999 1999No data 0 1 0 0 0 34 35 38Returns >100% 0 0 0 3 1 0 1 2Returns >50% but <99% 2 2 5 5 4 3 3 6Returns >25% but <49% 13 8 24 40 20 10 16 16Returns >10% but <24% 44 62 54 40 49 28 28 24Returns >0 but <9% 39 23 14 10 18 16 11 9Losses >0 but <9% 1 2 2 1 6 4 4 3Losses >10% but <24% 0 1 0 0 2 2 2 2Losses >25% but <49% 0 0 0 0 2 1 1 1Losses >50% but <99% 0 0 0 0 0 1 0 0Losses >100% 0 0 0 0 0 0 0 0TOTAL 100 100 100 100 100 100 100 100
Cont'd/…

Gold D
erivatives: The M
arket View
187
AVERAGE RATE OF RETURN TO INVESTOR OVER THE LIFE OF THE FUNDS …/Cont'd
CTAs End Jun End Dec End Jun End Dec End Jun End Dec End Jun End Dec1998 1998 1999 1999 1998 1998 1999 1999
No data 13 1,137 936 9 1 114 175 233Returns >100% 183 52 1 1 5 4 1 1Returns >50% but <99% 2,351 512 369 47 36 13 8 8Returns >25% but <49% 11,003 3,333 2,376 2,628 117 49 52 40Returns >10% but <24% 6,437 9,146 15,450 16,571 98 98 168 157Returns >0 but <9% 448 10,159 5,617 5,968 22 91 94 112Losses >0 but <9% 29 1,464 293 657 2 48 20 31Losses >10% but <24% 0 864 11 19 0 36 3 6Losses >25% but <49% 0 23 0 10 0 10 1 1Losses >50% but <99% 0 18 0 0 0 5 0 1Losses >100% 0 0 0 0TOTAL 20,464 26,706 25,053 25,910 281 468 522 590
CTAs End Jun End Dec End Jun End Dec End Jun End Dec End Jun End DecPERCENT 1998 1998 1999 1999 1998 1998 1999 1999No data 0 4 4 0 0 24 34 39Returns >100% 1 0 0 0 2 1 0 0Returns >50% but <99% 11 2 1 0 13 3 2 1Returns >25% but <49% 54 12 9 10 42 10 10 7Returns >10% but <24% 31 34 62 64 35 21 32 27Returns >0 but <9% 2 38 22 23 8 19 18 19Losses >0 but <9% 0 5 1 3 1 10 4 5Losses >10% but <24% 0 3 0 0 0 8 1 1Losses >25% but <49% 0 0 0 0 0 2 0 0Losses >50% but <99% 0 0 0 0 0 1 0 0Losses >100% 0 0 0 0 0 0 0 0TOTAL 100 100 100 100 100 100 100 100
Cont'd/…

Gold D
erivatives: The M
arket View
188 AVERAGE RATE OF RETURN TO INVESTOR OVER THE LIFE OF THE FUNDS …/Cont'd
GLOBAL MACROS End Jun End Dec End Jun End Dec End Jun End Dec End Jun End Dec1998 1998 1999 1999 1998 1998 1999 1999
No data 5,340 0 0 28 33 38Returns >100% 0 46 1,632 0 1 1Returns >50% but <99% 41 1,660 156 2 5 1Returns >25% but <49% 1,352 397 9,773 4 9 15Returns >10% but <24% 19,943 19,272 12,408 18 29 24Returns >0 but <9% 3,333 1,181 891 21 17 23Losses >0 but <9% 193 63 31 6 3 2Losses >10% but <24% 5 53 11 1 4 3Losses >25% but <49% 0 0 0 0 0 0Losses >50% but <99% 0 0 0 0 0 0Losses >100% 0 0 0 0 0 0TOTAL 0 30,207 22,672 24,902 80 101 107
GLOBAL MACROS End Jun End Dec End Jun End Dec End Jun End Dec End Jun End DecPERCENT 1998 1998 1999 1999 1998 1998 1999 1999No data 18 0 0 35 33 36Returns >100% 0 0 7 0 1 1Returns >50% but <99% 0 7 1 3 5 1Returns >25% but <49% 4 2 39 5 9 14Returns >10% but <24% 66 85 50 23 29 22Returns >0 but <9% 11 5 4 26 17 21Losses >0 but <9% 1 0 0 8 3 2Losses >10% but <24% 0 0 0 1 4 3Losses >25% but <49% 0 0 0 0 0 0Losses >50% but <99% 0 0 0 0 0 0Losses >100% 0 0 0 0 0 0TOTAL 100 100 100 100 100 100
Cont'd/…

Gold D
erivatives: The M
arket View
189
AVERAGE RATE OF RETURN TO INVESTOR OVER THE LIFE OF THE FUNDS …/Cont'd
ALL FUNDS End Jun End Dec End Jun End Dec End Jun End Dec End Jun End Dec1998 1998 1999 1999 1998 1998 1999 1999
No data 13 1,903 1,056 111 1 532 674 867Returns >100% 555 114 474 4,115 12 10 16 35Returns >50% but <99% 6,067 2,480 5,225 6,015 69 46 52 102Returns >25% but <49% 39,857 10,785 25,859 50,814 294 169 276 301Returns >10% but <24% 102,568 66,617 67,948 64,177 539 436 564 551Returns >0 but <9% 86,009 31,771 19,007 17,666 184 292 250 264Losses >0 but <9% 1,926 3,052 1,747 2,013 52 101 71 82Losses >10% but <24% 122 1,886 300 448 18 64 34 36Losses >25% but <49% 254 298 54 41 16 28 14 11Losses >50% but <99% 28 102 76 1 3 12 1 2Losses >100% 0 6 0 0 0 1 0 0TOTAL 237,399 119,013 121,746 145,400 1,188 1,691 1,952 2,251
ALL FUNDS End Jun End Dec End Jun End Dec End Jun End Dec End Jun End DecPERCENT 1998 1998 1999 1999 1998 1998 1999 1999No data 0 2 1 0 0 31 35 39Returns >100% 0 0 0 3 1 1 1 2Returns >50% but <99% 3 2 4 4 6 3 3 5Returns >25% but <49% 17 9 21 35 25 10 14 13Returns >10% but <24% 43 56 56 44 45 26 29 24Returns >0 but <9% 36 27 16 12 15 17 13 12Losses >0 but <9% 1 3 1 1 4 6 4 4Losses >10% but <24% 0 2 0 0 2 4 2 2Losses >25% but <49% 0 0 0 0 1 2 1 0Losses >50% but <99% 0 0 0 0 0 1 0 0Losses >100% 0 0 0 0 0 0 0 0TOTAL 100 100 100 100 100 100 100 100

Gold Derivatives: The Market View190
RED
EMP
TIO
N S
TATU
SM
n D
olla
rsN
umbe
r of
Fun
dsH
EDG
E FU
ND
SEn
d D
ecEn
d Ju
nEn
d D
ecEn
d D
ecEn
d Ju
nEn
d D
ec19
9819
9919
9919
9819
9919
99A
nn
ually
60
da
ys o
r gr
ea
ter
5,6
95
5,1
27
6,7
90
75
81
98
An
nua
lly le
ss
tha
n 6
0 d
ays
3,6
25
3,7
40
5,6
34
61
68
78
Se
mi-
an
nu
ally
gre
ate
r th
an
60
da
ys1
57
90
71
,54
91
62
22
8S
em
i-a
nn
ual
ly le
ss
tha
n 6
0 d
ays
3,1
25
1,3
90
6,5
61
56
67
83
Qu
art
erly
gre
ate
r th
an
60
da
ys4
,51
47
,10
45
,93
69
31
12
13
1Q
ua
rte
rly le
ss
tha
n 6
0 d
ays
38
,21
13
7,3
03
39
,41
03
37
39
64
68
Mo
nth
ly g
rea
ter
tha
n 6
0 d
ays
1,3
15
2,4
96
2,8
40
22
38
44
Mo
nth
ly le
ss
tha
n 6
0 d
ays
21
,50
22
0,0
40
28
,82
63
37
41
34
94
Bi-
mo
nth
ly 1
0 d
ays
' wa
it o
r le
ss
50
41
63
33
22
We
ekl
y g
rea
ter t
ha
n 7
da
ys5
79
10
87
19
46
6W
ee
kly
les
s th
an
7 d
ays
1,8
66
2,1
05
4,2
05
35
40
42
Da
ily 3
0 d
ays
1,3
03
87
1,2
92
49
13
Da
ily le
ss
tha
n 3
0 d
ays
1,1
64
1,0
92
1,9
76
12
98
Un
know
n9
,20
21
4,7
78
13
,72
01
68
16
71
66
Tota
l92
,307
96,6
9311
9,49
01,
223
1,43
016
61
HED
GE
FUN
DS
End
Dec
End
Jun
End
Dec
End
Dec
End
Jun
End
Dec
Per
cent
1998
1999
1999
1998
1999
1999
An
nua
lly 6
0 d
ays
or
gre
ate
r6
56
66
6A
nn
ually
les
s th
an
60
da
ys4
45
55
5S
em
i-a
nn
ual
ly g
rea
ter t
ha
n 6
0 d
ays
01
11
22
Se
mi-
an
nu
ally
les
s th
an
60
da
ys3
15
55
5Q
ua
rte
rly g
rea
ter
tha
n 6
0 d
ays
57
58
88
Qu
art
erly
les
s th
an
60
da
ys4
13
93
32
82
82
8M
on
thly
gre
ate
r th
an
60
da
ys1
32
23
3M
on
thly
les
s th
an
60
da
ys2
32
12
42
82
93
0B
i-m
on
thly
10
day
s' w
ait
or l
es
s0
00
00
0W
ee
kly
gre
ate
r th
an
7 d
ays
10
10
00
We
ekl
y le
ss
tha
n 7
da
ys2
24
33
3D
aily
30
da
ys1
01
01
1D
aily
les
s th
an
30
da
ys1
12
11
0U
nkn
own
10
15
11
14
12
10
Tota
l10
010
010
010
010
010
0C
on
t'd/…
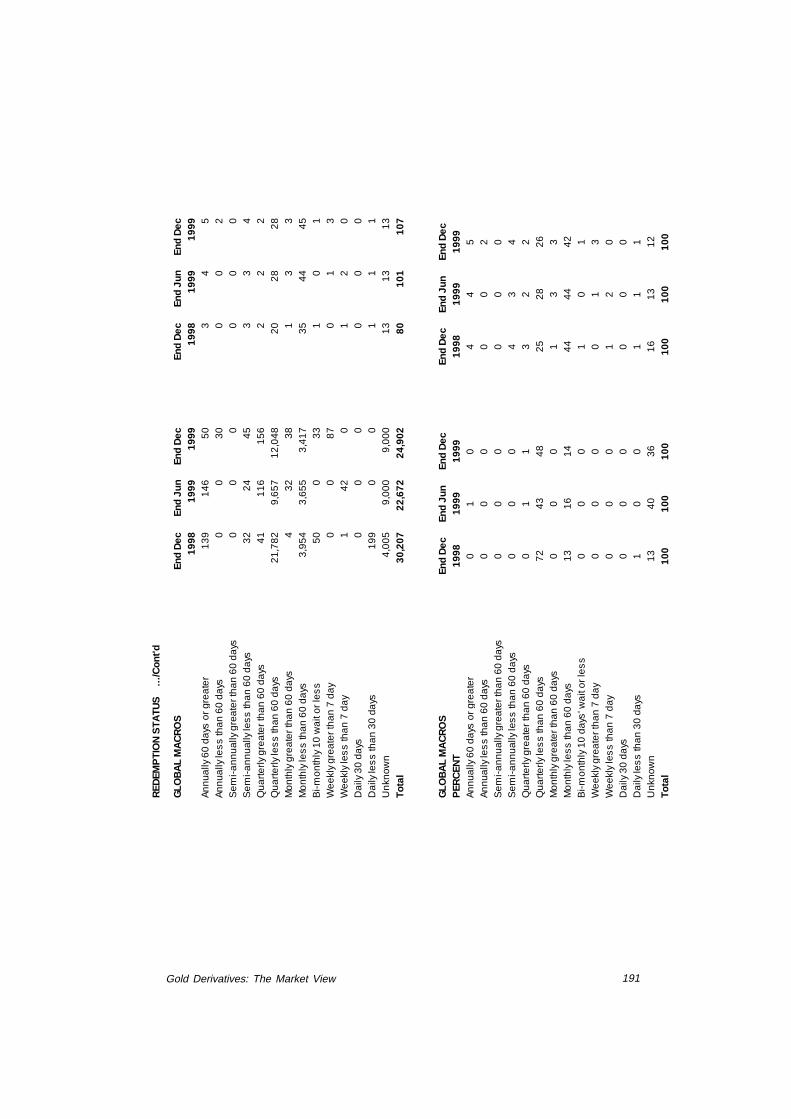
Gold Derivatives: The Market View 191
RED
EMP
TIO
N S
TATU
S
…/C
ont'd
GLO
BA
L M
AC
RO
SEn
d D
ecEn
d Ju
nEn
d D
ecEn
d D
ecEn
d Ju
nEn
d D
ec19
9819
9919
9919
9819
9919
99A
nn
ually
60
da
ys o
r gr
ea
ter
13
91
46
50
34
5A
nn
ually
les
s th
an
60
da
ys0
03
00
02
Se
mi-
an
nu
ally
gre
ate
r th
an
60
da
ys0
00
00
0S
em
i-a
nn
ual
ly le
ss
tha
n 6
0 d
ays
32
24
45
33
4Q
ua
rte
rly g
rea
ter
tha
n 6
0 d
ays
41
11
61
56
22
2Q
ua
rte
rly le
ss
tha
n 6
0 d
ays
21
,78
29
,65
71
2,0
48
20
28
28
Mo
nth
ly g
rea
ter
tha
n 6
0 d
ays
43
23
81
33
Mo
nth
ly le
ss
tha
n 6
0 d
ays
3,9
54
3,6
55
3,4
17
35
44
45
Bi-
mo
nth
ly 1
0 w
ait
or
les
s5
00
33
10
1W
ee
kly
gre
ate
r th
an
7 d
ay
00
87
01
3W
ee
kly
les
s th
an
7 d
ay
14
20
12
0D
aily
30
da
ys0
00
00
0D
aily
les
s th
an
30
da
ys1
99
00
11
1U
nkn
own
4,0
05
9,0
00
9,0
00
13
13
13
Tota
l30
,207
22,6
7224
,902
8010
110
7
GLO
BA
L M
AC
RO
SEn
d D
ecEn
d Ju
nEn
d D
ecEn
d D
ecEn
d Ju
nEn
d D
ecP
ERC
ENT
1998
1999
1999
1998
1999
1999
An
nua
lly 6
0 d
ays
or
gre
ate
r0
10
44
5A
nn
ually
les
s th
an
60
da
ys0
00
00
2S
em
i-a
nn
ual
ly g
rea
ter t
ha
n 6
0 d
ays
00
00
00
Se
mi-
an
nu
ally
les
s th
an
60
da
ys0
00
43
4Q
ua
rte
rly g
rea
ter
tha
n 6
0 d
ays
01
13
22
Qu
art
erly
les
s th
an
60
da
ys7
24
34
82
52
82
6M
on
thly
gre
ate
r th
an
60
da
ys0
00
13
3M
on
thly
les
s th
an
60
da
ys1
31
61
44
44
44
2B
i-m
on
thly
10
day
s' w
ait
or l
es
s0
00
10
1W
ee
kly
gre
ate
r th
an
7 d
ay
00
00
13
We
ekl
y le
ss
tha
n 7
da
y0
00
12
0D
aily
30
da
ys0
00
00
0D
aily
les
s th
an
30
da
ys1
00
11
1U
nkn
own
13
40
36
16
13
12
Tota
l10
010
010
010
010
010
0

Gold Derivatives: The Market View192
APPENDIX 5
Research methodology1. The lending market
Research approach:statistical and reiteratively interview-based
Data sources on official sector gold reserves and private lending:IMF: International Financial Statistics annually 1968 to presentVirtual Metals data bases covering quasi-official gold holdings, unpub-lished country reserves and estimates of above-ground stocks and privateinventories
Establishment of reserve/holdings data base then……Interviews conducted with commercial banks acting as lending counterpartiesfrom where lending by country was assessed then…Interviews conducted with official sector representatives involving presentationof initial lending estimates then…Interviews conducted with market participants specialising in the internationalconsignment business and physical/industrial/investment sector of the indus-try and assessment of their market shares then…Fine tuning of lending assessment.
2. Producer Hedging
Research approach:price risk management analysis, statistical questionnaires and one-on-onepersonal interviews
Data sources:Individual mining company co-operation, annual reports and 10K reports
Brook Hunt and Associates cost data
Assessment of the hedge book:Specific request for full hedging details to tenure and not simply averagerealised prices. Specific request for lease rate exposure to tenure. Full deltahedge analysis of each and every option strategy annually to tenure.
Non-hedge analysis:weighted average according to beneficial production.
Costs analysis:full mine-by-mine costs analysis of existing data.
Gold Derivatives: The Market View 193
3. The commercial banks
Research approach:statistical and reiteratively interview-based
Data sources:US Office of the Comptroller of the Currency (OCC) dataBank for International Settlements (BIS) dataVirtual Metals data bases
Initial establishment of commercial banking population then….Individual questionnaires and one-on-one interviews then….Initial assessment of market structure then ……..Analysis of the OCC and BIS turnover figures then …….Further discussions with market participants then….Fine tuning of assessments.
4. The hedge funds
Research approach:statistical and reiteratively interview-based
Data sources:Managed Account Reports (MAR )Bi-annual fund directories (CTAs and HedgeFunds)Commitment of Traders fortnightly reportsVirtual Metals data bases
Initial establishment of data base and data input then….Analysis of the 2,500-fund population including the isolation of global macrosfundsInterviews of market participants acting as counterparties then…Refinement of analysis.
Gold Derivatives: The Market View194
APPENDIX 6
THE SIGNATORIES
Oesterreichische NationalbankBanque Nationale de BelgiqueSuomen PankkiBanca d’ItaliaBanque Centrale du LuxembourgDe Nederlandsche BankBanque de FranceDeutsche BundesbankCentral Bank of IrelandBanco do PortugalBanco de EspañaSveriges RiksbankSchweizerische NationalbankBank of EnglandEuropean Central Bank
THE PRESS RELEASE
Press Communiqué - 26 September 1999Statement on Gold
In the interest of clarifying their intentions with respect to their gold holdings,the above institutions make the following statement:
1 Gold will remain an important element of global monetary reserves.
2 The above institutions will not enter the market as sellers, with the exceptionof already decided sales.
3 The gold sales already decided will be achieved through a concerted programmeof sales over the next five years. Annual sales will not exceed approximately 400tonnes and total sales over this period will not exceed 2,000 tonnes.
4 The signatories to this agreement have agreed not to expand their gold leasingsand their use of gold futures and options over this period.
5 This agreement will be reviewed after five years.
The Washington Agreement on Gold
Gold Derivatives: The Market View 195
No. 1 Derivative Markets and the Demand forGold by Terence F Martell and Adam F Gehr, Jr,April 1993
No. 2 The Changing Monetary Role of Goldby Robert Pringle, June 1993
No. 3 Utilizing Gold Backed Monetary and Fi-nancial Instruments to Assist Economic Re-form in the Former Soviet Union by Richard WRahn, July 1993
No. 4 The Changing Relationship BetweenGold and the Money Supply by Michael D Bordoand Anna J Schwartz, January 1994
No. 5 The Gold Borrowing Market - A Decadeof Growth by Ian Cox, March 1994
No. 6 Advantages of Liberalizing a Nation’sGold Market by Professor Jeffrey A Frankel,May 1994
No.7 The Liberalization of Turkey’s GoldMarketby Professor Ozer Ertuna, June 1994
No. 8 Prospects for the International MonetarySystem by Robert Mundell, October 1994
No. 9 The Management of Reserve AssetsSelected papers given at two conferences,1993
No. 10 Central Banking in the 1990s - AssetManagement and the Role of GoldSelected pa-pers given at a conference on November 1994
No. 11 Gold As a Commitment Mechanism:Past, Present and Futureby Michael D Bordo,January 1996
No. 12 Globalisation and Risk ManagementSelected papers from the Fourth City of LondonCentral Banking Conference, November 1995
No. 13. Trends in Reserve AssetManagementby Diederik Goedhuys and RobertPringle, September 1996
No. 14. The Gold Borrowing Market: RecentDevelopments by Ian Cox, November 1996.
WGC CENTRE FOR PUBLIC POLICY STUDIES
No. 15 Central Banking and The World’sFinancial System, Collected papers from the FifthCity of London Central Banking Conference, No-vember 1996
No. 16 Capital Adequacy Rules for Commodi-ties and Gold: New Market Constraint?by HelenB. Junz and Terrence F Martell, September 1997
No. 17 An Overview of Regulatory Barriers toThe World Gold Trade by Graham Bannock, AlanDoran and David Turnbull, November 1997
No. 18 Utilisation of Borrowed Gold by the Min-ing Industry; Development and Future Prospects,by Ian Cox and Ian Emsley, May 1998
No. 19 Trends in Gold Banking by Alan Doran,June 1998
No. 20 The IMF and Gold by Dick Ware, July1998
No. 21 The Swiss National Bank and ProposedGold Sales, October 1998
No. 22 Gold As A Store of Value by StephenHarmston, November 1998
No. 23 Central Bank Gold Reserves: An histori-cal perspective since 1845 by Timothy S Green,November 1999
Special Studies:
Switzerland’s Gold, April 1999
A Glittering Future? Gold mining’s importanceto sub-Saharan Africa and Heavily Indebted PoorCountries, June 1999
Proceedings of the Paris Conference “Gold andthe International Monetary System in a New Era”,May 2000
20 Questions About Switzerland’s Gold, June2000
Gold Derivatives: The Market View by JessicaCross, September 2000
Available from Centre for Public Policy Studies, World Gold Council, 45 Pall Mall, LondonSW1Y 5JG, UK. Tel + 44.(0)20.7930.5171, Fax + 44.(0)20.7839.6561. E-mail:[email protected] Website: www.gold.org

Gold Derivatives: The Market View196
Headquarters: UK45 Pall MallLondon SW1Y 5JG, UKTel. +44.(0)20.7930.5171Fax.+44.(0)20.7839.6561
Website:www.gold.org
Americas/EuropeRegional Office & USA444 Madison AvenueNew York, NY 10022Tel. +1 212.317.3800Fax. +1 212.688.0410
BrazilAvenida Paulista 1499Conj. 70601311-928 Sao PauloTel. +55.11.285.5628Fax. +55.11.285.0108
MexicoConsejo Mundial del OroAv. Reforma No. 382,Despacho 701,Col. JuarezDelagacion Cuauhtemoc06500 Mexico D.F.Tel/Fax +52.5.514.5757/2172
East AsiaRegional Office &Singapore6 Battery Road No. 24-02ASingapore 049909Tel. +65.227.2802Fax. +65.227.2798
China (Beijing Office)Room 1706, Scitech Tower22 Jian Guo Men Wai Da JieBeijing 100 004Tel. +861.0.6515.8811Fax. +861.0.6522.7587
China (Hong Kong)13th Floor, Printing House6 Duddell Street, CentralHong KongTel. +852.2521.0241Fax. +852.2810.6038
World Gold Council Offices
IndonesiaTamara Center Level 6, No 602Jl. Jenderal Sudirman Kav 24Jakarta 12920Tel. +62.21.520.3693/94/95Fax. +62.21.520.3699
MalaysiaMenara Dion No. 12-0527 Jalan Sultan Ismail50250 Kuala LumpurTel. +60.3.381.2881Fax. +60.3.381.2880
Thailand14th Floor, Thaniya Plaza,52 Silom Road, BangrakBangkok 10500Tel. +662.231.2486/7Fax. +662.231.2489
TaiwanRoom 808,205 Tun Hwa N. Road, TaipeiTel. +886.2251.47.400Fax +886.2251.47.466
VietnamNo 6 Phung Khac Khoan St, Room G7District 1, Ho Chi Minh CityTel. + 848 8256 653/654Fax + 848 8221 314
Japan/KoreaRegional Office &JapanShin Aoyama Building / W21F,1-1-1 Minami-AoyamaMinato-ku, Tokyo 107 0062Tel. +81.3.3402.4811Fax. +81.3.3403.2477
South Korea19th Floor, Young Poong Bldg.33, Seorin-dong, Jongro-kuSeoul 110 752Tel. +82.2.399.5377Fax. +82.2.399.5372
Middle EastRegional Office & UAEDubai World Trade CentreP.O. Box 9209 – Level 28Dubai, UAETel. +971.4.3314.500Fax. [email protected]
TurkeyMim Kemal Öke CaddesiDost Apt. 8/4Nisantasi, 80200 IstanbulTel. +90.212.225.1960/22Fax.+90.212.225.1913
IndiaRegional Office &Mumbai101, Maker Chamber VI10th fl., 220 Nariman PointMumbai 400 021Tel. +91.22.287.2955Tel. +91.22.204.8525Fax. +91.22.204.5613
India (Chennai Office)B-2 Alexander Square34/35 Sardar Patel RoadGuindyChennai 600 032Tel. +91.44.230.0083/0084Fax. +91.44.230.0086
India (New Delhi Office)47, Basant LokVasant ViharNew Delhi 110 057Tel. +91.11.614.9394/95Fax. +91.11.614.8281
China (Shanghai Office)Room 203B, Central PlaceNo. 16 He Nan Road (S)Shanghai, PRC 200 002Tel. +86.21.6355.10078/9Fax. +86.21.6355.1011
India (Calcutta Office)World Trade Center CalcuttaSomnath Building, 4th Floor8/1A, Sir William Jones SaraniCalcutta 700 016Tel. +91.33.249.4318Fax. +91.33.292.793


![Gold-Catalyzed Stereoselective Synthesis of Bicyclic ... · palladium-catalyzed synthesis of indole derivatives from ... [3.3.0]octenones via the intramolecular Pauson− Khand reaction](https://img.pdfslide.us/doc/110x75/5e4486c263ac1e4f051fa1d0/gold-catalyzed-stereoselective-synthesis-of-bicyclic-palladium-catalyzed-synthesis.jpg)