Embed Size (px)
Citation preview
UNIVERSITÀ DEGLI STUDI DI PADOVA
DIPARTIMENTO DI INGEGNERIA INDUSTRIALE
CORSO DI DOTTORATO IN: INGEGNERIA INDUSTRIALE
CURRICOLO: INGEGNERIA CHIMICA, MECCANICA E DEI MATERIALI
XXIX CICLO
GOLD ALLOYS: STUDY OF THE
MICROSTRUCTURAL, MECHANICAL
CHARACTERISTICS AND FINAL
OPTIMIZATION OF PRODUCTION
PARAMETERS FOR THE REALIZATION
OF FULL AND CABLE PIPE CHAINS
Direttore della Scuola : Ch.mo Prof. Paolo Colombo
Coordinatore d’indirizzo : Ch.mo Prof. Giovanni Meneghetti
Supervisore : Ch.mo Prof. Manuele Dabalà
Tutor Aziendale : Ing. Fabrizio Furlan
Dottorando : Claudio Cason
A.A. 2016/2017

ABSTRACT
The gold market is one of the major world markets and the Italian companies place the country as
one of the major players in this sector. However, the production in these companies is mostly based
on the use of artisan skills, without investing in research and studies about the production processes
of these materials. In fact, often the process depends on a "craft" way of working, in which the
technical and scientific knowledge are dictated more by experience than by a systematic scientific
approach. The international bibliography regarding the world of machining of gold alloys is not as
developed as in the case of other metal alloys (steels and aluminum alloys), in which the aesthetic
appearance is much less important than the functional aspect. The increase in the nationally and
internationally competitiveness caused a growing interest to the study of these materials and their
metallurgical properties, with the need to create more complex products that are able to maintaining
their extremely high quality. Many of the metallurgical concepts of other materials (in particular
face-centered cubic structure alloys) can be applied to gold alloys. However, the greatest variety in
composition, the well-defined standards in form, the mechanical and aesthetic properties that they
have to satisfy, made necessary the knowledge of mode and characteristics, with which the different
constituents influencing the machining, heat treatments and the final quality of the semi-finished
product.
In the first part of the thesis, the main properties of pure gold and gold alloys will be presented, with
a particular attention to the main jewelry production technologies and the main usage of gold in the
world market.
In first chapter the supply, demand and pricing of gold will be generally described to allow an easy
collocation of the information contained and the results explained in this thesis, in a larger context
such as the world gold market.
After, in chapter 2, will be described the main features of gold, which make its the most important
metal used for the production of precious artifacts. The attention will be focused mainly on the
electronic configuration of gold, and on the physical, optical, and crystallographic properties that
result from this.
In chapter 3, the aim is to introduce the metallurgical principles of alloying for improve particular
properties, such as strengthening, or for adjust other characteristics of gold alloys in order to meet
certain requirements. Will be introduced the industrial operations of casting, deformation, heat
treatment, and interesting using of innovative approaches to the goldsmith production.
Chapter 4 is an overview of the main technologies used in gold jewelry manufacture, the aim is to
give a more complete idea of the means of the term “jewelry”, and of the key role of a scientific
approach, or the scientific research, focused to improve and develop the industrial production
system.
The second part of this thesis summarizes the work carried out during the three-year Ph.D in
Industrial Engineering.
The objectives of the project are the determination of the relationships between the composition and
different properties of the gold alloys (the caratage, the color, the mechanical properties,…) used by
the goldsmith company in the different stage of the production cycle for the realization of full pipe
and cable chain. In particular will be studied the effect of the various constituents and their quantity
in the alloys, the mechanical properties and the weldability of these. The investigation will be
performed from the melting process, through different plastic deformation and annealing steps, until
the realization of the welded semi-finished product.
A further objective of the project is the study of the mechanisms of plastic deformation of the
different alloys used in the company, in order to optimize the processes of deformation and heat
treatments depending on the material used, the various alloying elements and the different
production cycles.
In chapter 5, will be briefly described the experimental apparatus used for the characterization of
the samples (taken from the whole production process in the goldsmith company FilK S.p.A.), in
the laboratories of the Department of Industrial Engineering of the Padua University.
In chapter 6, will be described the production cycle of the gold welding wires used to solder the
hollow gold chain produced. The effect of the microstructure and residual stresses on the corrosion
and mechanical properties will be discussed. The study will focus on the control of production
parameters in order to improve machinability of the gold wires and to increase their properties.
In chapter 7, a statistic analysis of some mechanical and compositional characteristics of gold alloy
wires will be reported. The purpose is to individuate an approximation of the possible existing
influences and relationships between these and the energy absorbed during deformation. The
properties that will be investigated are elongation, Young modulus, ultimate strength and the
concentration of gold.
In Chapter 8, the production processes of gold alloys plates will be described. The aim of this part
of thesis is to optimize the microstructure and the mechanical properties of the products, which,
successively, will be welded to an iron sheet to create the base for the final hollow chain products.
The parameters of production cycles and the intrinsic properties of the different gold alloys will be
studied, with particular attention to the stresses and the microstructures generated from the
subsequent deformation and annealing steps.
Finally, in chapter 9 the plating process will be analyzed, in order to define the influence of the
process parameters on the characteristics of the semi-finished products. Furthermore, different
ageing treatments for various gold alloy compositions will be described, the results will allow to
optimize time and temperature of the age-hardening treatments for the company’s gold alloys.
The whole production tests were performed, in collaboration with Ing. Fabrizio Furlan, in Filk
S.p.A., the goldsmith company partner of this collaboration and unique supplier of the material for
this research. The main part of the characterization of the different gold samples was carried out at
the metallurgy laboratories in the Department of Industrial Engineering, University of Padua, under
the supervision of prof. Manuele Dabalà and in collaboration with Ing. Luca Pezzato.
Some analyzes, especially the chemical etching of the specimens with different solutions of
cyanides, have been performed at other structure: in the laboratories of Progold S.p.A. in
collaboration with Ing. Daniele Maggian, Dr. Patrizio Sbornicchia and Dr. Valerio Doppio.
The obtained results allowed improving the workability of the gold alloys used by the company
with a reduction of the industrial wastes. The optimization of the production parameters, in the
different processes, allowed to increase the microstructural quality of the semi-finished products
with an improvement on the mechanical and metallurgical characteristics. A suitable control on the
production processes and, the optimization of the gold alloy’s compositions, allowed to increase the
constancy, the reproducibility of the results and the quality in the production of hollow and cable
pipe chains. The obtained results also have a scientific relevance that have allowed their
presentation in numerous national and international conferences and publication in scientific
journals as reported at the end of the thesis.

SOMMARIO
Il mercato orafo è uno dei principali mercati mondiali e l’insieme delle aziende italiane del settore
pongono il paese come uno dei maggiori attori in questo mercato. Tuttavia la produzione delle
aziende si è sempre avvalsa di conoscenze artigianali, senza investire nell’approfondimento
scientifico sistematico dei fenomeni che coinvolgono i processi produttivi di tali materiali. Infatti,
spesso le produzioni sono legate ad un modo di operare “artigianale” dove frequentemente le
produzioni sono legate a lavorazioni tradizionali nelle quali le conoscenze tecnico-scientifiche sono
dettate più dall’esperienza che da un approccio scientifico sistematico. Anche la bibliografia
internazionale legata al mondo delle lavorazioni delle leghe d’oro non è così sviluppata come nel
caso di altre leghe metalliche (ad esempio acciai e leghe di alluminio) in cui l’aspetto estetico,
peculiare nelle produzioni di metalli preziosi, è di gran lunga meno importante dell’aspetto
funzionale.
Si è riscontrata una necessità sempre maggiore di sviluppare un approccio scientifico allo studio
sistematico dei materiali e delle loro proprietà, causata da una sempre maggiore concorrenzialità sia
in ambito nazionale che soprattutto internazionale unita poi all’esigenza di creare manufatti sempre
più complessi che riescano a mantenere inalterata la loro qualità estremamente elevata.
Sebbene molti concetti della metallurgia di altri materiali (in particolare delle leghe a base cubica a
corpo centrato) possano essere applicati alle leghe d’oro, la grandissima varietà di composizione, la
necessità che i manufatti verifichino dei precisi standard riguardanti forme, proprietà meccaniche,
proprietà estetiche rendono necessario apprendere modalità e caratteristiche con le quali i diversi
costituenti influenzano le lavorazioni, i trattamenti termici e la qualità finale del semilavorato.
Nella prima parte di questa tesi, verranno presentate le principali proprietà dell’oro puro e delle sue
leghe, con particolare attenzione alle principali tecnologie di produzione per gioielleria e ai
principali utilizzi dell’oro nel mercato mondiale.
Nel primo capitolo verranno descritti, in modo generale, i significati di offerta, domanda e prezzo
dell’oro, al fine di permettere una semplice collocazione, delle informazioni e dei risultati contenuti
in questa tesi, in un contesto più ampio quale è quello del mercato mondiale dell’oro.
Successivamente, nel capitolo 2, verranno descritte le principali caratteristiche dell’oro, che lo
rendono il metallo più importante per la produzione di manufatti preziosi. L’attenzione sarà
concentrata, principalmente, sulla configurazione elettronica dell’oro e sulle proprietà fisiche,
ottiche e cristallografiche che ne derivano.
Nel capitolo 3, l’obiettivo è di introdurre i principi metallurgici dell’alligazione volta a migliorare
particolari proprietà come la resistenza meccanica o per regolare altre caratteristiche delle leghe
d’oro al fine di soddisfare particolari requisiti. Verranno introdotte le operazioni industriali di
fusione, deformazione, trattamento termico e interessanti utilizzi di innovativi approcci alla
produzione orafa.
Il capitolo 4 è una panoramica delle più importanti tecnologie usate nel mondo della produzione di
gioielli in oro, lo scopo è di dare un’idea più completa del termine “gioielleria”, e del ruolo chiave
di un approccio scientifico, o di una ricerca scientifica, focalizzato al miglioramento e lo sviluppo
del sistema produttivo industriale.
La seconda parte di questa tesi riassume il lavoro svolto durante i tre anni di dottorato in Ingegneria
Industriale.
Obiettivi del progetto sono la determinazione delle relazioni tra composizione e proprietà (titolo e
colore) e caratteristiche meccaniche delle leghe utilizzate in azienda nelle diverse fasi del ciclo
produttivo per la realizzazione di catene in tubo pieno e cavo. In particolare verrà studiato l’effetto
dei diversi costituenti, e la loro quantità in lega, che provocano una modifica del colore delle leghe,
delle caratteristiche meccaniche e della saldabilità di queste a partire dal processo di fusione fino
alla realizzazione del semilavorato saldato. Ulteriore obiettivo del progetto è lo studio dei
meccanismi di deformazione plastica delle diverse leghe utilizzate in azienda al fine di ottimizzare i
processi di deformazione e di trattamento termico a seconda del materiale utilizzato, dei diversi
elementi alliganti e dei diversi cicli di produzione.
Nel capitolo 5, verrà brevemente descritto l’apparato sperimentale usato per la caratterizzazione dei
campioni (prelevati dall’intero processo produttivo nell’azienda orafa Filk S.p.A.), nei laboratori del
Dipartimento di Ingegneria Industriale dell’Università di Padova.
Nel capitolo 6, verrà illustrato il ciclo di produzione dei fili d’oro per saldatura usati per saldare tra
loro gli anelli delle catene d’oro vuote prodotte. Verrà descritto l’effetto della microstruttura e delle
tensioni residue sulle proprietà di resistenza alla corrosione e meccaniche. Lo studio sarà focalizzato
sul controllo dei parametri di produzione al fine di aumentare la lavorabilità dei fili d’oro e di
incrementarne le proprietà.
Nel capitolo 7, sarà riportata l’analisi statistica di alcune proprietà meccaniche e composizionali dei
fili in lega d’oro. L’obiettivo è di individuare un’approssimazione della possibile influenza e
relazione esistente tra queste e l’energia assorbita durante il processo deformativo. Le proprietà che
verranno analizzate sono l’allungamento, il modulo di Young, la resistenza a rottura e la
concentrazione d’oro.
Nel capitolo 8, verrà descritto il processo produttivo delle lamine in lega d’oro. Lo scopo di questa
parte di tesi è volto ad ottimizzare la microstruttura e le proprietà meccaniche dei prodotti, che,
successivamente, verranno saldati ad una lamina di ferro per creare la base delle catene vuote finali.
Verranno studiati i parametri dei cicli produttivi e le proprietà intrinseche delle diverse leghe d’oro,
con particolare attenzione agli stress e alle microstrutture generati attraverso il susseguirsi di step
deformativi e di ricottura.
Infine nel capitolo 9 verrà analizzato il processo di placcatura, al fine di definire l’influenza dei
parametri di processo sulle caratteristiche dei prodotti semi-finiti. Inoltre, verranno descritti diversi
trattamenti di indurimento per varie composizioni di lega d’oro, i risultati ottenuti permetteranno di
ottimizzare tempi e temperature dei trattamenti di indurimento per invecchiamento per le leghe
d’oro utilizzate dall’azienda.
Tutti i test produttivi sono stati effettuati, con la collaborazione dell’Ing. Fabrizio Furlan, presso
Filk S.p.A., l’azienda orafa partner di questa collaborazione e unico fornitore di materiale per la
ricerca. Gran parte della caratterizzazione dei diversi campioni è stata effettuata presso i laboratori
metallurgici del Dipartimento di Ingegneria Industriale, dell’università di Padova, sotto la
supervisione del prof. Manuele Dabalà e con la collaborazione dell’Ing. Luca Pezzato.
Alcune analisi, specialmente l’attacco chimico sui campioni con differenti soluzioni di cianuri, sono
state effettuate presso un’altra struttura: nei laboratori di Progold S.p.A. con la collaborazione
dell’Ing. Daniele Maggian, il Dr. Patrizio Sbornicchia e il Dr. Valerio Doppio.
I risultati ottenuti hanno permesso di migliorare la lavorabilità delle leghe d’oro usate dall’azienda
con una riduzione degli scarti di produzione. L’ottimizzazione dei parametri produttivi, nei diversi
processi, ha permesso di aumentare la qualità microstrutturale dei prodotti semi-finiti con un
miglioramento delle caratteristiche meccaniche e metallurgiche. Un opportuno controllo dei
processi produttivi e, l’ottimizzazione delle composizioni delle leghe d’oro, hanno permesso di
aumentare la costanza, la riproducibilità dei risultati e la qualità nella produzione di catene piene e
vuote. I risultati ottenuti presentano inoltre una rilevanza scientifica tale da averne permesso la
presentazione in numerosi convegni nazionali e internazionali e la pubblicazione in riviste
scientifiche di settore come riportato nell'elenco delle pubblicazioni che conclude questo lavoro di
tesi.

LIST OF CONTENTS
SOMMARIO .............................................................................................. VII
Chapter 1 ....................................................................................................... 6
Supply and Demand of Gold ....................................................................... 6
1.1 INTRODUCTION ................................................................................................................................. 6
1.2 GOLD PRICE ........................................................................................................................................ 7
1.3 ABOVEGROUND STOCKS ................................................................................................................ 8
1.3.1 Scrap .................................................................................................................................. 8
1.3.2 Central Banks ................................................................................................................... 9
1.4 JEWELRY ............................................................................................................................................. 9
1.5 OTHER FABRICATION ................................................................................................................... 10
Chapter 2 ..................................................................................................... 12
Physical and Optical Properties of Gold ................................................... 12
2.1 INTRODUCTION ............................................................................................................................... 12
2.2 ELECTRONIC STRUCTURE OF GOLD ....................................................................................... 12
2.3 CRYSTAL STRUCTURE AND ALLOYING BEHAVIOR ........................................................... 13
2.4 OPTICAL PROPERTIES .................................................................................................................. 14
2.5 PHYSICAL PROPERTIES ................................................................................................................ 17
Chapter 3 ..................................................................................................... 20
Metallurgy of Gold ..................................................................................... 20
3.1 INTRODUCTION ............................................................................................................................... 20
3.2 GRAIN REFINEMENT ...................................................................................................................... 23
3.2.1 Solidification ................................................................................................................... 24
3.2.2 Recrystallization during Annealing and after Cold-Working ....................................... 24
3.3 STRENGTH AND DUCTILITY ........................................................................................................ 26
3.3.1 Mechanisms .................................................................................................................... 26
3.3.2 Precipitation Hardening ................................................................................................. 28
3.3.3 Solid Solution Hardening ............................................................................................... 36
3.3.4 Dispersion Hardening .................................................................................................... 37
3.3.5 Disorder-order Transformation Hardening .................................................................. 38
3.4 COLOR OF GOLD ALLOYS ............................................................................................................ 41
3.4.1. Yellow to Reddish, Greenish and Whitish..................................................................... 41
3.4.2 White Gold ...................................................................................................................... 42
3.4.3 Special Color of Gold...................................................................................................... 43
3.4.4 Thermal properties: Wetting, Fluidity and Other .......................................................... 44
Chapter 4 ..................................................................................................... 46
The Technology of Jewelry Manufacturing .............................................. 46
4.1 INTRODUCTION ............................................................................................................................... 46
4.2 CURRENT MANUFACTURE ........................................................................................................... 46
4.3 MAIN JEWELRY TECHNOLOGIES .............................................................................................. 47
4.3.1 Cold Forming Technologies ........................................................................................... 48
4.3.2 Electroforming ................................................................................................................ 49
4.3.3 Investment Casting ......................................................................................................... 50
4.3.4 Hollow-ware .................................................................................................................... 53
4.3.5 Chain-making ................................................................................................................. 54
4.3.6 Joining Techniques ........................................................................................................ 55
4.3.7 Finishing ......................................................................................................................... 57
4.3.8 Manufacture of rings ...................................................................................................... 57
4.4 OTHER TECHNOLOGIES ............................................................................................................... 58
Chapter 5 ..................................................................................................... 62
Characterization System ............................................................................ 62
Chapter 6 ..................................................................................................... 70
Study of gold-welding alloy wires: Effect of Production Parameters on
Microstructure and Properties .................................................................. 70
6.1 INTRODUCTION ............................................................................................................................... 70
6.2 EXPERIMENTAL PROCEDURE .................................................................................................... 71
6.3 RESULTS AND DISCUSSION .......................................................................................................... 72
6.3.1 9 Kt Gold Welding Alloy ................................................................................................. 73
6.3.2 10 Kt Gold Welding Alloy ............................................................................................... 75
6.3.3 14 Kt Gold Welding Alloy ............................................................................................... 78
6.3.4 18 Kt Gold Welding Alloy ............................................................................................... 83
6.3.5 Residual stresses and corrosion resistance tests ............................................................ 86
6.3.6 Concluding Remarks ...................................................................................................... 91
Chapter 7 ..................................................................................................... 94
Statistical Analysis on a Mechanical Tests Dataset of Gold Alloy Wires 94
Chapter 8 ................................................................................................... 102
Study of 10 Kt Gold Alloys Used in Cable Chain Industrial Production Processes
................................................................................................................... 102
8.1 INTRODUCTION ............................................................................................................................. 102
8.2 EXPERIMENTAL PROCEDURE .................................................................................................. 102
8.3 RESULTS AND DISCUSSION ........................................................................................................ 105
8.4 CONCLUDING REMARKS ............................................................................................................ 115
Chapter 9 ................................................................................................... 116
Study of Plating Process and Ageing Treatments for the Production of Hollow
Gold Chains .............................................................................................. 116
9.1 PLATING PROCESS ....................................................................................................................... 116
9.1.1 Introduction .................................................................................................................. 116
9.1.2 Results and Discussion ................................................................................................. 118
9.1.3 Concluding Remarks .................................................................................................... 121
9.2 AGE-HARDENING TREATMENTS ............................................................................................. 123
9.2.1 Introduction .................................................................................................................. 123
9.2.2 Results and Discussion ................................................................................................. 123
9.2.3 Concluding Remarks .................................................................................................... 133
CONCLUSIONS ...................................................................................... 136
REFERENCES ......................................................................................... 140

Supply and Demand of Gold | Chapter 1 6
Chapter 1
Supply and Demand of Gold
1.1 INTRODUCTION
All the gold diffused in the world comes essentially from two different sources, the new mine
production and previously mined metal or aboveground stocked in various forms. In recent decades,
the main of the two sources was the new mine production, which provides the bigger part of the
total supply of gold to the market. The annual production has exploded from about 1,000 tonnes in
1980 to 2,645 tonnes in 2001, but recently this trend has fallen down. The greatest amount of
supply from the aboveground stocks derives from the recycled part of metal contained in
manufactured products, mainly comes from jewelry. Other fields of supply from aboveground
stocks include hedging by mining companies, disinvestment from private holdings and sales by
central banks. Hedging by the companies is, substantially, equal to selling the future production at
current price. This was a big source of supply in the 1980s and 1990s, but in the last years, good
sentiment about prices has resulted in a change of these actions.
Analyzing now the demand for gold, it’s possible to individuate the greatest portion of this on
jewelry manufacture. As for the supply, also for the demand is possible to define two distinct
categories. The first regards the industrialized world, where jewels and adornments are the most
important buying motive. The second category concerns the developing world, where investments
motives dominate. Whereas the buying of jewelry productions are not that responsive to the price of
gold, the second category is typically sensitive to price oscillations. Driven by market rising,
population growth, and special gold price conditions, the demand for jewelry production reached
the top in the 1980s-90s. However, some structural changes of the market, the coming of other
applications and uses (e.g. electronics) and the rise in gold prices reduced the total impact of gold
jewelry on the scene. The fabrication demand is covered, moreover, by dentistry and decorative
uses, plating uses, coins production etc.
Investment in gold essentially consists on buying gold coins or bars by people or a large number of
options, futures, dealings or share in exchange-traded funds. It is impossible to define the exact
impact of these activities but they contribute to the total equilibrium of the supply and demand
market.
The final aspect regards the price of gold. Usually, a deficit of supply means of a rising of the price
while surpluses will drive to the opposite result. The precious metals market is different, a surplus
Supply and Demand of Gold | Chapter 1 7
translates into an addition to stocks, which influences the investments and usually follow the rising
prices. Selling from the investors (during the fall of the prices), is necessary to link the deficit to the
main market.
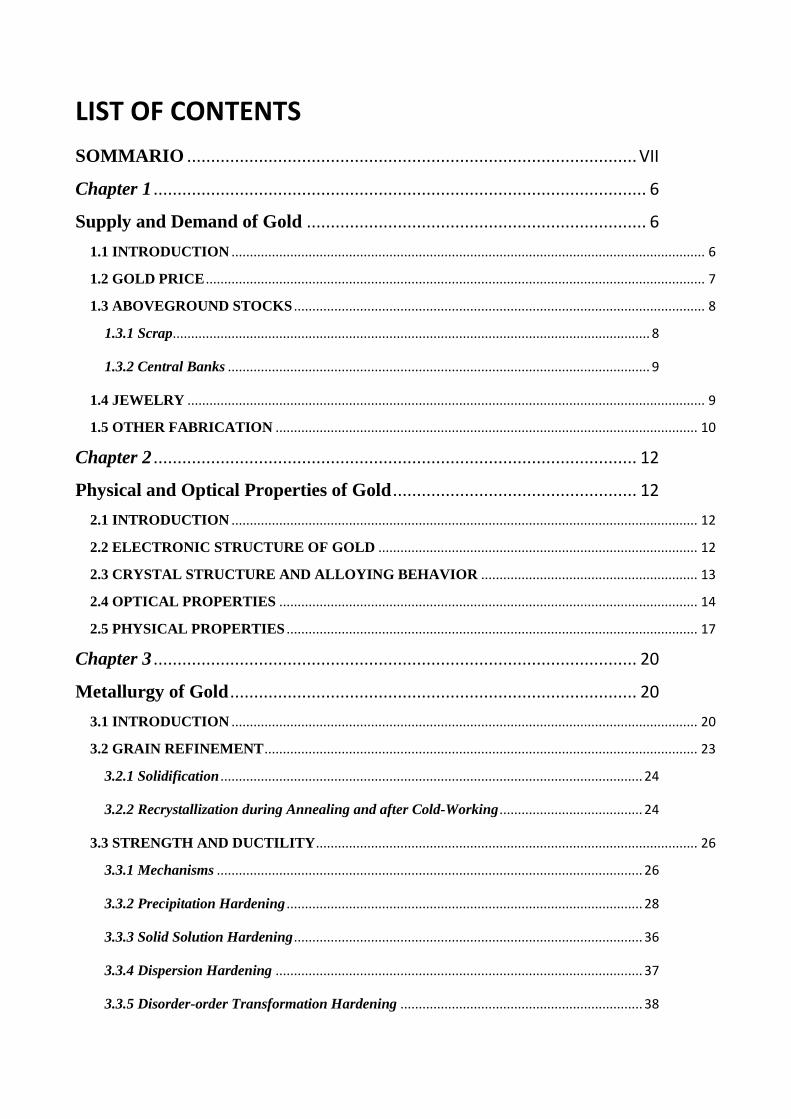
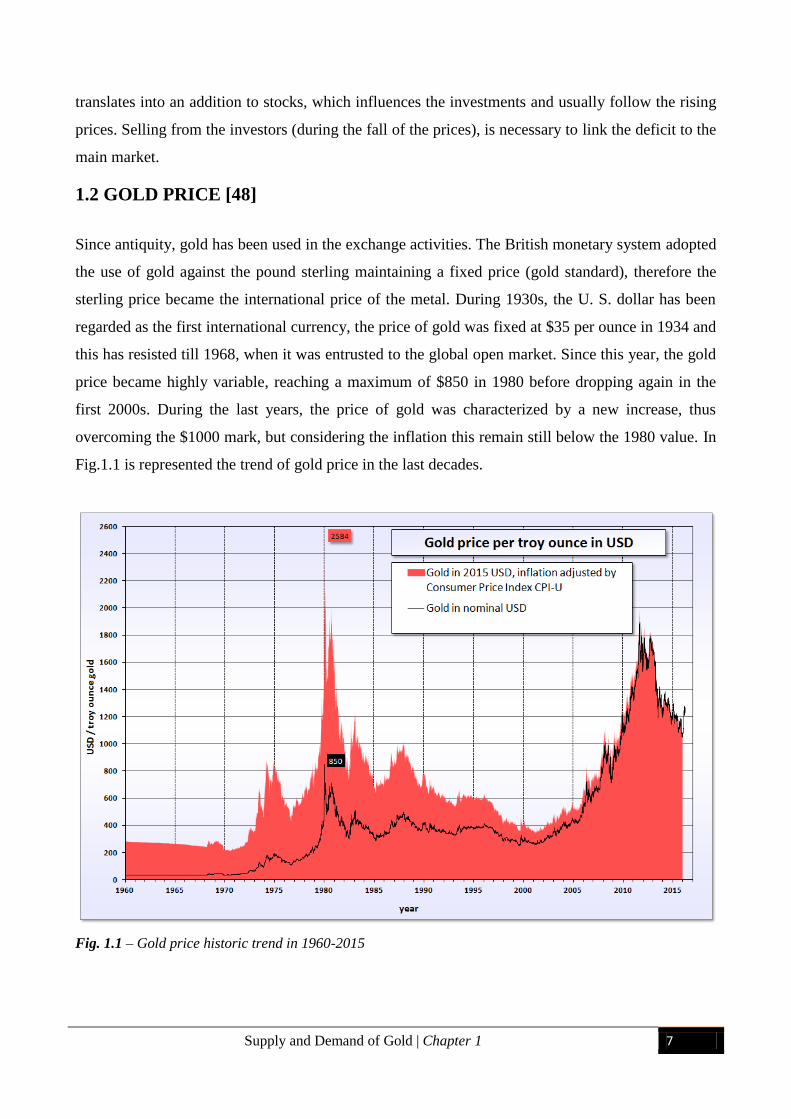
1.2 GOLD PRICE [48]
Since antiquity, gold has been used in the exchange activities. The British monetary system adopted
the use of gold against the pound sterling maintaining a fixed price (gold standard), therefore the
sterling price became the international price of the metal. During 1930s, the U. S. dollar has been
regarded as the first international currency, the price of gold was fixed at $35 per ounce in 1934 and
this has resisted till 1968, when it was entrusted to the global open market. Since this year, the gold
price became highly variable, reaching a maximum of $850 in 1980 before dropping again in the
first 2000s. During the last years, the price of gold was characterized by a new increase, thus
overcoming the $1000 mark, but considering the inflation this remain still below the 1980 value. In
Fig.1.1 is represented the trend of gold price in the last decades.
Fig. 1.1 – Gold price historic trend in 1960-2015
Supply and Demand of Gold | Chapter 1 8
Since 1919, the London Fix is the primary reference price for gold, set by the members of the
London Bullion Market Association. The currency fluctuations may have a considerable impact on
the global market, producing different and divergent price trends within individual nations, although
the international gold price is set in U.S. dollars. A close link between gold price and other
industries exist, where the main is the correlation between the U.S. dollar and gold. Usually there is
an increase in the value of gold in conjunction with a decline in the purchasing power of the U.S.
dollar and vice versa. Also other precious metals, as platinum and silver, change their value with the
gold market; or even oil is linked with its trend. In a time of politically and geographic tensions,
when the price of oil increase, the appeal of gold investments is sold as a safe choice. The last bond
of note is whit the stock market. Here, vice versa, during the period of boom, the investors move
money from gold investments to equities.
1.3 ABOVEGROUND STOCKS
The recycling of all the industrial products and the displacement of ingots stocks are the main
aboveground sources of gold, in addition to the extracted one. In the last year this type of supply has
accounted for about 1/3 of total supply, certain estimates have suggested that these aboveground
stocks amounted to about 150000 tons in the mid-2000s. Is this large quantity of aboveground
stocks, which differs the gold market from the other precious metals. The whole gold extracted,
until to date, also exist in various forms, due to its virtual characteristic of indestructibility. Ingot is
the primary useful form for the return of gold into the market from the aboveground stocks; half of
this bullion is held by banks, the other part by institutions and private individuals. About 75000 tons
of aboveground stocks are held by jewelry products, the remaining part consists in other types of
fabrication and includes, also, items containing gold lost or untraceable.
1.3.1 Scrap
Exist two types of gold wastes: the old scrap and the process scrap. The first, is the metal recovered
from final products containing gold. The greater part coming from jewelry, although small amounts
derive from other areas such as dental alloys or electronics. Old scrap is the largest source of
supply, after mining, and it covers, for about a quarter, the total supply. In presence of a financial
crisis, individuals sell their gold stocks inducing a phenomenon called dishoarding, although the
first reason remains the volatility of the gold price. A change in the fashion trends or, for example, a
recession, could prime an increase in scrap from producers until retailers, which are obliged to melt
Supply and Demand of Gold | Chapter 1 9
unsold items. Usually, the old scrap is reused in the same market where it was inserted at the
beginning but, sometimes, it is exported to other areas (such as Swiss refineries) when it exceeds
the local industry needs.
The process scrap, instead, concerns that never result in a finished product. For example, the edges
of a metal plate after the shearing process, the powder or filings recovered from the polishing or
finishing processes, or even coins stamped incorrectly.
1.3.2 Central Banks
Once, gold was the dominant asset in the central banks stocks strongly linked to the dollar. But,
with the dismantling of the gold standard in 1932 and, subsequently, other modifies, the gold price
was allowed to vary freely with the different markets. The use of gold billion stocks allows to create
a public confidence in the banks, and an idea of economic e financial security. The interest of the
banks is also to generate income by lending of its gold ingots. The greatest holdings are in the
Western world, while Japan, China and Taiwan, whose gold reserves are lower relative to other
currencies, come after. The international gold market is provided, largely, by the official sector and
the European banks have played an important role covering about 20% of the total annual supply.
1.4 JEWELRY
In jewelry, usually, gold is described in terms of karat that is a measure of purity of gold, defined as
part per 24. This excludes, e.g., all the articles which have a brass base and are plated with a gold
coating. Pure gold exists in 24-karat form but the highest caratage commercialized is 22-karat, but
this karat is mainly used in India. Other karat forms are: 21-karat, in the Middle East markets; 18-
karat, in Southern Europe; 14-kt gold; and the lowest 8, 9, 10 karat forms are instead used in North
America and in Northern Europe. Usually, the highest carat grades are bought only for economical
investment [1].
The purchase of jewelry items is driven by fashion trends. 18-karat jewelry is the standard used in
areas such as southern Europe to create high quality items, which can mount some precious stones
as diamonds or other. This work is possible due to the particular concentration of gold in the alloy,
in this way we are able to ensure a solid and sufficiently hard base to hold gems and to guarantee a
permanent color over time. Is easy to find adornments in 18-karat gold alloy named “white gold”,
the addition of elements like palladium or nickel can mask and move the color of the piece from the
classic yellow to white.
Supply and Demand of Gold | Chapter 1 10
Recently, fine jewelry has been blended with costume jewelry. A gold pendant or any other
precious items could be found not only on a gold chain but, also, on a leather cord. Few grams of
gold could be found also on steel or brass items, such products allow to raise higher markups over
the real value of the gold content. In the industrialized markets, the segmentation of consumer
spending cut the amount of money spent on gold and jewelry, moreover, the greater marketing
helped other consumer goods. This would lead to assert that the amount of gold sold in form of
jewelry will tend to a continuous decrease, which it’s real considering the industrialized world but
contrasts with the result obtained from the developing world. In these countries the economic
growth has led to the opening markets, India became the largest consumer of gold followed by
China and United States (in third position due to the recent crisis). In the global ranking of the
jewelry production Italy claims fourth position, penalized by the structural change and market share
loss. Although jewelry is the largest consumption of the yellow metal, accounting for about two-
thirds of the total demand, often plays a minor role compared to investment. This last factor is the
most important in the determination of the gold price due to its price sensitivity. The purchase of
gold items varies depending on gold price and on balance between supply and demand.
1.5 OTHER FABRICATION
Jewelry is not the only field of application of gold. Other form of fabrication like electronics, dental
alloys and decorative plating account for approximately 15% of total gold demand. Gold is used to
isolate the plating of contacts with the aim to guarantee the corrosion resistance and for its ability to
be drawn into thin wires. Regarding the use of gold in dental alloys, although the world population
and standards of living are rising, gold dental demand decreased in the last years. Probably due to
the substitution with other non-precious metals or with ceramic fitments. One of the main
decorative uses of gold is the plating of costume jewelry and the clasps, buckles, and so forth of
luxury accessories such as belts or handbags. Lastly, gold is used in coins, whether official or
unofficial, and medals. Official coins are best categorized as a form of investment, unofficial coins
and medals are often bought for various reasons such as for gifts or commemorative tokens,
although an investment rationale will often still come into play to varying degrees.

Supply and Demand of Gold | Chapter 1 11
Physical and Optical Properties of Gold | Chapter 2 12
Chapter 2
Physical and Optical Properties of Gold
2.1 INTRODUCTION
Gold was one of the first metals used by humans because of its particular characteristics: high
malleability, considerable density (19.32 g/cm3), excellent corrosion resistance and a shiny metallic
yellow color. Gold occupies the position 79 in the periodic table and also other elements close to it
present similar properties but, its special electronics configuration, explains the interest regarding
the coexistent of these characteristics. The electronic configuration controls the optical properties,
chemical reactivity and crystal structure of an element. Gold, being a heavy element, has other
attributes like: a large number of isotopes or its opacity to x-rays which ensures that it interacts
strongly with electrons in both scanning and transmission electron microscopy. Both of these
characteristics allowed using gold in different technological applications [2-3].
2.2 ELECTRONIC STRUCTURE OF GOLD [48]
Elemental gold, normally, is free of an oxide coating. This considerable corrosion resistance is a
result of its high first ionization potential, 9.2 eV, high compared to those of silver and copper (7.6
and 7.7). Gold has the electronic configuration [Xe]4f145d106s1. The 4f electrons shield the other
orbital electrons from the nuclear charge; this effect is called lanthanide contraction. This
phenomenon causes the atomic radius of the lanthanides to decrease across the period as the quality
of the shielding per electron decreases; in the 5d metal series this effect gives similar lattice
constants to the 4d metals. The position of gold on the periodic table make it unique, because to this
lanthanide contraction effect are added also some relativistic effects [4]. With the increase of the
atomic number, the velocity of the 1s electrons approaches the speed of light. The increase in mass
of these electrons causes the contraction of their orbital toward the nucleus. The higher s and p
orbitals also contract trying to compensate this phenomenon resulting finally in the outermost 6s
and 6p orbitals being smaller than they would otherwise have been without relativistic effects. The
5d and 5f electrons are more shielded from the nucleus due to the contraction of the s and p orbitals.
Not having a high electron density approximately to it, are less susceptible to relativistic effects of
their own, destabilizing and expanding outward with an associated increase in energy [5]. It was
discussed how the stabilization of the 6s orbitals made up the first ionization potential of gold,
Physical and Optical Properties of Gold | Chapter 2 13
unlike the second and third ionization potential that follow the opposite trend. The oxidation states
as +I, +II, +III are easily accessible, and +V state have been reported only for few compounds. The
relativistic effect causes the shortening of the covalent bond lengths in several gold molecules,
compared to the same Ag compounds. This characterizes the molecules Au-X+, while the
contraction is smaller for the compounds Au+X-; the 6s orbital’s contraction plenty reduces the
dimension of the Au- ion while the expansion of the 5d orbital increases the size of the Au+ ion [6].
Another non-negligible effect is the “aurophilicity” of gold, used to describe the interaction between
the electrons of nonvalence orbitals, which generates unusual system bonding due to the small
energy gap of the 5d and 6s electrons. The normal 5d10 configuration it is easily broken by the
hybridization of the s-d orbitals [7].
2.3 CRYSTAL STRUCTURE AND ALLOYING BEHAVIOR
Gold, as other ductile metallic elements ( Al, Ag, Cu,…), is characterized by a face-centered cubic
crystal (f.c.c.) structure in its metallic form. One of the anomalies that distinguishes gold from other
fcc metals is the possibility to easily reconstruct all the three high symmetry planes, included the
(111), probably due to relativistic effects. The surface tension of liquid Au is approximately 1.1 to
1.2 J/m2, increased by allowing with Cu and, vice versa, lowered with Ag or Zn [8]. The crystal
structure of gold, with a multiplicity of close-packed planes on which slip can occur, makes it more
ductile in comparison to iron or tungsten with their bcc structure, or Mg and Zn with their
hexagonal structure. Referring to gold nanoparticles, instead, under 10 nm the fcc structure isn’t the
most stable but decahedral, icosahedral or defectives in structures are formed [9].
Some characteristics, like the electronegativity and the difference in atomic radius, limit the range
of solid solutions that gold forms with other elements. Au-Ni, Au-Cu, Au-Pt and Au-Pd systems
form solid solutions at high temperatures, but their mutual solubility decreases as the temperature
drops [10]. Gold forms with other elements a wide range of intermetallic compounds, for example,
AuAl2, AuIn2 or AuGa2 have a well defined color due to their reflectance minimum in the visible
part of the spectrum. This low energy behavior is caused by the presence of several bands of
conduction electrons, in agreement with Fermi surface studies, and a developed secondary band
edge in the visible [11]. Unfortunately, the fragility of these intermetallic compounds limits their
commercial application in jewelry production.
Physical and Optical Properties of Gold | Chapter 2 14
2.4 OPTICAL PROPERTIES
The frequency-dependent permittivity or dielectric constant can describe the optical properties of all
linear optical materials:
𝜀 = 𝜀1 + 𝑖𝜀2 (2.1)
Related to the complex refractive index by
𝑚 = 𝑛 + 𝑖𝑘 = √𝜀 (2.2)
Usually the permittivity of metals is modeled using a Drude-like function of the form:
𝜀1(𝜔) = 𝜀∞ − 𝜔𝑝
2
𝜔2+ 𝛾2, 𝜀2(𝜔) = 𝜀∞ − 𝜔𝑝
2𝛾
𝜔(𝜔2+ 𝛾2) (2.3)
𝛾 = 1
𝜏 (2.4)
where ε∞ is the real part of permittivity at high frequency, ωp is the bulk plasma frequency, γ is the
damping constant, inversely proportional to the relaxation time, τ, dependent on the individual
electron scattering events [12].
So, physics and optical properties of gold are:
𝑛 = √1
2(√𝜀1
2 + 𝜀22 + 𝜀1), 𝑘 = √
1
2(√𝜀1
2 + 𝜀22 − 𝜀1), (2.5)
𝜀1 = 𝑛2 − 𝑘2 , 𝜀2 = 2𝑛𝑘 (2.6)
The defined band edge at about 2.4 eV (in the field of green light – 500 nm) gives a strong yellow
color to this precious metal. The energy of the hybrid transitions in gold is very low in comparison
to the 4 eV of silver, the contractions of the s and p orbitals and the destabilization of the d and f
shells are the causes of this characteristic [13]. An interesting properties of gold is the great increase
of reflectivity in the middle of the visible spectrum that, as for many others metals, extends into the
infrared. The interaction between the particular position of the band edge and the value of plasma
frequency cause this phenomenon. A perfect metal is characterized by a value of ε∞ equal to 1, and
γ negligible. That cause the change of the real part of the permittivity from positive (transmission)
to negative (reflection), at the plasma frequency. The reflection edge’s energy is much lower than
the plasma frequency, calculated from the electron density, due to the interbands transition in gold.

Physical and Optical Properties of Gold | Chapter 2 15
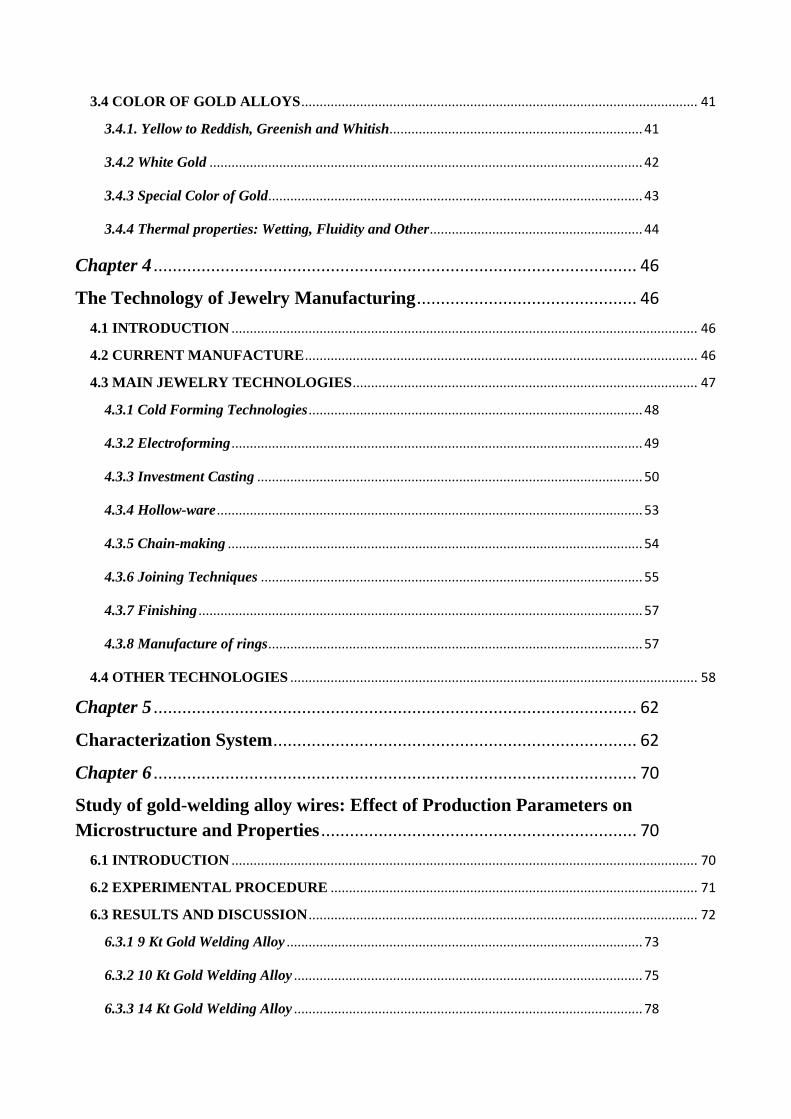
We perceive color when the different wavelengths composing white light selectively interfere with
matter by absorption, diffraction, reflection, refraction or scattering, or when a non-white
distribution of light has been emitted by a system [14]. The
wavelength of visible light is of the order of 380-780 nm
(Fig.2.1).
The formation of colour in metallic elements and their
alloys can be explained by means of the band theory.
When metal and light interact, electrons from the metal
surface situated either below or on the Fermi level absorb
photons and enter an excited state on or above the Fermi
surface respectively [15]. The efficiency of the absorption
and re-emission of light depends on the atomic orbitals
from which the energy band originated. A white reflected
light will result if the different colours in white light are
reflected equally well. In the case of gold and copper, the efficiency decreases with increasing
energy, resulting in yellow and reddish colours due to
the reduction in reflectivity at the blue end of the
spectrum. Measurements performed on gold alloys
with various amounts of silver (Figure 2.2) show a
high reflectivity exhibited by fine gold for the low
energy part (below 2.4 eV) of the visible spectrum.
This means that the yellow colour of gold is formed
by a selective reflection of the red-yellow
wavelengths. As the silver content increases, a higher
reflectivity is displayed for the high-energy part of
the visible spectrum. Silver has a very similar
electronic structure to that of gold, but the transition
of electrons above the Fermi level requires energy in
excess of that of the violet end of the visible spectrum, and thus the entire visible spectrum is
reflected, resulting in the characteristic white metallic colour [16]. The colour plays an important
role in the field of jewelry and dentistry. Producer always estimated the colour of gold alloys
visually but there are cases, where this characteristic is the unique condition for the selection. An
example could be the need to select the suitable solder for repairing a well-defined item. The
Fig 2.1 – Visible Spectrum [16]
Fig. 2.2 - Reflectivity as a function of energy of
the incident light. 1 - fine gold, 2 - Ag50at%Au,
3 - Ag10at%Au, 4 - Ag5at% Au, 5 - fine silver
[16]
Physical and Optical Properties of Gold | Chapter 2 16
variation in the colours of gold products are index of poor quality and professionalism and could by
dangerous for the manufacturers. The need for accurate colour measurement led to the creation of
different systems designed to assess the colour. The Munsell system describes the colour by using
three co-ordinates: “hue”, “chroma” and “value” [17]. This system still relies on the human eye, and
colours are describer by visually comparing them with other standard and finding the closest match.
Nevertheless, the jewelry industry needed a more objective system, whereby the point for the colour
can be defined in order to have the same result and uniformity between the different producers. The
DIN system is based on the comparison between, the colour investigated and, a standard gold panel.
Also this system is affected by some problem: it depends on the human eye, and the gold panels
with lower caratage are characterized by discoloration with time (tarnishing phenomenon).
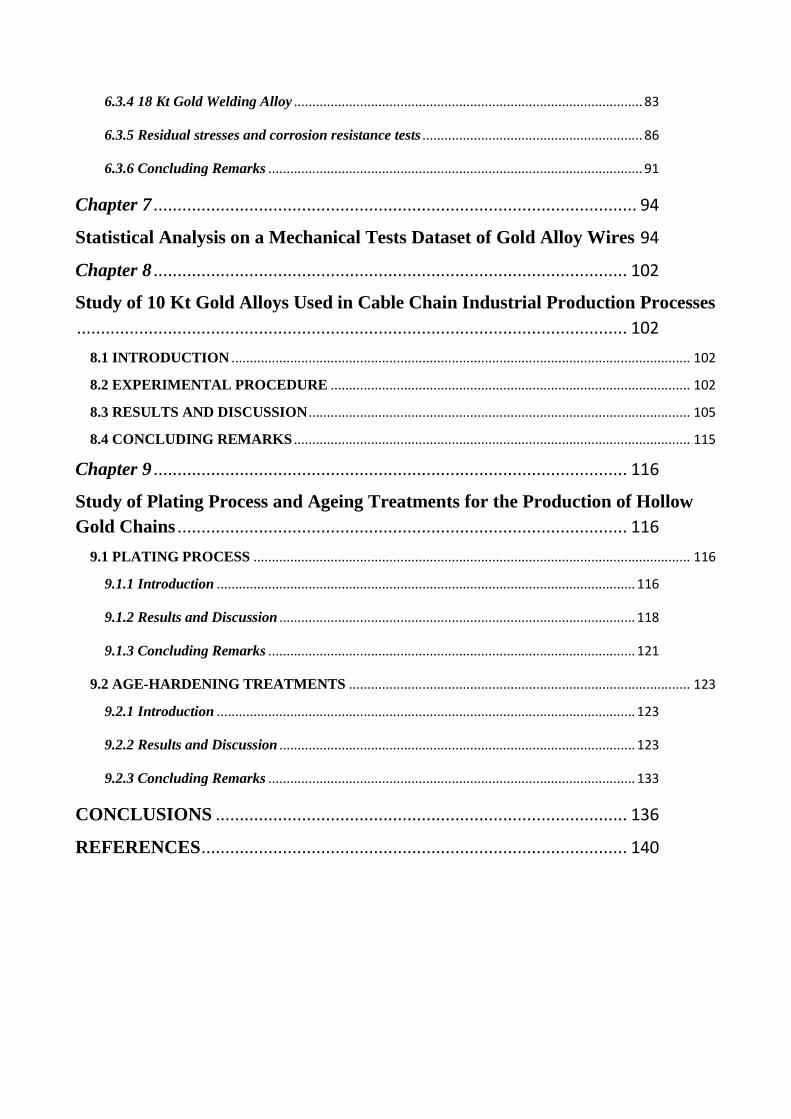
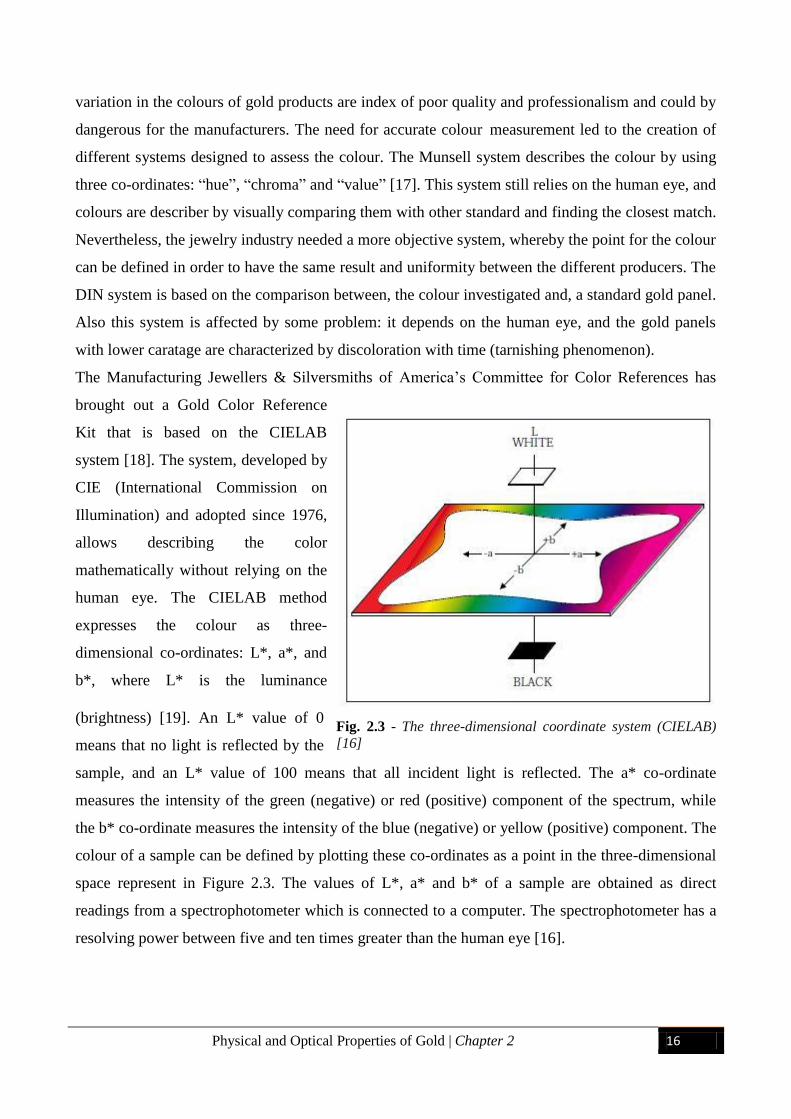
The Manufacturing Jewellers & Silversmiths of America’s Committee for Color References has
brought out a Gold Color Reference
Kit that is based on the CIELAB
system [18]. The system, developed by
CIE (International Commission on
Illumination) and adopted since 1976,
allows describing the color
mathematically without relying on the
human eye. The CIELAB method
expresses the colour as three-
dimensional co-ordinates: L*, a*, and
b*, where L* is the luminance
(brightness) [19]. An L* value of 0
means that no light is reflected by the
sample, and an L* value of 100 means that all incident light is reflected. The a* co-ordinate
measures the intensity of the green (negative) or red (positive) component of the spectrum, while
the b* co-ordinate measures the intensity of the blue (negative) or yellow (positive) component. The
colour of a sample can be defined by plotting these co-ordinates as a point in the three-dimensional
space represent in Figure 2.3. The values of L*, a* and b* of a sample are obtained as direct
readings from a spectrophotometer which is connected to a computer. The spectrophotometer has a
resolving power between five and ten times greater than the human eye [16].
Fig. 2.3 - The three-dimensional coordinate system (CIELAB)
[16]
Physical and Optical Properties of Gold | Chapter 2 17
As the colour of a sample depends on the illuminant, the sample itself and the observer, the
spectrophotometer uses an artificial light source that simulates natural light, an array of
photodiodes, and the computer as the observer.
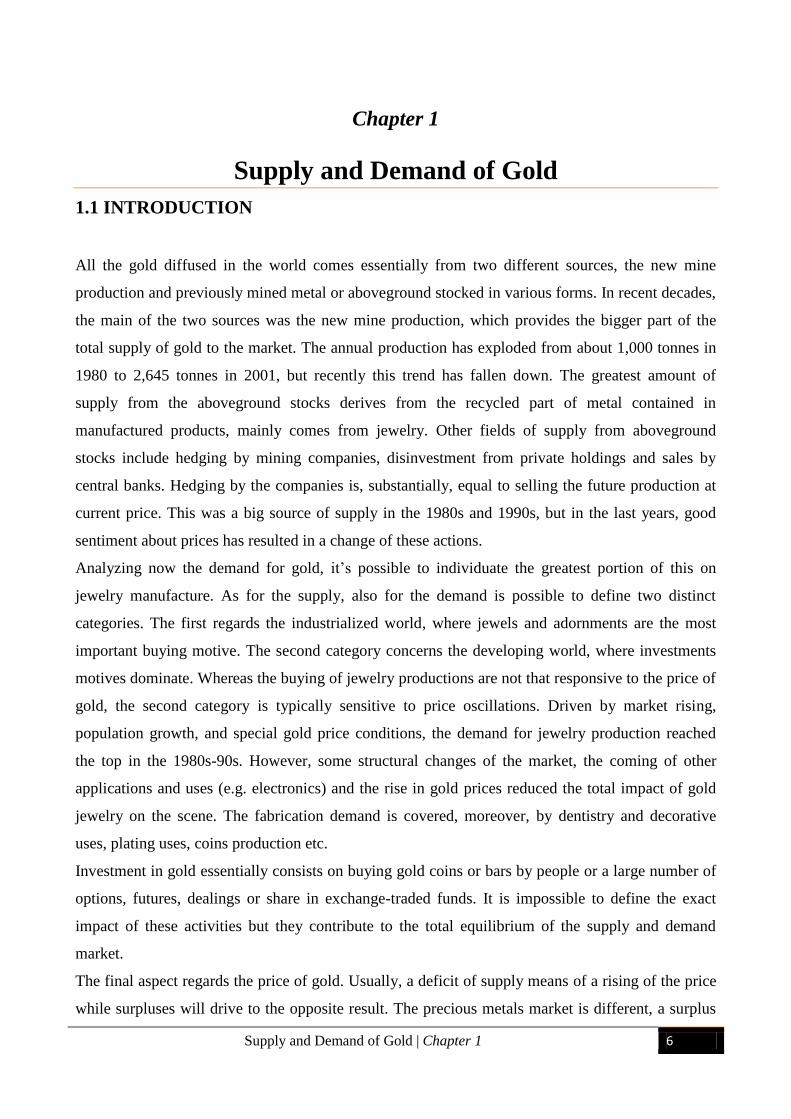
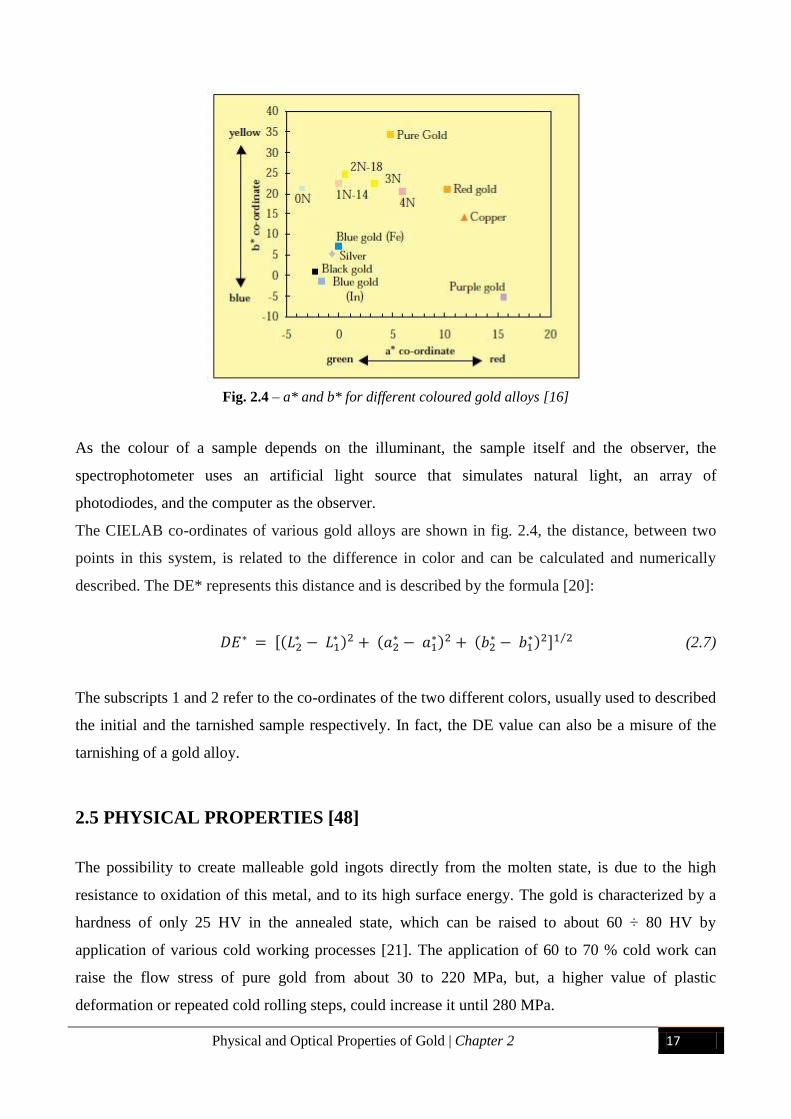
The CIELAB co-ordinates of various gold alloys are shown in fig. 2.4, the distance, between two
points in this system, is related to the difference in color and can be calculated and numerically
described. The DE* represents this distance and is described by the formula [20]:
𝐷𝐸∗ = [(𝐿2∗ − 𝐿1
∗ )2 + (𝑎2∗ − 𝑎1
∗)2 + (𝑏2∗ − 𝑏1
∗)2]1 2⁄ (2.7)
The subscripts 1 and 2 refer to the co-ordinates of the two different colors, usually used to described
the initial and the tarnished sample respectively. In fact, the DE value can also be a misure of the
tarnishing of a gold alloy.
2.5 PHYSICAL PROPERTIES [48]
The possibility to create malleable gold ingots directly from the molten state, is due to the high
resistance to oxidation of this metal, and to its high surface energy. The gold is characterized by a
hardness of only 25 HV in the annealed state, which can be raised to about 60 ÷ 80 HV by
application of various cold working processes [21]. The application of 60 to 70 % cold work can
raise the flow stress of pure gold from about 30 to 220 MPa, but, a higher value of plastic
deformation or repeated cold rolling steps, could increase it until 280 MPa.
Fig. 2.4 – a* and b* for different coloured gold alloys [16]
Physical and Optical Properties of Gold | Chapter 2 18
An important industrial application of gold is the decorative creation of gold leaf, 30 g of gold can
be plastic deformed to a sheet of about 25
m2 in area.
The stacking fault energy of gold has an
intermediate value between that of copper
and silver. The metals with low stacking
fault energies are never looked upon as
being particularly ductile. The networks
of stacking fault in the gold foil should,
theoretically, result in a decrease of
ductility, due to the greater difficulty in
movement of dislocations. The reason of
the high malleability of gold, in
comparison with other metal
characterized by the same fcc structure, is
linked to its nobility. Gold, being a noble
metal, does not have an oxide film on its
surface [22]. Thus dislocations formed
within the gold will be able to escape
easily from the metal at the surface. With
metals having an oxide film on their surfaces the dislocations could well be held within the metal
and this effect would become more noticeable as the total foil thickness decreased; thus the flow
stress would be increased. In these conditions further strain may be accommodated by sub-grain
boundary shearing, so giving rise to fragmentation at a foil thickness equal to the sub-grain
diameter. Gold is, however, unusual in that it can accommodate plastic strain when the beaten foil
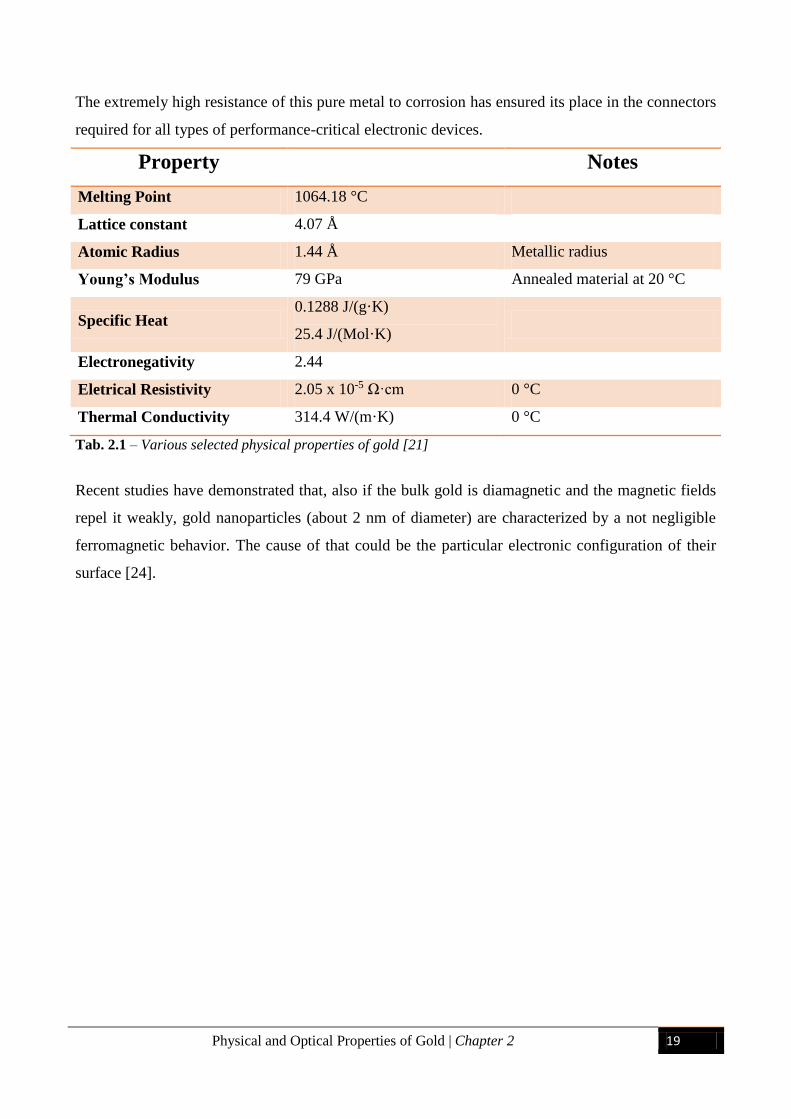
thickness is less than the sub-grain size produced by plastic straining. In the follow table, Tab. 2.1,
various physical parameters useful for the industrial applications are reported. In the late ’90s the
melting point of pure Au was moved from 1064.43 °C to 1064.18 °C, it is also one of the
calibration point used for the International Temperature Scale ITS-90. The increase of the
surface/volume ratio, in small gold particles, generates a decrease in the value of the melting point.
This trend changes when the particles become even smaller, about tens of atoms, and the melting
point increases again, probably because the elementary thermodynamic model does not considers
the molecular regime [23]. Pure gold is characterized by a high thermal and electrical conductivity,
albeit lower than silver and copper.
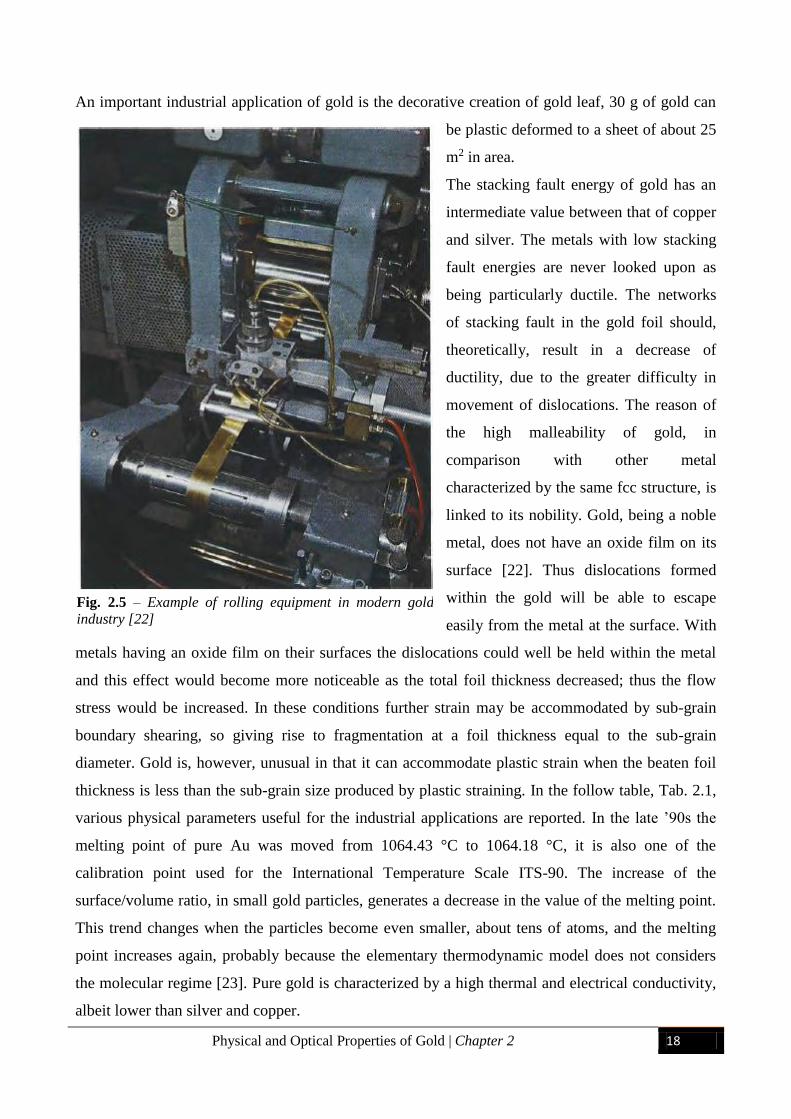
Fig. 2.5 – Example of rolling equipment in modern gold
industry [22]
Physical and Optical Properties of Gold | Chapter 2 19
The extremely high resistance of this pure metal to corrosion has ensured its place in the connectors
required for all types of performance-critical electronic devices.
Property Notes
Melting Point 1064.18 °C
Lattice constant 4.07 Å
Atomic Radius 1.44 Å Metallic radius
Young’s Modulus 79 GPa Annealed material at 20 °C
Specific Heat 0.1288 J/(g·K)
25.4 J/(Mol·K)
Electronegativity 2.44
Eletrical Resistivity 2.05 x 10⁻⁵ Ω·cm 0 °C
Thermal Conductivity 314.4 W/(m·K) 0 °C
Tab. 2.1 – Various selected physical properties of gold [21]
Recent studies have demonstrated that, also if the bulk gold is diamagnetic and the magnetic fields
repel it weakly, gold nanoparticles (about 2 nm of diameter) are characterized by a not negligible
ferromagnetic behavior. The cause of that could be the particular electronic configuration of their
surface [24].
Metallurgy of Gold | Chapter 3 20
Chapter 3
Metallurgy of Gold
3.1 INTRODUCTION
The properties of gold are unique; pure gold is softly, malleable, ductile and has a shiny yellow
color. It is characterized by high thermal and electrical conductivities, it is the most noble of all
metals and, due to this reason, it is not affect by corrosion, tarnishing and oxidation. This
combination of properties and the persistent stability at high temperatures allows its use, not only in
luxury and jewelry fields, but also in many other industrial applications: biomedical and electrical
sector, nanotechnologies and others.
However, in the greater part of its applications, gold cannot be used pure but, usually, it is necessary
to use other metallic alloying elements to ensure suitable properties.
In jewelry, usually, gold is described in terms of karat that is a measure of purity of gold, defined as
part per 24. This excludes, e.g., all the articles which have a brass base and are plated with a gold
coating. Pure gold exists in 24-karat form. Caratage is defined as:
24 𝐾𝑡 = 100 𝑤𝑡% 𝐴𝑢 (3.1)
So, for other composition:
𝑋 𝐾𝑡 = (𝑋∗100)
24 𝑤𝑡% 𝐴𝑢 (3.2)
For example, regarding 18 Kt gold alloy:
𝟏𝟖 𝐾𝑡 = (𝟏𝟖∗100)
24= 75 𝑤𝑡% 𝐴𝑢 (3.3)
Whereas, when we are talking about “microalloyed” gold, the additions of other elements are very
small (about ≤ 1000 ppm).
Metallurgy of Gold | Chapter 3 21
The gold alloys composition varies over a wide range, primarily due to the need of particular range
of colors and mechanical properties and,
secondly, to create products with different
price for the consumers, depending on the
gold content. The additions of particular
elements into the gold alloy is very
important, for example, in dental
applications, where these are used to
create a superficial bond with ceramic
components. Another interesting aspect
could be the use of lower melting
elements to induce a decrease of melting
temperatures, a higher wettability and
fluidity of particular gold solders. The
various phase diagrams are the basis for
any type of metallurgical approach, both binary and ternary gold alloy phase diagrams have been
investigated and evaluated [25-26]. It is possible to correlate some specific aspects of the phase
diagrams (formation of solid solutions, intermediate
compounds, etc.) to a number of elemental atomic
parameters, generally showing a gradual variation
along the Periodic Table. These parameters could be
the valence electron number (Periodic Table group
number), electronegativity, atomic (and ionic)
radius, Mendeleev number or elemental data such as
melting and boiling point, sublimation heat, atomic
volume, etc. [27].
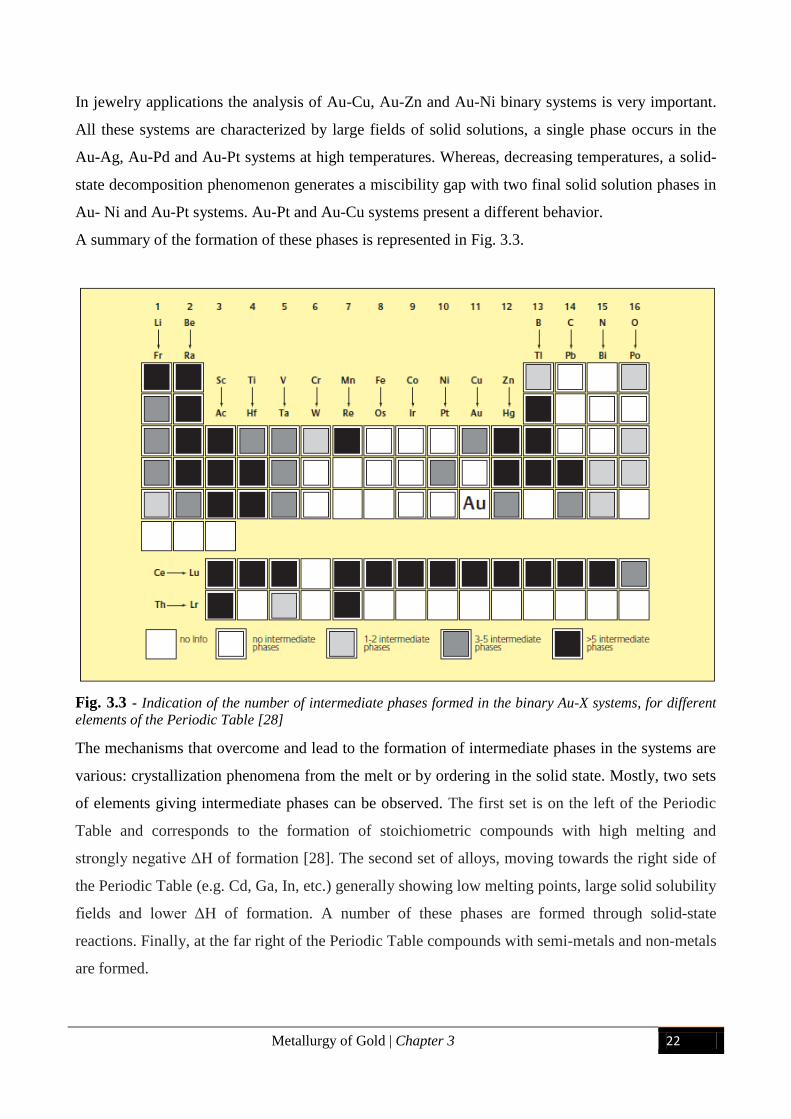
Fig. 3.2 gives a sketch of the composition ranges of
the solid solutions in gold of the transition elements
for which reliable data are available. A complex
trend can be noticed as a function of the position of
the partner element in the Periodic Table. It is known that this trend can be related to the interplay
of the different factors determining solid solubilities. An approach to this point may be given by the
Hume-Rothery rules for primary solid solutions.
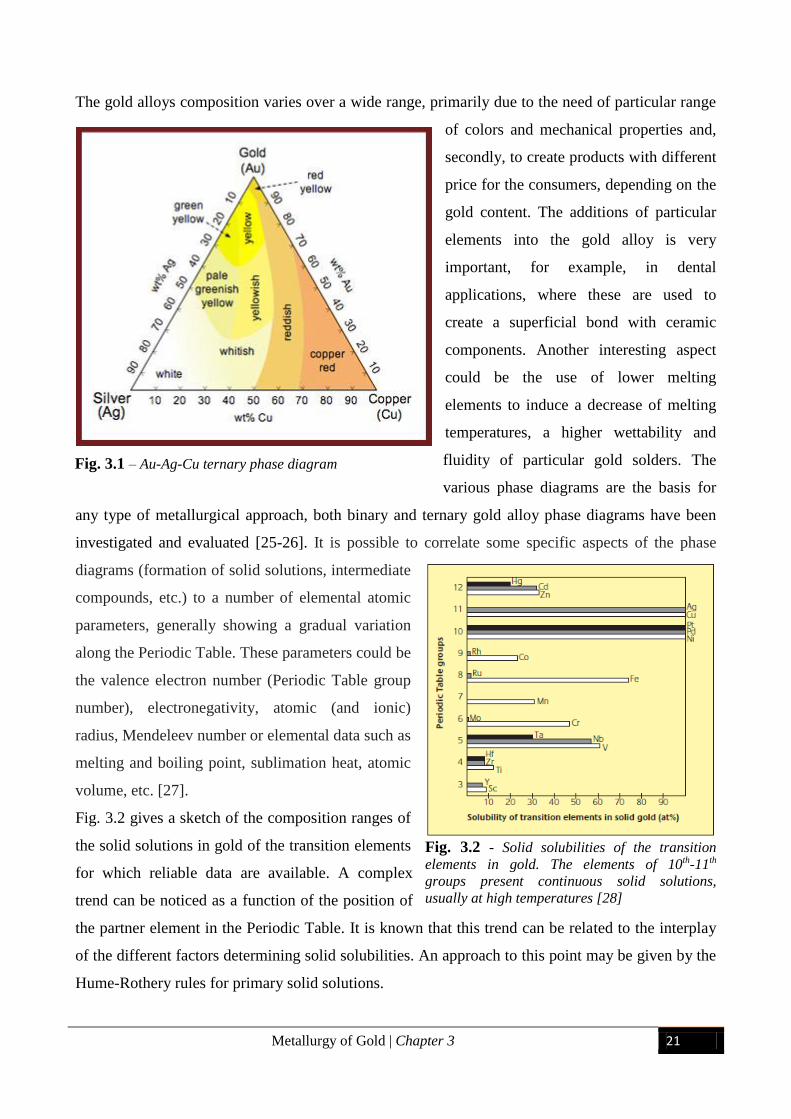
Fig. 3.1 – Au-Ag-Cu ternary phase diagram
Fig. 3.2 - Solid solubilities of the transition
elements in gold. The elements of 10th-11th
groups present continuous solid solutions,
usually at high temperatures [28]
Metallurgy of Gold | Chapter 3 22
In jewelry applications the analysis of Au-Cu, Au-Zn and Au-Ni binary systems is very important.
All these systems are characterized by large fields of solid solutions, a single phase occurs in the
Au-Ag, Au-Pd and Au-Pt systems at high temperatures. Whereas, decreasing temperatures, a solid-
state decomposition phenomenon generates a miscibility gap with two final solid solution phases in
Au- Ni and Au-Pt systems. Au-Pt and Au-Cu systems present a different behavior.
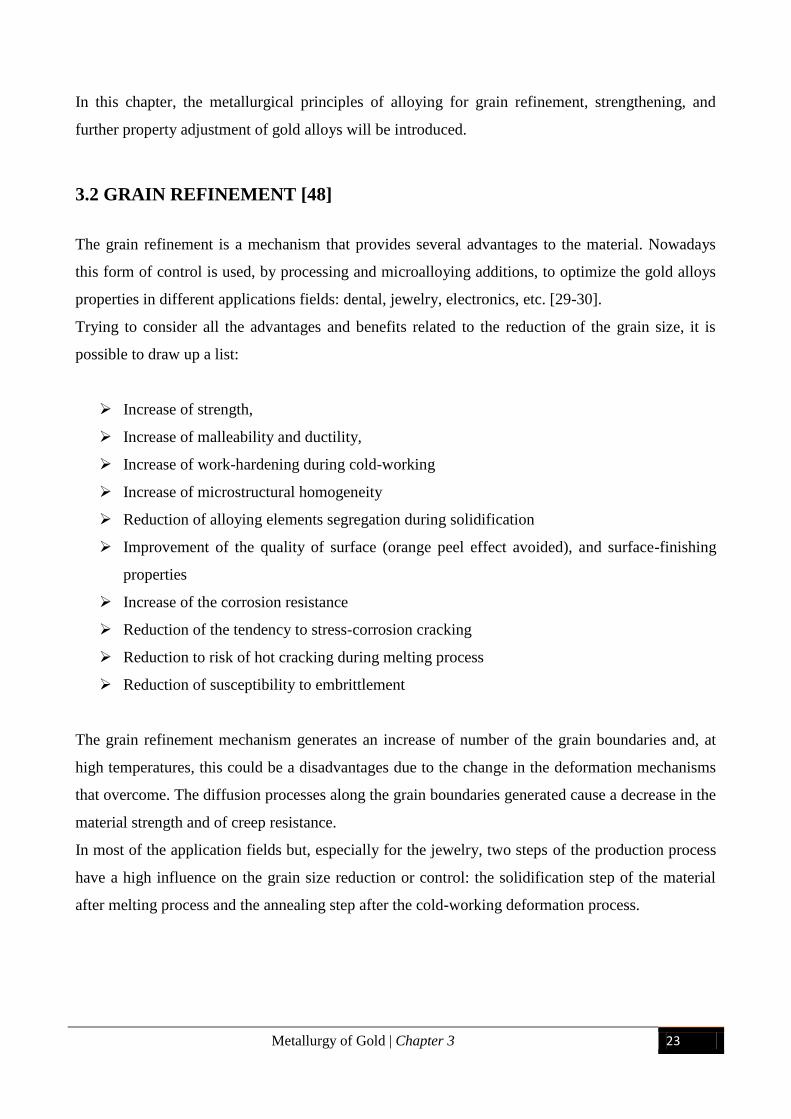
A summary of the formation of these phases is represented in Fig. 3.3.
Fig. 3.3 - Indication of the number of intermediate phases formed in the binary Au-X systems, for different
elements of the Periodic Table [28]
The mechanisms that overcome and lead to the formation of intermediate phases in the systems are
various: crystallization phenomena from the melt or by ordering in the solid state. Mostly, two sets
of elements giving intermediate phases can be observed. The first set is on the left of the Periodic
Table and corresponds to the formation of stoichiometric compounds with high melting and
strongly negative ΔH of formation [28]. The second set of alloys, moving towards the right side of
the Periodic Table (e.g. Cd, Ga, In, etc.) generally showing low melting points, large solid solubility
fields and lower ΔH of formation. A number of these phases are formed through solid-state
reactions. Finally, at the far right of the Periodic Table compounds with semi-metals and non-metals
are formed.
Metallurgy of Gold | Chapter 3 23
In this chapter, the metallurgical principles of alloying for grain refinement, strengthening, and
further property adjustment of gold alloys will be introduced.
3.2 GRAIN REFINEMENT [48]
The grain refinement is a mechanism that provides several advantages to the material. Nowadays
this form of control is used, by processing and microalloying additions, to optimize the gold alloys
properties in different applications fields: dental, jewelry, electronics, etc. [29-30].
Trying to consider all the advantages and benefits related to the reduction of the grain size, it is
possible to draw up a list:
Increase of strength,
Increase of malleability and ductility,
Increase of work-hardening during cold-working
Increase of microstructural homogeneity
Reduction of alloying elements segregation during solidification
Improvement of the quality of surface (orange peel effect avoided), and surface-finishing
properties
Increase of the corrosion resistance
Reduction of the tendency to stress-corrosion cracking
Reduction to risk of hot cracking during melting process
Reduction of susceptibility to embrittlement
The grain refinement mechanism generates an increase of number of the grain boundaries and, at
high temperatures, this could be a disadvantages due to the change in the deformation mechanisms
that overcome. The diffusion processes along the grain boundaries generated cause a decrease in the
material strength and of creep resistance.
In most of the application fields but, especially for the jewelry, two steps of the production process
have a high influence on the grain size reduction or control: the solidification step of the material
after melting process and the annealing step after the cold-working deformation process.
Metallurgy of Gold | Chapter 3 24
3.2.1 Solidification
When a metal or alloy solidifies from the molten state, as in casting for example, its structure is
determined by the processes of nucleation and dendritic growth. The sizes of the grains and their
shapes and orientations are determined by such factors as the rates of nucleation and dendritic
growth, and by the tendency of crystals to form initially on the cold walls of the mould and to grow
inwards towards the center of the casting. During the solidification from the melting process, the
grain refinement can be achieved in different way: by promoting the formation of several new
nuclei for grain growth, or else, by incorporating in the melt additives that decrease the rates of
grain boundary migration and the rates of growth of grains once nuclei have been formed.
Different mechanisms are used to retard the grain growth, as cold pouring, mould vibration and
agitation, gas-melting. It is known in the industrial world that the dimension of the grain obtained
by gas-melting processes are smaller than in the induction-melted alloys. Depending on the
absorption of impurities such, for example, carbon-containing gases [31].
To consider the homogeneous nucleation in the gold alloys, the formation of nuclei must depend on
the segregation of particular additives during solidification phase. The suitable elements for this
purpose are characterized by a high melting point and low solubility, such as iridium, ruthenium,
molybdenum, tungsten and cobalt. The required concentration of additive depends on alloy
composition and, usually, within the range between 50 and 1000 ppm. Higher presence of these
elements in the composition could be detrimental, causing the formation of clusters or segregation,
which reduce the refinement effect, and degrading the surface finishing of the items. Other
problems, directly linked to the excessive concentration of grain refiners or the incorrect control of
temperatures, which led to the formation of coarse particles, arise in the re-melting of scrap.
Therefore, the homogeneous nucleation is a refining method useful for jewelry applications only if
well-defined and controlled.
Other additives, which can be used to ensure a fine grain size, during solidification, are alkaline and
rare hearth elements, as calcium, yttrium, barium or nonmetals like boron [31].
3.2.2 Recrystallization during Annealing and after Cold-Working
During deformation processes such as swaging, hammering, sheet rolling or wire drawing, the
microstructure of metal alloys is heavily deformed with a reduction of the ductility to lower levels.
The material becomes progressively harder and more difficult to work, as lattice defects increase in
number. To restore the initial malleability of the gold alloys, an annealing process is required, in
Metallurgy of Gold | Chapter 3 25
order to soften the material and allow further deformation steps. The characteristics of the new
structure, resulted from the recrystallization, depend on the parameters of the heating treatment and
on the previous deformation performed. The value of deformation is very important to define the
capability to recrystallize during annealing treatment, if the deformation produced is too small
(about 20% e.g.), then the energy stored in the form of lattice defects may be insufficient to promote
complete recrystallization of the metal. Usually, it is recommended to achieve between 40 ÷ 50%
deformation in the as-cast product and about 70% in the annealed, before heating treatment.
The main mechanisms that cause the grain refinement during the annealing are: the increase of
number of recrystallization nuclei and the decrease of grain growth velocity. The additives
submitted before can promote also the formation of nuclei, by themselves or reacting with other
grain refiner or impurities (generating inhomogeneities). These areas are energetically favorable for
the nucleation phase but, if this mechanism is not adequately controlled, occurs an undesirable
growth of a few number of preferentially formed nuclei. It is well known that, a fine-grained
recrystallized microstructure is not stable and tends to achieve its minimum internal energy by
different coarsen mechanisms during excessive annealing treatments.
The classic manifestation of coarse grain size in gold alloys is the `orange peel' effect. This is
characterized by the development during deformation of the material of a surface appearance
similar to that of an orange skin. It results from a shifting of individual coarse grains relative to one
another, in extreme cases to such an extent that the grain boundaries become apparent to the naked
eye. Orange peel effects call for extra work in polishing or re-polishing of final products and this
may result in excessive wear of tools and in loss of alloy [31].
For these reasons, the control of the annealing conditions (time, temperature, etc.) become
increasingly important in industrial processes. In gold alloys, the addiction of particular elements
reduce the grain boundaries mobility, slowing down the kinetics both of the recrystallization and of
grain growth, due to their diffusion processes. The foreign atoms’ rate of migration controls the
migration velocity of the grain boundaries, this interaction is negligible at low concentration and
high temperatures. Accordingly, the grain boundaries move fast and the grain growth is not
restricted. Increasing the concentration of grain refiner, however, the interaction becomes important
causing a decrease of recrystallization rate and an increase of the alloy’s recrystallization
temperature. This effect increases comparably with the difference in atomic size between foreign
and host atom [32].
Besides, other particles like oxides and intermetallic compounds can stabilize the grain boundaries,
decreasing the velocity of grain growth, directly linked on these particles size and distribution.
Metallurgy of Gold | Chapter 3 26
In this process, the most important parameter is the recrystallization temperature, defined as the
temperature at which we have the 50% of the material’s recrystallization by 30 minutes annealing
treatment after 90% deformation. Regarding jewelry applications, a scientific study showed that
cobalt, zirconium and barium are very efficient grain refiners during recrystallization phase [33].
Cobalt, today, is probably the most used elements as grain refiner, in a range of 0.1 ÷ 0.5%, that
become lower abreast with the gold caratage due to the reduction of solubility in the alloy.
3.3 STRENGTH AND DUCTILITY [48]
3.3.1 Mechanisms
The movement of dislocations, lattice defects, that
causes the sliding of crystal planes of the structure,
characterizes the deformation of the metals. The
movement of these defects become more difficult
with the increase of number of distortions, or various
obstacles, presented in the crystal structure. This
leads to a reduction in malleability of the gold alloys
and an increase in hardness.
The as-cast state and, specially, the annealed state of
pure gold are characterized by a very low hardness
of 20 ÷ 30 HV and a deformability over 90% before
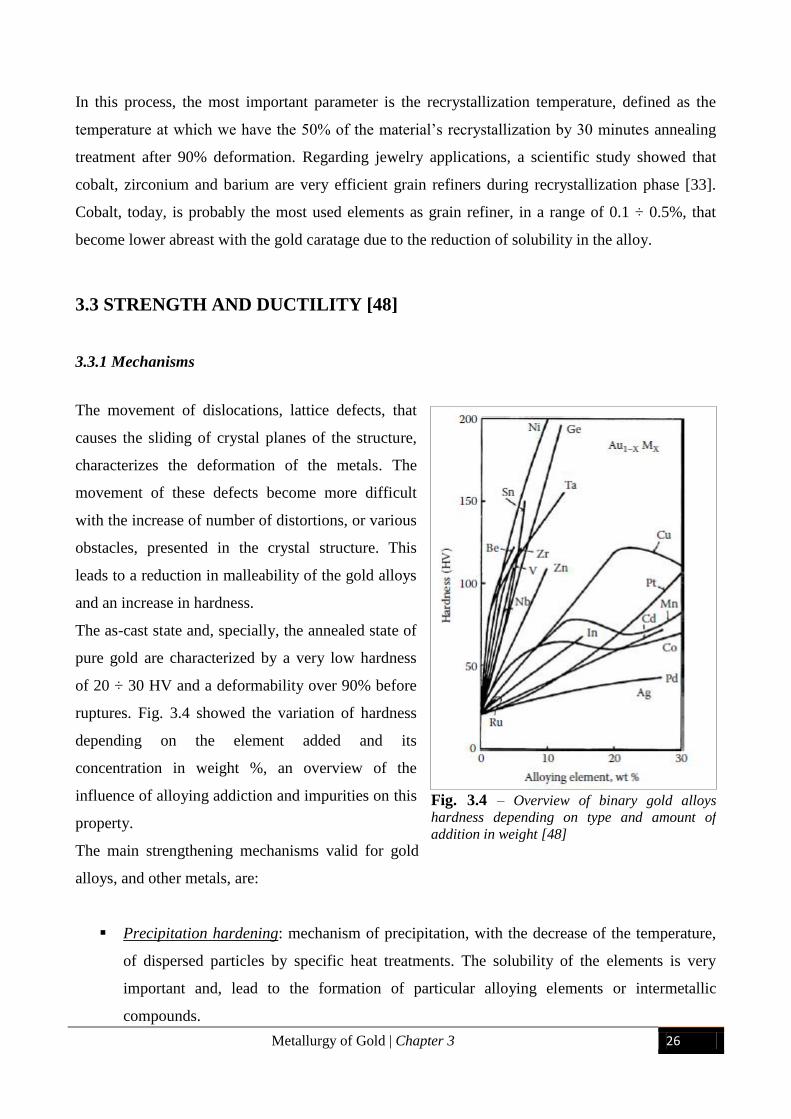
ruptures. Fig. 3.4 showed the variation of hardness
depending on the element added and its
concentration in weight %, an overview of the
influence of alloying addiction and impurities on this
property.
The main strengthening mechanisms valid for gold
alloys, and other metals, are:
Precipitation hardening: mechanism of precipitation, with the decrease of the temperature,
of dispersed particles by specific heat treatments. The solubility of the elements is very
important and, lead to the formation of particular alloying elements or intermetallic
compounds.
Fig. 3.4 – Overview of binary gold alloys
hardness depending on type and amount of
addition in weight [48]
Metallurgy of Gold | Chapter 3 27
Solid solution hardening: the atoms of the alloying elements can modify the structure of the
crystal lattice. If their size is much smaller than the gold atoms, they occupy the gaps
between them; otherwise, they occupy the same sites of the gold atoms. The first case is
called interstitial solid solution hardening, the second, instead, substitutional solid solution
hardening.
Disorder-order solid transformation hardening: with the lowering of temperatures, specific
site of the crystal lattice are occupied by different atoms, creating an ordered solid solution.
This happens, usually, for well-defined alloys in the range of stoichiometric. The need to
preserve the ordered state causes an increase in hardness and strength of the gold alloy, due
to the elastic distortion and the difficult of dislocations movement.
All this processes are reversible, using a homogenization heat treatment, unlike the following:
Dispersion hardening: the reaction of the oxygen (or carbon, etc.) with the alloying
elements generates the irreversible formation of dispersed particles.
In the industrial production world, great importance for the control of the semi-finished product
properties, are the two mechanisms:
Work hardening: this effect depends on the type and amount of alloying elements; the
dislocations present within the crystal lattice react with these and each other. During the
plastic deformation, the number of dislocations is increased by these reactions with not
negligible strengthening of the gold alloy.
Grain size control: as previously established, the grain boundaries are, effectively, obstacles
to the move of dislocations. The use of grain refiners, as stated by the Hall-Petch law,
contributes to increase the strength of the material. This is, also, the unique mechanism that
at the same time avoids the degradation of ductile and machinability of the material.
These two final mechanisms of hardening have particular importance for the optimization of sheets,
rods and wires production cycle. The combination of alloying additions, plastic deformations and
annealing treatments is decisive to define the grades of recrystallization of the microstructure, and
the material’s properties desired for every single step.
Metallurgy of Gold | Chapter 3 28
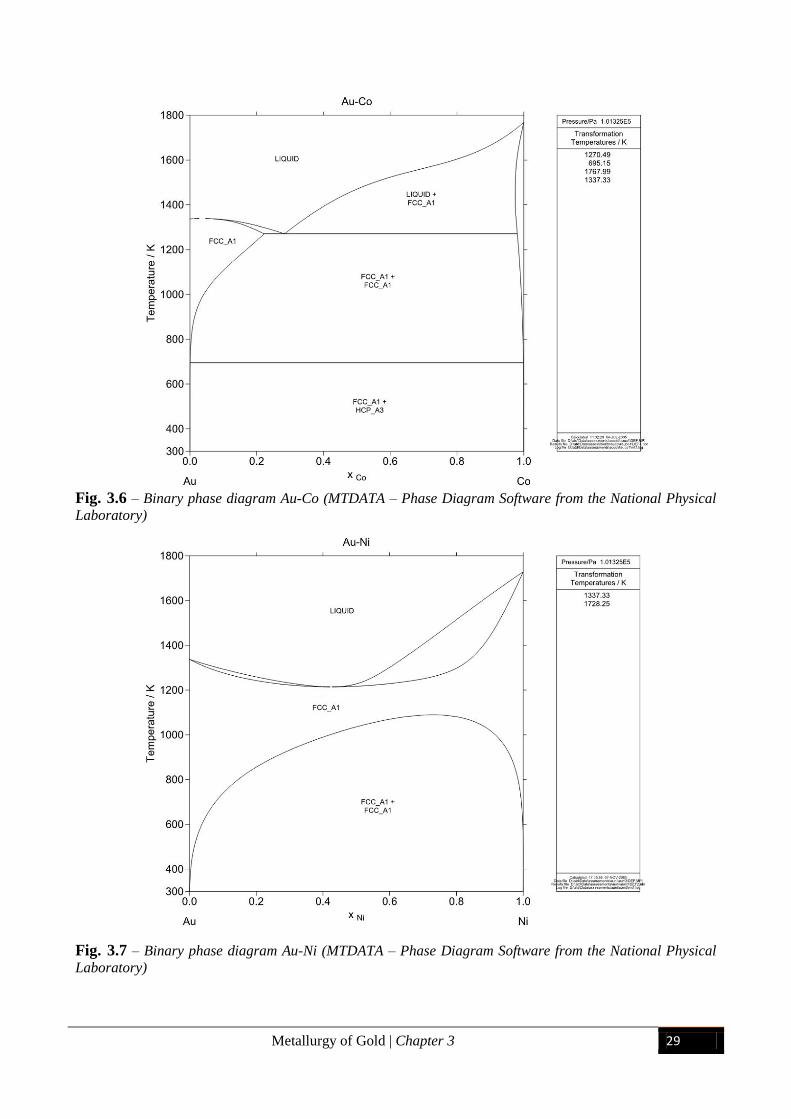
3.3.2 Precipitation Hardening
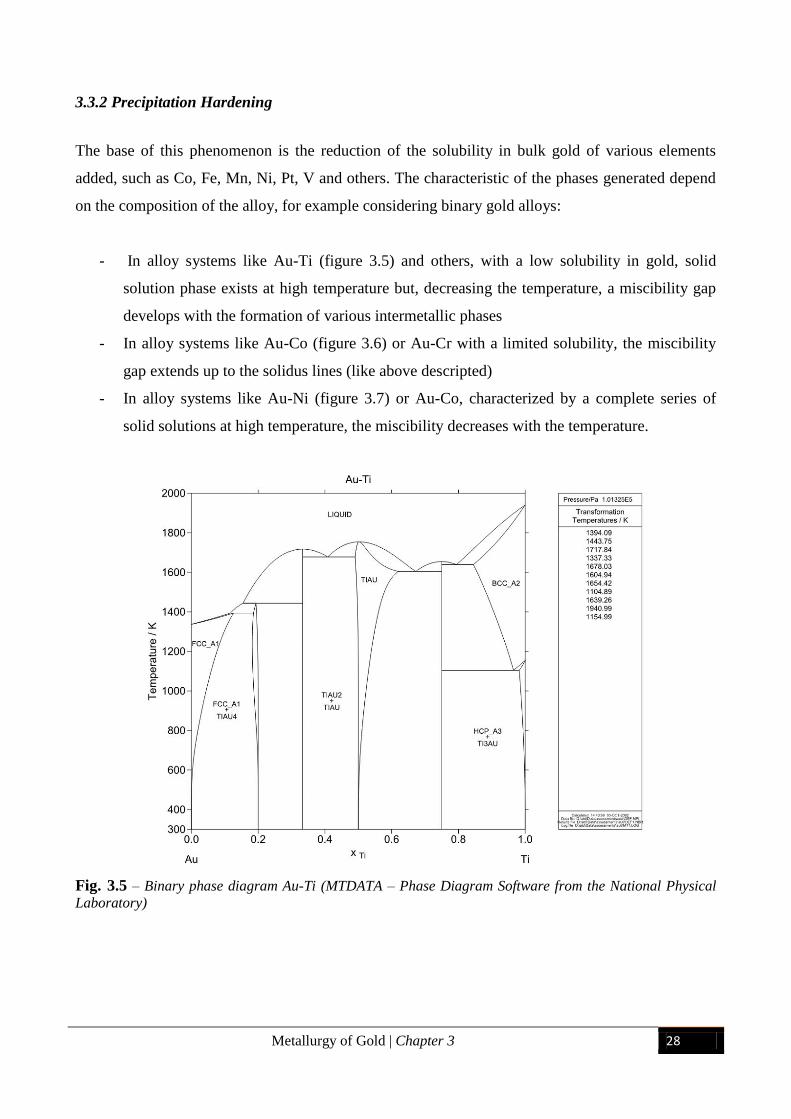
The base of this phenomenon is the reduction of the solubility in bulk gold of various elements
added, such as Co, Fe, Mn, Ni, Pt, V and others. The characteristic of the phases generated depend
on the composition of the alloy, for example considering binary gold alloys:
- In alloy systems like Au-Ti (figure 3.5) and others, with a low solubility in gold, solid
solution phase exists at high temperature but, decreasing the temperature, a miscibility gap
develops with the formation of various intermetallic phases
- In alloy systems like Au-Co (figure 3.6) or Au-Cr with a limited solubility, the miscibility
gap extends up to the solidus lines (like above descripted)
- In alloy systems like Au-Ni (figure 3.7) or Au-Co, characterized by a complete series of
solid solutions at high temperature, the miscibility decreases with the temperature.
Fig. 3.5 – Binary phase diagram Au-Ti (MTDATA – Phase Diagram Software from the National Physical
Laboratory)
Metallurgy of Gold | Chapter 3 29
Fig. 3.6 – Binary phase diagram Au-Co (MTDATA – Phase Diagram Software from the National Physical
Laboratory)
Fig. 3.7 – Binary phase diagram Au-Ni (MTDATA – Phase Diagram Software from the National Physical
Laboratory)
Metallurgy of Gold | Chapter 3 30
This occurs, logically, also in ternary and higher order systems. However, to ensure a valid and
pronounced age hardening of the material, a specific treatment should be used:
Solution annealing (homogenization), typically between 700 °C and 900 °C, considering the
example reported before, for a suitable time depending on the alloy composition and on the
product dimensions. In this way, the alloying elements are again dissolved in the gold
matrix,
Exploiting a rapid quenching, into water, from the previous temperatures, in order to
suppress the precipitation of the particles. A supersaturated solid solution is generated.
Final age hardening treatment, usually between 200°C and 400°C, for a defined time, which
depends by the alloy composition and other production factors.
The nature of particles that precipitates and cause the hardening of the material can be different, for
example:
An intermetallic phase, constituted by a compound of the alloying elements and the gold
atoms
An almost pure metal compound, usually linked to the low solubility of the element
(especially grain refiner)
Another phase enriched with the foreign element, e.g. Ni-rich phase (fig. 3.7)
Several studies on this phenomenon have demonstrated that during the age hardening treatments,
some characteristics of the precipitates change comparably with the aging time. The variation of the
volume fraction, the shape, the composition, the microstructure and sizes of gold alloys could lead
to a hardening effect divided into different stages.
With the progress of the process, increase the risk of an excessive growth and coalescence of the
particles precipitated, accompanied by a decrease in hardness. Usually, the precipitates form and
grow at grain boundaries (energetically favorite), causing a not ideal and homogenous distributions
between these and the grain interiors. The industrial production processes, and their difficult
control, show the critical issue of suitable quenching and heat treatments for the gold alloys. The
results obtained by the production trials are, too often, very different in comparison with the
laboratory tests. The control of the quenching steps is critical for the strengthening effect, a too low
cooling from the high temperature of homogenization causes the precipitation of coarse particles.
This properties’ degradation depends on the gradient generated in the potential for age hardening,
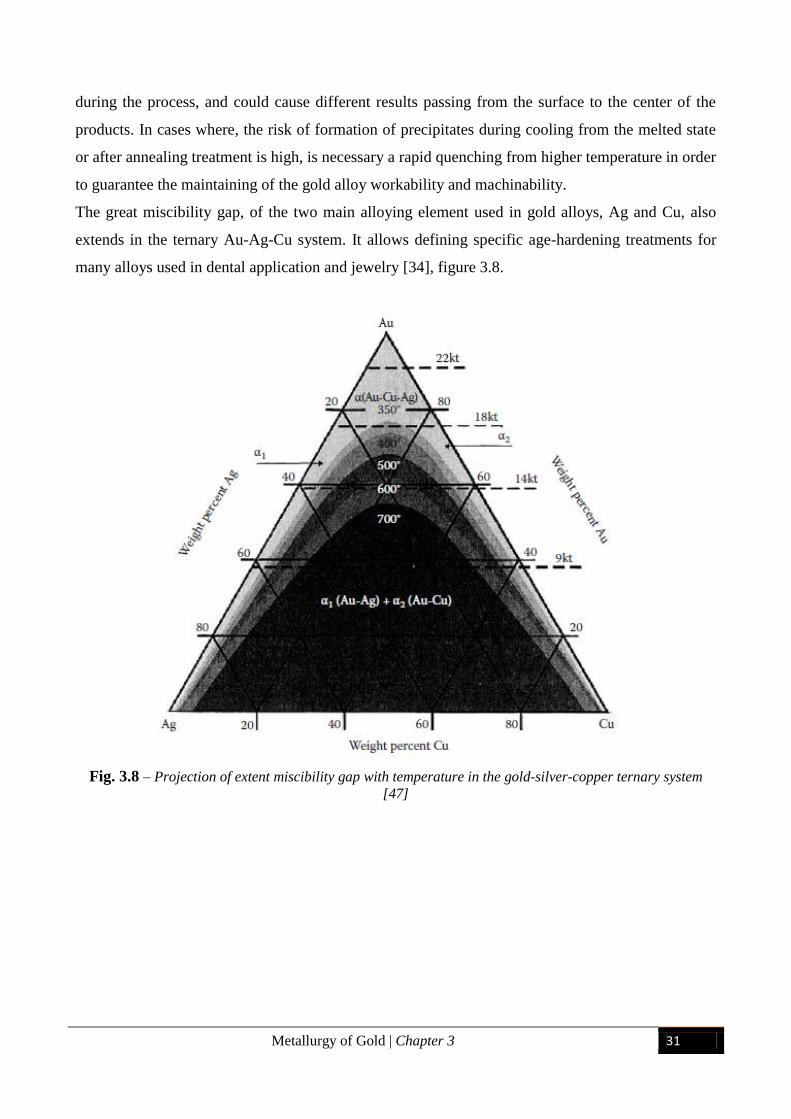
Metallurgy of Gold | Chapter 3 31
during the process, and could cause different results passing from the surface to the center of the
products. In cases where, the risk of formation of precipitates during cooling from the melted state
or after annealing treatment is high, is necessary a rapid quenching from higher temperature in order
to guarantee the maintaining of the gold alloy workability and machinability.
The great miscibility gap, of the two main alloying element used in gold alloys, Ag and Cu, also
extends in the ternary Au-Ag-Cu system. It allows defining specific age-hardening treatments for
many alloys used in dental application and jewelry [34], figure 3.8.
Fig. 3.8 – Projection of extent miscibility gap with temperature in the gold-silver-copper ternary system
[47]
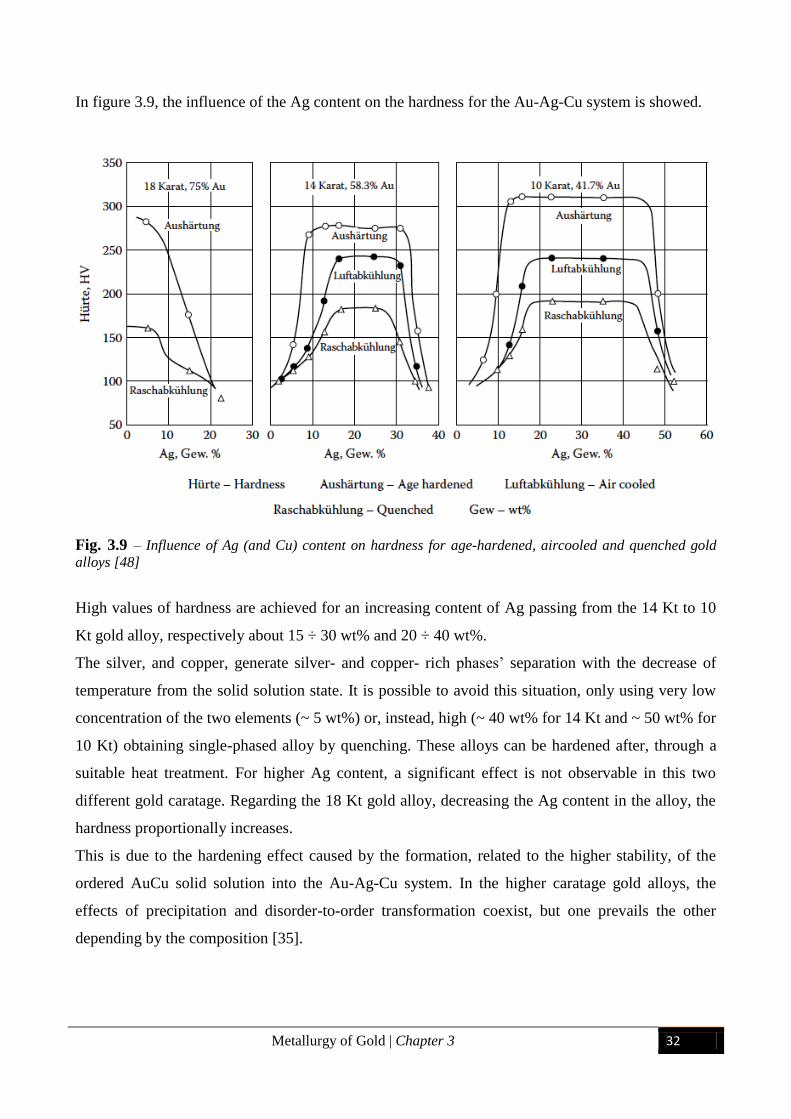
Metallurgy of Gold | Chapter 3 32
In figure 3.9, the influence of the Ag content on the hardness for the Au-Ag-Cu system is showed.
Fig. 3.9 – Influence of Ag (and Cu) content on hardness for age-hardened, aircooled and quenched gold
alloys [48]
High values of hardness are achieved for an increasing content of Ag passing from the 14 Kt to 10
Kt gold alloy, respectively about 15 ÷ 30 wt% and 20 ÷ 40 wt%.
The silver, and copper, generate silver- and copper- rich phases’ separation with the decrease of
temperature from the solid solution state. It is possible to avoid this situation, only using very low
concentration of the two elements (~ 5 wt%) or, instead, high (~ 40 wt% for 14 Kt and ~ 50 wt% for
10 Kt) obtaining single-phased alloy by quenching. These alloys can be hardened after, through a
suitable heat treatment. For higher Ag content, a significant effect is not observable in this two
different gold caratage. Regarding the 18 Kt gold alloy, decreasing the Ag content in the alloy, the
hardness proportionally increases.
This is due to the hardening effect caused by the formation, related to the higher stability, of the
ordered AuCu solid solution into the Au-Ag-Cu system. In the higher caratage gold alloys, the
effects of precipitation and disorder-to-order transformation coexist, but one prevails the other
depending by the composition [35].
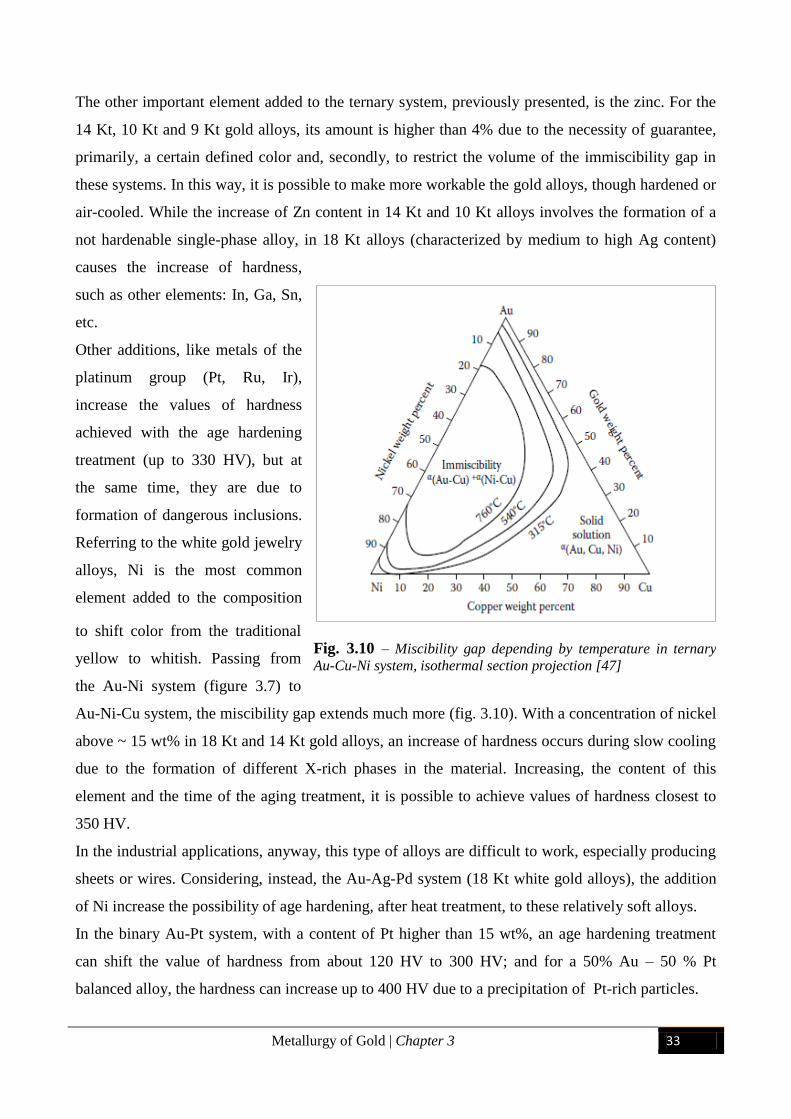
Metallurgy of Gold | Chapter 3 33
The other important element added to the ternary system, previously presented, is the zinc. For the
14 Kt, 10 Kt and 9 Kt gold alloys, its amount is higher than 4% due to the necessity of guarantee,
primarily, a certain defined color and, secondly, to restrict the volume of the immiscibility gap in
these systems. In this way, it is possible to make more workable the gold alloys, though hardened or
air-cooled. While the increase of Zn content in 14 Kt and 10 Kt alloys involves the formation of a
not hardenable single-phase alloy, in 18 Kt alloys (characterized by medium to high Ag content)
causes the increase of hardness,
such as other elements: In, Ga, Sn,
etc.
Other additions, like metals of the
platinum group (Pt, Ru, Ir),
increase the values of hardness
achieved with the age hardening
treatment (up to 330 HV), but at
the same time, they are due to
formation of dangerous inclusions.
Referring to the white gold jewelry
alloys, Ni is the most common
element added to the composition
to shift color from the traditional
yellow to whitish. Passing from
the Au-Ni system (figure 3.7) to
Au-Ni-Cu system, the miscibility gap extends much more (fig. 3.10). With a concentration of nickel
above ~ 15 wt% in 18 Kt and 14 Kt gold alloys, an increase of hardness occurs during slow cooling
due to the formation of different X-rich phases in the material. Increasing, the content of this
element and the time of the aging treatment, it is possible to achieve values of hardness closest to
350 HV.
In the industrial applications, anyway, this type of alloys are difficult to work, especially producing
sheets or wires. Considering, instead, the Au-Ag-Pd system (18 Kt white gold alloys), the addition
of Ni increase the possibility of age hardening, after heat treatment, to these relatively soft alloys.
In the binary Au-Pt system, with a content of Pt higher than 15 wt%, an age hardening treatment
can shift the value of hardness from about 120 HV to 300 HV; and for a 50% Au – 50 % Pt
balanced alloy, the hardness can increase up to 400 HV due to a precipitation of Pt-rich particles.
Fig. 3.10 – Miscibility gap depending by temperature in ternary
Au-Cu-Ni system, isothermal section projection [47]
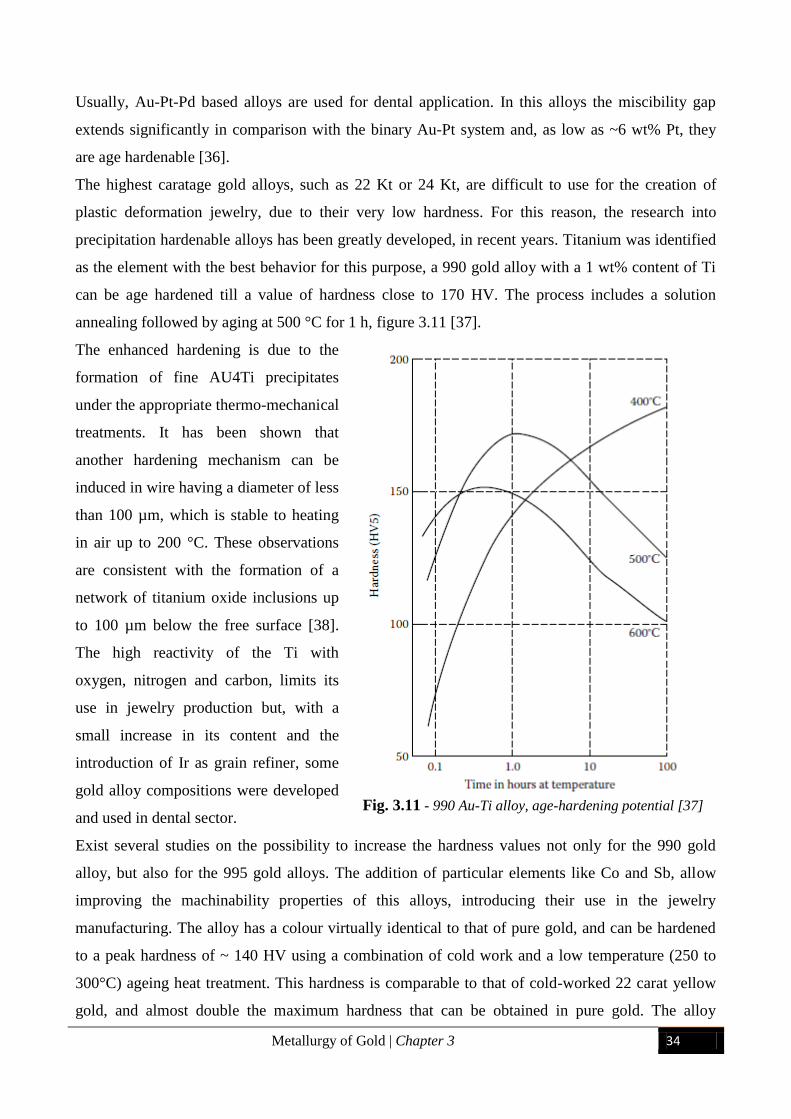
Metallurgy of Gold | Chapter 3 34
Usually, Au-Pt-Pd based alloys are used for dental application. In this alloys the miscibility gap
extends significantly in comparison with the binary Au-Pt system and, as low as ~6 wt% Pt, they
are age hardenable [36].
The highest caratage gold alloys, such as 22 Kt or 24 Kt, are difficult to use for the creation of
plastic deformation jewelry, due to their very low hardness. For this reason, the research into
precipitation hardenable alloys has been greatly developed, in recent years. Titanium was identified
as the element with the best behavior for this purpose, a 990 gold alloy with a 1 wt% content of Ti
can be age hardened till a value of hardness close to 170 HV. The process includes a solution
annealing followed by aging at 500 °C for 1 h, figure 3.11 [37].
The enhanced hardening is due to the
formation of fine AU4Ti precipitates
under the appropriate thermo-mechanical
treatments. It has been shown that
another hardening mechanism can be
induced in wire having a diameter of less
than 100 µm, which is stable to heating
in air up to 200 °C. These observations
are consistent with the formation of a
network of titanium oxide inclusions up
to 100 µm below the free surface [38].
The high reactivity of the Ti with
oxygen, nitrogen and carbon, limits its
use in jewelry production but, with a
small increase in its content and the
introduction of Ir as grain refiner, some
gold alloy compositions were developed
and used in dental sector.
Exist several studies on the possibility to increase the hardness values not only for the 990 gold
alloy, but also for the 995 gold alloys. The addition of particular elements like Co and Sb, allow
improving the machinability properties of this alloys, introducing their use in the jewelry
manufacturing. The alloy has a colour virtually identical to that of pure gold, and can be hardened
to a peak hardness of ~ 140 HV using a combination of cold work and a low temperature (250 to
300°C) ageing heat treatment. This hardness is comparable to that of cold-worked 22 carat yellow
gold, and almost double the maximum hardness that can be obtained in pure gold. The alloy
Fig. 3.11 - 990 Au-Ti alloy, age-hardening potential [37]
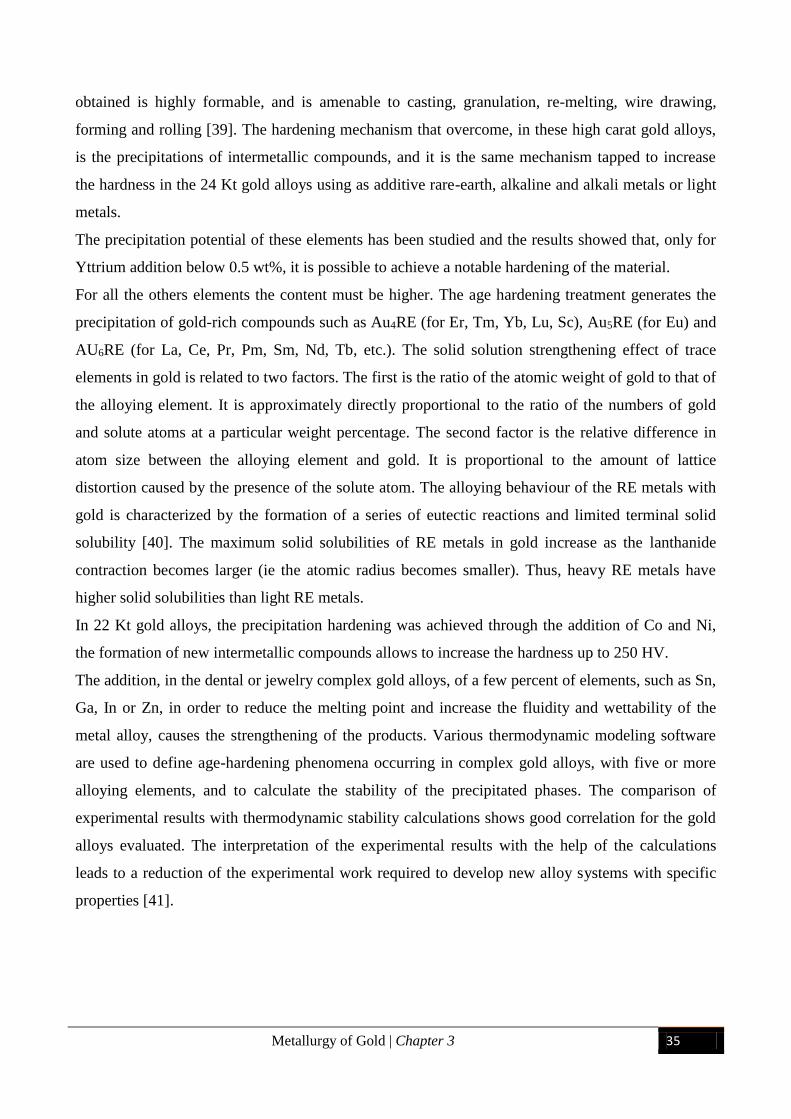
Metallurgy of Gold | Chapter 3 35
obtained is highly formable, and is amenable to casting, granulation, re-melting, wire drawing,
forming and rolling [39]. The hardening mechanism that overcome, in these high carat gold alloys,
is the precipitations of intermetallic compounds, and it is the same mechanism tapped to increase
the hardness in the 24 Kt gold alloys using as additive rare-earth, alkaline and alkali metals or light
metals.
The precipitation potential of these elements has been studied and the results showed that, only for
Yttrium addition below 0.5 wt%, it is possible to achieve a notable hardening of the material.
For all the others elements the content must be higher. The age hardening treatment generates the
precipitation of gold-rich compounds such as Au4RE (for Er, Tm, Yb, Lu, Sc), Au5RE (for Eu) and
AU6RE (for La, Ce, Pr, Pm, Sm, Nd, Tb, etc.). The solid solution strengthening effect of trace
elements in gold is related to two factors. The first is the ratio of the atomic weight of gold to that of
the alloying element. It is approximately directly proportional to the ratio of the numbers of gold
and solute atoms at a particular weight percentage. The second factor is the relative difference in
atom size between the alloying element and gold. It is proportional to the amount of lattice
distortion caused by the presence of the solute atom. The alloying behaviour of the RE metals with
gold is characterized by the formation of a series of eutectic reactions and limited terminal solid
solubility [40]. The maximum solid solubilities of RE metals in gold increase as the lanthanide
contraction becomes larger (ie the atomic radius becomes smaller). Thus, heavy RE metals have
higher solid solubilities than light RE metals.
In 22 Kt gold alloys, the precipitation hardening was achieved through the addition of Co and Ni,
the formation of new intermetallic compounds allows to increase the hardness up to 250 HV.
The addition, in the dental or jewelry complex gold alloys, of a few percent of elements, such as Sn,
Ga, In or Zn, in order to reduce the melting point and increase the fluidity and wettability of the
metal alloy, causes the strengthening of the products. Various thermodynamic modeling software
are used to define age-hardening phenomena occurring in complex gold alloys, with five or more
alloying elements, and to calculate the stability of the precipitated phases. The comparison of
experimental results with thermodynamic stability calculations shows good correlation for the gold
alloys evaluated. The interpretation of the experimental results with the help of the calculations
leads to a reduction of the experimental work required to develop new alloy systems with specific
properties [41].
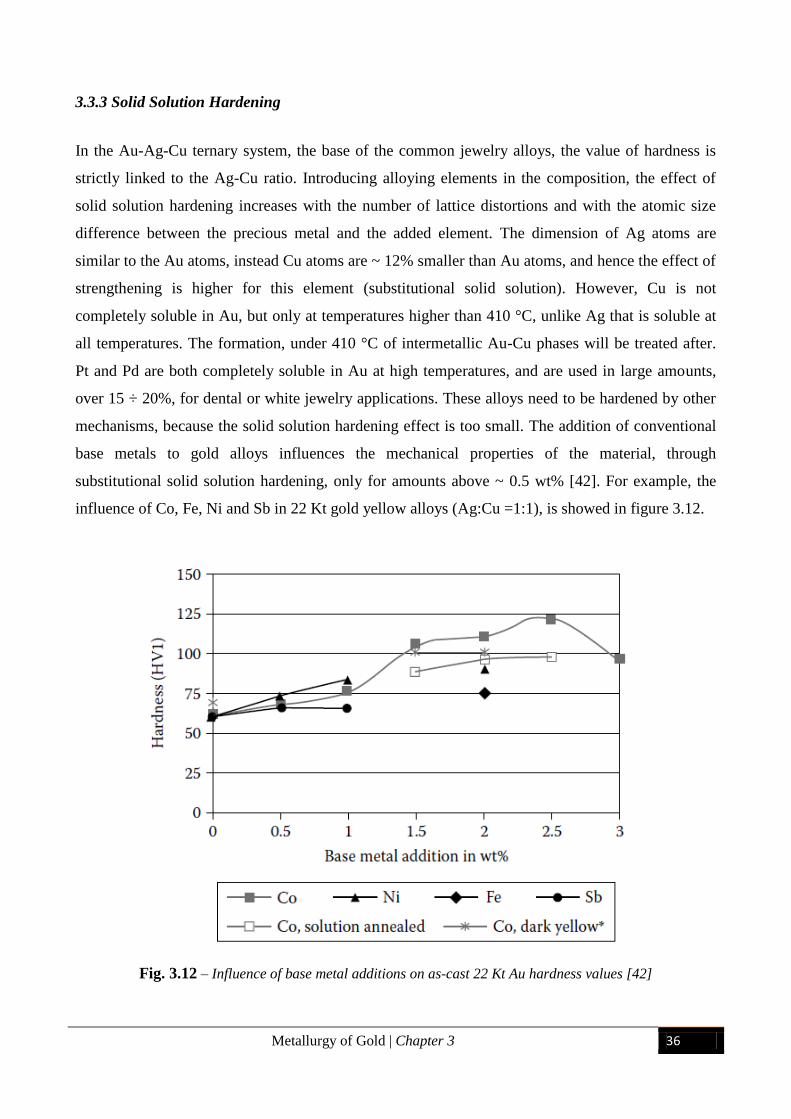
Metallurgy of Gold | Chapter 3 36
3.3.3 Solid Solution Hardening
In the Au-Ag-Cu ternary system, the base of the common jewelry alloys, the value of hardness is
strictly linked to the Ag-Cu ratio. Introducing alloying elements in the composition, the effect of
solid solution hardening increases with the number of lattice distortions and with the atomic size
difference between the precious metal and the added element. The dimension of Ag atoms are
similar to the Au atoms, instead Cu atoms are ~ 12% smaller than Au atoms, and hence the effect of
strengthening is higher for this element (substitutional solid solution). However, Cu is not
completely soluble in Au, but only at temperatures higher than 410 °C, unlike Ag that is soluble at
all temperatures. The formation, under 410 °C of intermetallic Au-Cu phases will be treated after.
Pt and Pd are both completely soluble in Au at high temperatures, and are used in large amounts,
over 15 ÷ 20%, for dental or white jewelry applications. These alloys need to be hardened by other
mechanisms, because the solid solution hardening effect is too small. The addition of conventional
base metals to gold alloys influences the mechanical properties of the material, through
substitutional solid solution hardening, only for amounts above ~ 0.5 wt% [42]. For example, the
influence of Co, Fe, Ni and Sb in 22 Kt gold yellow alloys (Ag:Cu =1:1), is showed in figure 3.12.
Fig. 3.12 – Influence of base metal additions on as-cast 22 Kt Au hardness values [42]
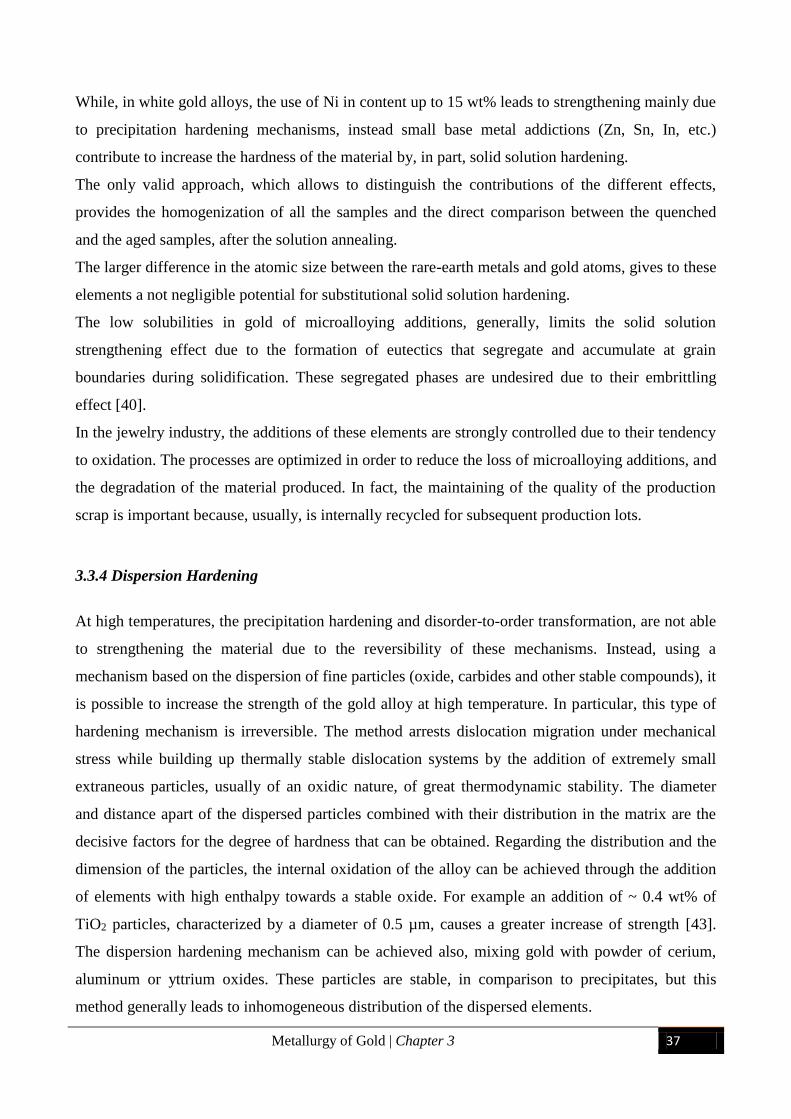
Metallurgy of Gold | Chapter 3 37
While, in white gold alloys, the use of Ni in content up to 15 wt% leads to strengthening mainly due
to precipitation hardening mechanisms, instead small base metal addictions (Zn, Sn, In, etc.)
contribute to increase the hardness of the material by, in part, solid solution hardening.
The only valid approach, which allows to distinguish the contributions of the different effects,
provides the homogenization of all the samples and the direct comparison between the quenched
and the aged samples, after the solution annealing.
The larger difference in the atomic size between the rare-earth metals and gold atoms, gives to these
elements a not negligible potential for substitutional solid solution hardening.
The low solubilities in gold of microalloying additions, generally, limits the solid solution
strengthening effect due to the formation of eutectics that segregate and accumulate at grain
boundaries during solidification. These segregated phases are undesired due to their embrittling
effect [40].
In the jewelry industry, the additions of these elements are strongly controlled due to their tendency
to oxidation. The processes are optimized in order to reduce the loss of microalloying additions, and
the degradation of the material produced. In fact, the maintaining of the quality of the production
scrap is important because, usually, is internally recycled for subsequent production lots.
3.3.4 Dispersion Hardening
At high temperatures, the precipitation hardening and disorder-to-order transformation, are not able
to strengthening the material due to the reversibility of these mechanisms. Instead, using a
mechanism based on the dispersion of fine particles (oxide, carbides and other stable compounds), it
is possible to increase the strength of the gold alloy at high temperature. In particular, this type of
hardening mechanism is irreversible. The method arrests dislocation migration under mechanical
stress while building up thermally stable dislocation systems by the addition of extremely small
extraneous particles, usually of an oxidic nature, of great thermodynamic stability. The diameter
and distance apart of the dispersed particles combined with their distribution in the matrix are the
decisive factors for the degree of hardness that can be obtained. Regarding the distribution and the
dimension of the particles, the internal oxidation of the alloy can be achieved through the addition
of elements with high enthalpy towards a stable oxide. For example an addition of ~ 0.4 wt% of
TiO2 particles, characterized by a diameter of 0.5 µm, causes a greater increase of strength [43].
The dispersion hardening mechanism can be achieved also, mixing gold with powder of cerium,
aluminum or yttrium oxides. These particles are stable, in comparison to precipitates, but this
method generally leads to inhomogeneous distribution of the dispersed elements.
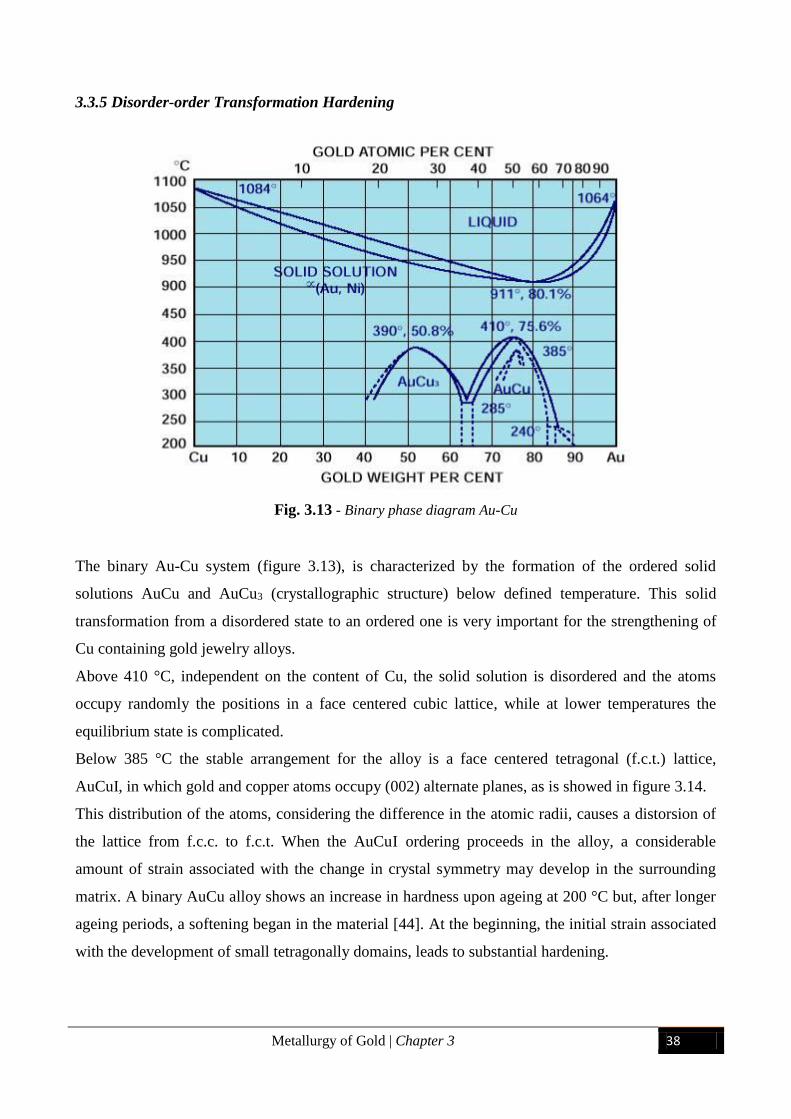
Metallurgy of Gold | Chapter 3 38
3.3.5 Disorder-order Transformation Hardening
Fig. 3.13 - Binary phase diagram Au-Cu
The binary Au-Cu system (figure 3.13), is characterized by the formation of the ordered solid
solutions AuCu and AuCu3 (crystallographic structure) below defined temperature. This solid
transformation from a disordered state to an ordered one is very important for the strengthening of
Cu containing gold jewelry alloys.
Above 410 °C, independent on the content of Cu, the solid solution is disordered and the atoms
occupy randomly the positions in a face centered cubic lattice, while at lower temperatures the
equilibrium state is complicated.
Below 385 °C the stable arrangement for the alloy is a face centered tetragonal (f.c.t.) lattice,
AuCuI, in which gold and copper atoms occupy (002) alternate planes, as is showed in figure 3.14.
This distribution of the atoms, considering the difference in the atomic radii, causes a distorsion of
the lattice from f.c.c. to f.c.t. When the AuCuI ordering proceeds in the alloy, a considerable
amount of strain associated with the change in crystal symmetry may develop in the surrounding
matrix. A binary AuCu alloy shows an increase in hardness upon ageing at 200 °C but, after longer
ageing periods, a softening began in the material [44]. At the beginning, the initial strain associated
with the development of small tetragonally domains, leads to substantial hardening.
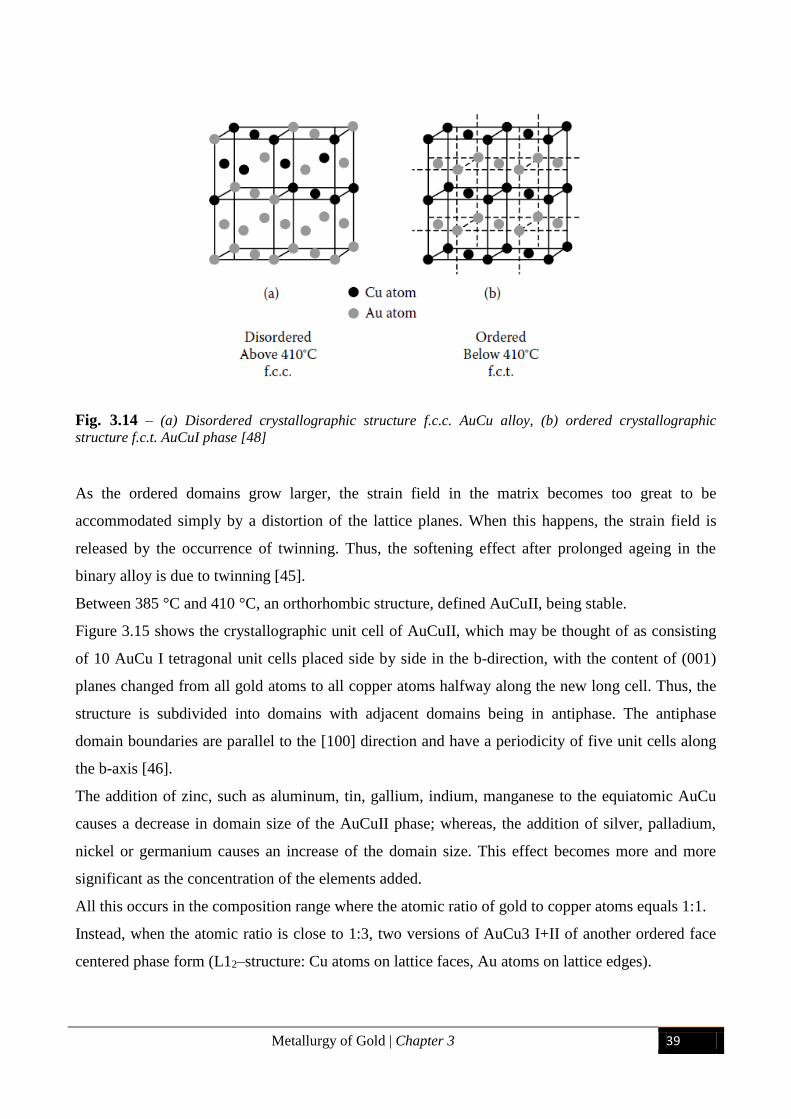
Metallurgy of Gold | Chapter 3 39
Fig. 3.14 – (a) Disordered crystallographic structure f.c.c. AuCu alloy, (b) ordered crystallographic
structure f.c.t. AuCuI phase [48]
As the ordered domains grow larger, the strain field in the matrix becomes too great to be
accommodated simply by a distortion of the lattice planes. When this happens, the strain field is
released by the occurrence of twinning. Thus, the softening effect after prolonged ageing in the
binary alloy is due to twinning [45].
Between 385 °C and 410 °C, an orthorhombic structure, defined AuCuII, being stable.
Figure 3.15 shows the crystallographic unit cell of AuCuII, which may be thought of as consisting
of 10 AuCu I tetragonal unit cells placed side by side in the b-direction, with the content of (001)
planes changed from all gold atoms to all copper atoms halfway along the new long cell. Thus, the
structure is subdivided into domains with adjacent domains being in antiphase. The antiphase
domain boundaries are parallel to the [100] direction and have a periodicity of five unit cells along
the b-axis [46].
The addition of zinc, such as aluminum, tin, gallium, indium, manganese to the equiatomic AuCu
causes a decrease in domain size of the AuCuII phase; whereas, the addition of silver, palladium,
nickel or germanium causes an increase of the domain size. This effect becomes more and more
significant as the concentration of the elements added.
All this occurs in the composition range where the atomic ratio of gold to copper atoms equals 1:1.
Instead, when the atomic ratio is close to 1:3, two versions of AuCu3 I+II of another ordered face
centered phase form (L12–structure: Cu atoms on lattice faces, Au atoms on lattice edges).
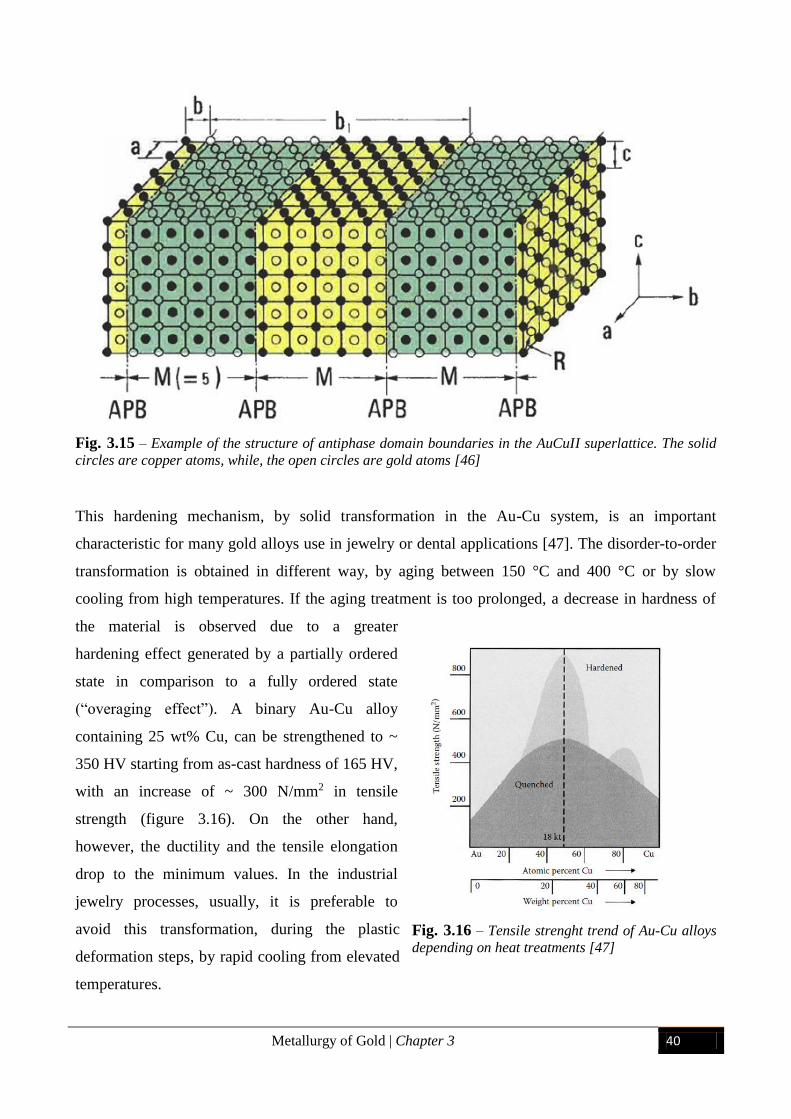
Metallurgy of Gold | Chapter 3 40
Fig. 3.15 – Example of the structure of antiphase domain boundaries in the AuCuII superlattice. The solid
circles are copper atoms, while, the open circles are gold atoms [46]
This hardening mechanism, by solid transformation in the Au-Cu system, is an important
characteristic for many gold alloys use in jewelry or dental applications [47]. The disorder-to-order
transformation is obtained in different way, by aging between 150 °C and 400 °C or by slow
cooling from high temperatures. If the aging treatment is too prolonged, a decrease in hardness of
the material is observed due to a greater
hardening effect generated by a partially ordered
state in comparison to a fully ordered state
(“overaging effect”). A binary Au-Cu alloy
containing 25 wt% Cu, can be strengthened to ~
350 HV starting from as-cast hardness of 165 HV,
with an increase of ~ 300 N/mm2 in tensile
strength (figure 3.16). On the other hand,
however, the ductility and the tensile elongation
drop to the minimum values. In the industrial
jewelry processes, usually, it is preferable to
avoid this transformation, during the plastic
deformation steps, by rapid cooling from elevated
temperatures.
Fig. 3.16 – Tensile strenght trend of Au-Cu alloys
depending on heat treatments [47]
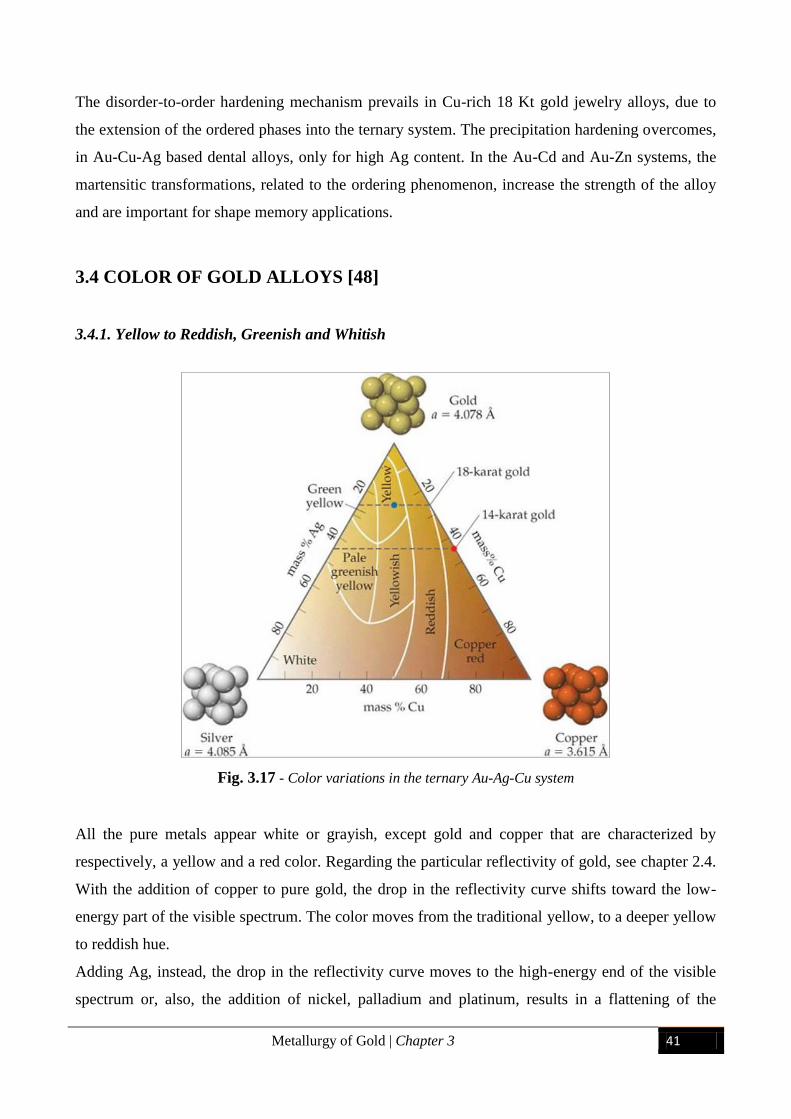
Metallurgy of Gold | Chapter 3 41
The disorder-to-order hardening mechanism prevails in Cu-rich 18 Kt gold jewelry alloys, due to
the extension of the ordered phases into the ternary system. The precipitation hardening overcomes,
in Au-Cu-Ag based dental alloys, only for high Ag content. In the Au-Cd and Au-Zn systems, the
martensitic transformations, related to the ordering phenomenon, increase the strength of the alloy
and are important for shape memory applications.
3.4 COLOR OF GOLD ALLOYS [48]
3.4.1. Yellow to Reddish, Greenish and Whitish
Fig. 3.17 - Color variations in the ternary Au-Ag-Cu system
All the pure metals appear white or grayish, except gold and copper that are characterized by
respectively, a yellow and a red color. Regarding the particular reflectivity of gold, see chapter 2.4.
With the addition of copper to pure gold, the drop in the reflectivity curve shifts toward the low-
energy part of the visible spectrum. The color moves from the traditional yellow, to a deeper yellow
to reddish hue.
Adding Ag, instead, the drop in the reflectivity curve moves to the high-energy end of the visible
spectrum or, also, the addition of nickel, palladium and platinum, results in a flattening of the
Metallurgy of Gold | Chapter 3 42
reflectivity curve. Controlling the addition of the various elements, the color of gold alloys can be
modified generating a huge range of different coloration dependent on the caratage of the alloys,
figure 3.17. For example, the addition of zinc to the main alloying elements, Ag and Cu, shifts Cu-
rich phase color from reddish to dark yellow.
In order to make easier the qualitative color characterization and comparison, defined range of
composition and color was developed and distributed, besides, other methods for quantitative color
measurement was improved and applied [49].
3.4.2 White Gold
For the lower carat gold alloys (8 Kt and 9 Kt), the whitish color is achieved using very high Ag
contents while, for the higher caratage, Ni and Pd are the most common elements added to the gold
alloys. They are introduced as lower-cost alternative to platinum jewelry, despite Ni has problems
related to skin allergy and Pd remains a quite expensive elements to use in large amounts [50].
The most common systems used for the base of these alloys are the Au-Ni-Ag-Zn or Au-Pd-Ag-Zn
systems, Cu is introduced only for guarantee a little improve in workability.
The Pd - based white gold alloys are characterized by a more grayish – white color, in comparison
to the Ni – based alloys recognized for the cold white color. The behavior of these two white gold
alloys, during the industrial processing, is substantially different. The Pd – based alloys are difficult
to melt, due to the high melting point of this element and the high reactivity with crucible and
mould’s graphite, but are quite soft and workable. Whereas the Ni – based white gold alloys, are
easy to cast but are characterized by higher values of hardness with a decrease in workability.
As mentioned before, the European legislation and the attention for skin allergies, for Ni, and the
much expensive use of Pd, restricting the addition of these elements in jewelry alloys. Owing to
these limits, a large variety of white gold alloys made with other elements, such as Co, Mn, Fe, Ga
and Cr, are developed [51]. However, probably due to the poor white color or the degradation of the
working properties of these new alloys, the use of the common alloys with a reduction in addition of
Ni and Pd remains widespread. Only for particular fields of application, or high quality sectors,
alloys with high content of Pd (with the addition, further, of Ni and Pt) are used in order to
guarantee a suitable whiteness [52].
The presence of white gold alloys with high differences in the base color leads to the definition of
the reference color, based on yellowness index. Nowadays, a galvanic process with rhodium is used
to plate all the white gold jewelry produced, in order to achieve a brilliant white color of surface.
This coating, however, covers the real, too often poor, color of the base material. This standard
Metallurgy of Gold | Chapter 3 43
index allows to divide the white gold alloys in different categories: premium, standard, off-white
and non-white).
The dental sector represents an exception, because the use of high content of Pd and Pt is used not
to bring out the color, but to increase the melting point making viable the ceramic firing process
without degrading the properties of the metal part.
The additions to these dental alloys, of base metal such Zn, Sn, In and Ga (from 0.1 to 3 wt%), are
used in order to improve the investment casting properties.
3.4.3 Special Color of Gold
The whole color spectrum can be obtained as result from optical interference between the light and
the nature or the thickness of coating applied to gold alloys. Special colors can be realized by the
formation of particular oxides (or other material layers) on the surface of the products, using
chemical or thermal treatments [53]. The possibility of varying color or reproducing a large number
of shades is important for jewelry application. However, this approach leads to a coating
characterized by a low wear resistance, a discoloration in short time and some difficult in process
realization, due to the use of particular alloys (as base for the oxide formation) rich in Co, Cr, Fe or
Mn content.
Some special color, like purple and blue, are obtained alloying gold with other metals, respecting a
well-defined stoichiometric composition. The particular color derived from the precipitation of
intermetallic compounds with particular electron band structures. An absorption for particular range
of the light occurs, while all the rest is reflected. These intermetallic compounds are respectively,
AuAl2 for the purple color, AuIn2 and AuGa2 for the blue color.
The best known among these compounds is AuAl2, which is formed at 79 wt% Au and 21 wt% Al.
The melting point of this compound is higher than its constituents, indicating its higher
thermodynamic stability. The purple colour do not change for content of Al higher than 15wt%
[54]. However, this phase is the final equilibrium phase. In fact, Au2Al and Au5Al2 form first in the
binary system [16]. This intermetallic form, however, is characterized by an intrinsic brittleness that
limits its use. In order to avoid the problem of fragility, several alternative manufacturing process
and alloy additions were investigated [53]. The introduction of ~ 3 wt% of Pd, Ni or Cu, for
example, increase the workability of the gold alloy probably due to the formation of ductile second
phases. It was demonstrated that, a rapid quenching and the addition of a little content of Si+Co into
the gold alloy, reduces the grain size of two order of magnitude (reaching ~ 5 µm), with a change
from brittle to ductile of the fracture [55].
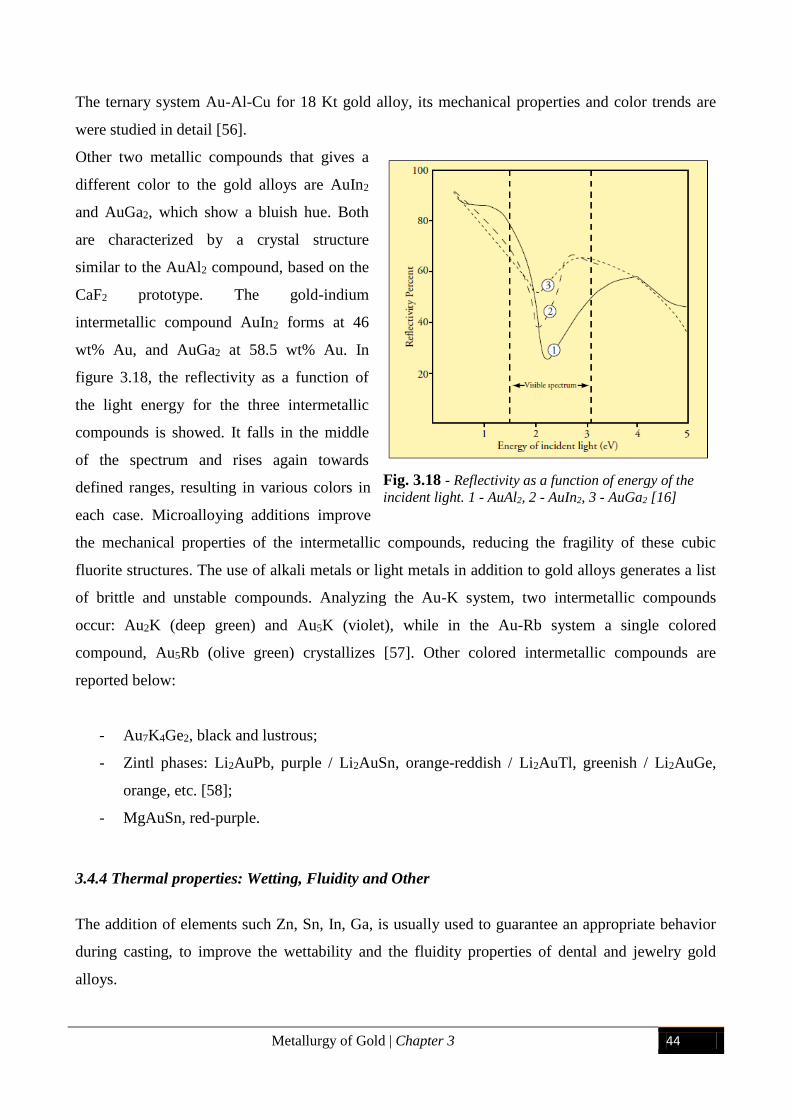
Metallurgy of Gold | Chapter 3 44
The ternary system Au-Al-Cu for 18 Kt gold alloy, its mechanical properties and color trends are
were studied in detail [56].
Other two metallic compounds that gives a
different color to the gold alloys are AuIn2
and AuGa2, which show a bluish hue. Both
are characterized by a crystal structure
similar to the AuAl2 compound, based on the
CaF2 prototype. The gold-indium
intermetallic compound AuIn2 forms at 46
wt% Au, and AuGa2 at 58.5 wt% Au. In
figure 3.18, the reflectivity as a function of
the light energy for the three intermetallic
compounds is showed. It falls in the middle
of the spectrum and rises again towards
defined ranges, resulting in various colors in
each case. Microalloying additions improve
the mechanical properties of the intermetallic compounds, reducing the fragility of these cubic
fluorite structures. The use of alkali metals or light metals in addition to gold alloys generates a list
of brittle and unstable compounds. Analyzing the Au-K system, two intermetallic compounds
occur: Au2K (deep green) and Au5K (violet), while in the Au-Rb system a single colored
compound, Au5Rb (olive green) crystallizes [57]. Other colored intermetallic compounds are
reported below:
- Au7K4Ge2, black and lustrous;
- Zintl phases: Li2AuPb, purple / Li2AuSn, orange-reddish / Li2AuTl, greenish / Li2AuGe,
orange, etc. [58];
- MgAuSn, red-purple.
3.4.4 Thermal properties: Wetting, Fluidity and Other
The addition of elements such Zn, Sn, In, Ga, is usually used to guarantee an appropriate behavior
during casting, to improve the wettability and the fluidity properties of dental and jewelry gold
alloys.
Fig. 3.18 - Reflectivity as a function of energy of the
incident light. 1 - AuAl2, 2 - AuIn2, 3 - AuGa2 [16]
Metallurgy of Gold | Chapter 3 45
Interfacial tension decreased rapidly with additions of less than 0.5 wt% zinc, but the rate of
decrease fell significantly with zinc additions of more than 1.5 wt%.
The addiction of zinc, with the reduction of interfacial tension, improves the surface quality of the
product [59]. Zn decreases the probability of dendritic surface structure formation, often observed
on articles cast in a reducing or inert atmosphere, reducing the roughness of the final surface.
The use of elements with high affinity for oxygen causes the loss of them from the gold alloy to a
slag formed, especially, during re-melting or re-casting processes. Establish the proper content of
addition is complicated. The use of low-melting elements allows to decrease the liquidus
temperatures but, also, the solidus temperatures of alloys, with an increase of the width of the
melting range. This increases the risk of segregation during solidification phase, and the formation
of low-melting compounds leads to embrittlement during plastic deformation.
P, S, Pb and B generates the same undesired effect.
These elements can give to the alloys many benefits but require a well-defined preparation step,
ensuring the suitable distribution of the additions and the right dosage for each application. Usually,
nowadays, prepared master alloys are used, containing particular percentage of grain refiners.
The additions of Zn and Si to gold alloys have not a relevant influence on the heat of solidification
and on thermal conductivities, while the modifications that these additions generate to the
characteristics of the melting range are not negligible.
The differences in melting range and heat of solidification, combined with the various values of
thermal conductivities for 18 Kt yellow, red and white gold alloys, can explain the high
susceptibility to shrinkage porosity of these alloys.
As seen before, the additions of Zn, In and Sn result necessary for the formation of thin surface
layers in metal-ceramic applications, which are the base for a suitable bond between the metal
surface and the ceramic [60].
Nowadays, the above constituents are added in large amount in gold soldering and brazing alloys,
used in dental and jewelry applications, due to their capability to reduce the surface tension,
lowering the melting range and increase the wettability. Only Cd is no longer used because of its
high toxicity.
Other elements used, in the industrial applications, are Si, Ge and Sn.
Soldering alloys thus created are based on eutectic compositions, in the binary and ternary systems
of these low-melting elements, and are the basis for bulk metallic glass alloys [61].
Several thermodynamic models of multiple component alloys are developed with the aim to study
and predict important thermal alloy properties, improving alloys for casting, brazing or soldering
and optimizing heat treatments and deformation processes in the industrial production cycles.
The Technology of Jewelry Manufacturing | Chapter 4 46
Chapter 4
The Technology of Jewelry Manufacturing
4.1 INTRODUCTION
Gold was one of the first metals discovered, its beauty, color, sheen and rareness makes it suitable
for artifacts and adornment realization. The rich colour, its malleability and the high resistance to
oxidation made it useful material for jewelry applications. A greater part of the technologies
adopted nowadays, derive from the early ages of gold, for example, over 6000 years ago the
investment casting was developed in the Middle East.
The first gold alloys, with copper as additive, was created around 4000 years ago; the refining
processes of impure gold, instead, date back to 2500 years ago. The use of soldering, brazing and
welding processes was attributed to the Egyptian populations in ca. 1350 BC.
However, the use of gold as a valuable material for economic exchanges was developed in the 7th
century BC in Asia Minor and this is, also, the first time that appears the assaying method to
certificate the purity of the coinage. With the aim to avoid the danger of fraud, by debasing precious
metal, the need for hallmarking of jewelry became necessary about 700 years ago; so, in London,
the oldest consumer protection legislation was created. The term “hallmark” was born in the
London Assay Office, where the jewelry items were assayed and hallmarked. The first testimonials
regarding the use of gold in medicine refer to dental applications, index of the affirmed ability to
manipulate and shape pure gold or gold alloy, since ancient times.
4.2 CURRENT MANUFACTURE
Nowadays, a large part of the jewelry artifacts is still produced in traditional workshop, where the
goldsmith, using its craft knowledge and approaches, limits the use of modern equipment and
scientific investigation. This leads to a low design innovation, a large manual labor and a low
production efficiency and repeatability, resulting in a time-consuming production technique.
However, with the increase of the world demand for jewelry items, the industrial mass production
adopted a new trend, based on modern machines, improving quality, velocity and productivity.
The adoption of massive production leads to a decrease of the labor costs and, besides, this modern
technique allows guaranteeing compliance on the fineness, health, safety and environment
standards.
The Technology of Jewelry Manufacturing | Chapter 4 47
For outsiders to the jeweler sector, it may seem that, over years, the jewelry manufacturing has not
changed much. Nevertheless, only analyzing the manufacture sites, it possible to notice that these
shift from the West to the East, probably due to the lower costs. The customer’s demand and the
expectations on the quality and design changed. This, combined with the introduction of other
luxury goods into the world stage, increased the pressure on the jewelry manufacturing industry. All
of this caused profound modifies on the approach and the methods of industrial jewelry production.
The major driver for change in jewelry is the cost competitiveness, depending on the increasing
internalization. The consumer is increasingly demanding innovative jewelry design, improving the
develop of new superficial effects and decorative material. Other decisive factors for the goldsmith
company are:
- the production’s velocity and the efficiency, in order to get to market rapidly and take the
bigger awards;
- The respect of the pollution standards;
- The scrupulous control imposed by hallmarking and similar regulations on export.
These factors have led to large improve in quality control, safety technology and suitable
production approaches, with a particular attention to the product differentiation in the market and to
the customer requirements. In order to guarantee these new objectives of the jeweler sector, more
sophisticated quality assurance and production systems were developed and optimized [48].
4.3 MAIN JEWELRY TECHNOLOGIES [48]
The improvement of jewelry alloys and the introduction of modern techniques of fabrication, in
jewelry manufacturing, were developed at the same time. Here, for example, some of the major
modern production technologies are listed and, afterwards, illustrated:
Cold forming technologies ( stamping and other),
Electroforming,
Investment casting,
Hollow-ware,
Chain-making,
Joining techniques,
Finishing,
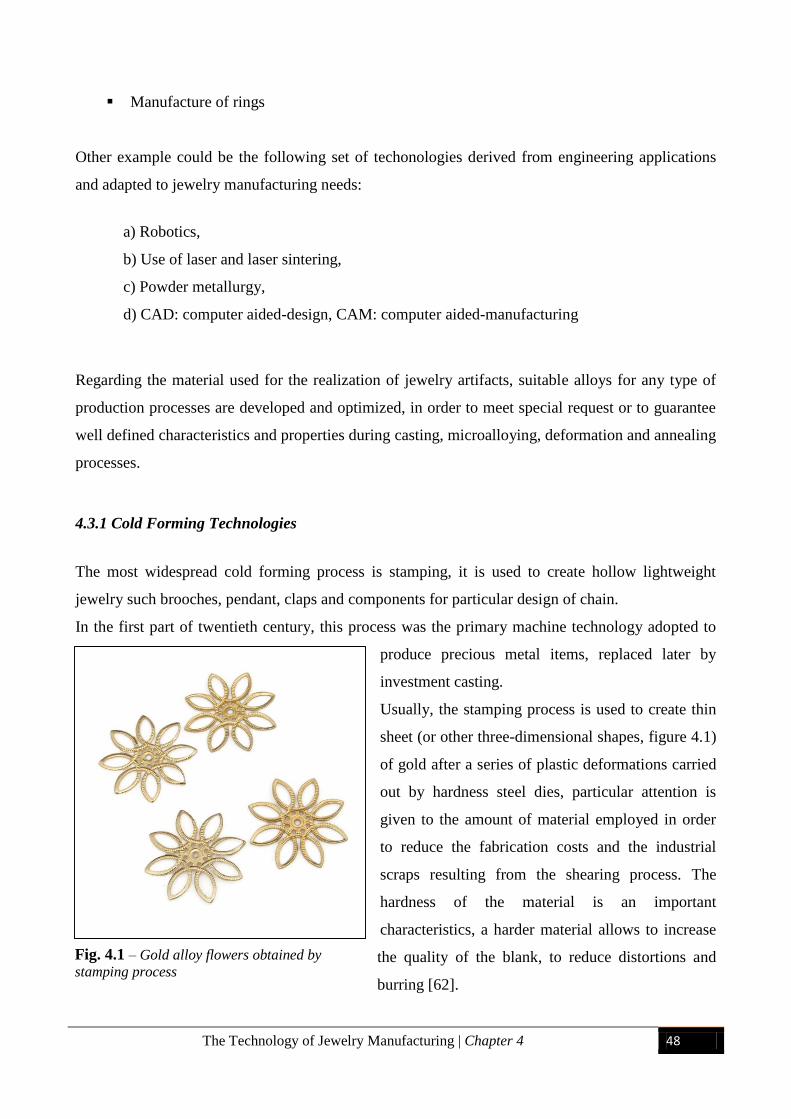
The Technology of Jewelry Manufacturing | Chapter 4 48
Manufacture of rings
Other example could be the following set of techonologies derived from engineering applications
and adapted to jewelry manufacturing needs:
a) Robotics,
b) Use of laser and laser sintering,
c) Powder metallurgy,
d) CAD: computer aided-design, CAM: computer aided-manufacturing
Regarding the material used for the realization of jewelry artifacts, suitable alloys for any type of
production processes are developed and optimized, in order to meet special request or to guarantee
well defined characteristics and properties during casting, microalloying, deformation and annealing
processes.
4.3.1 Cold Forming Technologies
The most widespread cold forming process is stamping, it is used to create hollow lightweight
jewelry such brooches, pendant, claps and components for particular design of chain.
In the first part of twentieth century, this process was the primary machine technology adopted to
produce precious metal items, replaced later by
investment casting.
Usually, the stamping process is used to create thin
sheet (or other three-dimensional shapes, figure 4.1)
of gold after a series of plastic deformations carried
out by hardness steel dies, particular attention is
given to the amount of material employed in order
to reduce the fabrication costs and the industrial
scraps resulting from the shearing process. The
hardness of the material is an important
characteristics, a harder material allows to increase
the quality of the blank, to reduce distortions and
burring [62].
Fig. 4.1 – Gold alloy flowers obtained by
stamping process
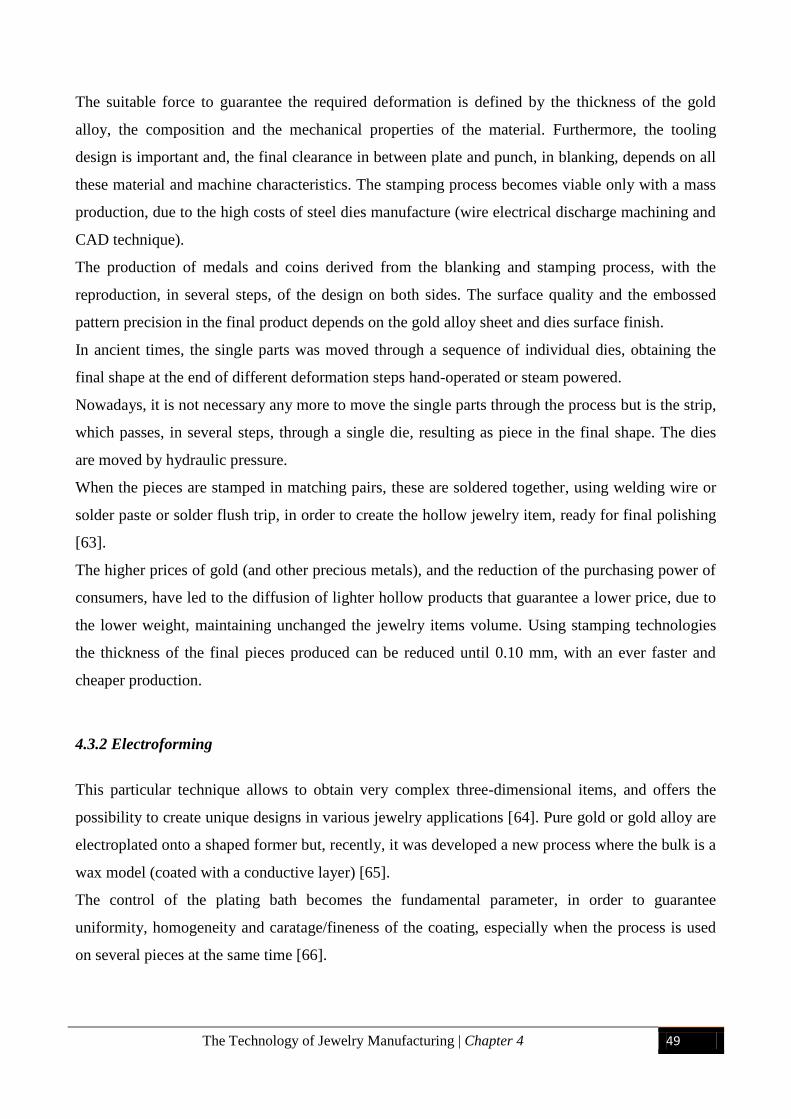
The Technology of Jewelry Manufacturing | Chapter 4 49
The suitable force to guarantee the required deformation is defined by the thickness of the gold
alloy, the composition and the mechanical properties of the material. Furthermore, the tooling
design is important and, the final clearance in between plate and punch, in blanking, depends on all
these material and machine characteristics. The stamping process becomes viable only with a mass
production, due to the high costs of steel dies manufacture (wire electrical discharge machining and
CAD technique).
The production of medals and coins derived from the blanking and stamping process, with the
reproduction, in several steps, of the design on both sides. The surface quality and the embossed
pattern precision in the final product depends on the gold alloy sheet and dies surface finish.
In ancient times, the single parts was moved through a sequence of individual dies, obtaining the
final shape at the end of different deformation steps hand-operated or steam powered.
Nowadays, it is not necessary any more to move the single parts through the process but is the strip,
which passes, in several steps, through a single die, resulting as piece in the final shape. The dies
are moved by hydraulic pressure.
When the pieces are stamped in matching pairs, these are soldered together, using welding wire or
solder paste or solder flush trip, in order to create the hollow jewelry item, ready for final polishing
[63].
The higher prices of gold (and other precious metals), and the reduction of the purchasing power of
consumers, have led to the diffusion of lighter hollow products that guarantee a lower price, due to
the lower weight, maintaining unchanged the jewelry items volume. Using stamping technologies
the thickness of the final pieces produced can be reduced until 0.10 mm, with an ever faster and
cheaper production.
4.3.2 Electroforming
This particular technique allows to obtain very complex three-dimensional items, and offers the
possibility to create unique designs in various jewelry applications [64]. Pure gold or gold alloy are
electroplated onto a shaped former but, recently, it was developed a new process where the bulk is a
wax model (coated with a conductive layer) [65].
The control of the plating bath becomes the fundamental parameter, in order to guarantee
uniformity, homogeneity and caratage/fineness of the coating, especially when the process is used
on several pieces at the same time [66].
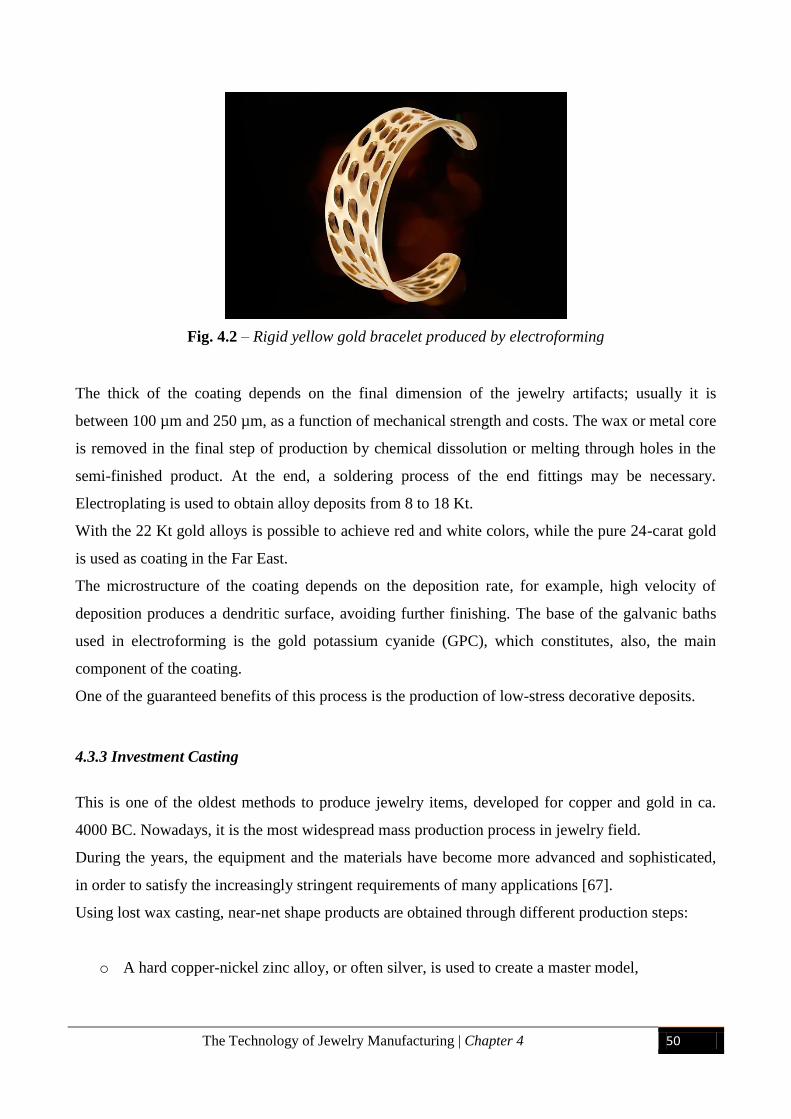
The Technology of Jewelry Manufacturing | Chapter 4 50
Fig. 4.2 – Rigid yellow gold bracelet produced by electroforming
The thick of the coating depends on the final dimension of the jewelry artifacts; usually it is
between 100 µm and 250 µm, as a function of mechanical strength and costs. The wax or metal core
is removed in the final step of production by chemical dissolution or melting through holes in the
semi-finished product. At the end, a soldering process of the end fittings may be necessary.
Electroplating is used to obtain alloy deposits from 8 to 18 Kt.
With the 22 Kt gold alloys is possible to achieve red and white colors, while the pure 24-carat gold
is used as coating in the Far East.
The microstructure of the coating depends on the deposition rate, for example, high velocity of
deposition produces a dendritic surface, avoiding further finishing. The base of the galvanic baths
used in electroforming is the gold potassium cyanide (GPC), which constitutes, also, the main
component of the coating.
One of the guaranteed benefits of this process is the production of low-stress decorative deposits.
4.3.3 Investment Casting
This is one of the oldest methods to produce jewelry items, developed for copper and gold in ca.
4000 BC. Nowadays, it is the most widespread mass production process in jewelry field.
During the years, the equipment and the materials have become more advanced and sophisticated,
in order to satisfy the increasingly stringent requirements of many applications [67].
Using lost wax casting, near-net shape products are obtained through different production steps:
o A hard copper-nickel zinc alloy, or often silver, is used to create a master model,
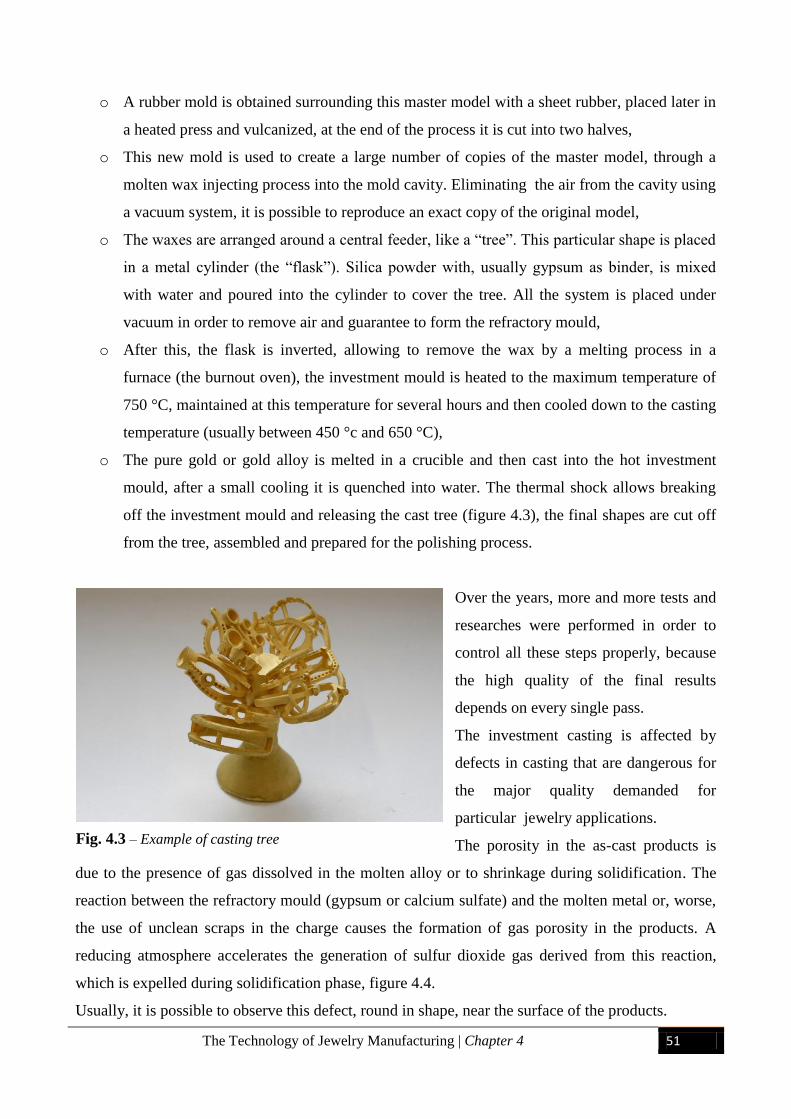
The Technology of Jewelry Manufacturing | Chapter 4 51
o A rubber mold is obtained surrounding this master model with a sheet rubber, placed later in
a heated press and vulcanized, at the end of the process it is cut into two halves,
o This new mold is used to create a large number of copies of the master model, through a
molten wax injecting process into the mold cavity. Eliminating the air from the cavity using
a vacuum system, it is possible to reproduce an exact copy of the original model,
o The waxes are arranged around a central feeder, like a “tree”. This particular shape is placed
in a metal cylinder (the “flask”). Silica powder with, usually gypsum as binder, is mixed
with water and poured into the cylinder to cover the tree. All the system is placed under
vacuum in order to remove air and guarantee to form the refractory mould,
o After this, the flask is inverted, allowing to remove the wax by a melting process in a
furnace (the burnout oven), the investment mould is heated to the maximum temperature of
750 °C, maintained at this temperature for several hours and then cooled down to the casting
temperature (usually between 450 °c and 650 °C),
o The pure gold or gold alloy is melted in a crucible and then cast into the hot investment
mould, after a small cooling it is quenched into water. The thermal shock allows breaking
off the investment mould and releasing the cast tree (figure 4.3), the final shapes are cut off
from the tree, assembled and prepared for the polishing process.
Over the years, more and more tests and
researches were performed in order to
control all these steps properly, because
the high quality of the final results
depends on every single pass.
The investment casting is affected by
defects in casting that are dangerous for
the major quality demanded for
particular jewelry applications.
The porosity in the as-cast products is
due to the presence of gas dissolved in the molten alloy or to shrinkage during solidification. The
reaction between the refractory mould (gypsum or calcium sulfate) and the molten metal or, worse,
the use of unclean scraps in the charge causes the formation of gas porosity in the products. A
reducing atmosphere accelerates the generation of sulfur dioxide gas derived from this reaction,
which is expelled during solidification phase, figure 4.4.
Usually, it is possible to observe this defect, round in shape, near the surface of the products.
Fig. 4.3 – Example of casting tree
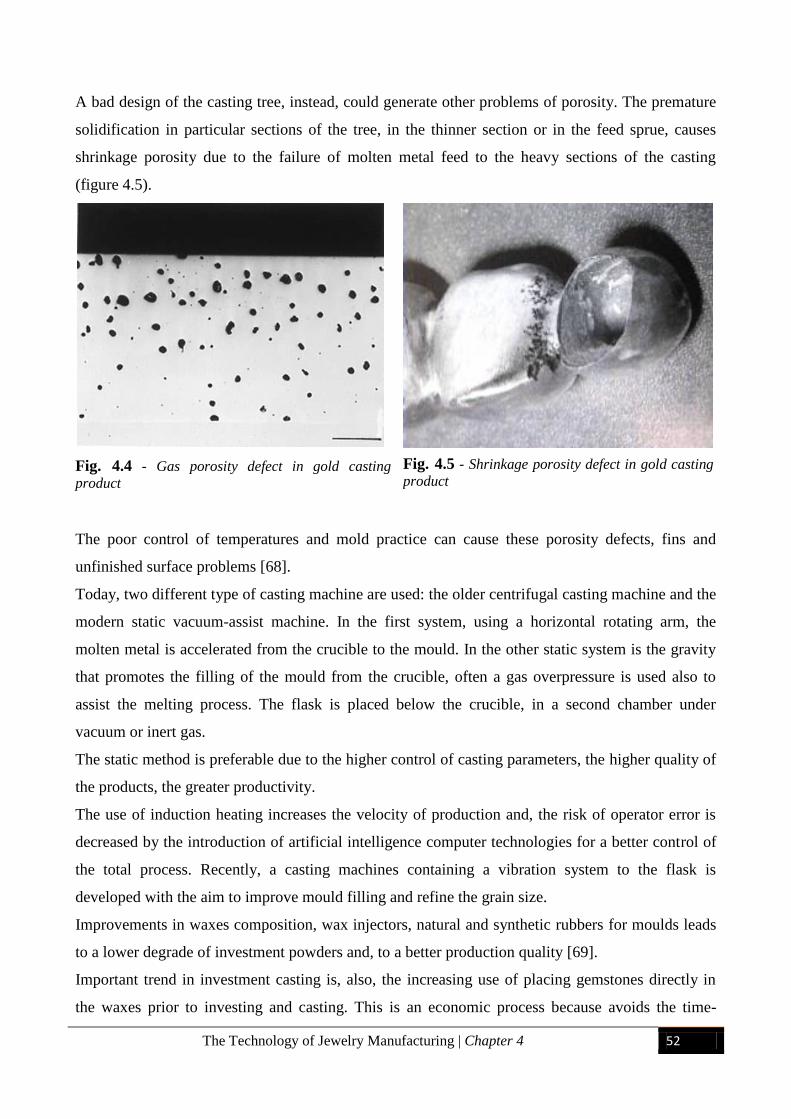
The Technology of Jewelry Manufacturing | Chapter 4 52
A bad design of the casting tree, instead, could generate other problems of porosity. The premature
solidification in particular sections of the tree, in the thinner section or in the feed sprue, causes
shrinkage porosity due to the failure of molten metal feed to the heavy sections of the casting
(figure 4.5).
Fig. 4.4 - Gas porosity defect in gold casting
product
The poor control of temperatures and mold practice can cause these porosity defects, fins and
unfinished surface problems [68].
Today, two different type of casting machine are used: the older centrifugal casting machine and the
modern static vacuum-assist machine. In the first system, using a horizontal rotating arm, the
molten metal is accelerated from the crucible to the mould. In the other static system is the gravity
that promotes the filling of the mould from the crucible, often a gas overpressure is used also to
assist the melting process. The flask is placed below the crucible, in a second chamber under
vacuum or inert gas.
The static method is preferable due to the higher control of casting parameters, the higher quality of
the products, the greater productivity.
The use of induction heating increases the velocity of production and, the risk of operator error is
decreased by the introduction of artificial intelligence computer technologies for a better control of
the total process. Recently, a casting machines containing a vibration system to the flask is
developed with the aim to improve mould filling and refine the grain size.
Improvements in waxes composition, wax injectors, natural and synthetic rubbers for moulds leads
to a lower degrade of investment powders and, to a better production quality [69].
Important trend in investment casting is, also, the increasing use of placing gemstones directly in
the waxes prior to investing and casting. This is an economic process because avoids the time-
Fig. 4.5 - Shrinkage porosity defect in gold casting
product
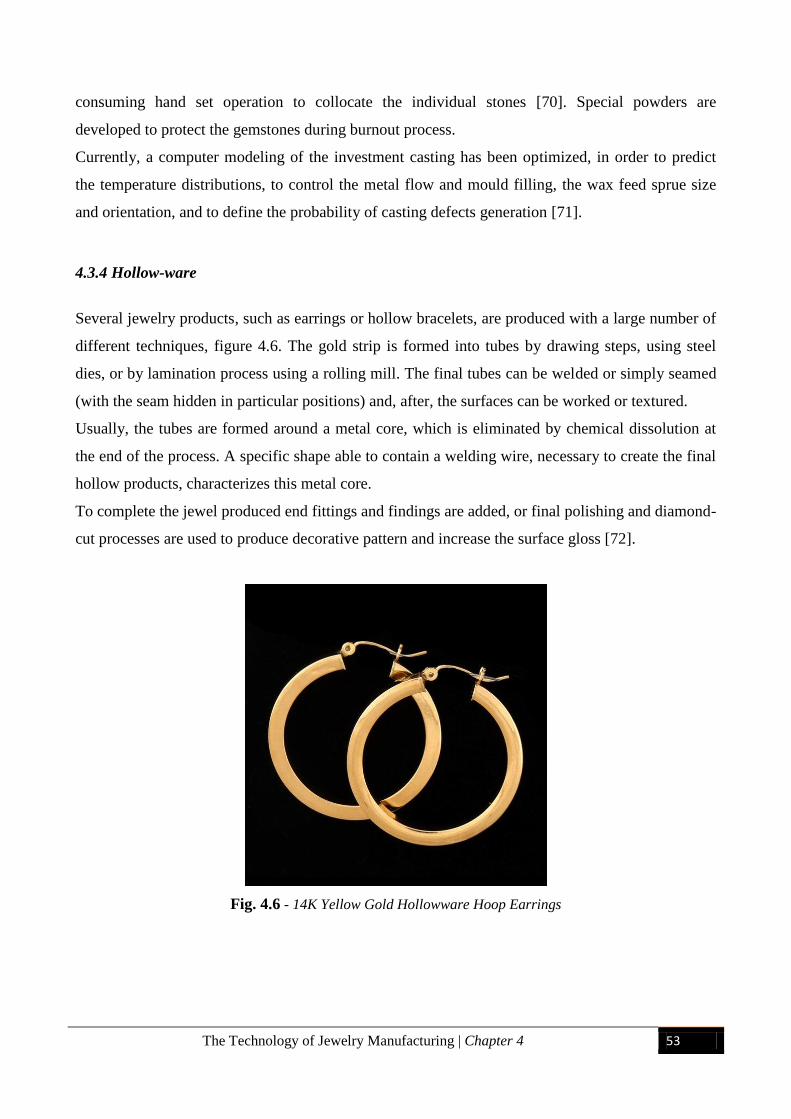
The Technology of Jewelry Manufacturing | Chapter 4 53
consuming hand set operation to collocate the individual stones [70]. Special powders are
developed to protect the gemstones during burnout process.
Currently, a computer modeling of the investment casting has been optimized, in order to predict
the temperature distributions, to control the metal flow and mould filling, the wax feed sprue size
and orientation, and to define the probability of casting defects generation [71].
4.3.4 Hollow-ware
Several jewelry products, such as earrings or hollow bracelets, are produced with a large number of
different techniques, figure 4.6. The gold strip is formed into tubes by drawing steps, using steel
dies, or by lamination process using a rolling mill. The final tubes can be welded or simply seamed
(with the seam hidden in particular positions) and, after, the surfaces can be worked or textured.
Usually, the tubes are formed around a metal core, which is eliminated by chemical dissolution at
the end of the process. A specific shape able to contain a welding wire, necessary to create the final
hollow products, characterizes this metal core.
To complete the jewel produced end fittings and findings are added, or final polishing and diamond-
cut processes are used to produce decorative pattern and increase the surface gloss [72].
Fig. 4.6 - 14K Yellow Gold Hollowware Hoop Earrings
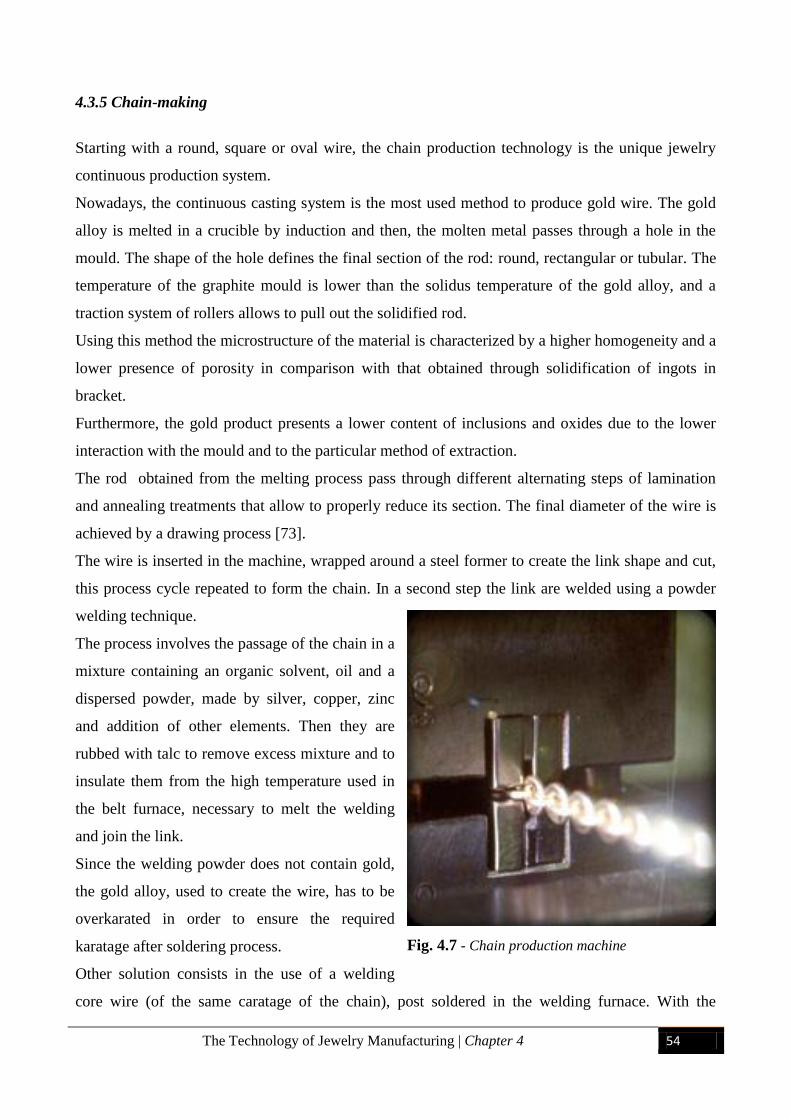
The Technology of Jewelry Manufacturing | Chapter 4 54
4.3.5 Chain-making
Starting with a round, square or oval wire, the chain production technology is the unique jewelry
continuous production system.
Nowadays, the continuous casting system is the most used method to produce gold wire. The gold
alloy is melted in a crucible by induction and then, the molten metal passes through a hole in the
mould. The shape of the hole defines the final section of the rod: round, rectangular or tubular. The
temperature of the graphite mould is lower than the solidus temperature of the gold alloy, and a
traction system of rollers allows to pull out the solidified rod.
Using this method the microstructure of the material is characterized by a higher homogeneity and a
lower presence of porosity in comparison with that obtained through solidification of ingots in
bracket.
Furthermore, the gold product presents a lower content of inclusions and oxides due to the lower
interaction with the mould and to the particular method of extraction.
The rod obtained from the melting process pass through different alternating steps of lamination
and annealing treatments that allow to properly reduce its section. The final diameter of the wire is
achieved by a drawing process [73].
The wire is inserted in the machine, wrapped around a steel former to create the link shape and cut,
this process cycle repeated to form the chain. In a second step the link are welded using a powder
welding technique.
The process involves the passage of the chain in a
mixture containing an organic solvent, oil and a
dispersed powder, made by silver, copper, zinc
and addition of other elements. Then they are
rubbed with talc to remove excess mixture and to
insulate them from the high temperature used in
the belt furnace, necessary to melt the welding
and join the link.
Since the welding powder does not contain gold,
the gold alloy, used to create the wire, has to be
overkarated in order to ensure the required
karatage after soldering process.
Other solution consists in the use of a welding
core wire (of the same caratage of the chain), post soldered in the welding furnace. With the
Fig. 4.7 - Chain production machine
The Technology of Jewelry Manufacturing | Chapter 4 55
introduction of the modern machine, laser in situ on the machine directly welds the link of the chain
[74].
The dimensional tolerance of the wire and its metallurgical and mechanical conditions are important
factors, they have to allow a suitable strength to cope with the stresses and the deformations
generated from the rolling and drawing processes; maintaining, however, a good ductility in order
to avoid the possibility of fractures [75].
Final decorations on chain surface can be added by diamond machining, the quality of the
processing is guarantee by the use of ice to fix the chain on large drums, in order to maintain the
same position during the all process.
Laser welding is used to create more complex chains, it is also possible to create hollow products by
the use of a metal core, often containing a welding wire. The thin gold sheet is wrapped around the
core, which is eliminated, at the end of the chain formation, through an industrial emptying process
using acids. With these methods, solid and hollow chains can be produced in all the color range and
caratage (from 8 Kt to 24 Kt) to satisfy the world markets demand.
4.3.6 Joining Techniques
These technologies continue to represent a fundamental process for joining the different component
into the final jewelry artifacts. Soldering and brazing, at temperatures below 450 °C, allow joining
the various parts of the final piece, using a welding alloy melted along the joint gap. Usually, a gas
torch is used to achieve the suitable temperature. Considering mass production system, such chain-
making production, the soldering process can be done in a belt furnace under controlled
atmosphere.
Welding alloys must guarantee, first, a suitable joint and then, they have to respect several
requirements:
The welding gold alloy has to present melting range lower than the liquidus temperature of
the gold alloys used to create the parts to be welded,
The diffusion at liquid-solid interface produces a strong bond and it occurs without the
melting of the parent metal parts,
The welding alloy has to be metallurgically and chemically compatible with the parent gold
alloy, and has to be characterized by a high fluidity and wettability, in order to avoid the
formation of brittle intermetallic compounds,
The Technology of Jewelry Manufacturing | Chapter 4 56
The solder alloy must have the same karatage of the gold alloy parts joined and, if possible,
a similar color, in order to hide the welding lines in the final jewelry piece.
The welding can be applied to the joint or in the form of wire or strip, that melts and wets the gap,
or as cut thin pieces of sheet placed in the gap before the heating process. The use of solder pastes is
much diffused, due to its several benefits such as the velocity of production, less rework post
soldering, costs reduced, etc. [76].
In the mass production jewelry process, the welding step is performed in a belt furnace, using the
solder alloy in the form of paste or present as solder flush sheet and solder filled parts. The part
surfaces are cleaned and degreased and the solder are placed in position before the introduction in
the furnace. The welding process performed in the furnace allows a better control of the
temperatures through the process and the uniform heating of the products.
Until today, the most common elements added to the alloy in order to achieve a low liquidus
temperature have been cadmium and zinc. The use of the first one was eliminated due to its toxicity,
it melts at 321 °C and boils at 767 °C reacting with air to form poisonous fume. The use of this
element in welding alloys was banned in many countries, regardless of the presence of absence of
good ventilation and exhaust system in the industrial workshops.
Other elements that are used to depress the melting range of the welding alloys are tin, gallium,
indium, germanium and silicon.
Generally, the welding alloys are divided in different categories due to their liquidus temperature,
from the lower melting range to the higher we find the “easy”, the “medium” and the “hard” grade
solder. However, this designation is not the same for all manufacturers and, its use is not progressed
by the industry.
Other alternative approaches to the soldering technique are:
- Laser welding: used in chain production and repair processes, avoids karatage and color
compliance problems,
- TIG welding,
- Electrical resistance welding,
- Diffusion bonding: this result is obtained, for machined components, using pressure and
heating under inert atmosphere for a suitable time. Multicolor rings are obtained with this
technique [77].
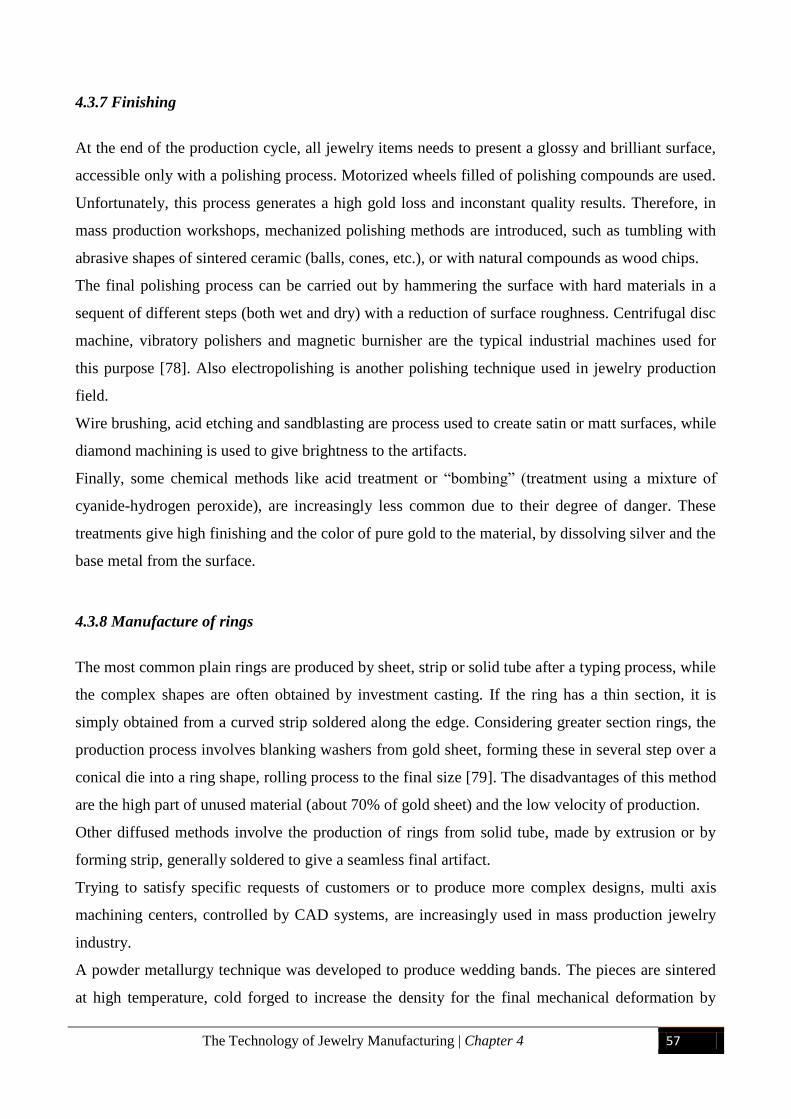
The Technology of Jewelry Manufacturing | Chapter 4 57
4.3.7 Finishing
At the end of the production cycle, all jewelry items needs to present a glossy and brilliant surface,
accessible only with a polishing process. Motorized wheels filled of polishing compounds are used.
Unfortunately, this process generates a high gold loss and inconstant quality results. Therefore, in
mass production workshops, mechanized polishing methods are introduced, such as tumbling with
abrasive shapes of sintered ceramic (balls, cones, etc.), or with natural compounds as wood chips.
The final polishing process can be carried out by hammering the surface with hard materials in a
sequent of different steps (both wet and dry) with a reduction of surface roughness. Centrifugal disc
machine, vibratory polishers and magnetic burnisher are the typical industrial machines used for
this purpose [78]. Also electropolishing is another polishing technique used in jewelry production
field.
Wire brushing, acid etching and sandblasting are process used to create satin or matt surfaces, while
diamond machining is used to give brightness to the artifacts.
Finally, some chemical methods like acid treatment or “bombing” (treatment using a mixture of
cyanide-hydrogen peroxide), are increasingly less common due to their degree of danger. These
treatments give high finishing and the color of pure gold to the material, by dissolving silver and the
base metal from the surface.
4.3.8 Manufacture of rings
The most common plain rings are produced by sheet, strip or solid tube after a typing process, while
the complex shapes are often obtained by investment casting. If the ring has a thin section, it is
simply obtained from a curved strip soldered along the edge. Considering greater section rings, the
production process involves blanking washers from gold sheet, forming these in several step over a
conical die into a ring shape, rolling process to the final size [79]. The disadvantages of this method
are the high part of unused material (about 70% of gold sheet) and the low velocity of production.
Other diffused methods involve the production of rings from solid tube, made by extrusion or by
forming strip, generally soldered to give a seamless final artifact.
Trying to satisfy specific requests of customers or to produce more complex designs, multi axis
machining centers, controlled by CAD systems, are increasingly used in mass production jewelry
industry.
A powder metallurgy technique was developed to produce wedding bands. The pieces are sintered
at high temperature, cold forged to increase the density for the final mechanical deformation by
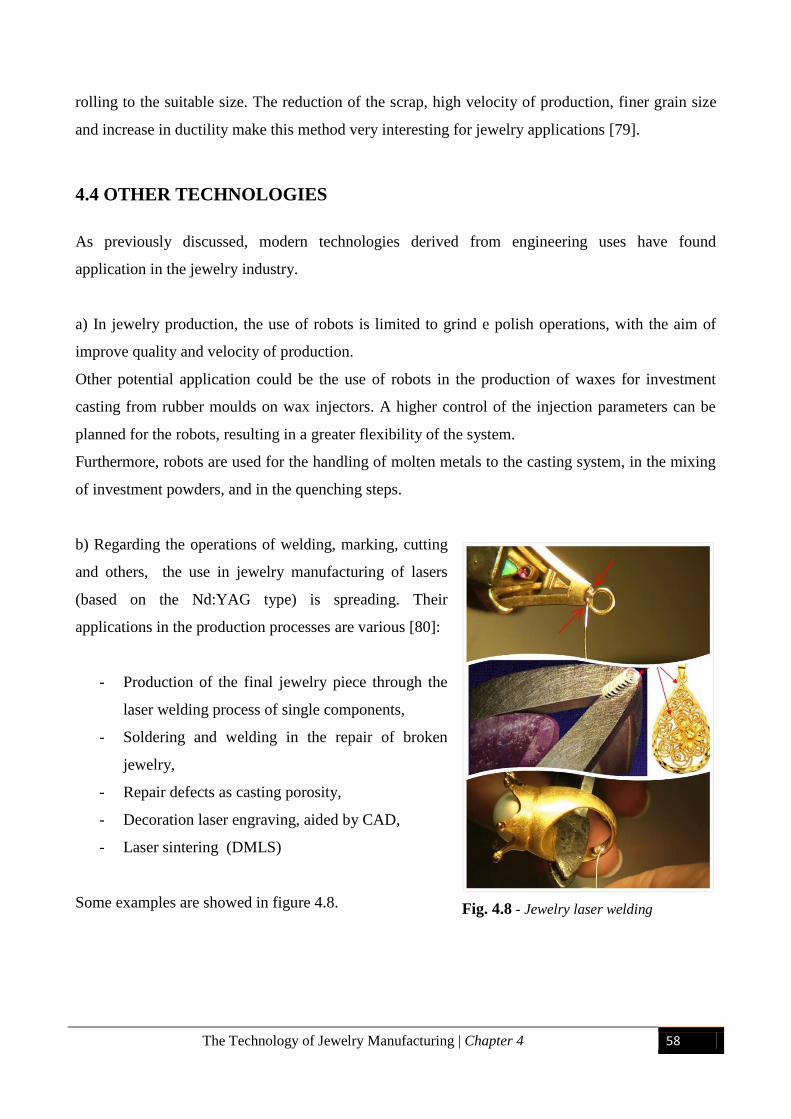
The Technology of Jewelry Manufacturing | Chapter 4 58
rolling to the suitable size. The reduction of the scrap, high velocity of production, finer grain size
and increase in ductility make this method very interesting for jewelry applications [79].
4.4 OTHER TECHNOLOGIES
As previously discussed, modern technologies derived from engineering uses have found
application in the jewelry industry.
a) In jewelry production, the use of robots is limited to grind e polish operations, with the aim of
improve quality and velocity of production.
Other potential application could be the use of robots in the production of waxes for investment
casting from rubber moulds on wax injectors. A higher control of the injection parameters can be
planned for the robots, resulting in a greater flexibility of the system.
Furthermore, robots are used for the handling of molten metals to the casting system, in the mixing
of investment powders, and in the quenching steps.
b) Regarding the operations of welding, marking, cutting
and others, the use in jewelry manufacturing of lasers
(based on the Nd:YAG type) is spreading. Their
applications in the production processes are various [80]:
- Production of the final jewelry piece through the
laser welding process of single components,
- Soldering and welding in the repair of broken
jewelry,
- Repair defects as casting porosity,
- Decoration laser engraving, aided by CAD,
- Laser sintering (DMLS)
Some examples are showed in figure 4.8.
Fig. 4.8 - Jewelry laser welding
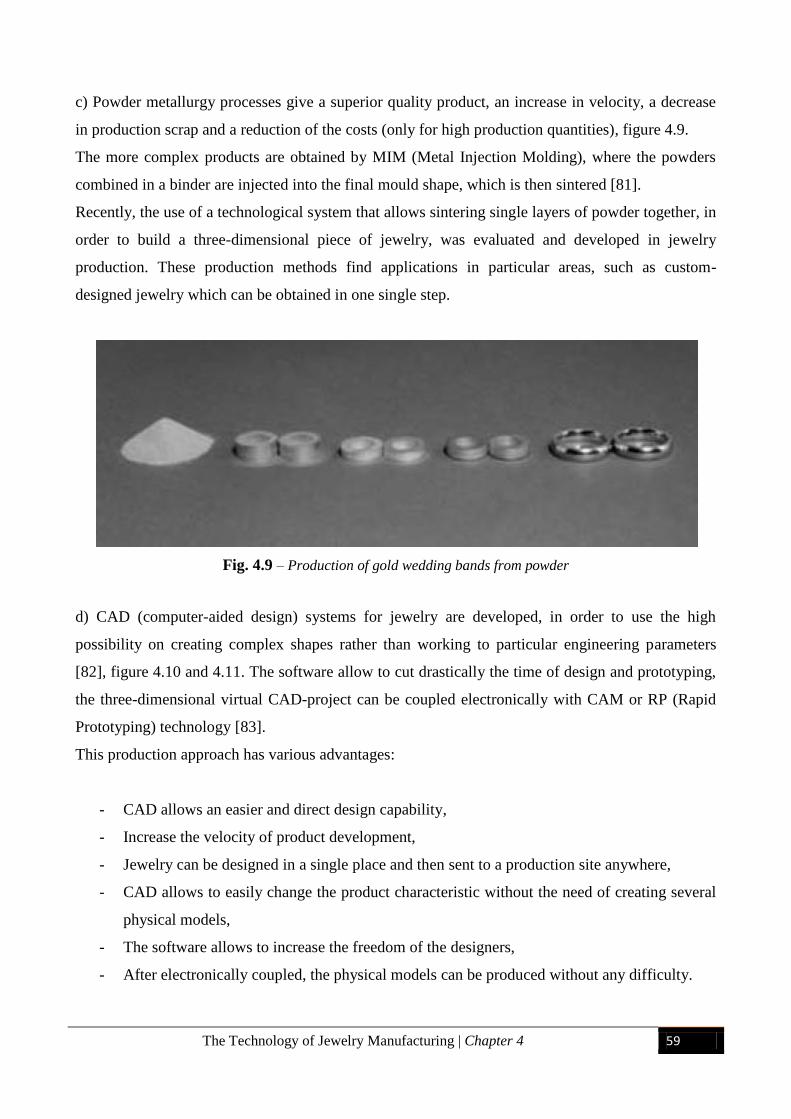
The Technology of Jewelry Manufacturing | Chapter 4 59
c) Powder metallurgy processes give a superior quality product, an increase in velocity, a decrease
in production scrap and a reduction of the costs (only for high production quantities), figure 4.9.
The more complex products are obtained by MIM (Metal Injection Molding), where the powders
combined in a binder are injected into the final mould shape, which is then sintered [81].
Recently, the use of a technological system that allows sintering single layers of powder together, in
order to build a three-dimensional piece of jewelry, was evaluated and developed in jewelry
production. These production methods find applications in particular areas, such as custom-
designed jewelry which can be obtained in one single step.
Fig. 4.9 – Production of gold wedding bands from powder
d) CAD (computer-aided design) systems for jewelry are developed, in order to use the high
possibility on creating complex shapes rather than working to particular engineering parameters
[82], figure 4.10 and 4.11. The software allow to cut drastically the time of design and prototyping,
the three-dimensional virtual CAD-project can be coupled electronically with CAM or RP (Rapid
Prototyping) technology [83].
This production approach has various advantages:
- CAD allows an easier and direct design capability,
- Increase the velocity of product development,
- Jewelry can be designed in a single place and then sent to a production site anywhere,
- CAD allows to easily change the product characteristic without the need of creating several
physical models,
- The software allows to increase the freedom of the designers,
- After electronically coupled, the physical models can be produced without any difficulty.
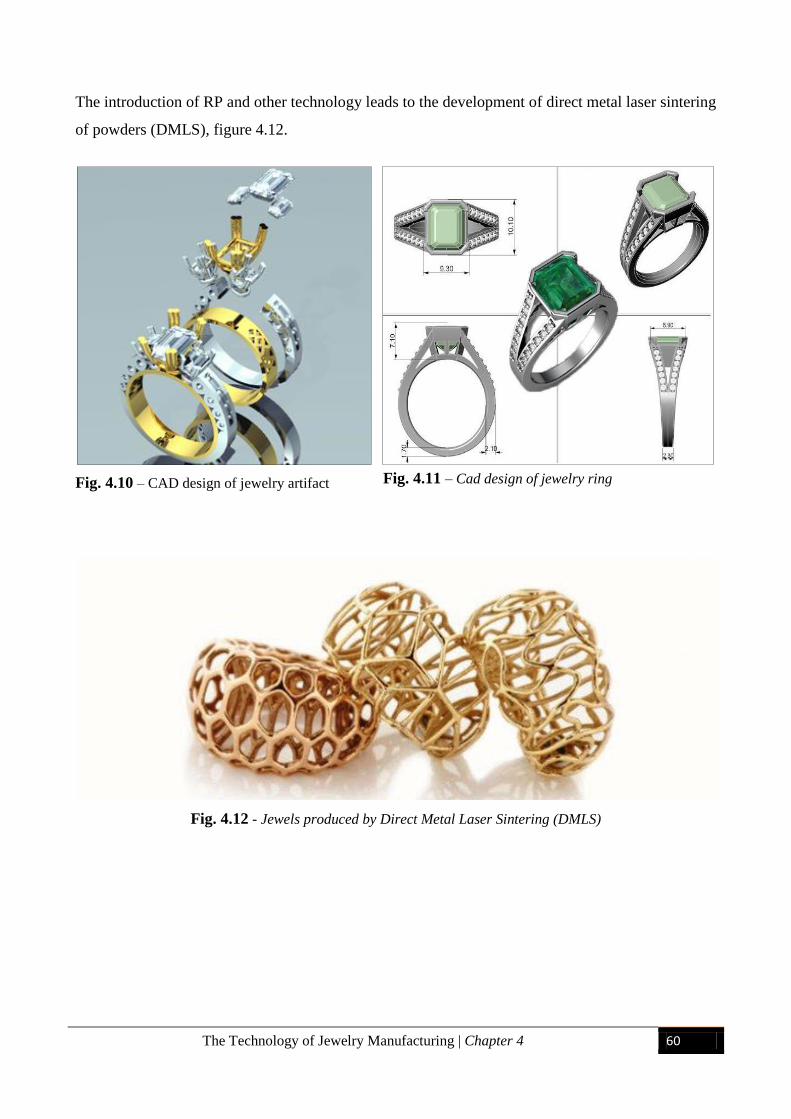
The Technology of Jewelry Manufacturing | Chapter 4 60
The introduction of RP and other technology leads to the development of direct metal laser sintering
of powders (DMLS), figure 4.12.
Fig. 4.10 – CAD design of jewelry artifact
Fig. 4.12 - Jewels produced by Direct Metal Laser Sintering (DMLS)
Fig. 4.11 – Cad design of jewelry ring

The Technology of Jewelry Manufacturing | Chapter 4 61
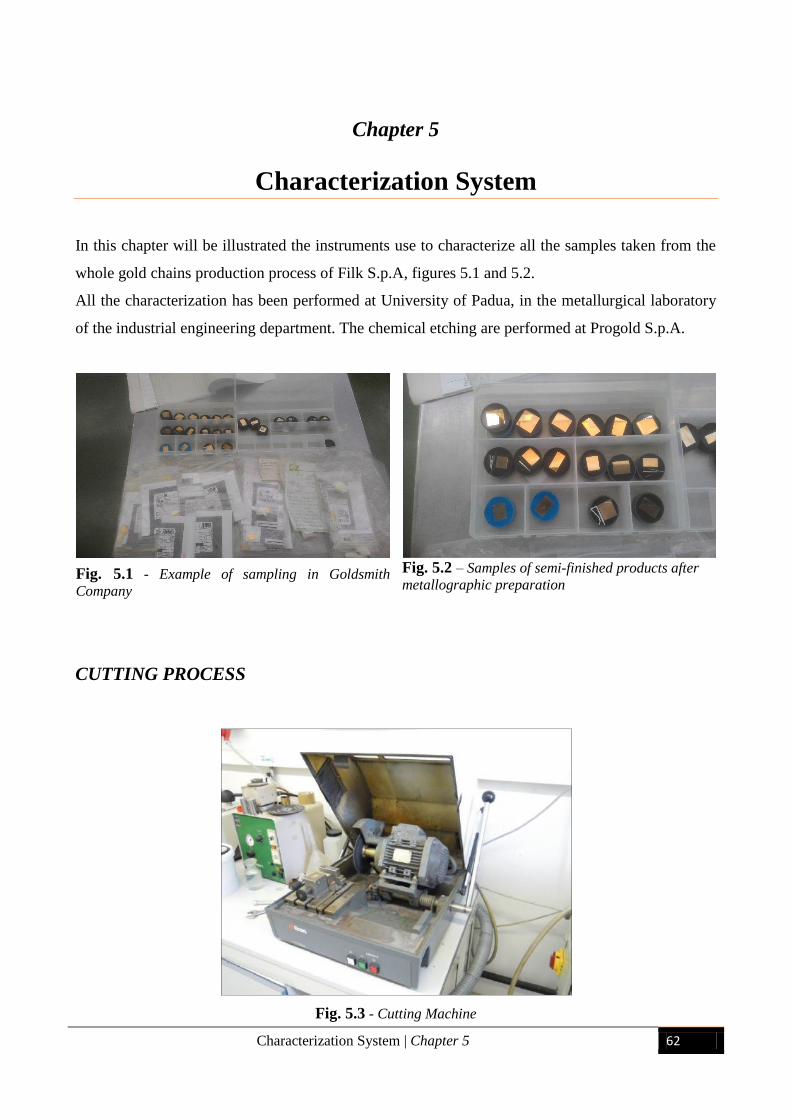
Characterization System | Chapter 5 62
Chapter 5
Characterization System
In this chapter will be illustrated the instruments use to characterize all the samples taken from the
whole gold chains production process of Filk S.p.A, figures 5.1 and 5.2.
All the characterization has been performed at University of Padua, in the metallurgical laboratory
of the industrial engineering department. The chemical etching are performed at Progold S.p.A.
CUTTING PROCESS
Fig. 5.3 - Cutting Machine
Fig. 5.2 – Samples of semi-finished products after
metallographic preparation Fig. 5.1 - Example of sampling in Goldsmith
Company
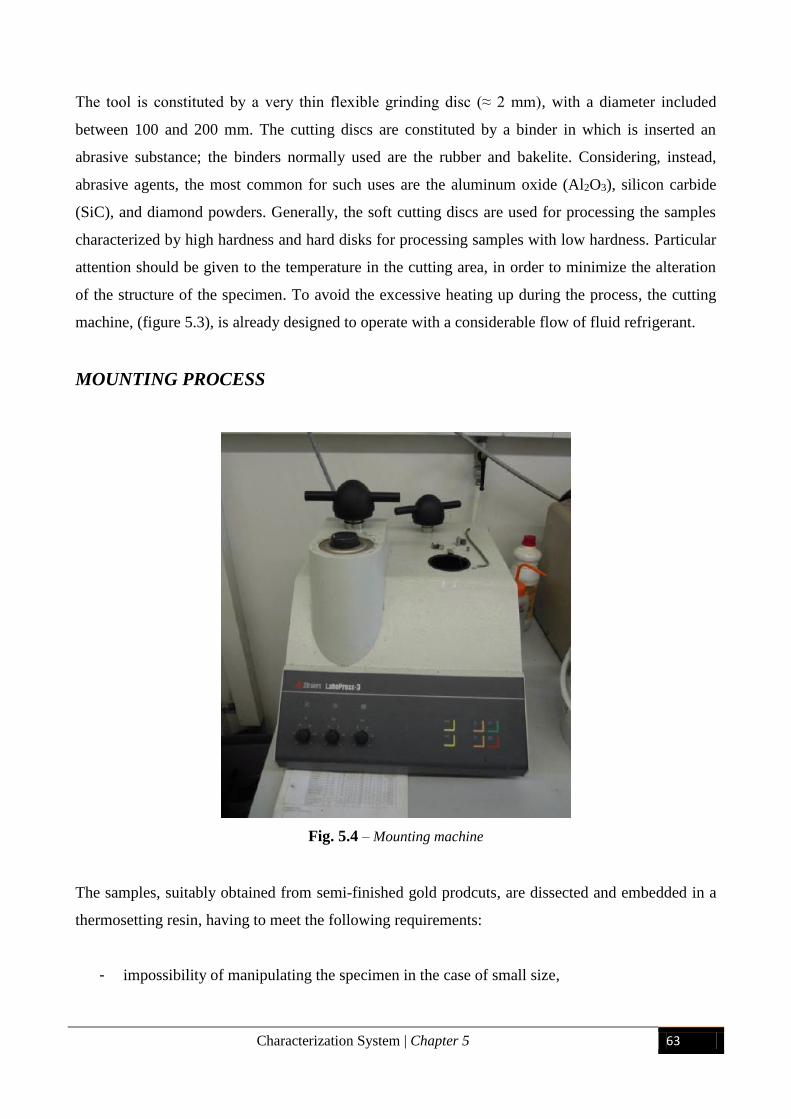
Characterization System | Chapter 5 63
The tool is constituted by a very thin flexible grinding disc (≈ 2 mm), with a diameter included
between 100 and 200 mm. The cutting discs are constituted by a binder in which is inserted an
abrasive substance; the binders normally used are the rubber and bakelite. Considering, instead,
abrasive agents, the most common for such uses are the aluminum oxide (Al2O3), silicon carbide
(SiC), and diamond powders. Generally, the soft cutting discs are used for processing the samples
characterized by high hardness and hard disks for processing samples with low hardness. Particular
attention should be given to the temperature in the cutting area, in order to minimize the alteration
of the structure of the specimen. To avoid the excessive heating up during the process, the cutting
machine, (figure 5.3), is already designed to operate with a considerable flow of fluid refrigerant.
MOUNTING PROCESS
Fig. 5.4 – Mounting machine
The samples, suitably obtained from semi-finished gold prodcuts, are dissected and embedded in a
thermosetting resin, having to meet the following requirements:
- impossibility of manipulating the specimen in the case of small size,
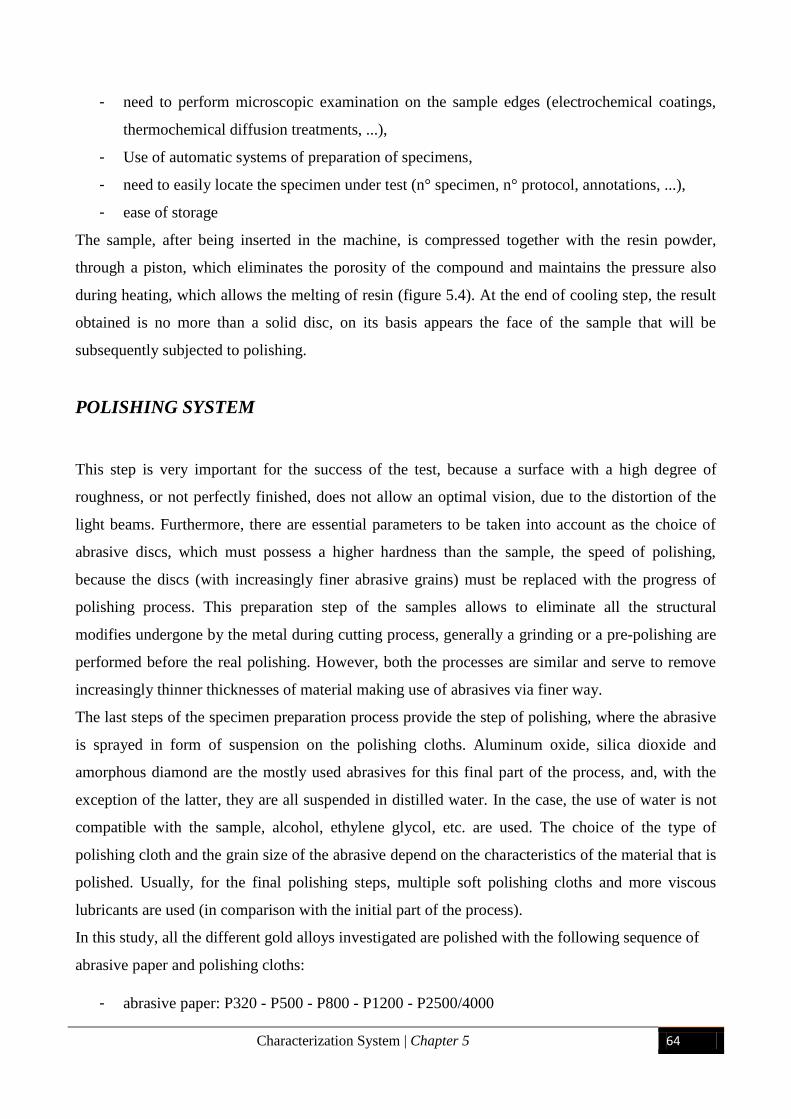
Characterization System | Chapter 5 64
- need to perform microscopic examination on the sample edges (electrochemical coatings,
thermochemical diffusion treatments, ...),
- Use of automatic systems of preparation of specimens,
- need to easily locate the specimen under test (n° specimen, n° protocol, annotations, ...),
- ease of storage
The sample, after being inserted in the machine, is compressed together with the resin powder,
through a piston, which eliminates the porosity of the compound and maintains the pressure also
during heating, which allows the melting of resin (figure 5.4). At the end of cooling step, the result
obtained is no more than a solid disc, on its basis appears the face of the sample that will be
subsequently subjected to polishing.
POLISHING SYSTEM
This step is very important for the success of the test, because a surface with a high degree of
roughness, or not perfectly finished, does not allow an optimal vision, due to the distortion of the
light beams. Furthermore, there are essential parameters to be taken into account as the choice of
abrasive discs, which must possess a higher hardness than the sample, the speed of polishing,
because the discs (with increasingly finer abrasive grains) must be replaced with the progress of
polishing process. This preparation step of the samples allows to eliminate all the structural
modifies undergone by the metal during cutting process, generally a grinding or a pre-polishing are
performed before the real polishing. However, both the processes are similar and serve to remove
increasingly thinner thicknesses of material making use of abrasives via finer way.
The last steps of the specimen preparation process provide the step of polishing, where the abrasive
is sprayed in form of suspension on the polishing cloths. Aluminum oxide, silica dioxide and
amorphous diamond are the mostly used abrasives for this final part of the process, and, with the
exception of the latter, they are all suspended in distilled water. In the case, the use of water is not
compatible with the sample, alcohol, ethylene glycol, etc. are used. The choice of the type of
polishing cloth and the grain size of the abrasive depend on the characteristics of the material that is
polished. Usually, for the final polishing steps, multiple soft polishing cloths and more viscous
lubricants are used (in comparison with the initial part of the process). In this study, all the different gold alloys investigated are polished with the following sequence of
abrasive paper and polishing cloths:
- abrasive paper: P320 - P500 - P800 - P1200 - P2500/4000
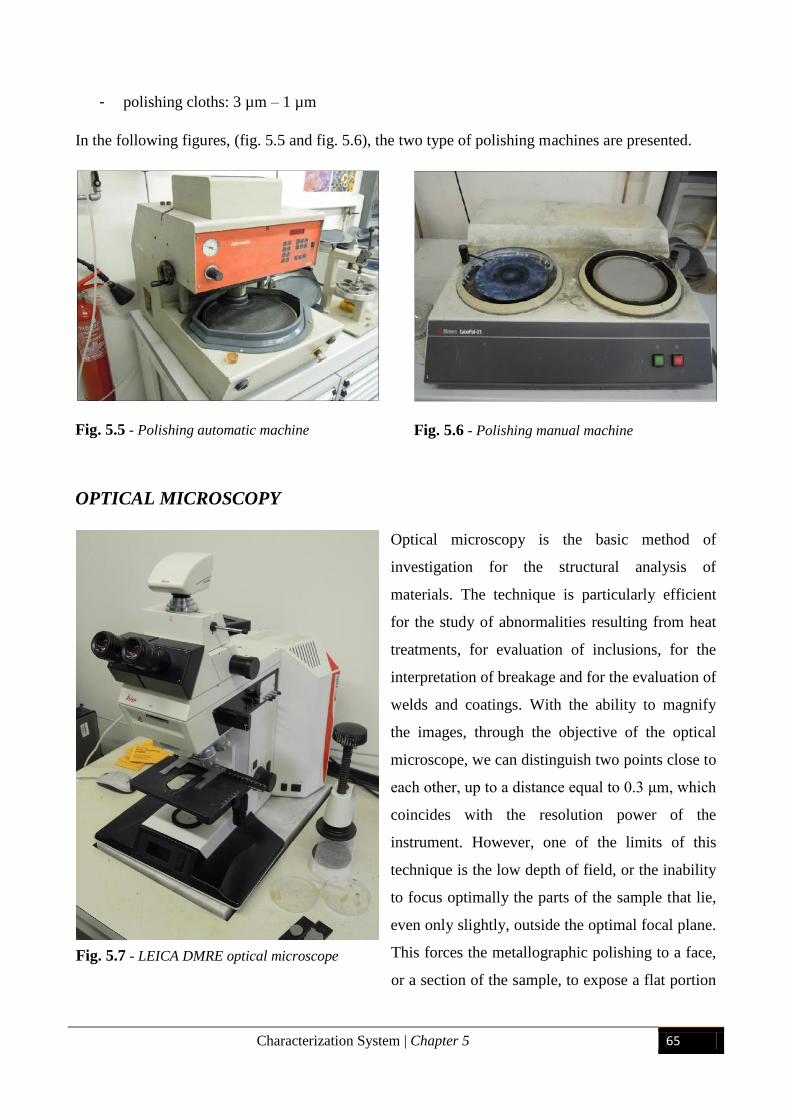
Characterization System | Chapter 5 65
- polishing cloths: 3 µm – 1 µm
In the following figures, (fig. 5.5 and fig. 5.6), the two type of polishing machines are presented.
Fig. 5.5 - Polishing automatic machine
OPTICAL MICROSCOPY
Optical microscopy is the basic method of
investigation for the structural analysis of
materials. The technique is particularly efficient
for the study of abnormalities resulting from heat
treatments, for evaluation of inclusions, for the
interpretation of breakage and for the evaluation of
welds and coatings. With the ability to magnify
the images, through the objective of the optical
microscope, we can distinguish two points close to
each other, up to a distance equal to 0.3 μm, which
coincides with the resolution power of the
instrument. However, one of the limits of this
technique is the low depth of field, or the inability
to focus optimally the parts of the sample that lie,
even only slightly, outside the optimal focal plane.
This forces the metallographic polishing to a face,
or a section of the sample, to expose a flat portion
Fig. 5.6 - Polishing manual machine
Fig. 5.7 - LEICA DMRE optical microscope
Characterization System | Chapter 5 66
to the observation of the prepared test specimen. The characterization of all samples taken from the
goldsmith company was performed with a LEICA DMRE microscope, figure 5.7.
SCANNING ELECTRON MICROSCOPY (SEM)
Fig. 5.8 - Scanning electron microscope (SEM) used in the characterization of the samples
It allows to easily observing the bulk samples, obtaining images with high quality and great depth
of field, transmitting information with great immediacy. The use paired with a microanalysis system
widens the possibility of working: it is possible to obtain qualitative and quantitative informations
about the elements present on a given area of the sample.
Secondary electron images are usually used to study the morphology of the samples. The contrast in
the images, thus obtained, depends on the relative variation in the number of detected secondary
electrons, to which two effects contribute: change in number of electrons emitted from the sample
and variation in the population of electrons collected by the detector. Regarding the first effect, the
number of emitted secondary electrons is always proportional to the number of primary electrons
incident, while, the fraction of electrons collected by the detector depends only on the angle of
incidence. The combination of the two discussed effects implies that, the number of detected
secondary electrons depends essentially on the angle of incidence of the local probe, therefore on
the sample topography.
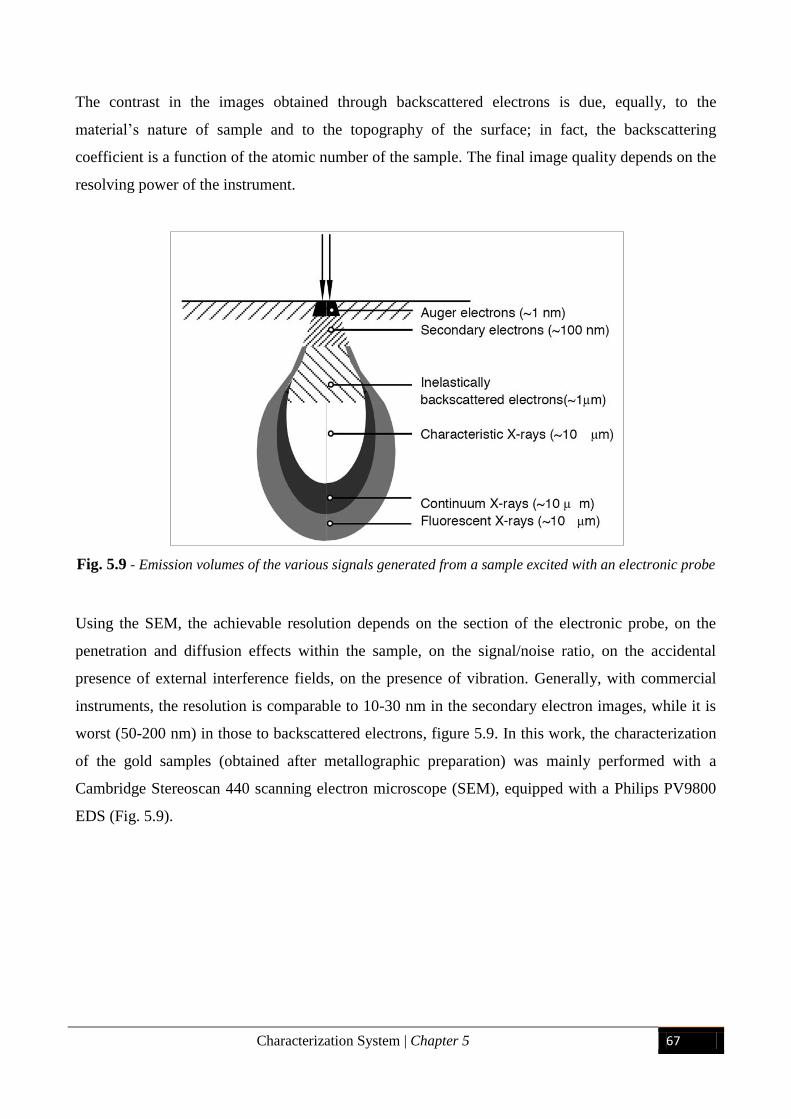
Characterization System | Chapter 5 67
The contrast in the images obtained through backscattered electrons is due, equally, to the
material’s nature of sample and to the topography of the surface; in fact, the backscattering
coefficient is a function of the atomic number of the sample. The final image quality depends on the
resolving power of the instrument.
Fig. 5.9 - Emission volumes of the various signals generated from a sample excited with an electronic probe
Using the SEM, the achievable resolution depends on the section of the electronic probe, on the
penetration and diffusion effects within the sample, on the signal/noise ratio, on the accidental
presence of external interference fields, on the presence of vibration. Generally, with commercial
instruments, the resolution is comparable to 10-30 nm in the secondary electron images, while it is
worst (50-200 nm) in those to backscattered electrons, figure 5.9. In this work, the characterization
of the gold samples (obtained after metallographic preparation) was mainly performed with a
Cambridge Stereoscan 440 scanning electron microscope (SEM), equipped with a Philips PV9800
EDS (Fig. 5.9).
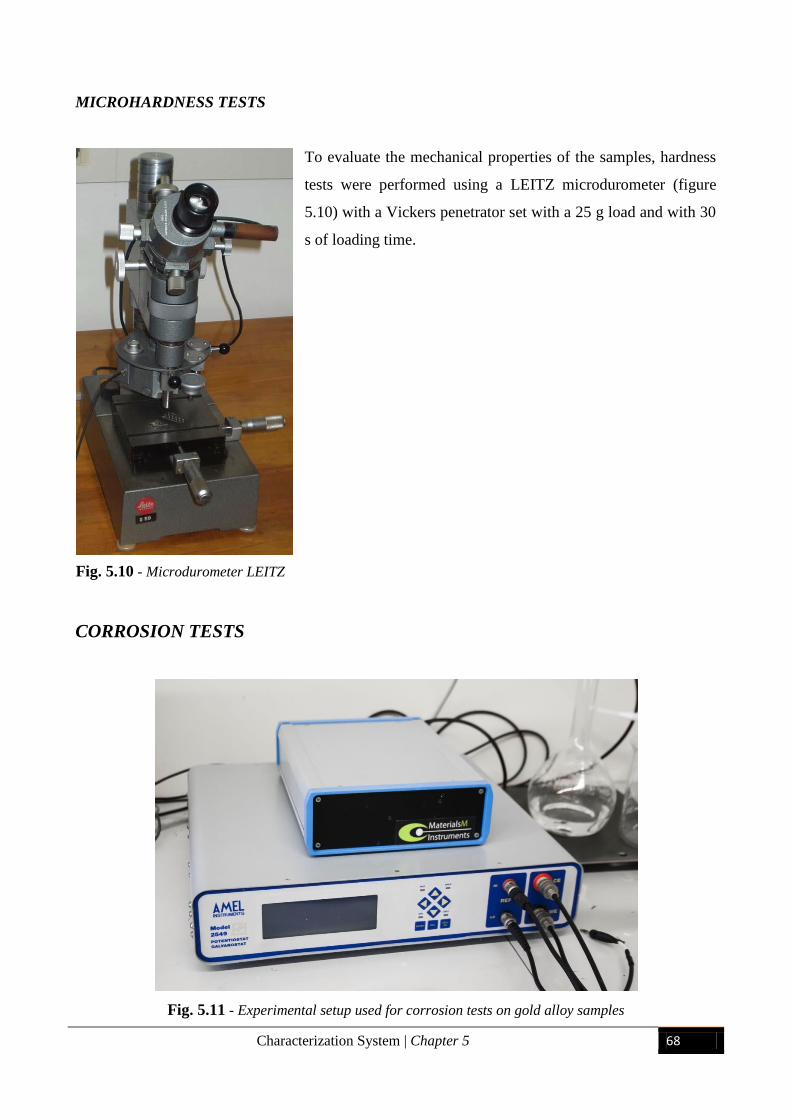
Characterization System | Chapter 5 68
MICROHARDNESS TESTS
To evaluate the mechanical properties of the samples, hardness
tests were performed using a LEITZ microdurometer (figure
5.10) with a Vickers penetrator set with a 25 g load and with 30
s of loading time.
CORROSION TESTS
Fig. 5.11 - Experimental setup used for corrosion tests on gold alloy samples
Fig. 5.10 - Microdurometer LEITZ
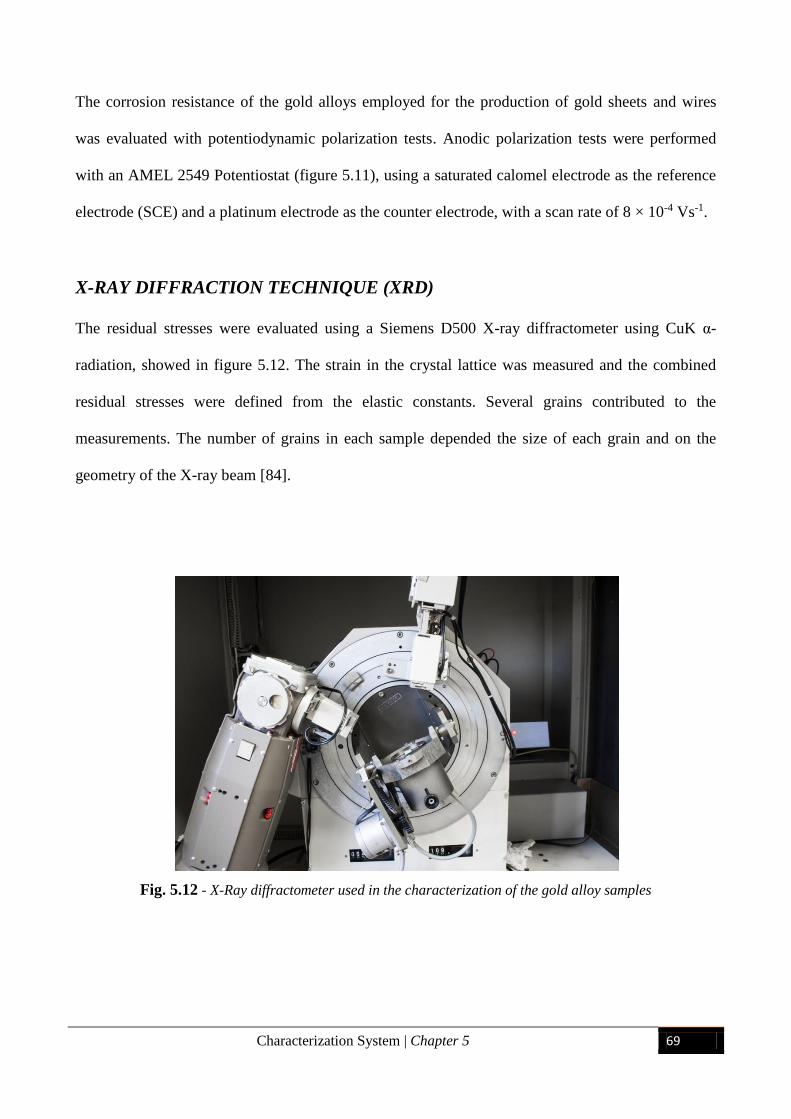
Characterization System | Chapter 5 69
The corrosion resistance of the gold alloys employed for the production of gold sheets and wires
was evaluated with potentiodynamic polarization tests. Anodic polarization tests were performed
with an AMEL 2549 Potentiostat (figure 5.11), using a saturated calomel electrode as the reference
electrode (SCE) and a platinum electrode as the counter electrode, with a scan rate of 8 × 10⁻⁴ Vs-1.
X-RAY DIFFRACTION TECHNIQUE (XRD)
The residual stresses were evaluated using a Siemens D500 X-ray diffractometer using CuK α-
radiation, showed in figure 5.12. The strain in the crystal lattice was measured and the combined
residual stresses were defined from the elastic constants. Several grains contributed to the
measurements. The number of grains in each sample depended the size of each grain and on the
geometry of the X-ray beam [84].
Fig. 5.12 - X-Ray diffractometer used in the characterization of the gold alloy samples
Study of gold-welding alloy wires | Chapter 6 70
Chapter 6
Study of gold-welding alloy wires: Effect of Production
Parameters on Microstructure and Properties
6.1 INTRODUCTION
Gold-welding alloys, which are used in the production of both hollow and solid gold chains, affect
the optical and mechanical properties of various gold products because the corrosion resistance of
the individual links depends on these properties. It is important that welding alloys with high
corrosion resistance do not degrade during or after the production process.
The mechanical properties of gold-welding alloy wires is strongly influenced by the alloy
microstructure, which has a key role in both the machinability and the quality of the wires. In this
thesis, various physical and mechanical properties of gold originating from different industrial
deformation processes are evaluated. Specifically, various plastic deformation grades caused by
different annealing and rolling steps are analyzed. The change of the temperature, time and velocity
parameters in the annealing and lamination processes leads to the formation of different levels of
residual stresses in the material, which can generate a variation in the corrosion properties of the
gold wires. Moreover, the influence of these residual stresses on the corrosion resistance of the
welding is studied, since it represents a fundamental characteristic that guarantees suitable
properties in a gold chain’s final environment of use. The most important phenomenon
characterizing the corrosion of gold alloys is the selective dissolution of the less noble elements
[85].
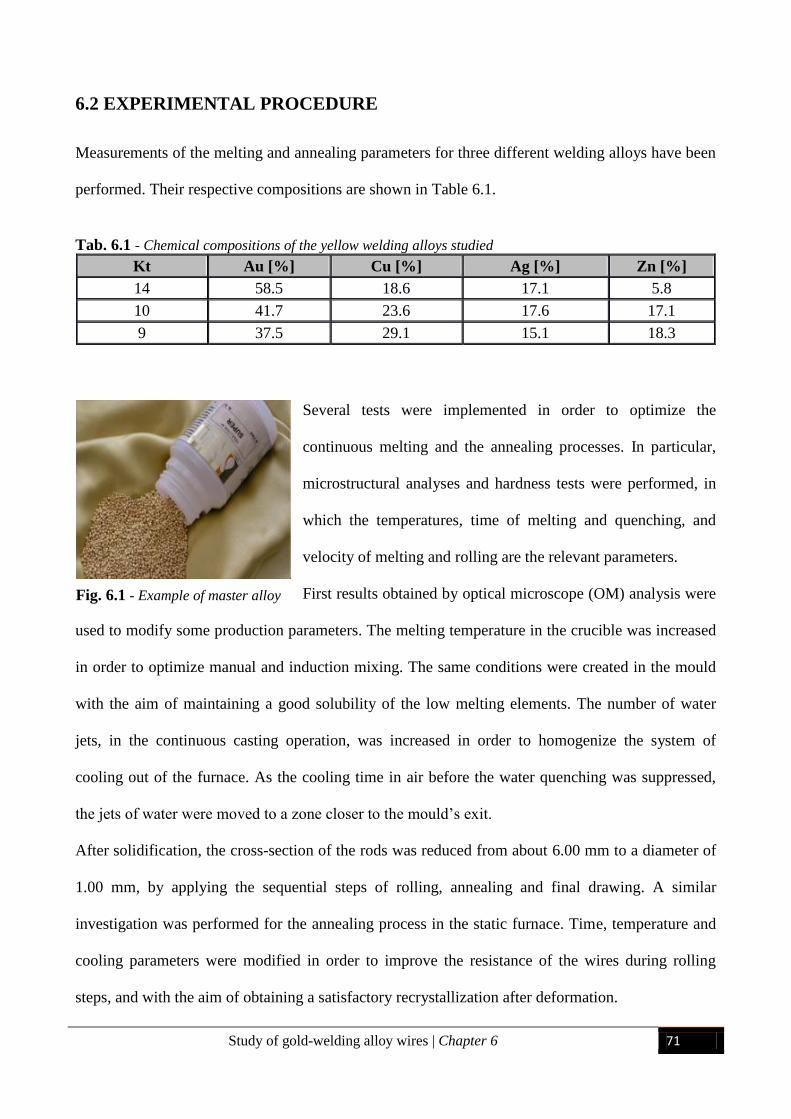
Study of gold-welding alloy wires | Chapter 6 71
6.2 EXPERIMENTAL PROCEDURE
Measurements of the melting and annealing parameters for three different welding alloys have been
performed. Their respective compositions are shown in Table 6.1.
Tab. 6.1 - Chemical compositions of the yellow welding alloys studied
Kt Au [%] Cu [%] Ag [%] Zn [%]
14 58.5 18.6 17.1 5.8
10 41.7 23.6 17.6 17.1
9 37.5 29.1 15.1 18.3
Several tests were implemented in order to optimize the
continuous melting and the annealing processes. In particular,
microstructural analyses and hardness tests were performed, in
which the temperatures, time of melting and quenching, and
velocity of melting and rolling are the relevant parameters.
First results obtained by optical microscope (OM) analysis were
used to modify some production parameters. The melting temperature in the crucible was increased
in order to optimize manual and induction mixing. The same conditions were created in the mould
with the aim of maintaining a good solubility of the low melting elements. The number of water
jets, in the continuous casting operation, was increased in order to homogenize the system of
cooling out of the furnace. As the cooling time in air before the water quenching was suppressed,
the jets of water were moved to a zone closer to the mould’s exit.
After solidification, the cross-section of the rods was reduced from about 6.00 mm to a diameter of
1.00 mm, by applying the sequential steps of rolling, annealing and final drawing. A similar
investigation was performed for the annealing process in the static furnace. Time, temperature and
cooling parameters were modified in order to improve the resistance of the wires during rolling
steps, and with the aim of obtaining a satisfactory recrystallization after deformation.
Fig. 6.1 - Example of master alloy
Study of gold-welding alloy wires | Chapter 6 72
A statistical analysis on different annealing tests at various temperatures (from 560 to 610 °C),
times (30 and 45 mins) and air cooling (from 0 to 60 s) showed that it is possible to reduce the
hardness with suitable heat treatments. To evaluate the mechanical properties of the final annealed
products, tensile and hardness tests were performed. OM observation was performed with a LEICA
DMRE microscope. The samples were prepared with the standard metallographic technique of
polishing and the etch was performed with different solutions of cyanide.
The corrosion resistance was evaluated with potentiodynamic polarization tests, using as electrolyte
a solution that simulates human sweat in order to replicate the environment of final use. By mass,
the solution consisted of 0.5% NaCl, 0.1% lactic acid and 0.1% urea. A solution of NaOH was used
to guarantee an acidity of pH 6.5. Anodic polarization tests were performed and, the electronic
scanning microscope (illustrated before) was used, in order to study the microstructures obtained
from the variation in processing parameters. The residual stresses were evaluated through XRD
measurements, the operating parameters are shown in tab. 6.2.
Tab. 6.2 - Parameters of the XRD analysis
Material Lattice
structure Simmetry Diffraction Plane Radiation type
Collimator
diameter
Gold
alloy FCC Fm3m (2 2 0) CuKalpha 4 mm
6.3 RESULTS AND DISCUSSION
During the microstructural and mechanical analysis, several different process parameters of the
production cycle were tested for different welding alloys. The aim was to identify the relationship
between the parameters of the processes, the microstructures and the mechanical qualities of the
semi-finished products. Furthermore, the influence of these characteristics on the residual stresses
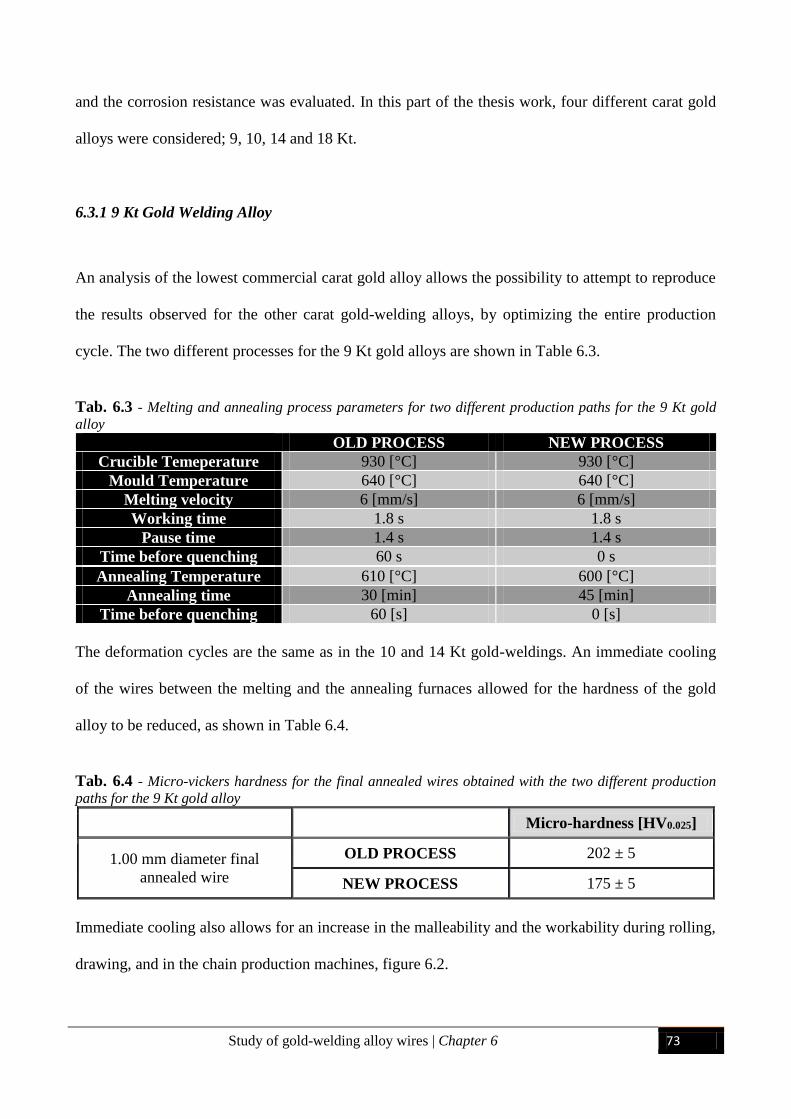
Study of gold-welding alloy wires | Chapter 6 73
and the corrosion resistance was evaluated. In this part of the thesis work, four different carat gold
alloys were considered; 9, 10, 14 and 18 Kt.
6.3.1 9 Kt Gold Welding Alloy
An analysis of the lowest commercial carat gold alloy allows the possibility to attempt to reproduce
the results observed for the other carat gold-welding alloys, by optimizing the entire production
cycle. The two different processes for the 9 Kt gold alloys are shown in Table 6.3.
Tab. 6.3 - Melting and annealing process parameters for two different production paths for the 9 Kt gold
alloy
OLD PROCESS NEW PROCESS
Crucible Temeperature 930 [°C] 930 [°C]
Mould Temperature 640 [°C] 640 [°C]
Melting velocity 6 [mm/s] 6 [mm/s]
Working time 1.8 s 1.8 s
Pause time 1.4 s 1.4 s
Time before quenching 60 s 0 s
Annealing Temperature 610 [°C] 600 [°C]
Annealing time 30 [min] 45 [min]
Time before quenching 60 [s] 0 [s]
The deformation cycles are the same as in the 10 and 14 Kt gold-weldings. An immediate cooling
of the wires between the melting and the annealing furnaces allowed for the hardness of the gold
alloy to be reduced, as shown in Table 6.4.
Tab. 6.4 - Micro-vickers hardness for the final annealed wires obtained with the two different production
paths for the 9 Kt gold alloy
Micro-hardness [HV0.025]
1.00 mm diameter final
annealed wire
OLD PROCESS 202 ± 5
NEW PROCESS 175 ± 5
Immediate cooling also allows for an increase in the malleability and the workability during rolling,
drawing, and in the chain production machines, figure 6.2.
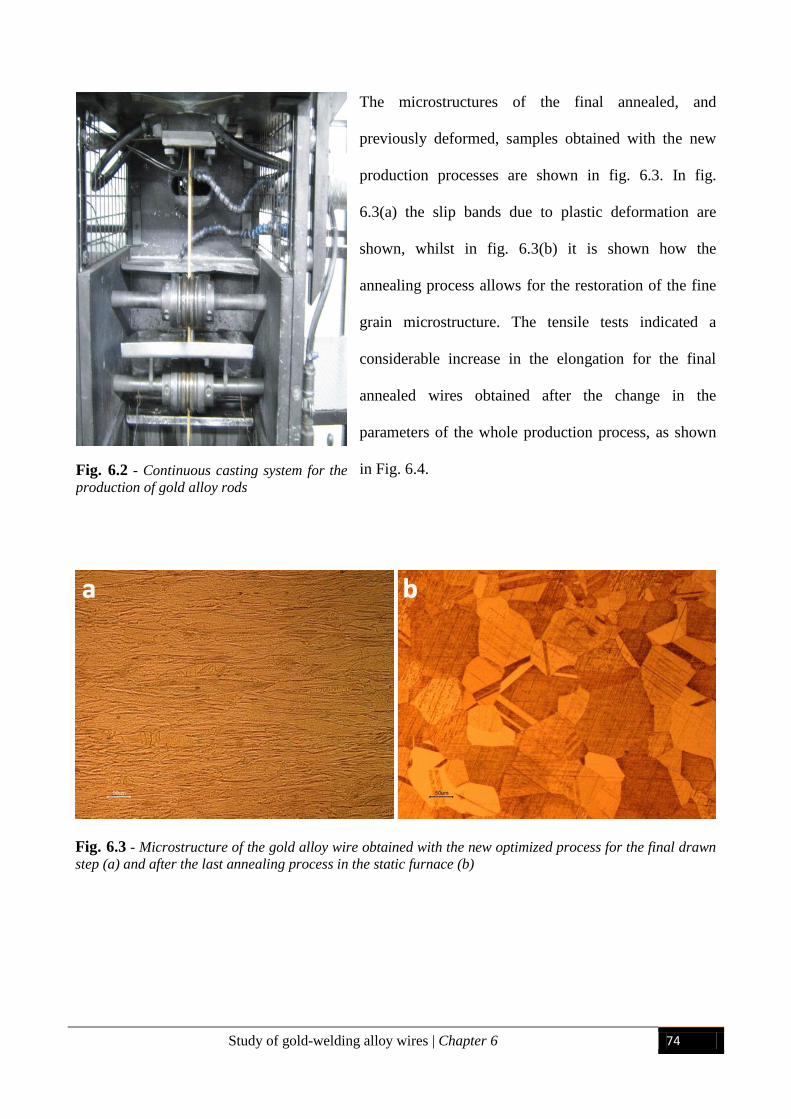
Study of gold-welding alloy wires | Chapter 6 74
The microstructures of the final annealed, and
previously deformed, samples obtained with the new
production processes are shown in fig. 6.3. In fig.
6.3(a) the slip bands due to plastic deformation are
shown, whilst in fig. 6.3(b) it is shown how the
annealing process allows for the restoration of the fine
grain microstructure. The tensile tests indicated a
considerable increase in the elongation for the final
annealed wires obtained after the change in the
parameters of the whole production process, as shown
in Fig. 6.4.
Fig. 6.3 - Microstructure of the gold alloy wire obtained with the new optimized process for the final drawn
step (a) and after the last annealing process in the static furnace (b)
Fig. 6.2 - Continuous casting system for the
production of gold alloy rods
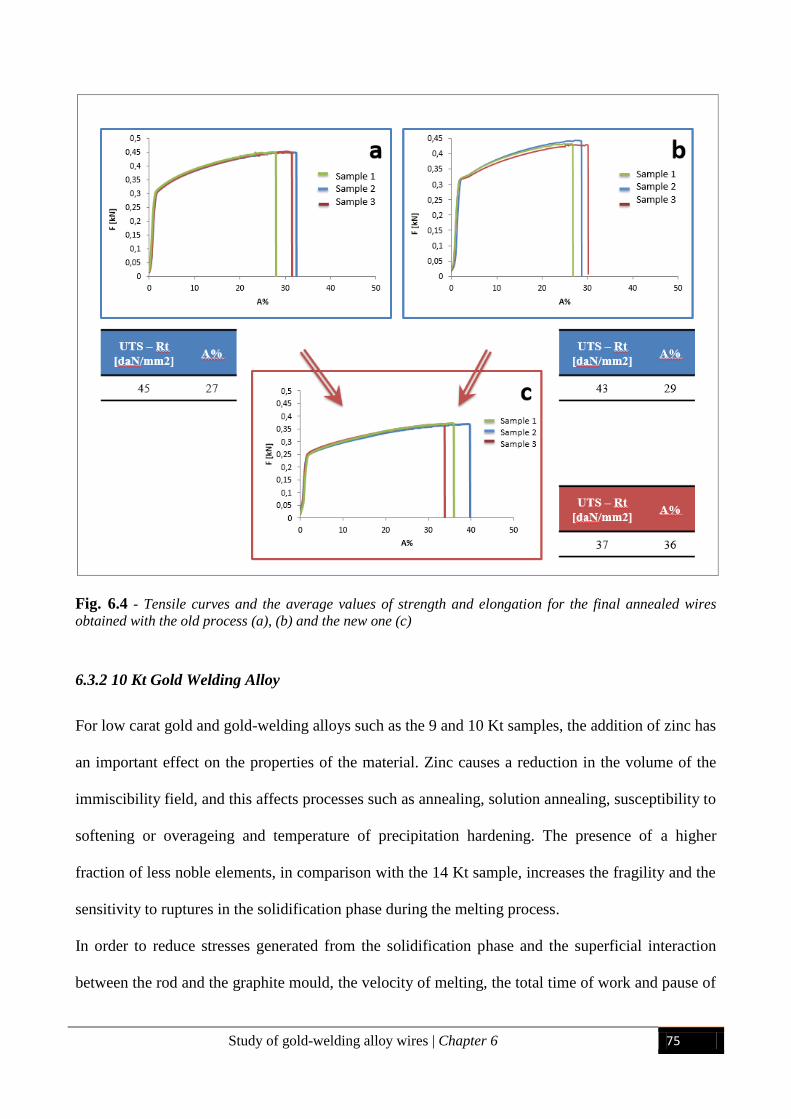
Study of gold-welding alloy wires | Chapter 6 75
Fig. 6.4 - Tensile curves and the average values of strength and elongation for the final annealed wires
obtained with the old process (a), (b) and the new one (c)
6.3.2 10 Kt Gold Welding Alloy
For low carat gold and gold-welding alloys such as the 9 and 10 Kt samples, the addition of zinc has
an important effect on the properties of the material. Zinc causes a reduction in the volume of the
immiscibility field, and this affects processes such as annealing, solution annealing, susceptibility to
softening or overageing and temperature of precipitation hardening. The presence of a higher
fraction of less noble elements, in comparison with the 14 Kt sample, increases the fragility and the
sensitivity to ruptures in the solidification phase during the melting process.
In order to reduce stresses generated from the solidification phase and the superficial interaction
between the rod and the graphite mould, the velocity of melting, the total time of work and pause of
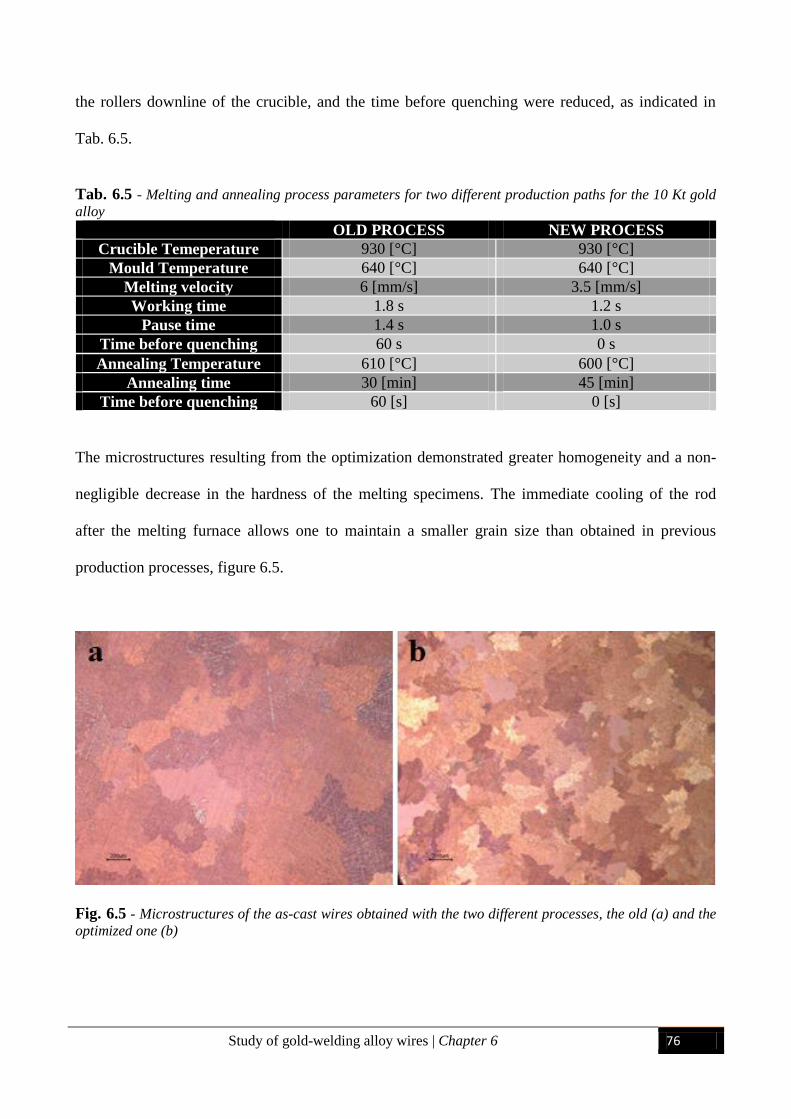
Study of gold-welding alloy wires | Chapter 6 76
the rollers downline of the crucible, and the time before quenching were reduced, as indicated in
Tab. 6.5.
Tab. 6.5 - Melting and annealing process parameters for two different production paths for the 10 Kt gold
alloy
OLD PROCESS NEW PROCESS
Crucible Temeperature 930 [°C] 930 [°C]
Mould Temperature 640 [°C] 640 [°C]
Melting velocity 6 [mm/s] 3.5 [mm/s]
Working time 1.8 s 1.2 s
Pause time 1.4 s 1.0 s
Time before quenching 60 s 0 s
Annealing Temperature 610 [°C] 600 [°C]
Annealing time 30 [min] 45 [min]
Time before quenching 60 [s] 0 [s]
The microstructures resulting from the optimization demonstrated greater homogeneity and a non-
negligible decrease in the hardness of the melting specimens. The immediate cooling of the rod
after the melting furnace allows one to maintain a smaller grain size than obtained in previous
production processes, figure 6.5.
Fig. 6.5 - Microstructures of the as-cast wires obtained with the two different processes, the old (a) and the
optimized one (b)
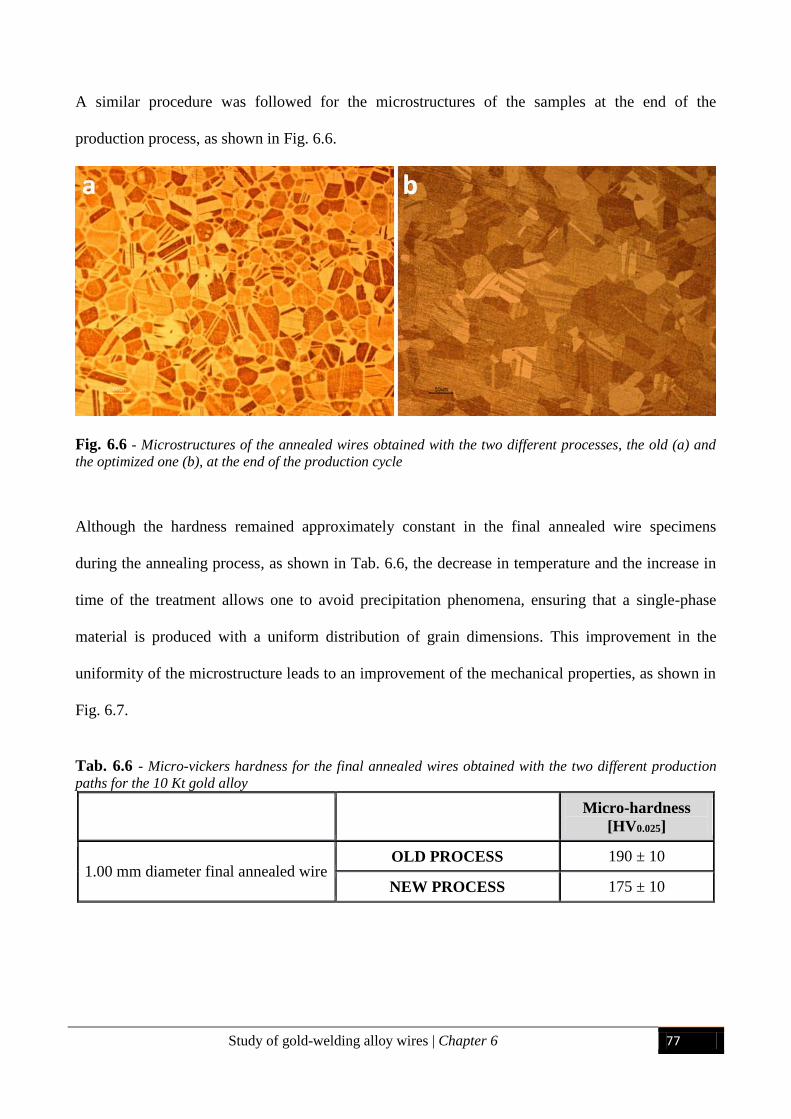
Study of gold-welding alloy wires | Chapter 6 77
A similar procedure was followed for the microstructures of the samples at the end of the
production process, as shown in Fig. 6.6.
Fig. 6.6 - Microstructures of the annealed wires obtained with the two different processes, the old (a) and
the optimized one (b), at the end of the production cycle
Although the hardness remained approximately constant in the final annealed wire specimens
during the annealing process, as shown in Tab. 6.6, the decrease in temperature and the increase in
time of the treatment allows one to avoid precipitation phenomena, ensuring that a single-phase
material is produced with a uniform distribution of grain dimensions. This improvement in the
uniformity of the microstructure leads to an improvement of the mechanical properties, as shown in
Fig. 6.7.
Tab. 6.6 - Micro-vickers hardness for the final annealed wires obtained with the two different production
paths for the 10 Kt gold alloy
Micro-hardness
[HV0.025]
1.00 mm diameter final annealed wire OLD PROCESS 190 ± 10
NEW PROCESS 175 ± 10
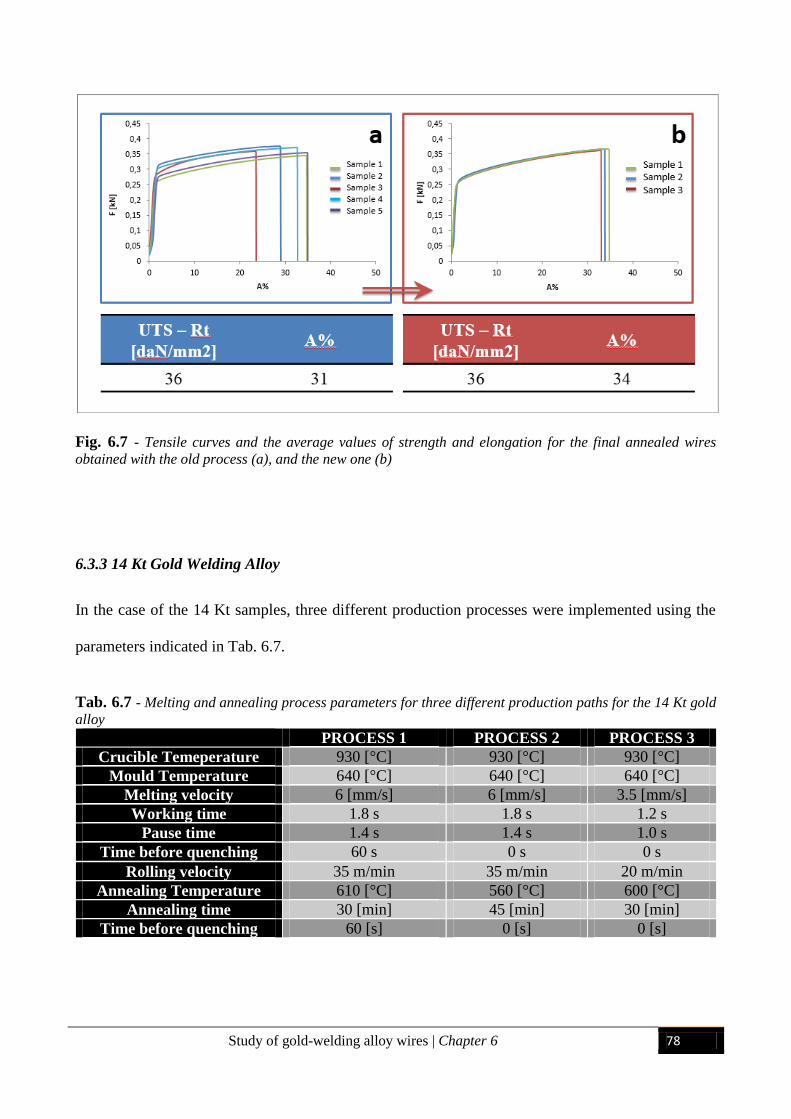
Study of gold-welding alloy wires | Chapter 6 78
Fig. 6.7 - Tensile curves and the average values of strength and elongation for the final annealed wires
obtained with the old process (a), and the new one (b)
6.3.3 14 Kt Gold Welding Alloy
In the case of the 14 Kt samples, three different production processes were implemented using the
parameters indicated in Tab. 6.7.
Tab. 6.7 - Melting and annealing process parameters for three different production paths for the 14 Kt gold
alloy
PROCESS 1 PROCESS 2 PROCESS 3
Crucible Temeperature 930 [°C] 930 [°C] 930 [°C]
Mould Temperature 640 [°C] 640 [°C] 640 [°C]
Melting velocity 6 [mm/s] 6 [mm/s] 3.5 [mm/s]
Working time 1.8 s 1.8 s 1.2 s
Pause time 1.4 s 1.4 s 1.0 s
Time before quenching 60 s 0 s 0 s
Rolling velocity 35 m/min 35 m/min 20 m/min
Annealing Temperature 610 [°C] 560 [°C] 600 [°C]
Annealing time 30 [min] 45 [min] 30 [min]
Time before quenching 60 [s] 0 [s] 0 [s]
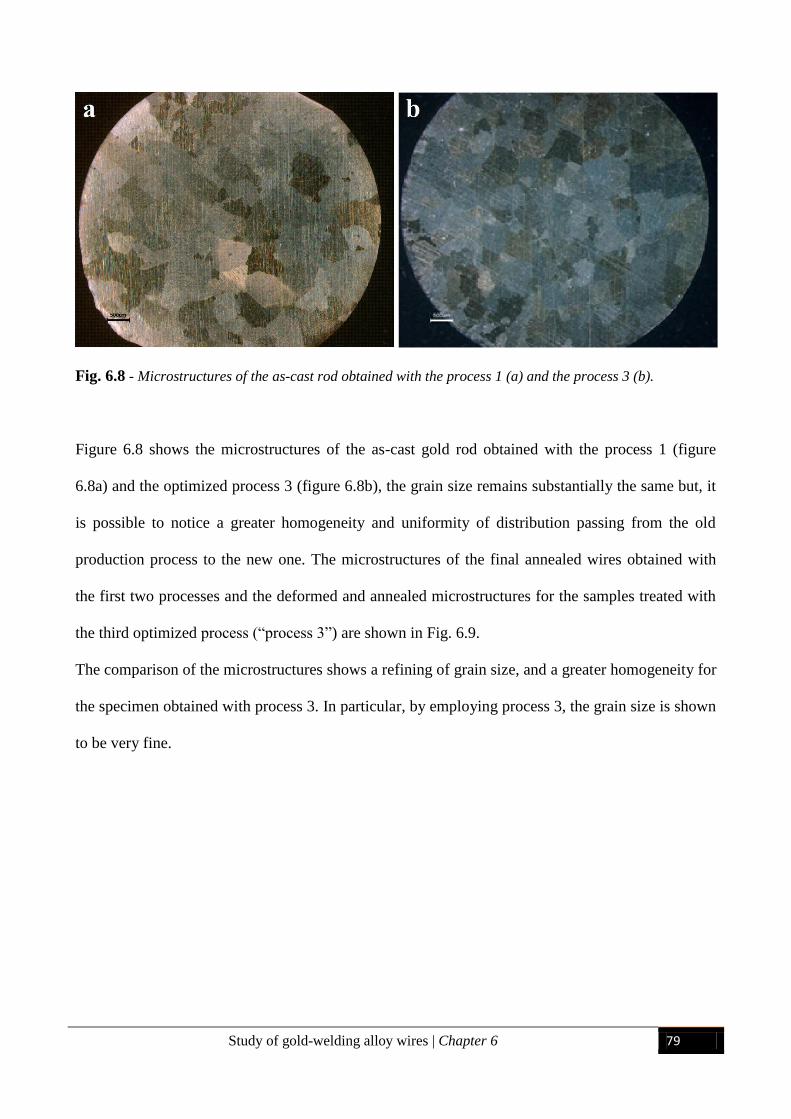
Study of gold-welding alloy wires | Chapter 6 79
Fig. 6.8 - Microstructures of the as-cast rod obtained with the process 1 (a) and the process 3 (b).
Figure 6.8 shows the microstructures of the as-cast gold rod obtained with the process 1 (figure
6.8a) and the optimized process 3 (figure 6.8b), the grain size remains substantially the same but, it
is possible to notice a greater homogeneity and uniformity of distribution passing from the old
production process to the new one. The microstructures of the final annealed wires obtained with
the first two processes and the deformed and annealed microstructures for the samples treated with
the third optimized process (“process 3”) are shown in Fig. 6.9.
The comparison of the microstructures shows a refining of grain size, and a greater homogeneity for
the specimen obtained with process 3. In particular, by employing process 3, the grain size is shown
to be very fine.
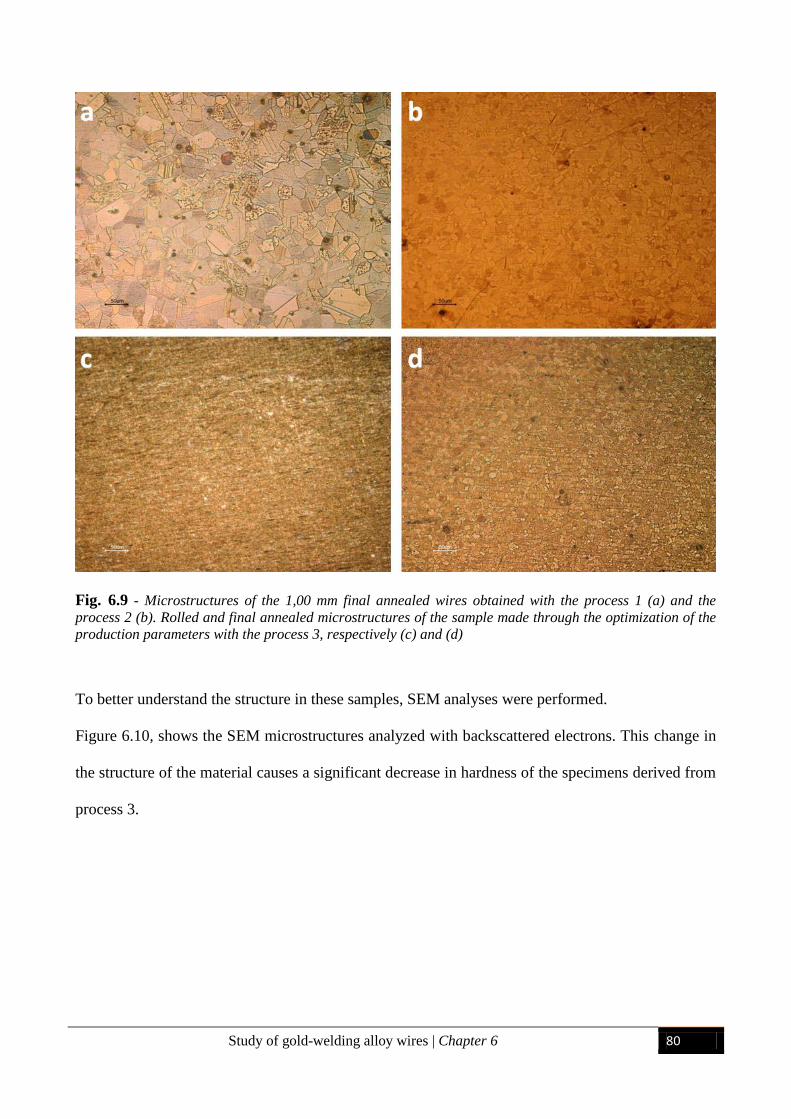
Study of gold-welding alloy wires | Chapter 6 80
Fig. 6.9 - Microstructures of the 1,00 mm final annealed wires obtained with the process 1 (a) and the
process 2 (b). Rolled and final annealed microstructures of the sample made through the optimization of the
production parameters with the process 3, respectively (c) and (d)
To better understand the structure in these samples, SEM analyses were performed.
Figure 6.10, shows the SEM microstructures analyzed with backscattered electrons. This change in
the structure of the material causes a significant decrease in hardness of the specimens derived from
process 3.
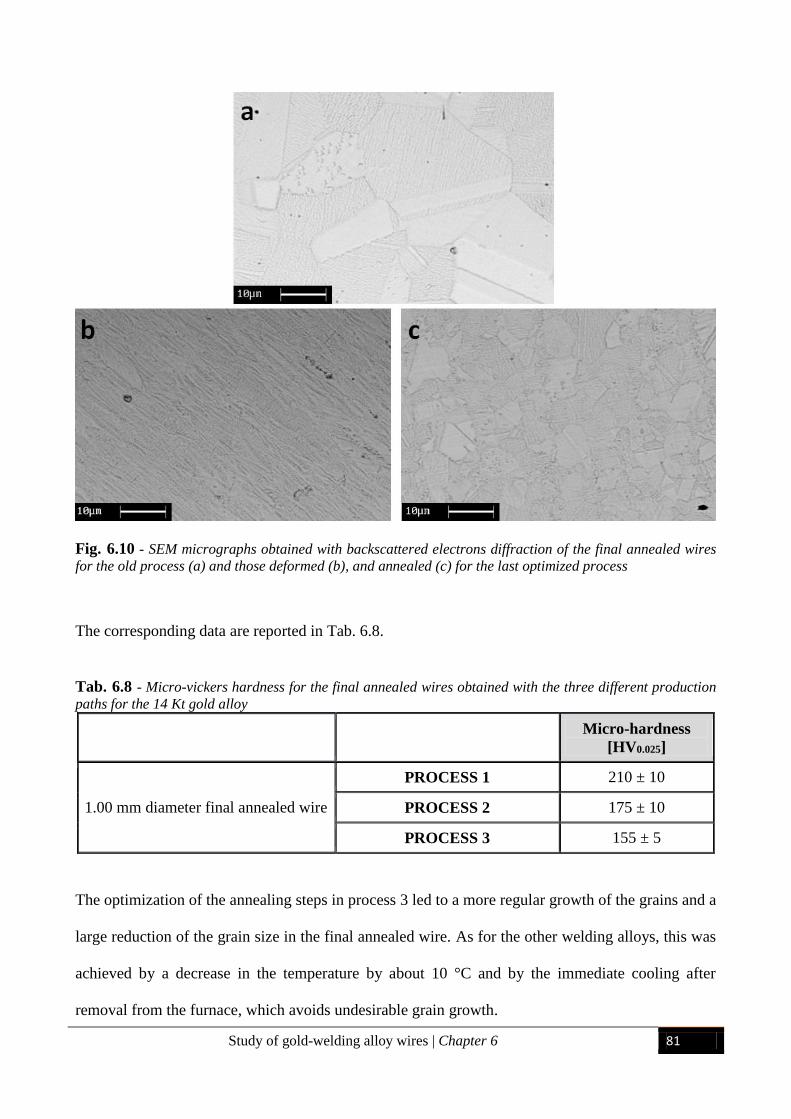
Study of gold-welding alloy wires | Chapter 6 81
Fig. 6.10 - SEM micrographs obtained with backscattered electrons diffraction of the final annealed wires
for the old process (a) and those deformed (b), and annealed (c) for the last optimized process
The corresponding data are reported in Tab. 6.8.
Tab. 6.8 - Micro-vickers hardness for the final annealed wires obtained with the three different production
paths for the 14 Kt gold alloy
Micro-hardness
[HV0.025]
1.00 mm diameter final annealed wire
PROCESS 1 210 ± 10
PROCESS 2 175 ± 10
PROCESS 3 155 ± 5
The optimization of the annealing steps in process 3 led to a more regular growth of the grains and a
large reduction of the grain size in the final annealed wire. As for the other welding alloys, this was
achieved by a decrease in the temperature by about 10 °C and by the immediate cooling after
removal from the furnace, which avoids undesirable grain growth.
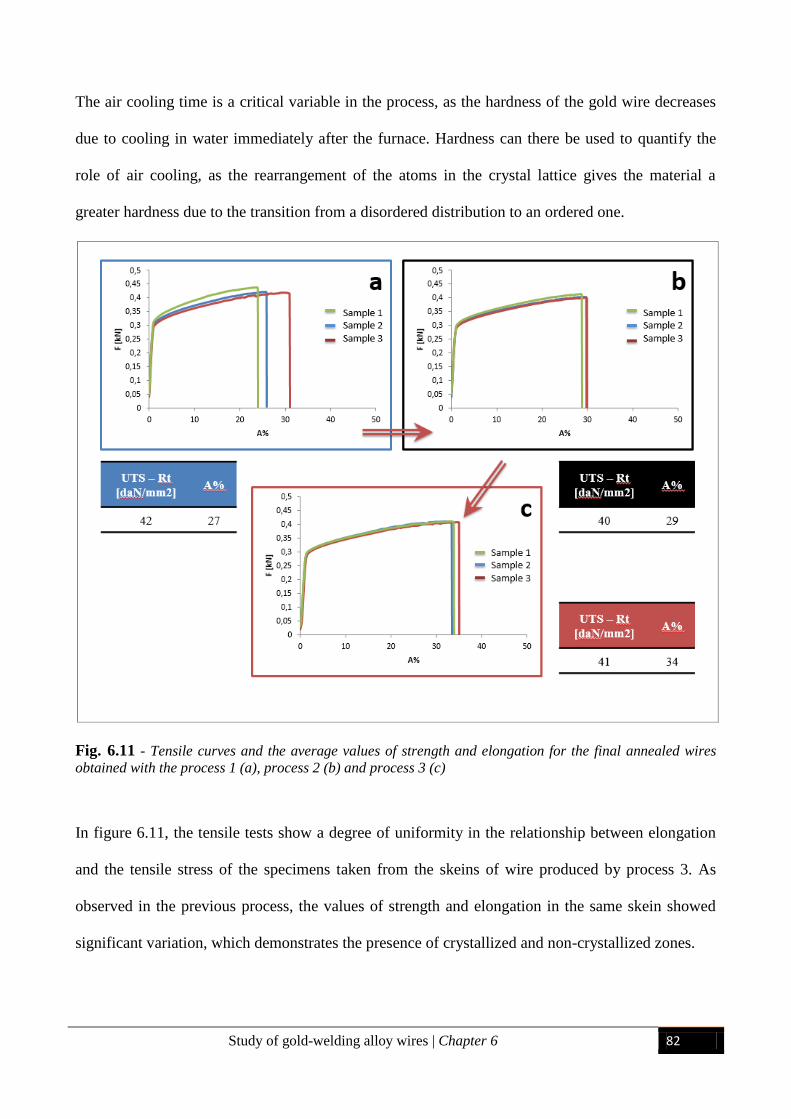
Study of gold-welding alloy wires | Chapter 6 82
The air cooling time is a critical variable in the process, as the hardness of the gold wire decreases
due to cooling in water immediately after the furnace. Hardness can there be used to quantify the
role of air cooling, as the rearrangement of the atoms in the crystal lattice gives the material a
greater hardness due to the transition from a disordered distribution to an ordered one.
Fig. 6.11 - Tensile curves and the average values of strength and elongation for the final annealed wires
obtained with the process 1 (a), process 2 (b) and process 3 (c)
In figure 6.11, the tensile tests show a degree of uniformity in the relationship between elongation
and the tensile stress of the specimens taken from the skeins of wire produced by process 3. As
observed in the previous process, the values of strength and elongation in the same skein showed
significant variation, which demonstrates the presence of crystallized and non-crystallized zones.
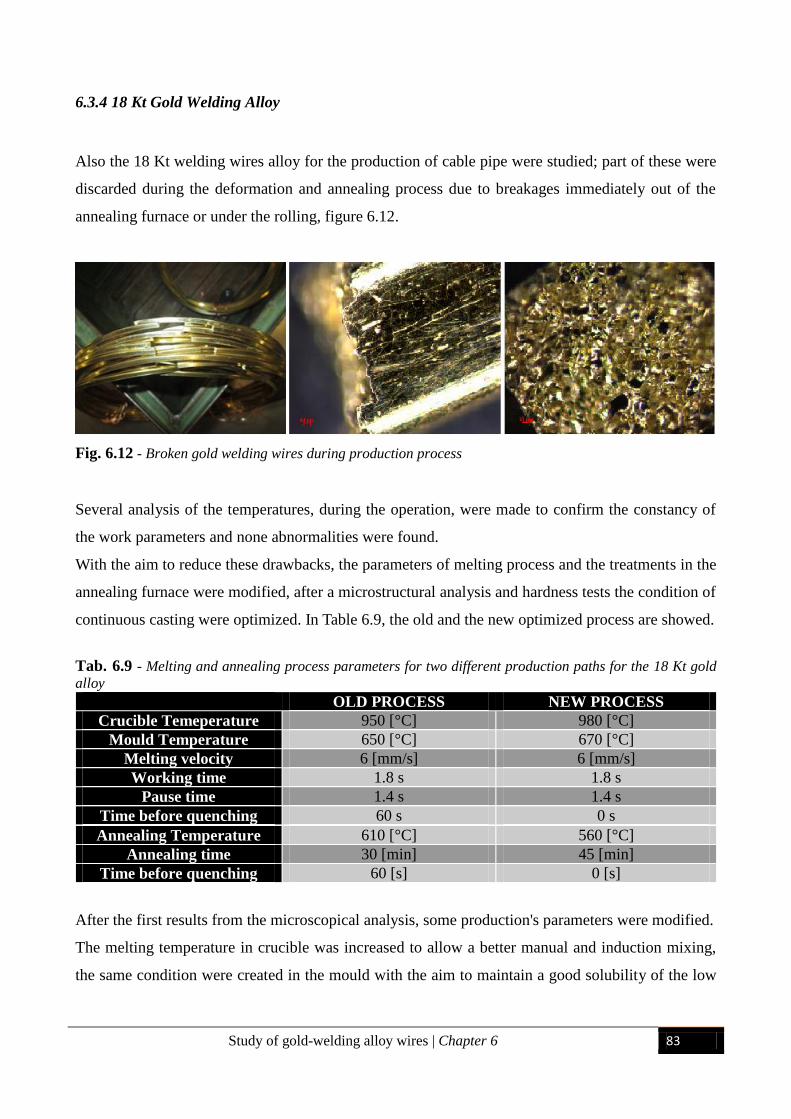
Study of gold-welding alloy wires | Chapter 6 83
6.3.4 18 Kt Gold Welding Alloy
Also the 18 Kt welding wires alloy for the production of cable pipe were studied; part of these were
discarded during the deformation and annealing process due to breakages immediately out of the
annealing furnace or under the rolling, figure 6.12.
Fig. 6.12 - Broken gold welding wires during production process
Several analysis of the temperatures, during the operation, were made to confirm the constancy of
the work parameters and none abnormalities were found.
With the aim to reduce these drawbacks, the parameters of melting process and the treatments in the
annealing furnace were modified, after a microstructural analysis and hardness tests the condition of
continuous casting were optimized. In Table 6.9, the old and the new optimized process are showed.
Tab. 6.9 - Melting and annealing process parameters for two different production paths for the 18 Kt gold
alloy
OLD PROCESS NEW PROCESS
Crucible Temeperature 950 [°C] 980 [°C]
Mould Temperature 650 [°C] 670 [°C]
Melting velocity 6 [mm/s] 6 [mm/s]
Working time 1.8 s 1.8 s
Pause time 1.4 s 1.4 s
Time before quenching 60 s 0 s
Annealing Temperature 610 [°C] 560 [°C]
Annealing time 30 [min] 45 [min]
Time before quenching 60 [s] 0 [s]
After the first results from the microscopical analysis, some production's parameters were modified.
The melting temperature in crucible was increased to allow a better manual and induction mixing,
the same condition were created in the mould with the aim to maintain a good solubility of the low
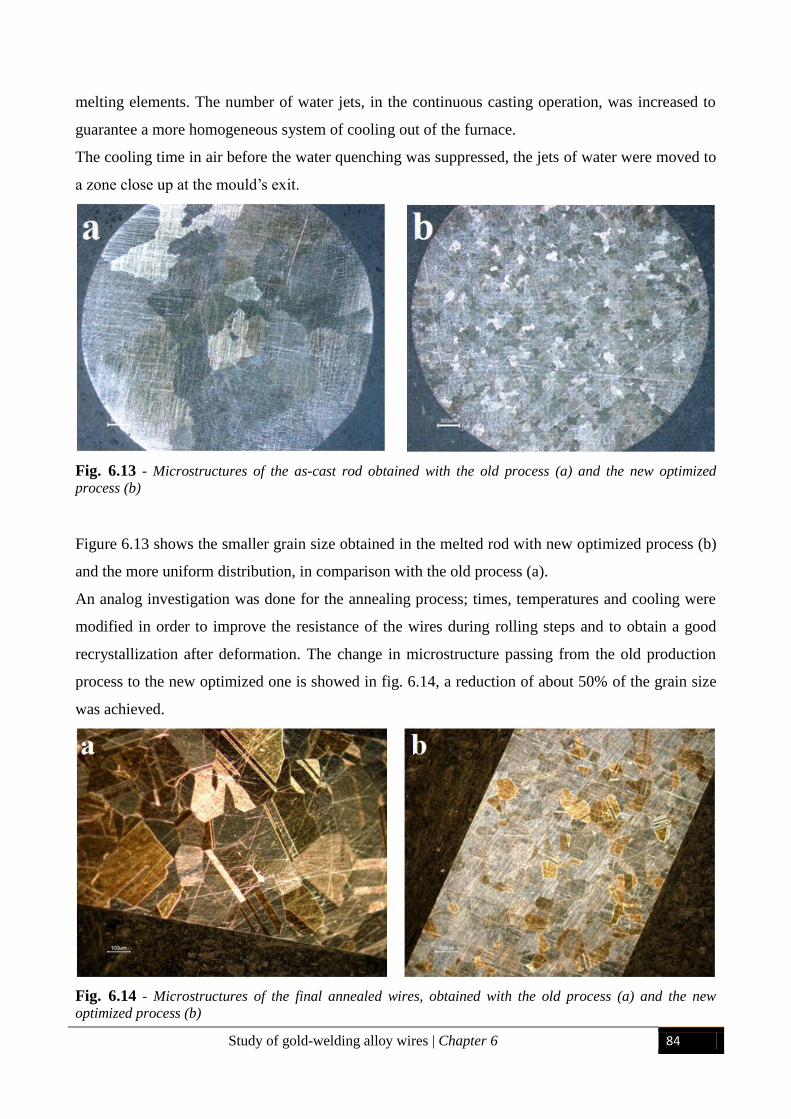
Study of gold-welding alloy wires | Chapter 6 84
melting elements. The number of water jets, in the continuous casting operation, was increased to
guarantee a more homogeneous system of cooling out of the furnace.
The cooling time in air before the water quenching was suppressed, the jets of water were moved to
a zone close up at the mould’s exit.
Fig. 6.13 - Microstructures of the as-cast rod obtained with the old process (a) and the new optimized
process (b)
Figure 6.13 shows the smaller grain size obtained in the melted rod with new optimized process (b)
and the more uniform distribution, in comparison with the old process (a).
An analog investigation was done for the annealing process; times, temperatures and cooling were
modified in order to improve the resistance of the wires during rolling steps and to obtain a good
recrystallization after deformation. The change in microstructure passing from the old production
process to the new optimized one is showed in fig. 6.14, a reduction of about 50% of the grain size
was achieved.
Fig. 6.14 - Microstructures of the final annealed wires, obtained with the old process (a) and the new
optimized process (b)
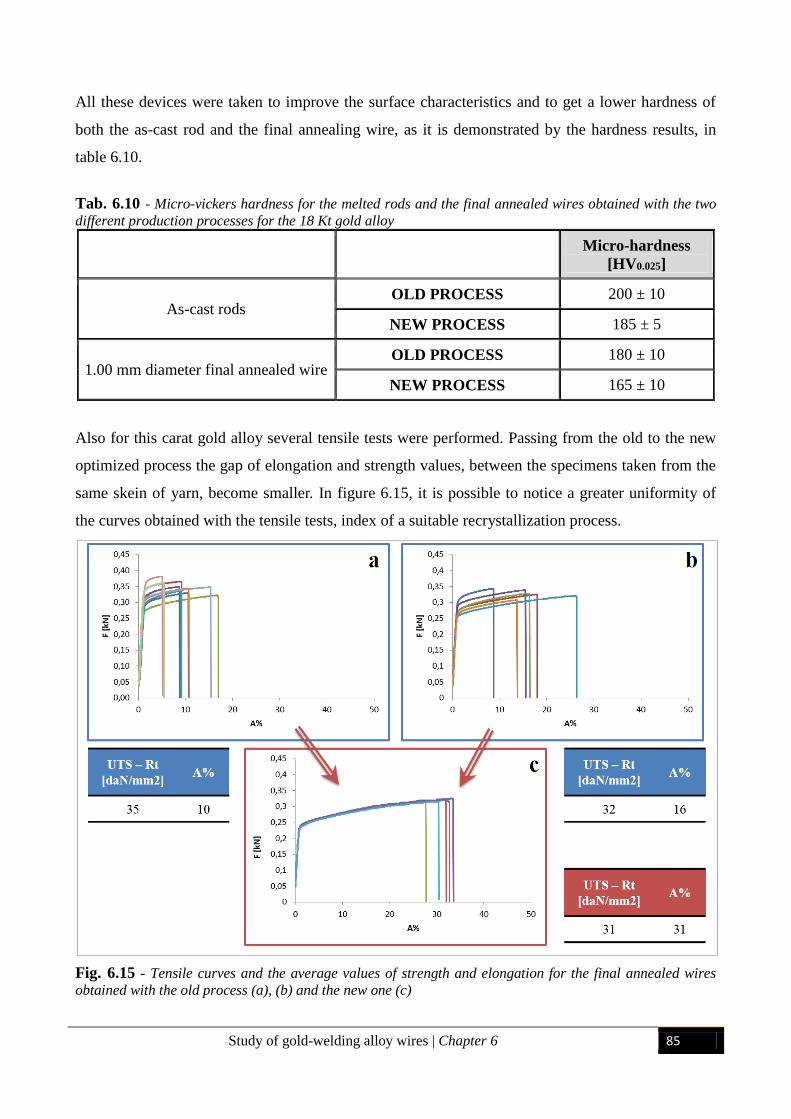
Study of gold-welding alloy wires | Chapter 6 85
All these devices were taken to improve the surface characteristics and to get a lower hardness of
both the as-cast rod and the final annealing wire, as it is demonstrated by the hardness results, in
table 6.10.
Tab. 6.10 - Micro-vickers hardness for the melted rods and the final annealed wires obtained with the two
different production processes for the 18 Kt gold alloy
Micro-hardness
[HV0.025]
As-cast rods OLD PROCESS 200 ± 10
NEW PROCESS 185 ± 5
1.00 mm diameter final annealed wire OLD PROCESS 180 ± 10
NEW PROCESS 165 ± 10
Also for this carat gold alloy several tensile tests were performed. Passing from the old to the new
optimized process the gap of elongation and strength values, between the specimens taken from the
same skein of yarn, become smaller. In figure 6.15, it is possible to notice a greater uniformity of
the curves obtained with the tensile tests, index of a suitable recrystallization process.
Fig. 6.15 - Tensile curves and the average values of strength and elongation for the final annealed wires
obtained with the old process (a), (b) and the new one (c)
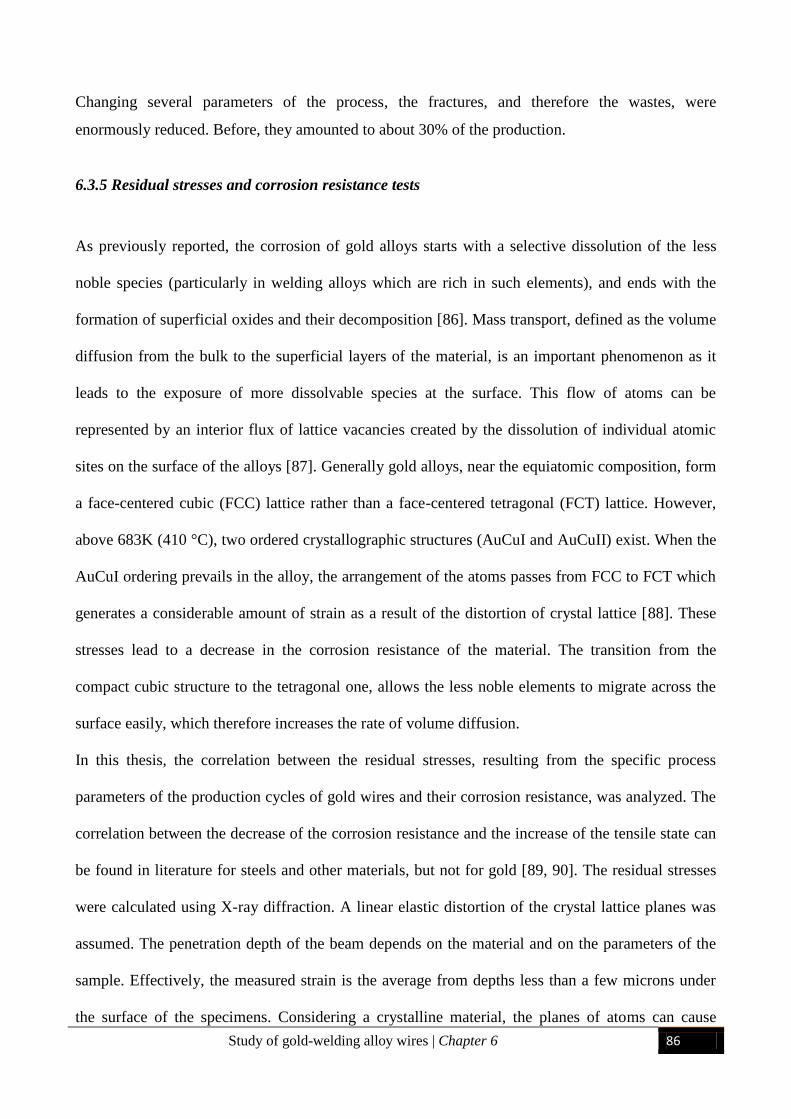
Study of gold-welding alloy wires | Chapter 6 86
Changing several parameters of the process, the fractures, and therefore the wastes, were
enormously reduced. Before, they amounted to about 30% of the production.
6.3.5 Residual stresses and corrosion resistance tests
As previously reported, the corrosion of gold alloys starts with a selective dissolution of the less
noble species (particularly in welding alloys which are rich in such elements), and ends with the
formation of superficial oxides and their decomposition [86]. Mass transport, defined as the volume
diffusion from the bulk to the superficial layers of the material, is an important phenomenon as it
leads to the exposure of more dissolvable species at the surface. This flow of atoms can be
represented by an interior flux of lattice vacancies created by the dissolution of individual atomic
sites on the surface of the alloys [87]. Generally gold alloys, near the equiatomic composition, form
a face-centered cubic (FCC) lattice rather than a face-centered tetragonal (FCT) lattice. However,
above 683K (410 °C), two ordered crystallographic structures (AuCuI and AuCuII) exist. When the
AuCuI ordering prevails in the alloy, the arrangement of the atoms passes from FCC to FCT which
generates a considerable amount of strain as a result of the distortion of crystal lattice [88]. These
stresses lead to a decrease in the corrosion resistance of the material. The transition from the
compact cubic structure to the tetragonal one, allows the less noble elements to migrate across the
surface easily, which therefore increases the rate of volume diffusion.
In this thesis, the correlation between the residual stresses, resulting from the specific process
parameters of the production cycles of gold wires and their corrosion resistance, was analyzed. The
correlation between the decrease of the corrosion resistance and the increase of the tensile state can
be found in literature for steels and other materials, but not for gold [89, 90]. The residual stresses
were calculated using X-ray diffraction. A linear elastic distortion of the crystal lattice planes was
assumed. The penetration depth of the beam depends on the material and on the parameters of the
sample. Effectively, the measured strain is the average from depths less than a few microns under
the surface of the specimens. Considering a crystalline material, the planes of atoms can cause
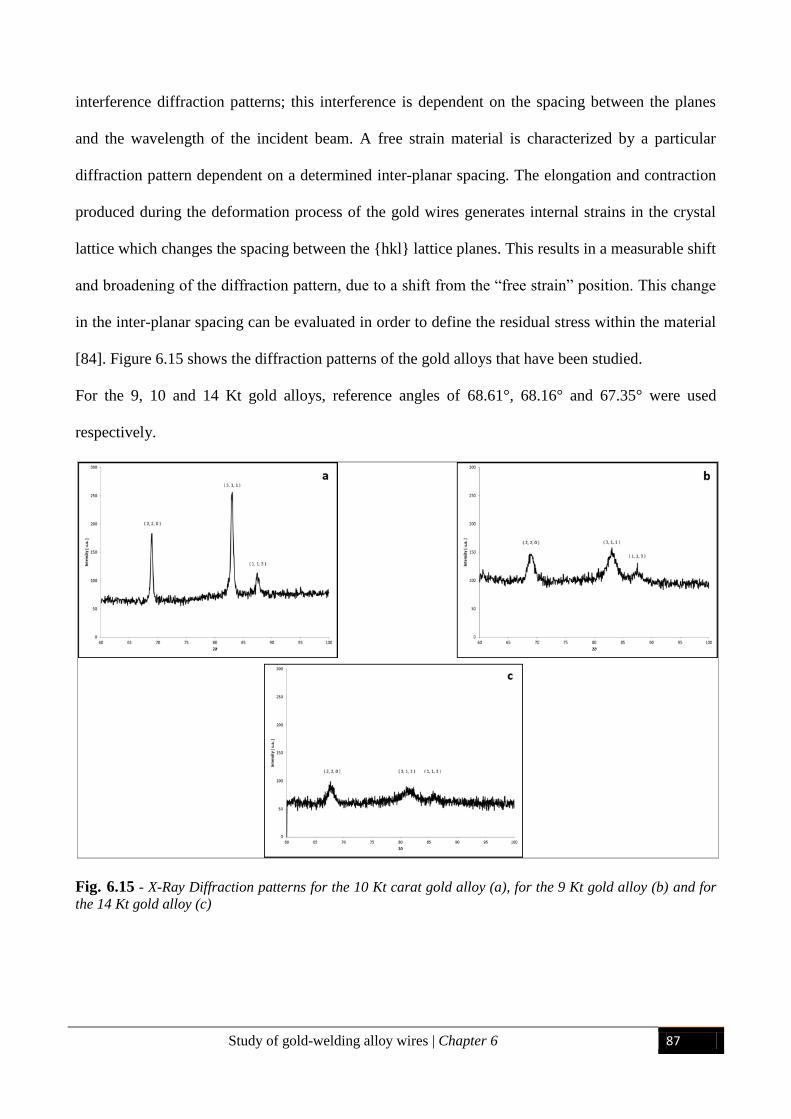
Study of gold-welding alloy wires | Chapter 6 87
interference diffraction patterns; this interference is dependent on the spacing between the planes
and the wavelength of the incident beam. A free strain material is characterized by a particular
diffraction pattern dependent on a determined inter-planar spacing. The elongation and contraction
produced during the deformation process of the gold wires generates internal strains in the crystal
lattice which changes the spacing between the {hkl} lattice planes. This results in a measurable shift
and broadening of the diffraction pattern, due to a shift from the “free strain” position. This change
in the inter-planar spacing can be evaluated in order to define the residual stress within the material
[84]. Figure 6.15 shows the diffraction patterns of the gold alloys that have been studied.
For the 9, 10 and 14 Kt gold alloys, reference angles of 68.61°, 68.16° and 67.35° were used
respectively.
Fig. 6.15 - X-Ray Diffraction patterns for the 10 Kt carat gold alloy (a), for the 9 Kt gold alloy (b) and for
the 14 Kt gold alloy (c)
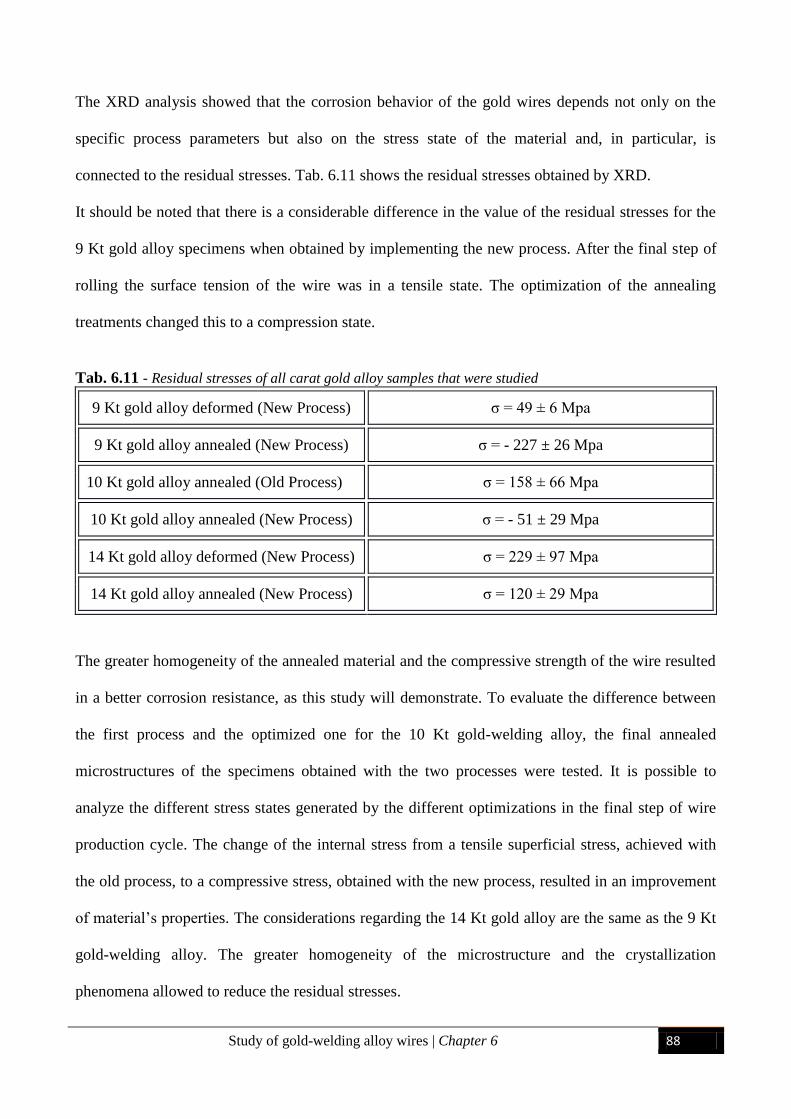
Study of gold-welding alloy wires | Chapter 6 88
The XRD analysis showed that the corrosion behavior of the gold wires depends not only on the
specific process parameters but also on the stress state of the material and, in particular, is
connected to the residual stresses. Tab. 6.11 shows the residual stresses obtained by XRD.
It should be noted that there is a considerable difference in the value of the residual stresses for the
9 Kt gold alloy specimens when obtained by implementing the new process. After the final step of
rolling the surface tension of the wire was in a tensile state. The optimization of the annealing
treatments changed this to a compression state.
Tab. 6.11 - Residual stresses of all carat gold alloy samples that were studied
9 Kt gold alloy deformed (New Process) σ = 49 ± 6 Mpa
9 Kt gold alloy annealed (New Process) σ = - 227 ± 26 Mpa
10 Kt gold alloy annealed (Old Process) σ = 158 ± 66 Mpa
10 Kt gold alloy annealed (New Process) σ = - 51 ± 29 Mpa
14 Kt gold alloy deformed (New Process) σ = 229 ± 97 Mpa
14 Kt gold alloy annealed (New Process) σ = 120 ± 29 Mpa
The greater homogeneity of the annealed material and the compressive strength of the wire resulted
in a better corrosion resistance, as this study will demonstrate. To evaluate the difference between
the first process and the optimized one for the 10 Kt gold-welding alloy, the final annealed
microstructures of the specimens obtained with the two processes were tested. It is possible to
analyze the different stress states generated by the different optimizations in the final step of wire
production cycle. The change of the internal stress from a tensile superficial stress, achieved with
the old process, to a compressive stress, obtained with the new process, resulted in an improvement
of material’s properties. The considerations regarding the 14 Kt gold alloy are the same as the 9 Kt
gold-welding alloy. The greater homogeneity of the microstructure and the crystallization
phenomena allowed to reduce the residual stresses.
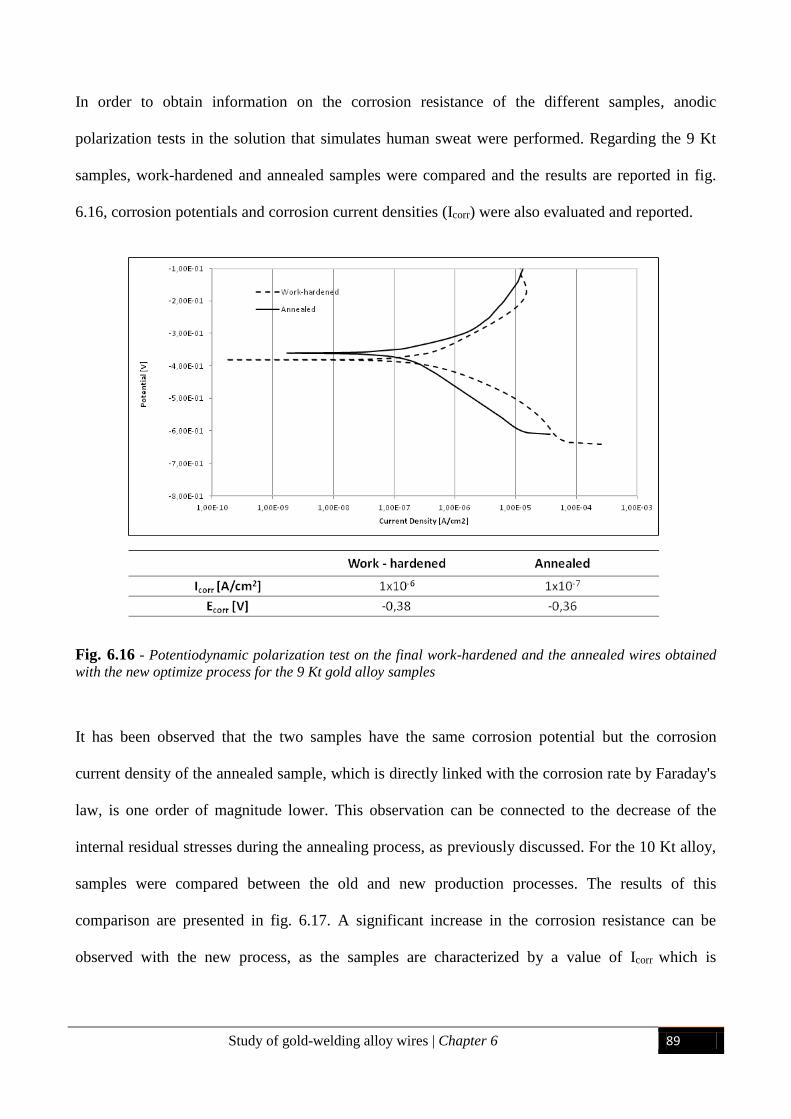
Study of gold-welding alloy wires | Chapter 6 89
In order to obtain information on the corrosion resistance of the different samples, anodic
polarization tests in the solution that simulates human sweat were performed. Regarding the 9 Kt
samples, work-hardened and annealed samples were compared and the results are reported in fig.
6.16, corrosion potentials and corrosion current densities (Icorr) were also evaluated and reported.
Fig. 6.16 - Potentiodynamic polarization test on the final work-hardened and the annealed wires obtained
with the new optimize process for the 9 Kt gold alloy samples
It has been observed that the two samples have the same corrosion potential but the corrosion
current density of the annealed sample, which is directly linked with the corrosion rate by Faraday's
law, is one order of magnitude lower. This observation can be connected to the decrease of the
internal residual stresses during the annealing process, as previously discussed. For the 10 Kt alloy,
samples were compared between the old and new production processes. The results of this
comparison are presented in fig. 6.17. A significant increase in the corrosion resistance can be
observed with the new process, as the samples are characterized by a value of Icorr which is
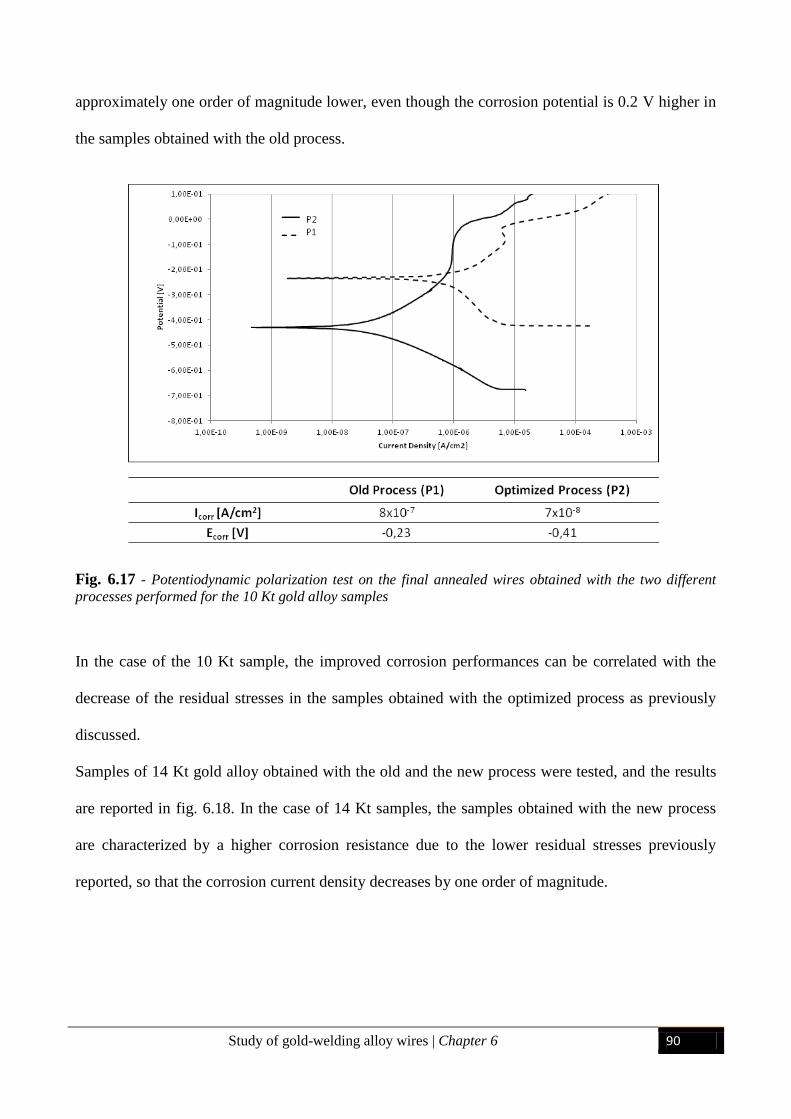
Study of gold-welding alloy wires | Chapter 6 90
approximately one order of magnitude lower, even though the corrosion potential is 0.2 V higher in
the samples obtained with the old process.
Fig. 6.17 - Potentiodynamic polarization test on the final annealed wires obtained with the two different
processes performed for the 10 Kt gold alloy samples
In the case of the 10 Kt sample, the improved corrosion performances can be correlated with the
decrease of the residual stresses in the samples obtained with the optimized process as previously
discussed.
Samples of 14 Kt gold alloy obtained with the old and the new process were tested, and the results
are reported in fig. 6.18. In the case of 14 Kt samples, the samples obtained with the new process
are characterized by a higher corrosion resistance due to the lower residual stresses previously
reported, so that the corrosion current density decreases by one order of magnitude.
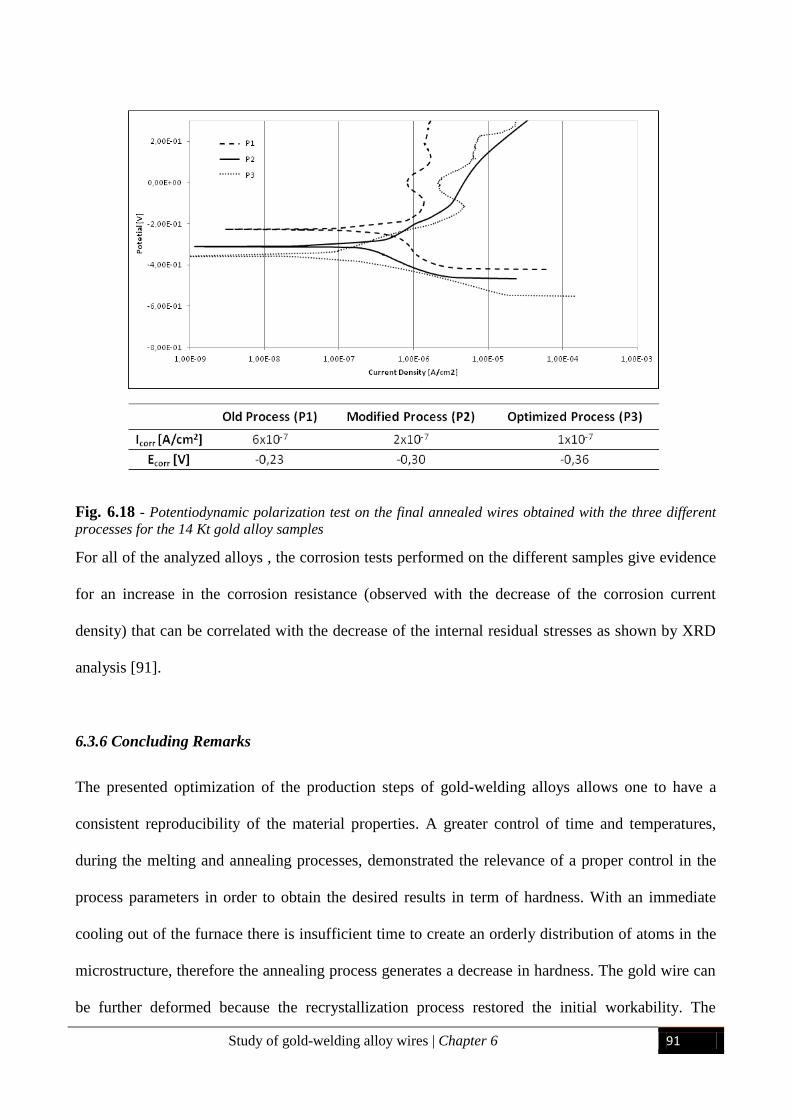
Study of gold-welding alloy wires | Chapter 6 91
Fig. 6.18 - Potentiodynamic polarization test on the final annealed wires obtained with the three different
processes for the 14 Kt gold alloy samples
For all of the analyzed alloys , the corrosion tests performed on the different samples give evidence
for an increase in the corrosion resistance (observed with the decrease of the corrosion current
density) that can be correlated with the decrease of the internal residual stresses as shown by XRD
analysis [91].
6.3.6 Concluding Remarks
The presented optimization of the production steps of gold-welding alloys allows one to have a
consistent reproducibility of the material properties. A greater control of time and temperatures,
during the melting and annealing processes, demonstrated the relevance of a proper control in the
process parameters in order to obtain the desired results in term of hardness. With an immediate
cooling out of the furnace there is insufficient time to create an orderly distribution of atoms in the
microstructure, therefore the annealing process generates a decrease in hardness. The gold wire can
be further deformed because the recrystallization process restored the initial workability. The
Study of gold-welding alloy wires | Chapter 6 92
optimization of the whole process had not only an influence on the hardness but, also, produced an
increase in the ductility of the gold alloys and in the microstructural homogeneity. The final grain
size was also reduced. The tensile tests, performed on the final annealed wires, showed a smaller
range of variability of the tensile curve, which is indicative of improved uniformity of properties
along the skein of yarn produced. The optimization of the melting, rolling and annealing processes
for gold-welding alloys wires allows for the reduction the residual stresses on the wires at the end of
the production cycle, with improvements in mechanical properties, machinability, corrosion
resistance during the emptying process, and a better finishing surface. The potentiodynamic
polarization tests performed on the samples showed the importance of minimizing the residual
stresses. It was shown that, independently of the carat of the gold alloys, the annealed
microstructures, characterized by a lower level of residual stresses, have a better corrosion
resistance. The corrosion current densities increased by one order of magnitude in the deformed
samples, which implies an increase in the corrosion rate. Considering the same annealed state on
samples produced either with the old process or with the optimized process, it is possible to say that
the grain size and the homogeneity of the microstructure strongly influence the corrosion
susceptibility of the gold alloys. Smaller grain size and greater homogeneity, obtained with the
optimized process, are preferred because these characteristics cause an increase in the corrosion
resistance of the material.

Study of gold-welding alloy wires | Chapter 6 93
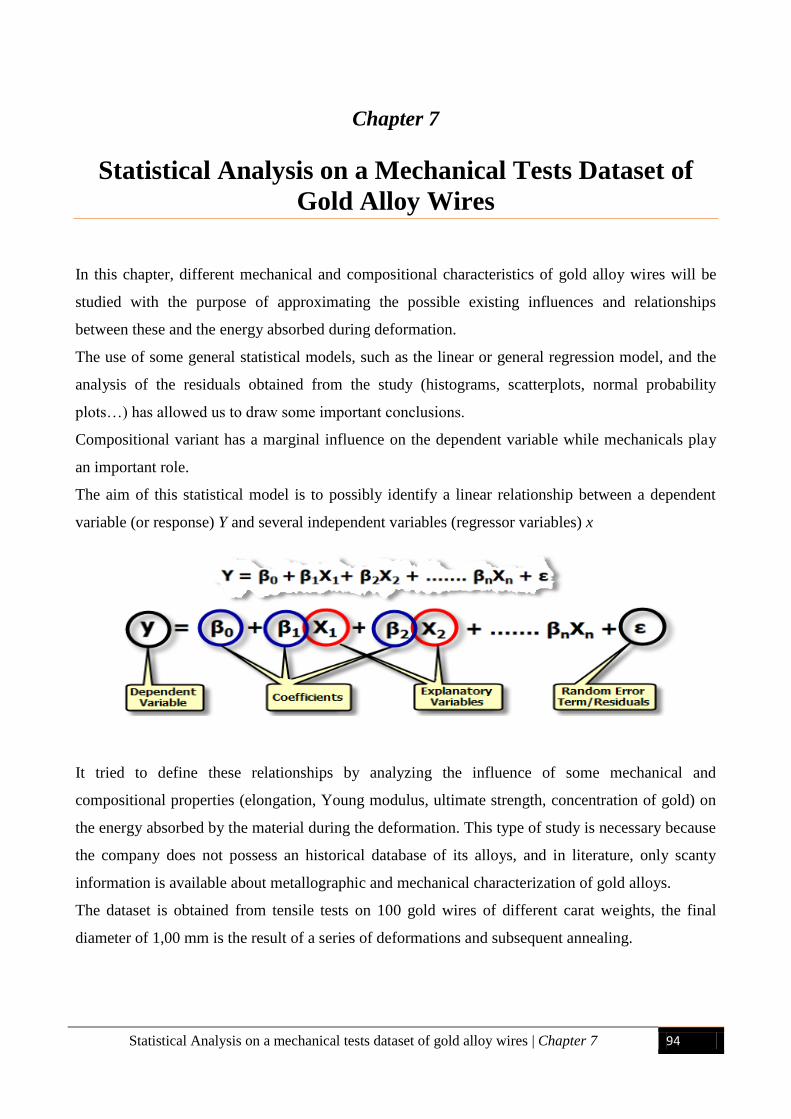
Statistical Analysis on a mechanical tests dataset of gold alloy wires | Chapter 7 94
Chapter 7
Statistical Analysis on a Mechanical Tests Dataset of
Gold Alloy Wires
In this chapter, different mechanical and compositional characteristics of gold alloy wires will be
studied with the purpose of approximating the possible existing influences and relationships
between these and the energy absorbed during deformation.
The use of some general statistical models, such as the linear or general regression model, and the
analysis of the residuals obtained from the study (histograms, scatterplots, normal probability
plots…) has allowed us to draw some important conclusions.
Compositional variant has a marginal influence on the dependent variable while mechanicals play
an important role.
The aim of this statistical model is to possibly identify a linear relationship between a dependent
variable (or response) Y and several independent variables (regressor variables) x
It tried to define these relationships by analyzing the influence of some mechanical and
compositional properties (elongation, Young modulus, ultimate strength, concentration of gold) on
the energy absorbed by the material during the deformation. This type of study is necessary because
the company does not possess an historical database of its alloys, and in literature, only scanty
information is available about metallographic and mechanical characterization of gold alloys.
The dataset is obtained from tensile tests on 100 gold wires of different carat weights, the final
diameter of 1,00 mm is the result of a series of deformations and subsequent annealing.
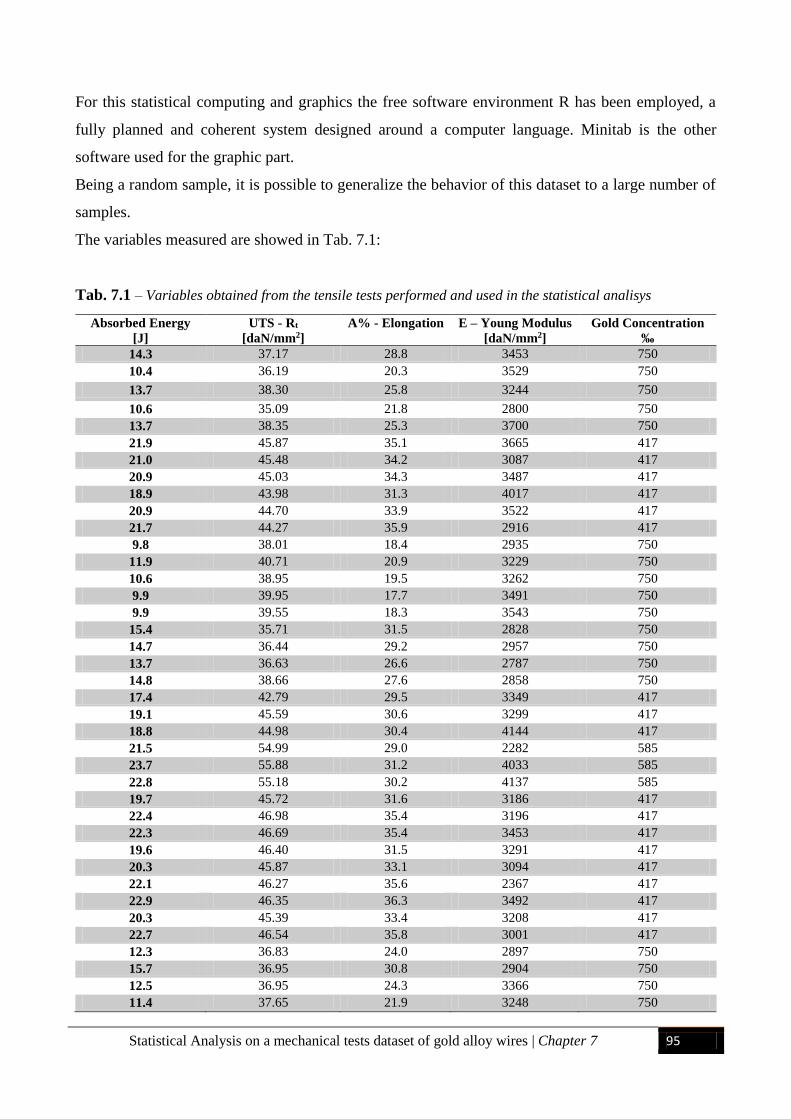
Statistical Analysis on a mechanical tests dataset of gold alloy wires | Chapter 7 95
For this statistical computing and graphics the free software environment R has been employed, a
fully planned and coherent system designed around a computer language. Minitab is the other
software used for the graphic part.
Being a random sample, it is possible to generalize the behavior of this dataset to a large number of
samples.
The variables measured are showed in Tab. 7.1:
Tab. 7.1 – Variables obtained from the tensile tests performed and used in the statistical analisys
Absorbed Energy
[J]
UTS - Rt
[daN/mm2]
A% - Elongation E – Young Modulus
[daN/mm2]
Gold Concentration
‰
14.3 37.17 28.8 3453 750
10.4 36.19 20.3 3529 750
13.7 38.30 25.8 3244 750
10.6 35.09 21.8 2800 750
13.7 38.35 25.3 3700 750
21.9 45.87 35.1 3665 417
21.0 45.48 34.2 3087 417
20.9 45.03 34.3 3487 417
18.9 43.98 31.3 4017 417
20.9 44.70 33.9 3522 417
21.7 44.27 35.9 2916 417
9.8 38.01 18.4 2935 750
11.9 40.71 20.9 3229 750
10.6 38.95 19.5 3262 750
9.9 39.95 17.7 3491 750
9.9 39.55 18.3 3543 750
15.4 35.71 31.5 2828 750
14.7 36.44 29.2 2957 750
13.7 36.63 26.6 2787 750
14.8 38.66 27.6 2858 750
17.4 42.79 29.5 3349 417
19.1 45.59 30.6 3299 417
18.8 44.98 30.4 4144 417
21.5 54.99 29.0 2282 585
23.7 55.88 31.2 4033 585
22.8 55.18 30.2 4137 585
19.7 45.72 31.6 3186 417
22.4 46.98 35.4 3196 417
22.3 46.69 35.4 3453 417
19.6 46.40 31.5 3291 417
20.3 45.87 33.1 3094 417
22.1 46.27 35.6 2367 417
22.9 46.35 36.3 3492 417
20.3 45.39 33.4 3208 417
22.7 46.54 35.8 3001 417
12.3 36.83 24.0 2897 750
15.7 36.95 30.8 2904 750
12.5 36.95 24.3 3366 750
11.4 37.65 21.9 3248 750
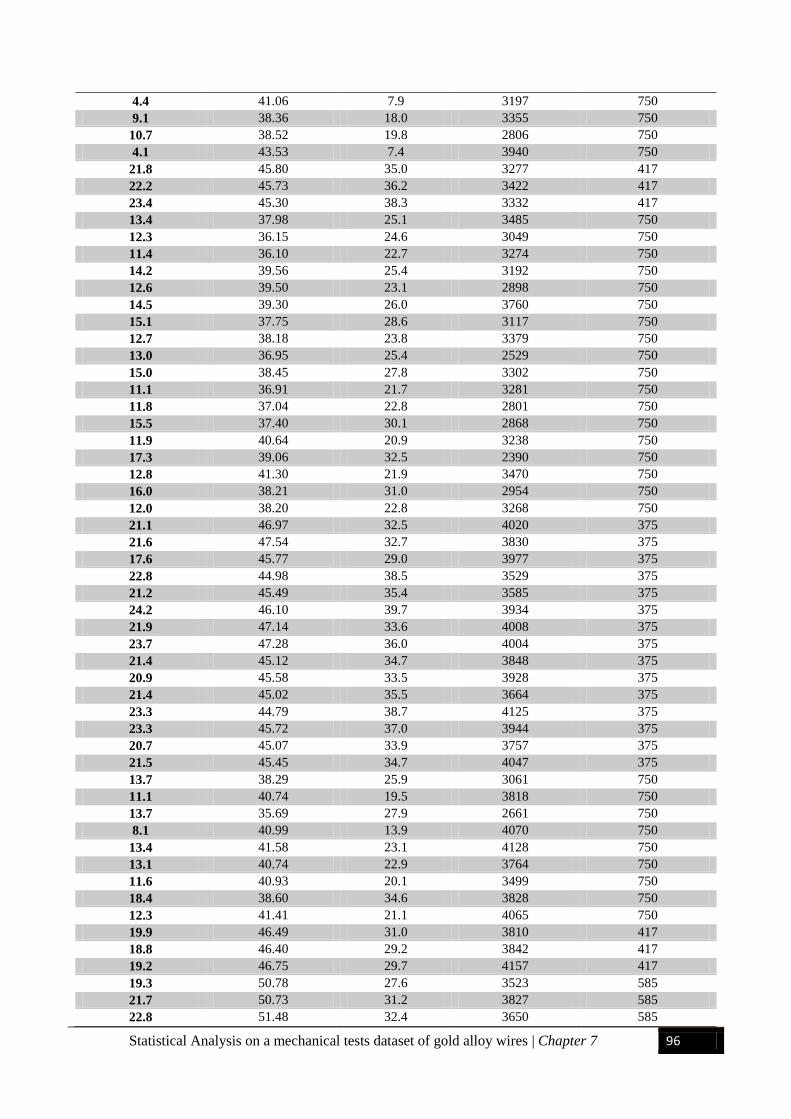
Statistical Analysis on a mechanical tests dataset of gold alloy wires | Chapter 7 96
4.4 41.06 7.9 3197 750
9.1 38.36 18.0 3355 750
10.7 38.52 19.8 2806 750
4.1 43.53 7.4 3940 750
21.8 45.80 35.0 3277 417
22.2 45.73 36.2 3422 417
23.4 45.30 38.3 3332 417
13.4 37.98 25.1 3485 750
12.3 36.15 24.6 3049 750
11.4 36.10 22.7 3274 750
14.2 39.56 25.4 3192 750
12.6 39.50 23.1 2898 750
14.5 39.30 26.0 3760 750
15.1 37.75 28.6 3117 750
12.7 38.18 23.8 3379 750
13.0 36.95 25.4 2529 750
15.0 38.45 27.8 3302 750
11.1 36.91 21.7 3281 750
11.8 37.04 22.8 2801 750
15.5 37.40 30.1 2868 750
11.9 40.64 20.9 3238 750
17.3 39.06 32.5 2390 750
12.8 41.30 21.9 3470 750
16.0 38.21 31.0 2954 750
12.0 38.20 22.8 3268 750
21.1 46.97 32.5 4020 375
21.6 47.54 32.7 3830 375
17.6 45.77 29.0 3977 375
22.8 44.98 38.5 3529 375
21.2 45.49 35.4 3585 375
24.2 46.10 39.7 3934 375
21.9 47.14 33.6 4008 375
23.7 47.28 36.0 4004 375
21.4 45.12 34.7 3848 375
20.9 45.58 33.5 3928 375
21.4 45.02 35.5 3664 375
23.3 44.79 38.7 4125 375
23.3 45.72 37.0 3944 375
20.7 45.07 33.9 3757 375
21.5 45.45 34.7 4047 375
13.7 38.29 25.9 3061 750
11.1 40.74 19.5 3818 750
13.7 35.69 27.9 2661 750
8.1 40.99 13.9 4070 750
13.4 41.58 23.1 4128 750
13.1 40.74 22.9 3764 750
11.6 40.93 20.1 3499 750
18.4 38.60 34.6 3828 750
12.3 41.41 21.1 4065 750
19.9 46.49 31.0 3810 417
18.8 46.40 29.2 3842 417
19.2 46.75 29.7 4157 417
19.3 50.78 27.6 3523 585
21.7 50.73 31.2 3827 585
22.8 51.48 32.4 3650 585
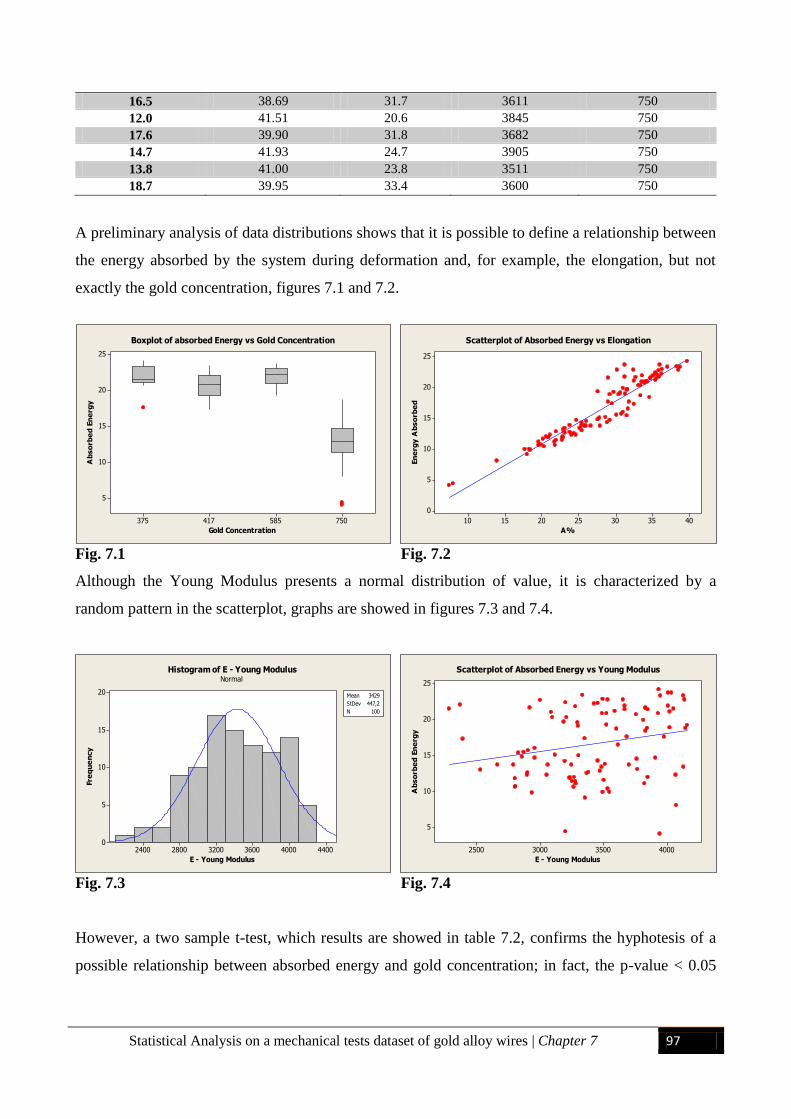
Statistical Analysis on a mechanical tests dataset of gold alloy wires | Chapter 7 97
16.5 38.69 31.7 3611 750
12.0 41.51 20.6 3845 750
17.6 39.90 31.8 3682 750
14.7 41.93 24.7 3905 750
13.8 41.00 23.8 3511 750
18.7 39.95 33.4 3600 750
A preliminary analysis of data distributions shows that it is possible to define a relationship between
the energy absorbed by the system during deformation and, for example, the elongation, but not
exactly the gold concentration, figures 7.1 and 7.2.
Fig. 7.1 Fig. 7.2
Although the Young Modulus presents a normal distribution of value, it is characterized by a
random pattern in the scatterplot, graphs are showed in figures 7.3 and 7.4.
Fig. 7.3 Fig. 7.4
However, a two sample t-test, which results are showed in table 7.2, confirms the hyphotesis of a
possible relationship between absorbed energy and gold concentration; in fact, the p-value < 0.05
750585417375
25
20
15
10
5
Gold Concentration
Ab
so
rbe
d E
ne
rgy
Boxplot of absorbed Energy vs Gold Concentration
40353025201510
25
20
15
10
5
0
A%
En
erg
y A
bso
rbe
d
Scatterplot of Absorbed Energy vs Elongation
440040003600320028002400
20
15
10
5
0
E - Young Modulus
Fre
qu
en
cy
Mean 3429
StDev 447,2
N 100
Normal
Histogram of E - Young Modulus
4000350030002500
25
20
15
10
5
E - Young Modulus
Ab
so
rbe
d E
ne
rgy
Scatterplot of Absorbed Energy vs Young Modulus
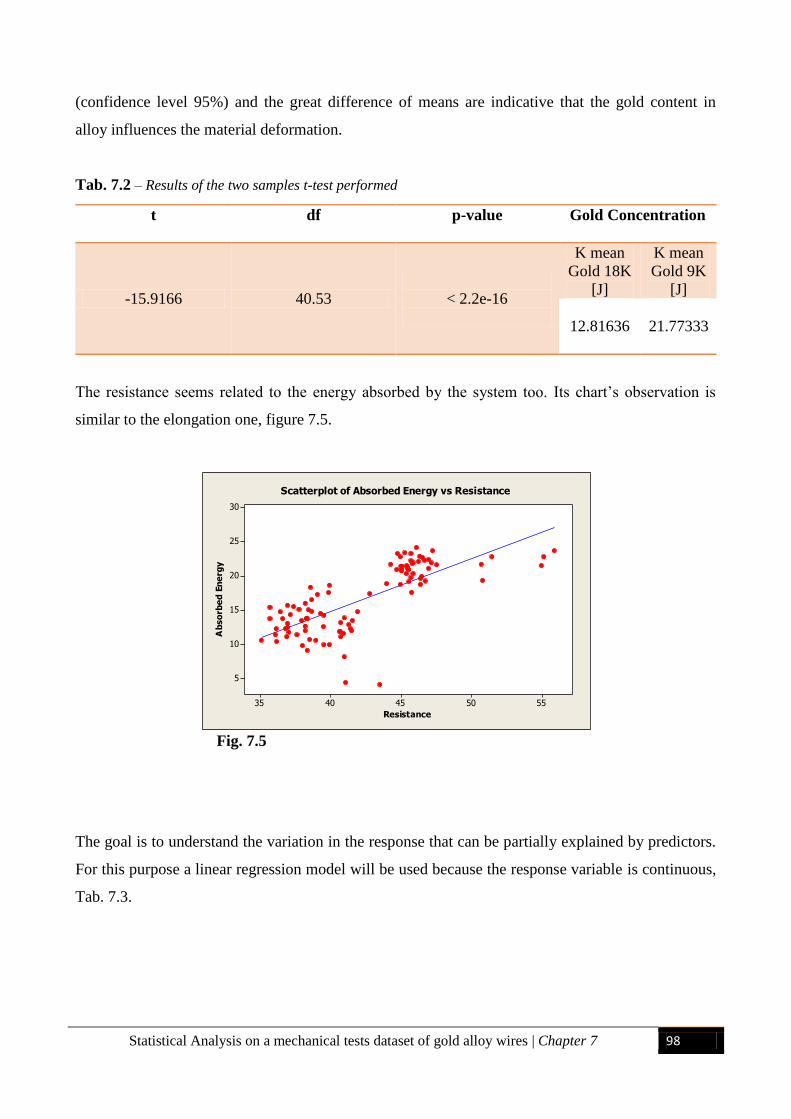
Statistical Analysis on a mechanical tests dataset of gold alloy wires | Chapter 7 98
(confidence level 95%) and the great difference of means are indicative that the gold content in
alloy influences the material deformation.
Tab. 7.2 – Results of the two samples t-test performed
t df p-value Gold Concentration
-15.9166 40.53
< 2.2e-16
K mean
Gold 18K
[J]
K mean
Gold 9K
[J]
12.81636
21.77333
The resistance seems related to the energy absorbed by the system too. Its chart’s observation is
similar to the elongation one, figure 7.5.
Fig. 7.5
The goal is to understand the variation in the response that can be partially explained by predictors.
For this purpose a linear regression model will be used because the response variable is continuous,
Tab. 7.3.
5550454035
30
25
20
15
10
5
Resistance
Ab
so
rbe
d E
ne
rgy
Scatterplot of Absorbed Energy vs Resistance
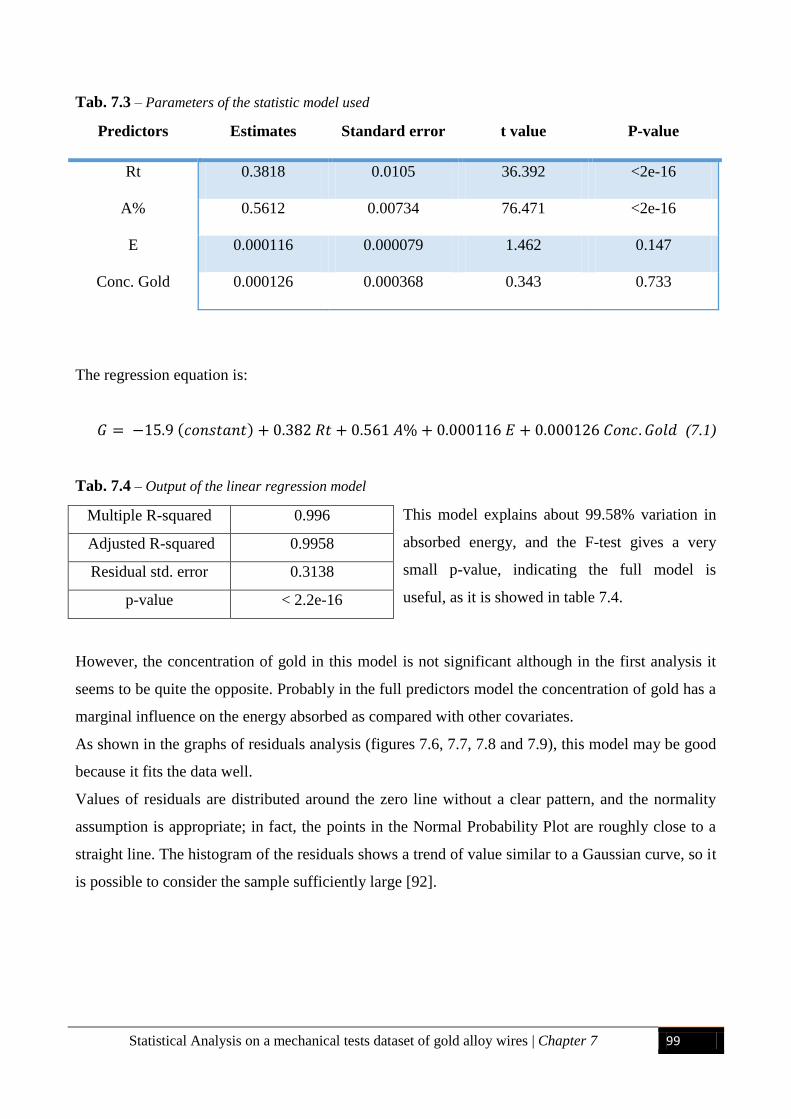
Statistical Analysis on a mechanical tests dataset of gold alloy wires | Chapter 7 99
Tab. 7.3 – Parameters of the statistic model used
Predictors Estimates Standard error t value P-value
Rt 0.3818 0.0105 36.392 <2e-16
A% 0.5612 0.00734 76.471 <2e-16
E 0.000116 0.000079 1.462 0.147
Conc. Gold 0.000126 0.000368 0.343 0.733
The regression equation is:
𝐺 = −15.9 (𝑐𝑜𝑛𝑠𝑡𝑎𝑛𝑡) + 0.382 𝑅𝑡 + 0.561 𝐴% + 0.000116 𝐸 + 0.000126 𝐶𝑜𝑛𝑐. 𝐺𝑜𝑙𝑑 (7.1)
Tab. 7.4 – Output of the linear regression model
This model explains about 99.58% variation in
absorbed energy, and the F-test gives a very
small p-value, indicating the full model is
useful, as it is showed in table 7.4.
However, the concentration of gold in this model is not significant although in the first analysis it
seems to be quite the opposite. Probably in the full predictors model the concentration of gold has a
marginal influence on the energy absorbed as compared with other covariates.
As shown in the graphs of residuals analysis (figures 7.6, 7.7, 7.8 and 7.9), this model may be good
because it fits the data well.
Values of residuals are distributed around the zero line without a clear pattern, and the normality
assumption is appropriate; in fact, the points in the Normal Probability Plot are roughly close to a
straight line. The histogram of the residuals shows a trend of value similar to a Gaussian curve, so it
is possible to consider the sample sufficiently large [92].
Multiple R-squared 0.996
Adjusted R-squared 0.9958
Residual std. error 0.3138
p-value < 2.2e-16
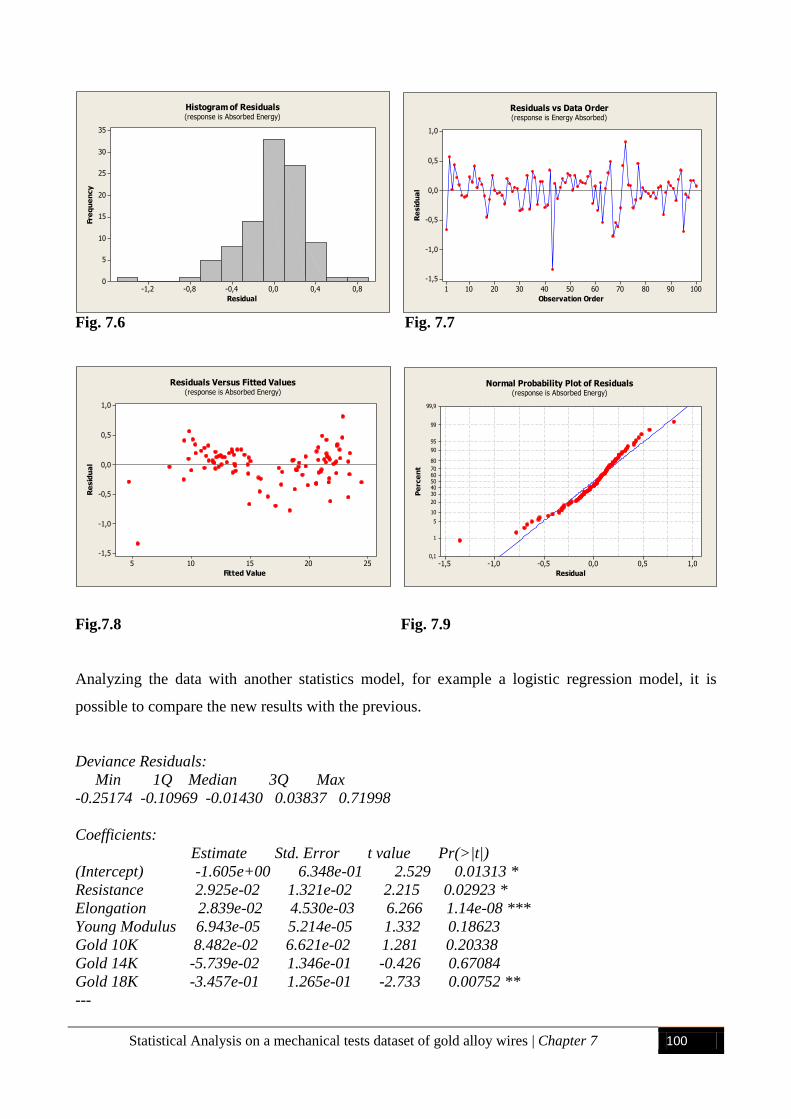
Statistical Analysis on a mechanical tests dataset of gold alloy wires | Chapter 7 100
Fig. 7.6 Fig. 7.7
Fig.7.8 Fig. 7.9
Analyzing the data with another statistics model, for example a logistic regression model, it is
possible to compare the new results with the previous.
Deviance Residuals:
Min 1Q Median 3Q Max
-0.25174 -0.10969 -0.01430 0.03837 0.71998
Coefficients:
Estimate Std. Error t value Pr(>|t|)
(Intercept) -1.605e+00 6.348e-01 2.529 0.01313 *
Resistance 2.925e-02 1.321e-02 2.215 0.02923 *
Elongation 2.839e-02 4.530e-03 6.266 1.14e-08 ***
Young Modulus 6.943e-05 5.214e-05 1.332 0.18623
Gold 10K 8.482e-02 6.621e-02 1.281 0.20338
Gold 14K -5.739e-02 1.346e-01 -0.426 0.67084
Gold 18K -3.457e-01 1.265e-01 -2.733 0.00752 **
---
0,80,40,0-0,4-0,8-1,2
35
30
25
20
15
10
5
0
Residual
Fre
qu
en
cy
Histogram of Residuals(response is Absorbed Energy)
1009080706050403020101
1,0
0,5
0,0
-0,5
-1,0
-1,5
Observation Order
Re
sid
ua
l
Residuals vs Data Order(response is Energy Absorbed)
252015105
1,0
0,5
0,0
-0,5
-1,0
-1,5
Fitted Value
Re
sid
ua
l
Residuals Versus Fitted Values(response is Absorbed Energy)
1,00,50,0-0,5-1,0-1,5
99,9
99
95
90
80
7060504030
20
10
5
1
0,1
Residual
Pe
rce
nt
Normal Probability Plot of Residuals(response is Absorbed Energy)
Statistical Analysis on a mechanical tests dataset of gold alloy wires | Chapter 7 101
Signif. codes: 0 ‘***’ 0.001 ‘**’ 0.01 ‘*’ 0.05 ‘.’ 0.1 ‘ ’ 1
The interpretation of the regression coefficient is similar for linear regression and logistic
regression.
The influence of the Young Modulus on the absorbed energy is not significant as already seen in the
previous model, and only the concentration of 18K gold seems linked to energy. This could explain
the hyphotesis of the partial influence of this characteristic on the values of the response.
These results indicate that the selected covariates may be related to absorbed energy, whether
energy is viewed as a continuous variable or a discrete variable.
Finally, a possible linear relationship between absorbed energy, tensile strength and elongation was
defined, with a useful statistical model:
𝐴𝑏𝑠𝑜𝑟𝑏𝑒𝑑 𝑒𝑛𝑒𝑟𝑔𝑦 = −15.9 (𝑐𝑜𝑛𝑠𝑡𝑎𝑛𝑡) + 0.382 𝑅𝑡 + 0.561 𝐴% (7.2)
These conclusions and results can be generalized to other more general settings because, in this
analysis, the most common commercial type of gold alloys have been investigated.
It is important to pay attention to the concentration of gold and its not linear relationship with the
energy absorbed during deformation.
The large sample used is quite representative of a bigger population so the statistical analysis, the p-
values and the diagnostic analysis of residuals can be considered objectively valid. However, it is
not always true, probably because the data may not be strictly independent.
Study of gold alloys used in the production of cable chain | Chapter 8 102
Chapter 8
Study of 10 Kt Gold Alloys Used in Cable Chain
Industrial Production Processes
8.1 INTRODUCTION
In this chapter, the production processes parameters of gold alloys plates were investigated to
optimize the microstructure and the mechanical properties of the products. These gold alloys plates
were successively welded to an iron sheet to create the base for the final hollow chain products.
For this study, two different 10 Kt gold alloys were used: one containing a higher amount of silver
and Co as grain refiner, the other one with a lower amount of silver and ruthenium as grain refiner.
The microstructures were analyzed by optical and scanning electron microscopy, whereas the
variation of mechanical properties by micro-hardness tests. The changing of the process parameters
and of the compositions of the alloys may lead to different levels of residual stresses within the
material, which can generate a variation in the mechanical and corrosion behavior of gold sheets.
The residual stresses of the samples were evaluated using XRD analysis, whereas the corrosion
resistance by potentiodynamic polarization tests. The results showed that with the optimized
process and using the alloy with ruthenium a higher homogeneity of the microstructure, with an
increase of the quality of semi-finished products, was obtained.
Moreover, to improve the weldability of the final chains, a different gold welding alloy with a lower
melting point was developed and optimized.
8.2 EXPERIMENTAL PROCEDURE
Object of this research were gold alloys sheets that are used to be welded to an iron sheet to create
the base for the final hollow chain products. In the production of hollow chains, the iron core is
necessary to support the gold sheet, during the plastic deformation processes, when the double-layer
wire is produced. A solder wire is inserted after the plating of gold and iron sheets to allow the
welding process after the chain’s formation [72].This iron core has to be removed by chemical
dissolution in HCl solutions [85]. During this step, called “emptying” process, the corrosion
phenomena have to be monitored to avoid problem on the final quality of the products.
In the present work, the production parameters process of gold alloys sheets were studied to
optimize the whole process. In particular, to avoid rupture during rolling process, the parameters of
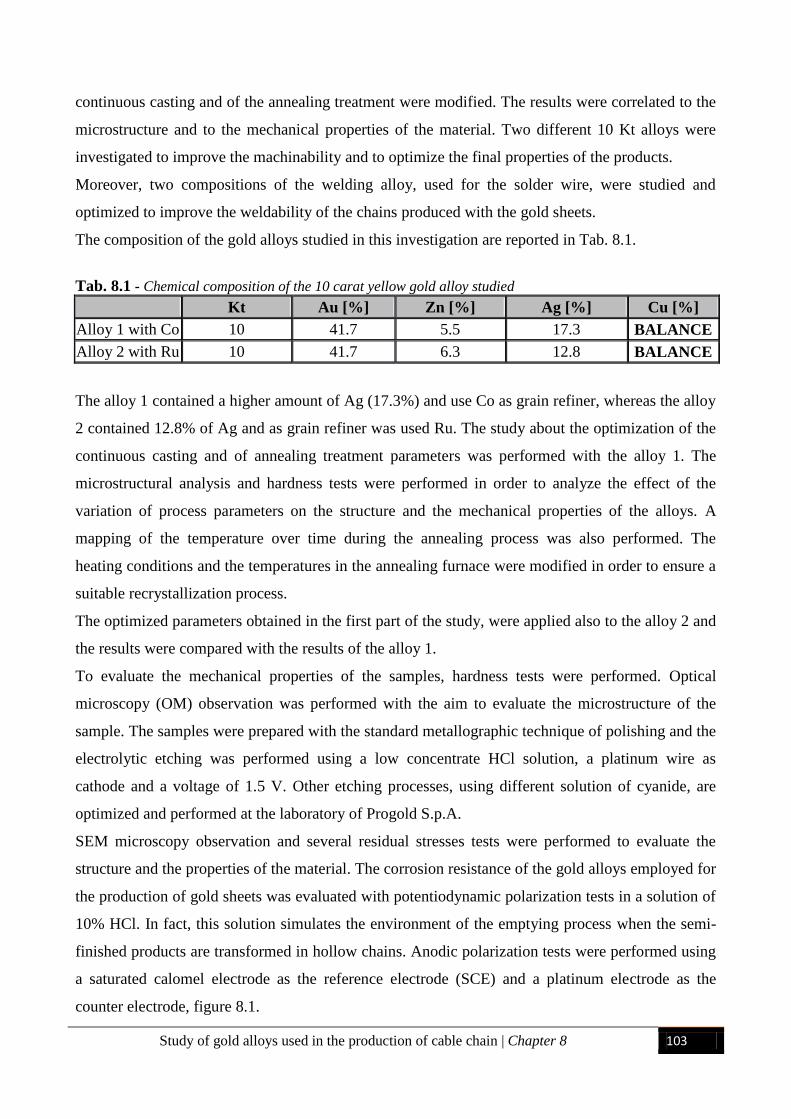
Study of gold alloys used in the production of cable chain | Chapter 8 103
continuous casting and of the annealing treatment were modified. The results were correlated to the
microstructure and to the mechanical properties of the material. Two different 10 Kt alloys were
investigated to improve the machinability and to optimize the final properties of the products.
Moreover, two compositions of the welding alloy, used for the solder wire, were studied and
optimized to improve the weldability of the chains produced with the gold sheets.
The composition of the gold alloys studied in this investigation are reported in Tab. 8.1.
Tab. 8.1 - Chemical composition of the 10 carat yellow gold alloy studied
Kt Au [%] Zn [%] Ag [%] Cu [%]
Alloy 1 with Co 10 41.7 5.5 17.3 BALANCE
Alloy 2 with Ru 10 41.7 6.3 12.8 BALANCE
The alloy 1 contained a higher amount of Ag (17.3%) and use Co as grain refiner, whereas the alloy
2 contained 12.8% of Ag and as grain refiner was used Ru. The study about the optimization of the
continuous casting and of annealing treatment parameters was performed with the alloy 1. The
microstructural analysis and hardness tests were performed in order to analyze the effect of the
variation of process parameters on the structure and the mechanical properties of the alloys. A
mapping of the temperature over time during the annealing process was also performed. The
heating conditions and the temperatures in the annealing furnace were modified in order to ensure a
suitable recrystallization process.
The optimized parameters obtained in the first part of the study, were applied also to the alloy 2 and
the results were compared with the results of the alloy 1.
To evaluate the mechanical properties of the samples, hardness tests were performed. Optical
microscopy (OM) observation was performed with the aim to evaluate the microstructure of the
sample. The samples were prepared with the standard metallographic technique of polishing and the
electrolytic etching was performed using a low concentrate HCl solution, a platinum wire as
cathode and a voltage of 1.5 V. Other etching processes, using different solution of cyanide, are
optimized and performed at the laboratory of Progold S.p.A.
SEM microscopy observation and several residual stresses tests were performed to evaluate the
structure and the properties of the material. The corrosion resistance of the gold alloys employed for
the production of gold sheets was evaluated with potentiodynamic polarization tests in a solution of
10% HCl. In fact, this solution simulates the environment of the emptying process when the semi-
finished products are transformed in hollow chains. Anodic polarization tests were performed using
a saturated calomel electrode as the reference electrode (SCE) and a platinum electrode as the
counter electrode, figure 8.1.
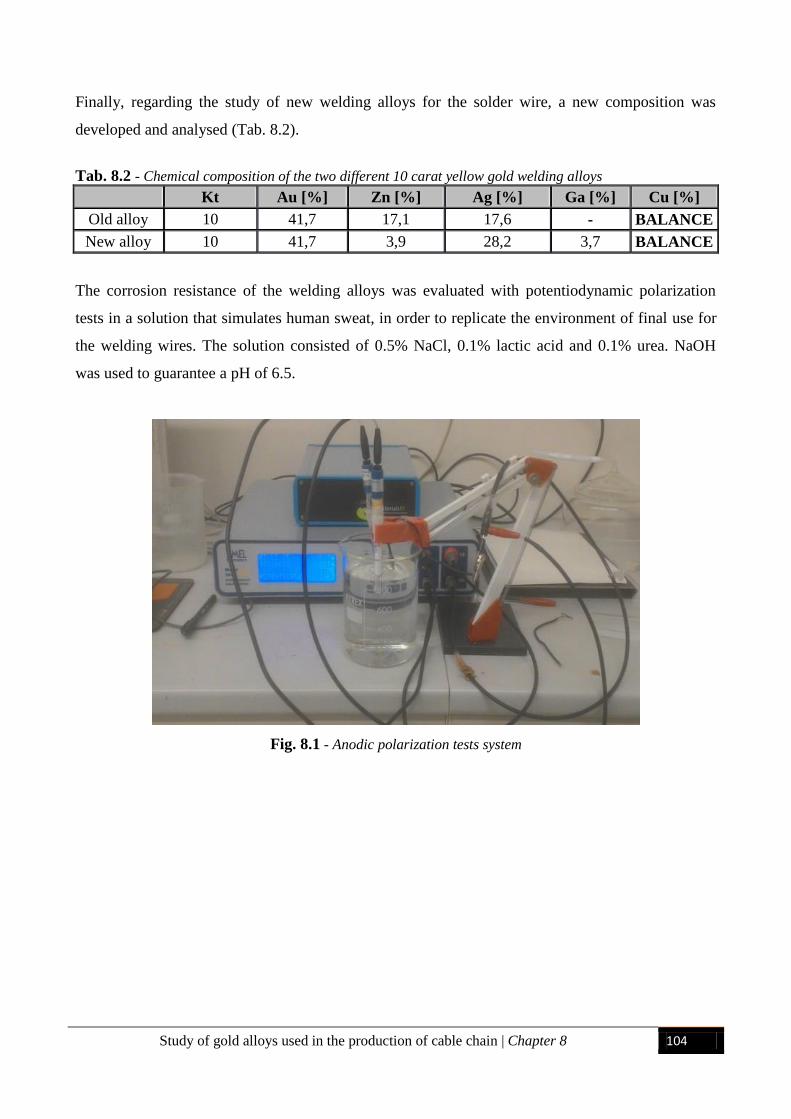
Study of gold alloys used in the production of cable chain | Chapter 8 104
Finally, regarding the study of new welding alloys for the solder wire, a new composition was
developed and analysed (Tab. 8.2).
Tab. 8.2 - Chemical composition of the two different 10 carat yellow gold welding alloys
Kt Au [%] Zn [%] Ag [%] Ga [%] Cu [%]
Old alloy 10 41,7 17,1 17,6 - BALANCE
New alloy 10 41,7 3,9 28,2 3,7 BALANCE
The corrosion resistance of the welding alloys was evaluated with potentiodynamic polarization
tests in a solution that simulates human sweat, in order to replicate the environment of final use for
the welding wires. The solution consisted of 0.5% NaCl, 0.1% lactic acid and 0.1% urea. NaOH
was used to guarantee a pH of 6.5.
Fig. 8.1 - Anodic polarization tests system
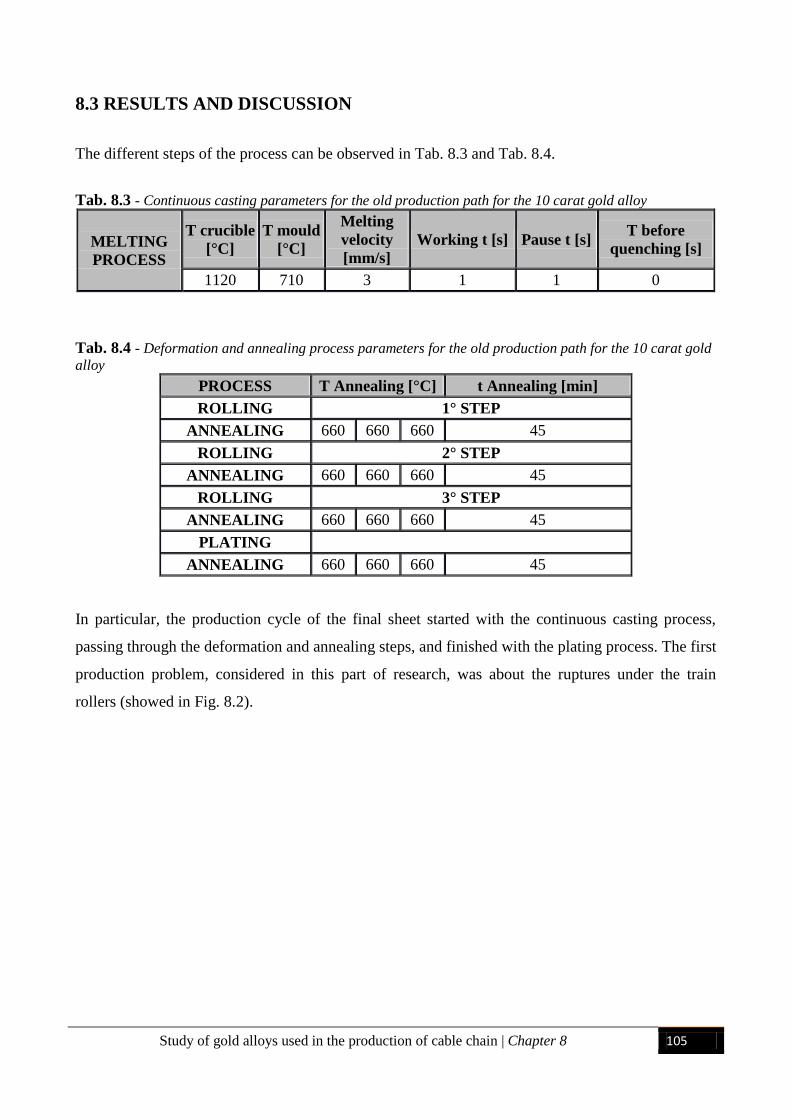
Study of gold alloys used in the production of cable chain | Chapter 8 105
8.3 RESULTS AND DISCUSSION
The different steps of the process can be observed in Tab. 8.3 and Tab. 8.4.
Tab. 8.3 - Continuous casting parameters for the old production path for the 10 carat gold alloy
MELTING
PROCESS
T crucible
[°C]
T mould
[°C]
Melting
velocity
[mm/s]
Working t [s] Pause t [s] T before
quenching [s]
1120 710 3 1 1 0
Tab. 8.4 - Deformation and annealing process parameters for the old production path for the 10 carat gold
alloy
PROCESS T Annealing [°C] t Annealing [min]
ROLLING 1° STEP
ANNEALING 660 660 660 45
ROLLING 2° STEP
ANNEALING 660 660 660 45
ROLLING 3° STEP
ANNEALING 660 660 660 45
PLATING
ANNEALING 660 660 660 45
In particular, the production cycle of the final sheet started with the continuous casting process,
passing through the deformation and annealing steps, and finished with the plating process. The first
production problem, considered in this part of research, was about the ruptures under the train
rollers (showed in Fig. 8.2).
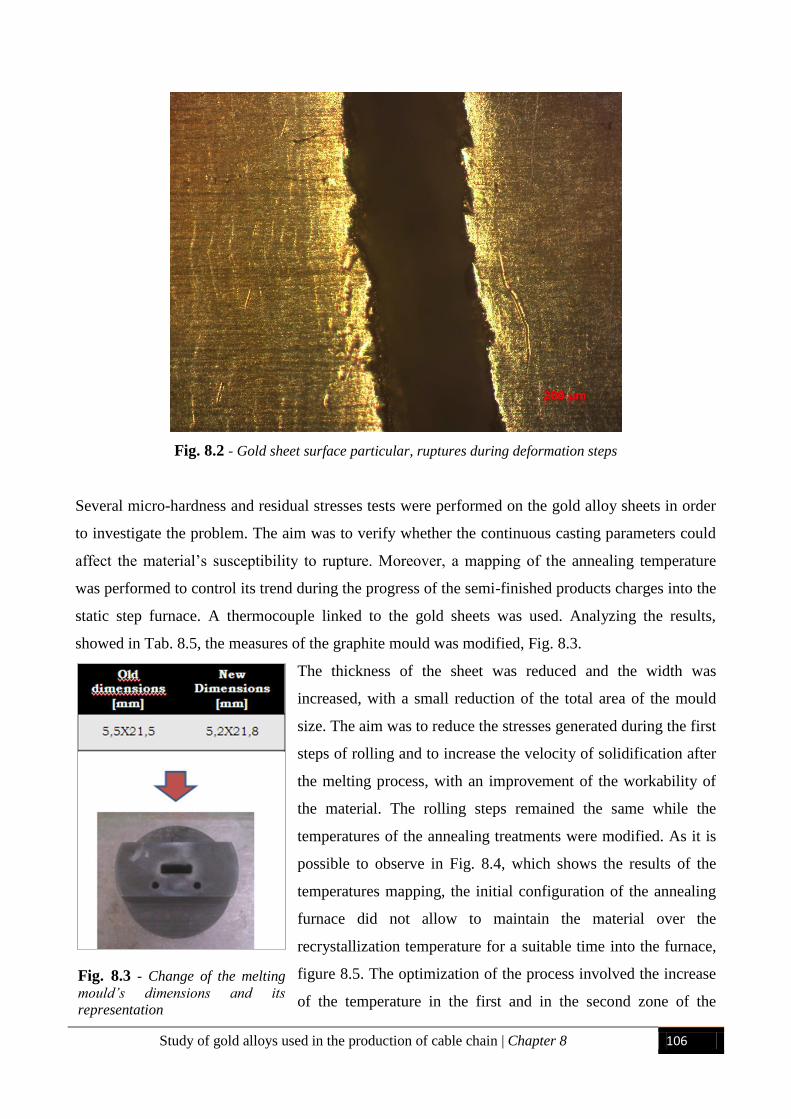
Study of gold alloys used in the production of cable chain | Chapter 8 106
Fig. 8.2 - Gold sheet surface particular, ruptures during deformation steps
Several micro-hardness and residual stresses tests were performed on the gold alloy sheets in order
to investigate the problem. The aim was to verify whether the continuous casting parameters could
affect the material’s susceptibility to rupture. Moreover, a mapping of the annealing temperature
was performed to control its trend during the progress of the semi-finished products charges into the
static step furnace. A thermocouple linked to the gold sheets was used. Analyzing the results,
showed in Tab. 8.5, the measures of the graphite mould was modified, Fig. 8.3.
The thickness of the sheet was reduced and the width was
increased, with a small reduction of the total area of the mould
size. The aim was to reduce the stresses generated during the first
steps of rolling and to increase the velocity of solidification after
the melting process, with an improvement of the workability of
the material. The rolling steps remained the same while the
temperatures of the annealing treatments were modified. As it is
possible to observe in Fig. 8.4, which shows the results of the
temperatures mapping, the initial configuration of the annealing
furnace did not allow to maintain the material over the
recrystallization temperature for a suitable time into the furnace,
figure 8.5. The optimization of the process involved the increase
of the temperature in the first and in the second zone of the
Fig. 8.3 - Change of the melting
mould’s dimensions and its
representation
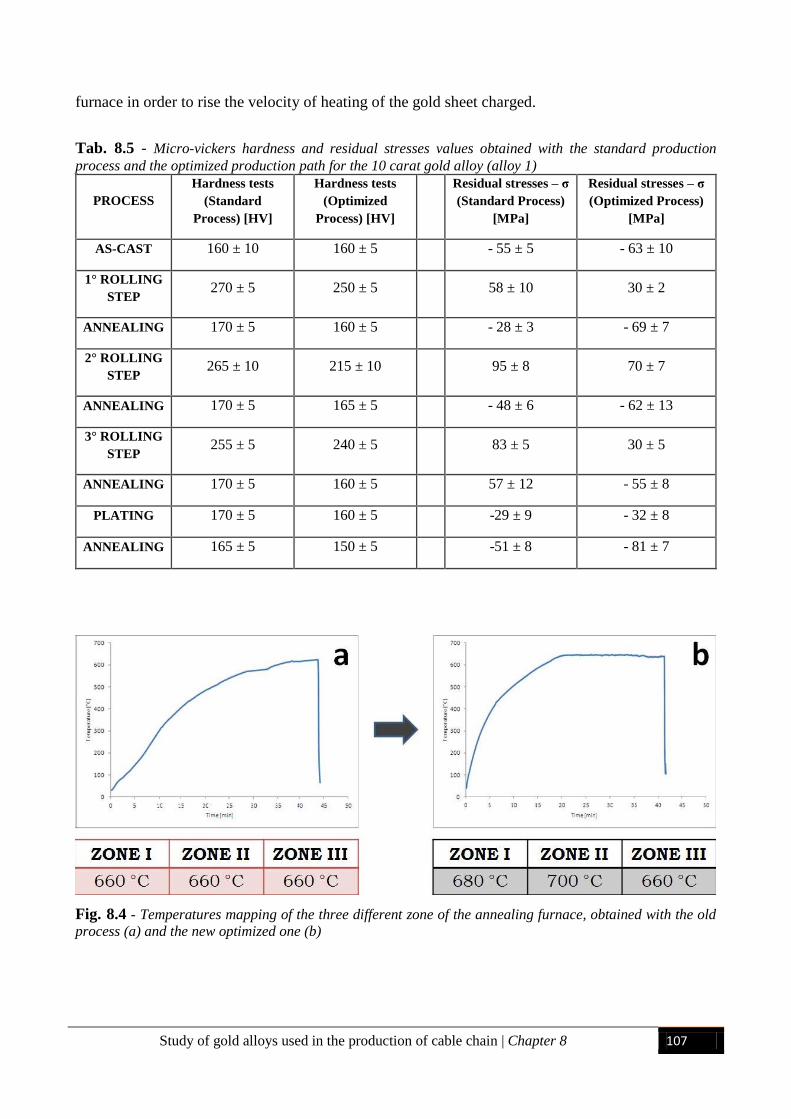
Study of gold alloys used in the production of cable chain | Chapter 8 107
furnace in order to rise the velocity of heating of the gold sheet charged.
Tab. 8.5 - Micro-vickers hardness and residual stresses values obtained with the standard production
process and the optimized production path for the 10 carat gold alloy (alloy 1)
PROCESS
Hardness tests
(Standard
Process) [HV]
Hardness tests
(Optimized
Process) [HV]
Residual stresses – σ
(Standard Process)
[MPa]
Residual stresses – σ
(Optimized Process)
[MPa]
AS-CAST 160 ± 10 160 ± 5 - 55 ± 5 - 63 ± 10
1° ROLLING
STEP 270 ± 5 250 ± 5 58 ± 10 30 ± 2
ANNEALING 170 ± 5 160 ± 5 - 28 ± 3 - 69 ± 7
2° ROLLING
STEP 265 ± 10 215 ± 10 95 ± 8 70 ± 7
ANNEALING 170 ± 5 165 ± 5 - 48 ± 6 - 62 ± 13
3° ROLLING
STEP 255 ± 5 240 ± 5 83 ± 5 30 ± 5
ANNEALING 170 ± 5 160 ± 5 57 ± 12 - 55 ± 8
PLATING 170 ± 5 160 ± 5 -29 ± 9 - 32 ± 8
ANNEALING 165 ± 5 150 ± 5 -51 ± 8 - 81 ± 7
Fig. 8.4 - Temperatures mapping of the three different zone of the annealing furnace, obtained with the old
process (a) and the new optimized one (b)
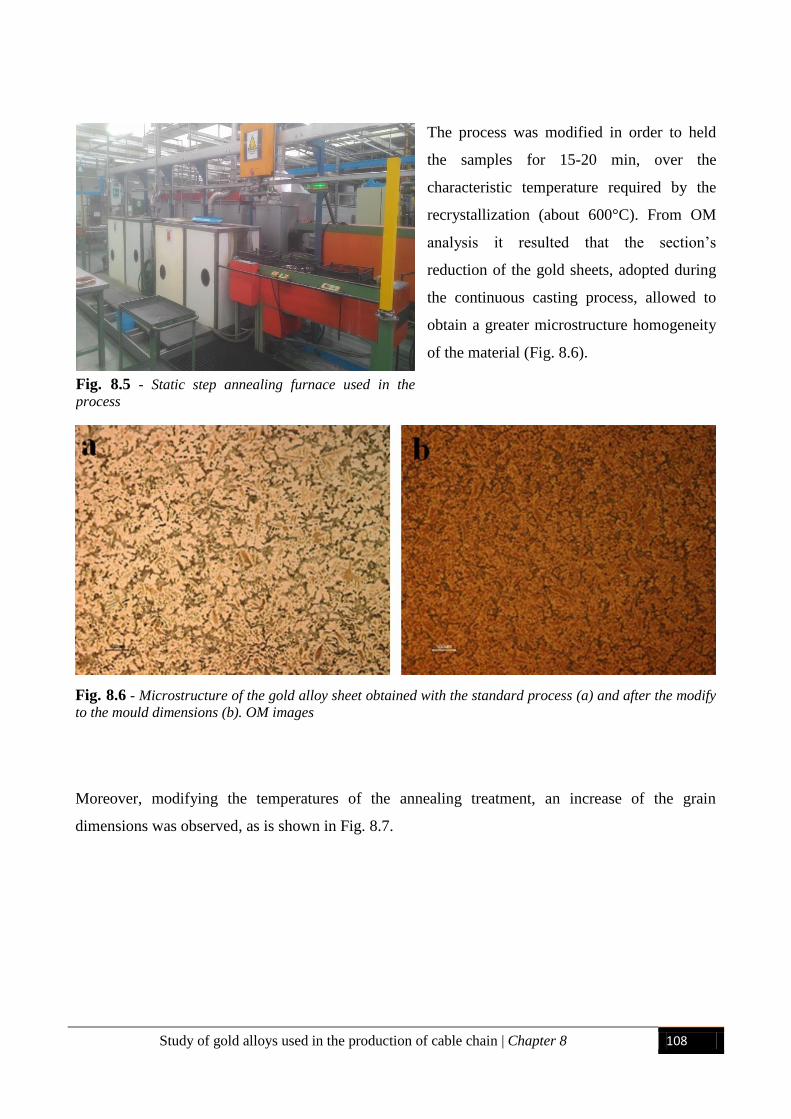
Study of gold alloys used in the production of cable chain | Chapter 8 108
The process was modified in order to held
the samples for 15-20 min, over the
characteristic temperature required by the
recrystallization (about 600°C). From OM
analysis it resulted that the section’s
reduction of the gold sheets, adopted during
the continuous casting process, allowed to
obtain a greater microstructure homogeneity
of the material (Fig. 8.6).
Fig. 8.6 - Microstructure of the gold alloy sheet obtained with the standard process (a) and after the modify
to the mould dimensions (b). OM images
Moreover, modifying the temperatures of the annealing treatment, an increase of the grain
dimensions was observed, as is shown in Fig. 8.7.
Fig. 8.5 - Static step annealing furnace used in the
process
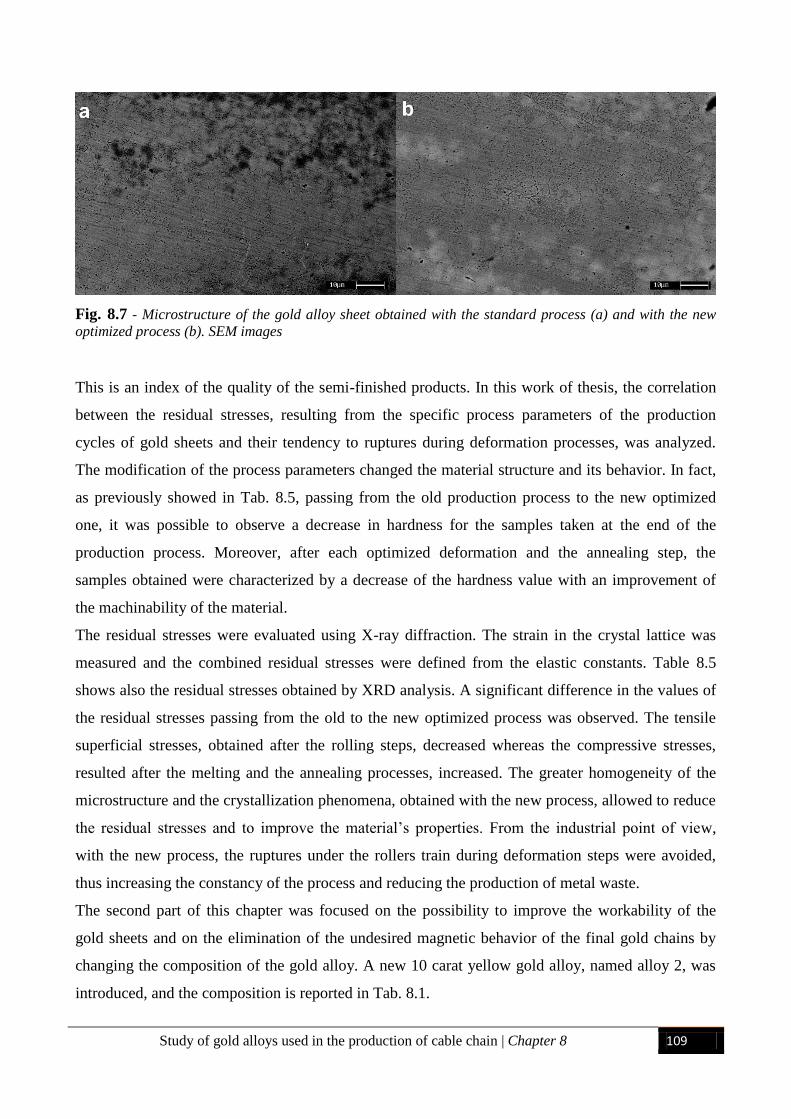
Study of gold alloys used in the production of cable chain | Chapter 8 109
Fig. 8.7 - Microstructure of the gold alloy sheet obtained with the standard process (a) and with the new
optimized process (b). SEM images
This is an index of the quality of the semi-finished products. In this work of thesis, the correlation
between the residual stresses, resulting from the specific process parameters of the production
cycles of gold sheets and their tendency to ruptures during deformation processes, was analyzed.
The modification of the process parameters changed the material structure and its behavior. In fact,
as previously showed in Tab. 8.5, passing from the old production process to the new optimized
one, it was possible to observe a decrease in hardness for the samples taken at the end of the
production process. Moreover, after each optimized deformation and the annealing step, the
samples obtained were characterized by a decrease of the hardness value with an improvement of
the machinability of the material.
The residual stresses were evaluated using X-ray diffraction. The strain in the crystal lattice was
measured and the combined residual stresses were defined from the elastic constants. Table 8.5
shows also the residual stresses obtained by XRD analysis. A significant difference in the values of
the residual stresses passing from the old to the new optimized process was observed. The tensile
superficial stresses, obtained after the rolling steps, decreased whereas the compressive stresses,
resulted after the melting and the annealing processes, increased. The greater homogeneity of the
microstructure and the crystallization phenomena, obtained with the new process, allowed to reduce
the residual stresses and to improve the material’s properties. From the industrial point of view,
with the new process, the ruptures under the rollers train during deformation steps were avoided,
thus increasing the constancy of the process and reducing the production of metal waste.
The second part of this chapter was focused on the possibility to improve the workability of the
gold sheets and on the elimination of the undesired magnetic behavior of the final gold chains by
changing the composition of the gold alloy. A new 10 carat yellow gold alloy, named alloy 2, was
introduced, and the composition is reported in Tab. 8.1.
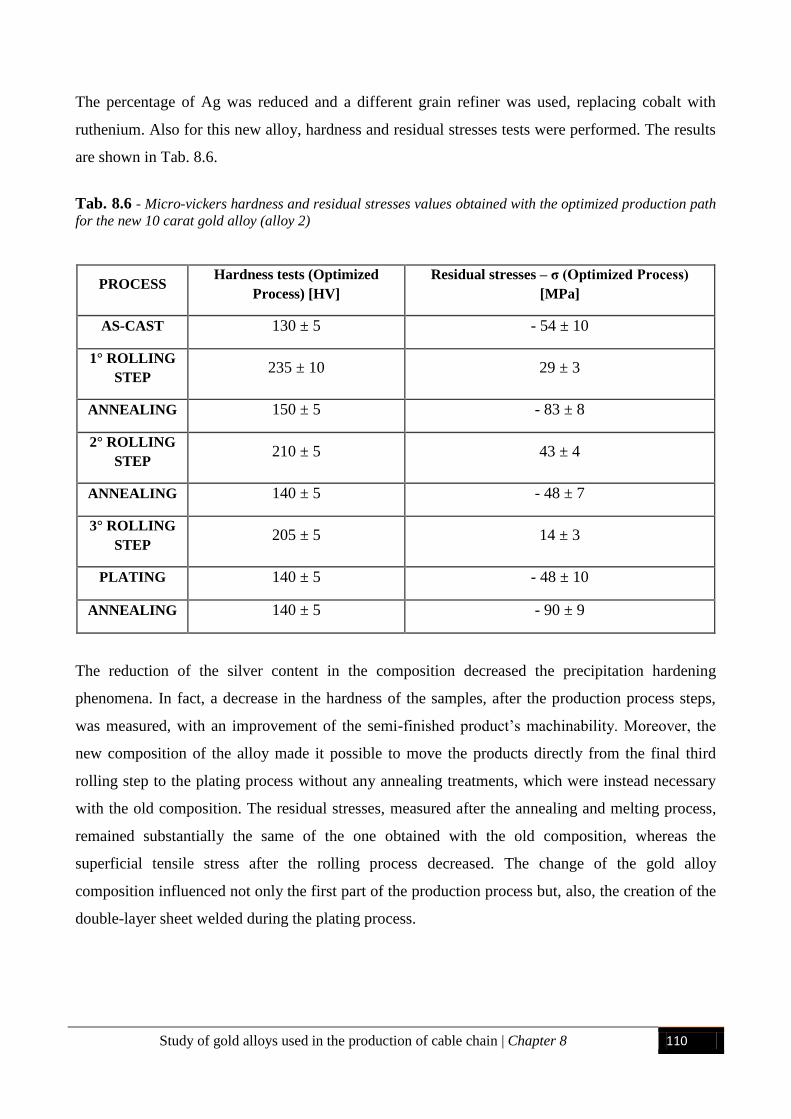
Study of gold alloys used in the production of cable chain | Chapter 8 110
The percentage of Ag was reduced and a different grain refiner was used, replacing cobalt with
ruthenium. Also for this new alloy, hardness and residual stresses tests were performed. The results
are shown in Tab. 8.6.
Tab. 8.6 - Micro-vickers hardness and residual stresses values obtained with the optimized production path
for the new 10 carat gold alloy (alloy 2)
PROCESS Hardness tests (Optimized
Process) [HV]
Residual stresses – σ (Optimized Process)
[MPa]
AS-CAST 130 ± 5 - 54 ± 10
1° ROLLING
STEP 235 ± 10 29 ± 3
ANNEALING 150 ± 5 - 83 ± 8
2° ROLLING
STEP 210 ± 5 43 ± 4
ANNEALING 140 ± 5 - 48 ± 7
3° ROLLING
STEP 205 ± 5 14 ± 3
PLATING 140 ± 5 - 48 ± 10
ANNEALING 140 ± 5 - 90 ± 9
The reduction of the silver content in the composition decreased the precipitation hardening
phenomena. In fact, a decrease in the hardness of the samples, after the production process steps,
was measured, with an improvement of the semi-finished product’s machinability. Moreover, the
new composition of the alloy made it possible to move the products directly from the final third
rolling step to the plating process without any annealing treatments, which were instead necessary
with the old composition. The residual stresses, measured after the annealing and melting process,
remained substantially the same of the one obtained with the old composition, whereas the
superficial tensile stress after the rolling process decreased. The change of the gold alloy
composition influenced not only the first part of the production process but, also, the creation of the
double-layer sheet welded during the plating process.
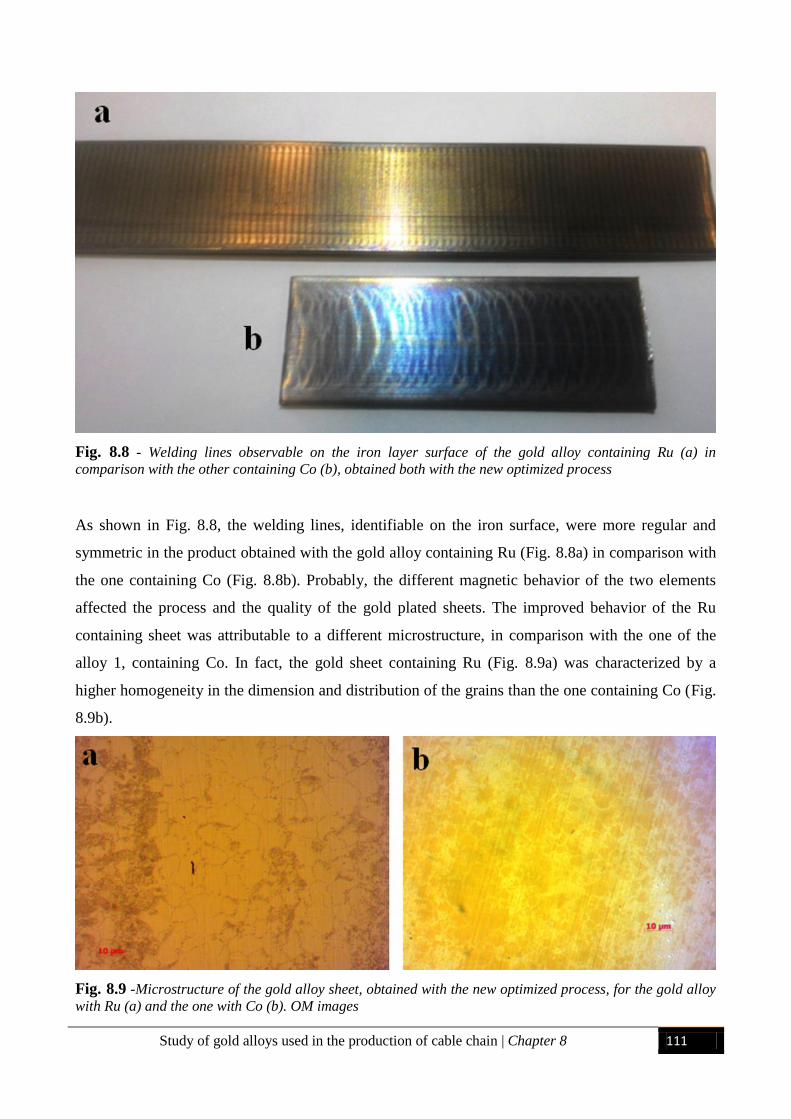
Study of gold alloys used in the production of cable chain | Chapter 8 111
Fig. 8.8 - Welding lines observable on the iron layer surface of the gold alloy containing Ru (a) in
comparison with the other containing Co (b), obtained both with the new optimized process
As shown in Fig. 8.8, the welding lines, identifiable on the iron surface, were more regular and
symmetric in the product obtained with the gold alloy containing Ru (Fig. 8.8a) in comparison with
the one containing Co (Fig. 8.8b). Probably, the different magnetic behavior of the two elements
affected the process and the quality of the gold plated sheets. The improved behavior of the Ru
containing sheet was attributable to a different microstructure, in comparison with the one of the
alloy 1, containing Co. In fact, the gold sheet containing Ru (Fig. 8.9a) was characterized by a
higher homogeneity in the dimension and distribution of the grains than the one containing Co (Fig.
8.9b).
Fig. 8.9 -Microstructure of the gold alloy sheet, obtained with the new optimized process, for the gold alloy
with Ru (a) and the one with Co (b). OM images
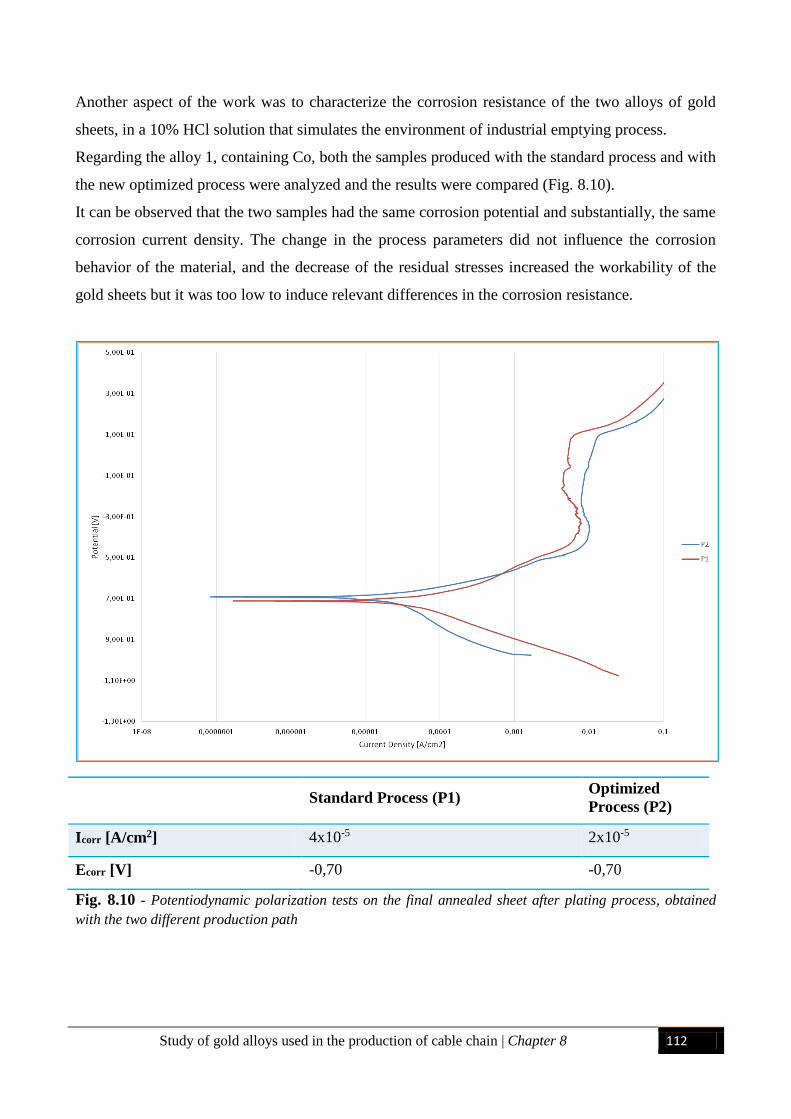
Study of gold alloys used in the production of cable chain | Chapter 8 112
Another aspect of the work was to characterize the corrosion resistance of the two alloys of gold
sheets, in a 10% HCl solution that simulates the environment of industrial emptying process.
Regarding the alloy 1, containing Co, both the samples produced with the standard process and with
the new optimized process were analyzed and the results were compared (Fig. 8.10).
It can be observed that the two samples had the same corrosion potential and substantially, the same
corrosion current density. The change in the process parameters did not influence the corrosion
behavior of the material, and the decrease of the residual stresses increased the workability of the
gold sheets but it was too low to induce relevant differences in the corrosion resistance.
Fig. 8.10 - Potentiodynamic polarization tests on the final annealed sheet after plating process, obtained
with the two different production path
Standard Process (P1) Optimized
Process (P2)
Icorr [A/cm2] 4x10⁻⁵ 2x10⁻⁵
Ecorr [V] -0,70 -0,70
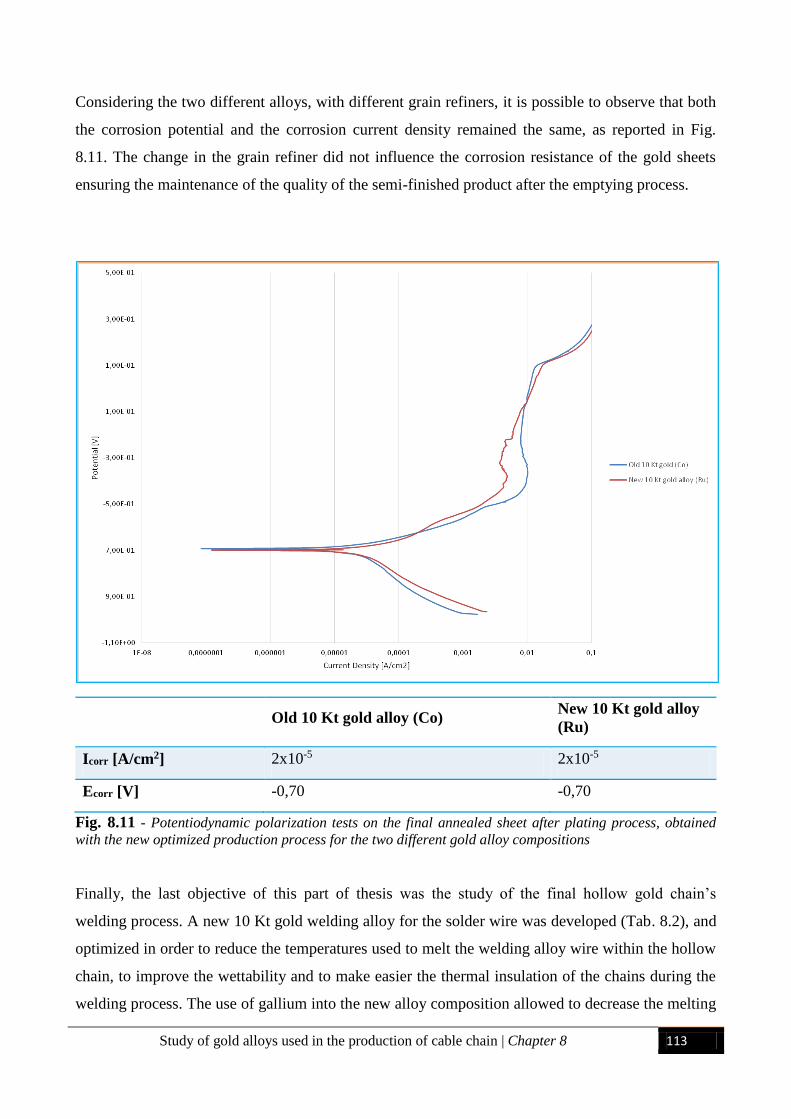
Study of gold alloys used in the production of cable chain | Chapter 8 113
Considering the two different alloys, with different grain refiners, it is possible to observe that both
the corrosion potential and the corrosion current density remained the same, as reported in Fig.
8.11. The change in the grain refiner did not influence the corrosion resistance of the gold sheets
ensuring the maintenance of the quality of the semi-finished product after the emptying process.
Old 10 Kt gold alloy (Co) New 10 Kt gold alloy
(Ru)
Icorr [A/cm2] 2x10⁻⁵ 2x10⁻⁵
Ecorr [V] -0,70 -0,70
Fig. 8.11 - Potentiodynamic polarization tests on the final annealed sheet after plating process, obtained
with the new optimized production process for the two different gold alloy compositions
Finally, the last objective of this part of thesis was the study of the final hollow gold chain’s
welding process. A new 10 Kt gold welding alloy for the solder wire was developed (Tab. 8.2), and
optimized in order to reduce the temperatures used to melt the welding alloy wire within the hollow
chain, to improve the wettability and to make easier the thermal insulation of the chains during the
welding process. The use of gallium into the new alloy composition allowed to decrease the melting
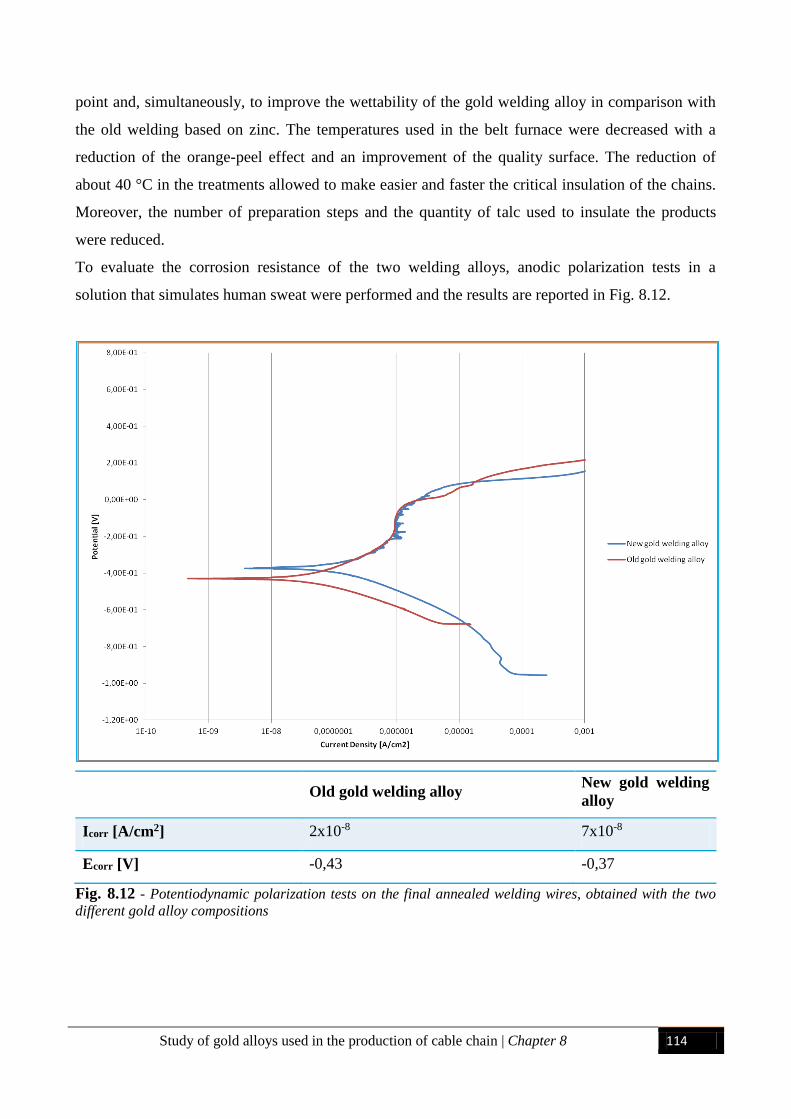
Study of gold alloys used in the production of cable chain | Chapter 8 114
point and, simultaneously, to improve the wettability of the gold welding alloy in comparison with
the old welding based on zinc. The temperatures used in the belt furnace were decreased with a
reduction of the orange-peel effect and an improvement of the quality surface. The reduction of
about 40 °C in the treatments allowed to make easier and faster the critical insulation of the chains.
Moreover, the number of preparation steps and the quantity of talc used to insulate the products
were reduced.
To evaluate the corrosion resistance of the two welding alloys, anodic polarization tests in a
solution that simulates human sweat were performed and the results are reported in Fig. 8.12.
Old gold welding alloy New gold welding
alloy
Icorr [A/cm2] 2x10⁻⁸ 7x10⁻⁸
Ecorr [V] -0,43 -0,37
Fig. 8.12 - Potentiodynamic polarization tests on the final annealed welding wires, obtained with the two
different gold alloy compositions
Study of gold alloys used in the production of cable chain | Chapter 8 115
The gold welding alloy containing gallium showed a nobler corrosion potential but a slightly
increase in corrosion current densities, suggesting a slightly decrease in the corrosion resistance due
to the presence of gallium.
8.4 CONCLUDING REMARKS
The optimization of the whole process parameters and the modification of compositions allowed a
remarkable improvement in the industrial production. The optimization of the whole process had
not only an influence on the hardness but, also, produced an increase in the ductility of the gold
alloys and in the microstructural homogeneity. The final grain size, index of suitable
recrystallization treatments, was also increased. The optimization of the melting, rolling and
annealing processes for gold alloy sheets allowed the reduction of the residual stresses on the sheet
during the whole production cycle, with an increase in machinability and a decrease in fragility. In
addition, the corrosion resistance during the emptying process was maintained at good levels. The
introduction of the new composition containing ruthenium allowed to avoid the magnetic behavior
of the final chain produced, to decrease the hardness and to increase the workability of the gold
sheets. The homogeneity of the microstructure was improved, thus producing a greater maintenance
of the properties during plating process. Moreover, the corrosion resistance in solution that simulate
the industrial environment, during the emptying process, was not influenced by the change of the
grain refiner. The reduction of the temperatures used during the welding process for the production
of hollow chains, due to the introduction of a new 10 Kt gold welding alloy optimized with gallium,
allowed to guarantee a suitable final surface of the semi-finished product and an easier thermal
insulation step before the process [93].
Plating Process and Age-Hardening treatments | Chapter 9 116
Chapter 9
Study of Plating Process and Ageing Treatments for the
Production of Hollow Gold Chains
9.1 PLATING PROCESS
9.1.1 Introduction
In this chapter, the final plating process was analysed. The creation of the multilayer base (iron
sheet – gold sheet), used to make hollow chains, is a critical step. The gold sheets arrive at this step
of the production process after several deformation
and annealing steps. The study of the microstructure
resulted from the process and the variation, caused by
the production parameters, on it, is important to
define the subsequent behaviour of the material. Spot
welding, in this case known as “plating process”, is
one of the most widely used welding processes of
resistance welding, figure 9.1. To obtain a good
welding is necessary to use rather high current values.
The current is closely linked to the Joule's law where
the energy, in form of heat, is proportional to the
square of the product of the delivery current with the
resistance, which, in this case, is represented by the
superimposition of the two basis materials. The time
is another parameter to consider, in fact, for the same
energy, to a decrease of the time should match an increase of the current. The current is still linked
to the pressure, because with higher pressures, there is less resistance in the contact areas, and this
resistance is concentrated between the two materials increasing the current intensity. During the
welding phase, the current intensity can remain constant or vary depending on the operational
requirements. During the initial phases of welding, the current remains constant, but in reality, this
undergoes changes as it increases the pressure. Increasing the pressure on the two electrodes, the
contact resistance on the same decreased, in this way the current will find a lower contact
resistance, while it will encounter a higher resistance at the interface of the two materials.
Fig. 9.1 - Scheme of the plating process
system
Plating Process and Age-Hardening treatments | Chapter 9 117
The system used by the company consists in two electrodes made by different copper alloys,
depending on the type of material with which they enter in contact (gold or iron). The pressures
used during the plating process on the sheets surfaces are between 3 kN and 6 kN. The continuous
current is about 20.000 A. The study involved the 10 Kt gold alloy used by the company, which
covers the bigger part of the chains production, the composition is reported in table 9.1.
Tab. 9.1 – Composition of the 10 Kt gold alloy studied
Kt Au [%] Ag [%] Zn [%] Cu [%]
10 41.7 17.3 5.5 BALANCE
In figure 9.2, the microstructure of the iron
sheet before the plating process is showed.
The grain size of the gold sheet coupled is
comparable, and in tab. 9.2 the hardness of
the two sheets, after the annealing treatment
and before the spot welding process are
reported.
Tab. 9.2 - Values of hardness for the gold and iron sheets before plating process
Hardness
Iron sheet 140 HV
Gold sheet 145 HV
Fig. 9.2 - OM observation of the microstructure of iron
sheet before the plating process
Plating Process and Age-Hardening treatments | Chapter 9 118
The influence of different parameters like the current density, the velocity of the process, the
pressure and the shape of the copper alloy rollers was studied, and some hardness tests to evaluate
the change in mechanical properties were performed.
9.1.2 Results and Discussion
The pressure of rollers, was the first parameter investigated, it was increased equally for both
copper electrodes.
Tab. 9.3 - Hardness tests results
With the increase of the pressure of rollers, the welding interface between the two sheets remains
well defined but starts a disruption of iron grain. In figures, 9.3 and 9.4, the interface between gold
and iron is represented. The hardness tests showed a small increase in hardness, probably due to the
small increase of superficial deformation caused by the rollers pressure, tab. 9.3.
Hardness
Standard rollers pressure Fe sheet 148 HV
Au alloy sheet 145 HV
Higher rollers pressure Fe sheet 150 HV
Au alloy sheet 160 HV
Fig. 9.3 - OM observation of the interface obtained
with standard parameters (iron sheet chemically
etched)
Fig. 9.4 - OM observation of the interface obtained
with higher pressure of rollers (iron sheet chemically
etched)
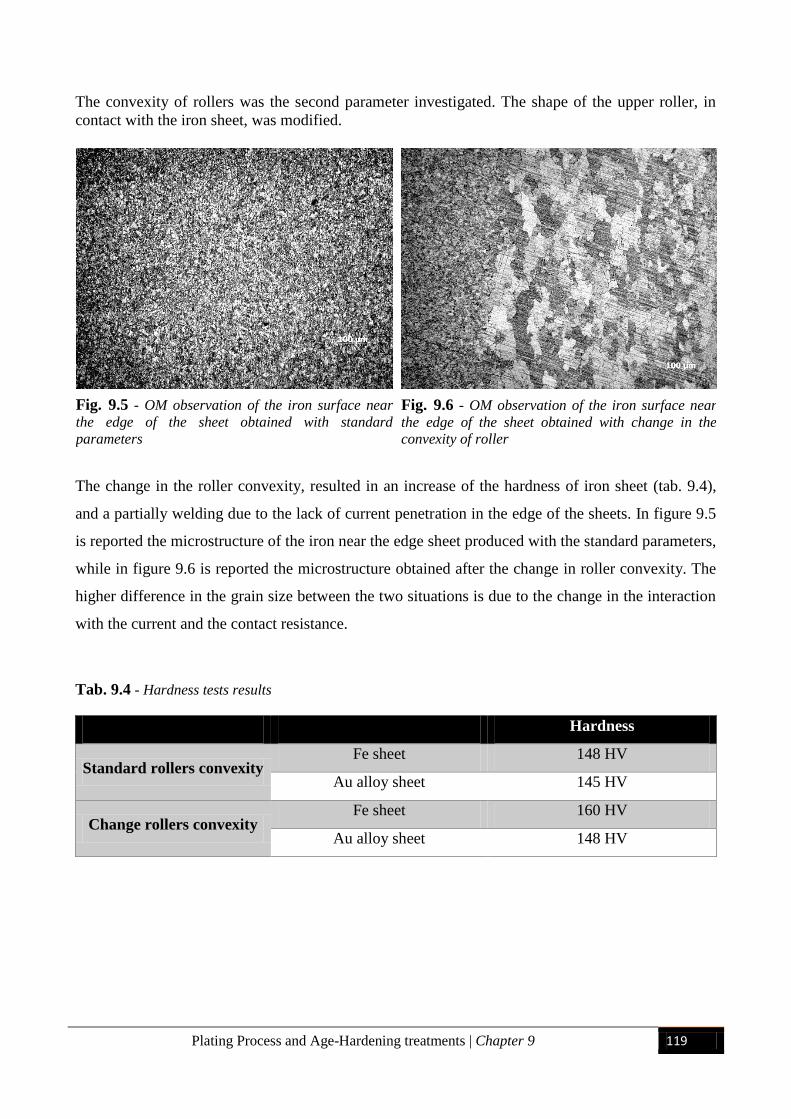
Plating Process and Age-Hardening treatments | Chapter 9 119
The convexity of rollers was the second parameter investigated. The shape of the upper roller, in
contact with the iron sheet, was modified.
The change in the roller convexity, resulted in an increase of the hardness of iron sheet (tab. 9.4),
and a partially welding due to the lack of current penetration in the edge of the sheets. In figure 9.5
is reported the microstructure of the iron near the edge sheet produced with the standard parameters,
while in figure 9.6 is reported the microstructure obtained after the change in roller convexity. The
higher difference in the grain size between the two situations is due to the change in the interaction
with the current and the contact resistance.
Tab. 9.4 - Hardness tests results
Hardness
Standard rollers convexity Fe sheet 148 HV
Au alloy sheet 145 HV
Change rollers convexity Fe sheet 160 HV
Au alloy sheet 148 HV
Fig. 9.5 - OM observation of the iron surface near
the edge of the sheet obtained with standard
parameters
Fig. 9.6 - OM observation of the iron surface near
the edge of the sheet obtained with change in the
convexity of roller
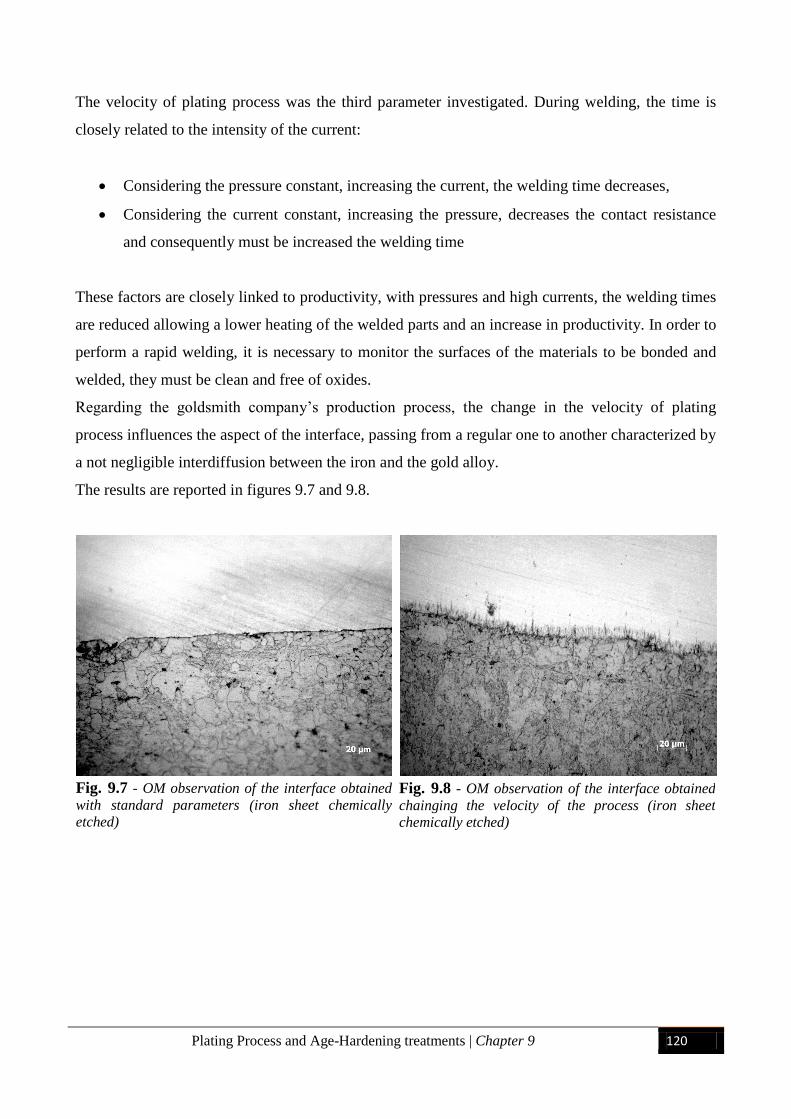
Plating Process and Age-Hardening treatments | Chapter 9 120
The velocity of plating process was the third parameter investigated. During welding, the time is
closely related to the intensity of the current:
Considering the pressure constant, increasing the current, the welding time decreases,
Considering the current constant, increasing the pressure, decreases the contact resistance
and consequently must be increased the welding time
These factors are closely linked to productivity, with pressures and high currents, the welding times
are reduced allowing a lower heating of the welded parts and an increase in productivity. In order to
perform a rapid welding, it is necessary to monitor the surfaces of the materials to be bonded and
welded, they must be clean and free of oxides.
Regarding the goldsmith company’s production process, the change in the velocity of plating
process influences the aspect of the interface, passing from a regular one to another characterized by
a not negligible interdiffusion between the iron and the gold alloy.
The results are reported in figures 9.7 and 9.8.
Fig. 9.7 - OM observation of the interface obtained
with standard parameters (iron sheet chemically
etched)
Fig. 9.8 - OM observation of the interface obtained
chainging the velocity of the process (iron sheet
chemically etched)
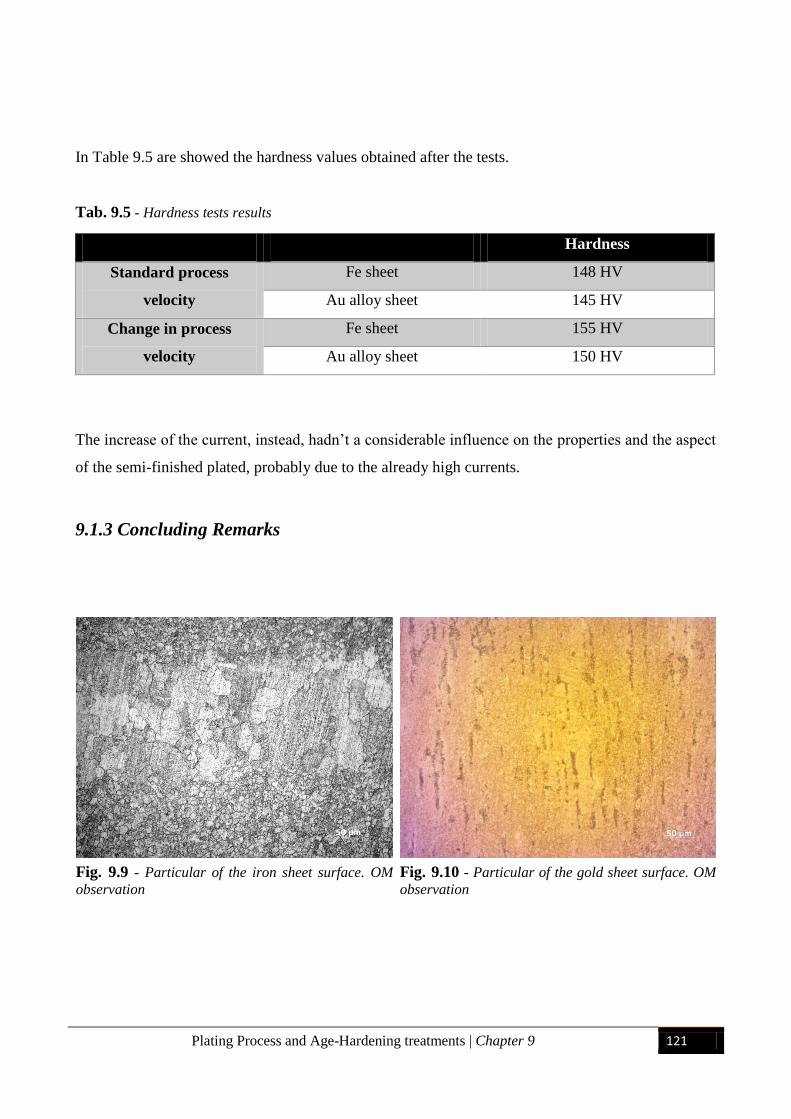
Plating Process and Age-Hardening treatments | Chapter 9 121
In Table 9.5 are showed the hardness values obtained after the tests.
Tab. 9.5 - Hardness tests results
The increase of the current, instead, hadn’t a considerable influence on the properties and the aspect
of the semi-finished plated, probably due to the already high currents.
9.1.3 Concluding Remarks
Hardness
Standard process
velocity
Fe sheet 148 HV
Au alloy sheet 145 HV
Change in process
velocity
Fe sheet 155 HV
Au alloy sheet 150 HV
Fig. 9.9 - Particular of the iron sheet surface. OM
observation
Fig. 9.10 - Particular of the gold sheet surface. OM
observation
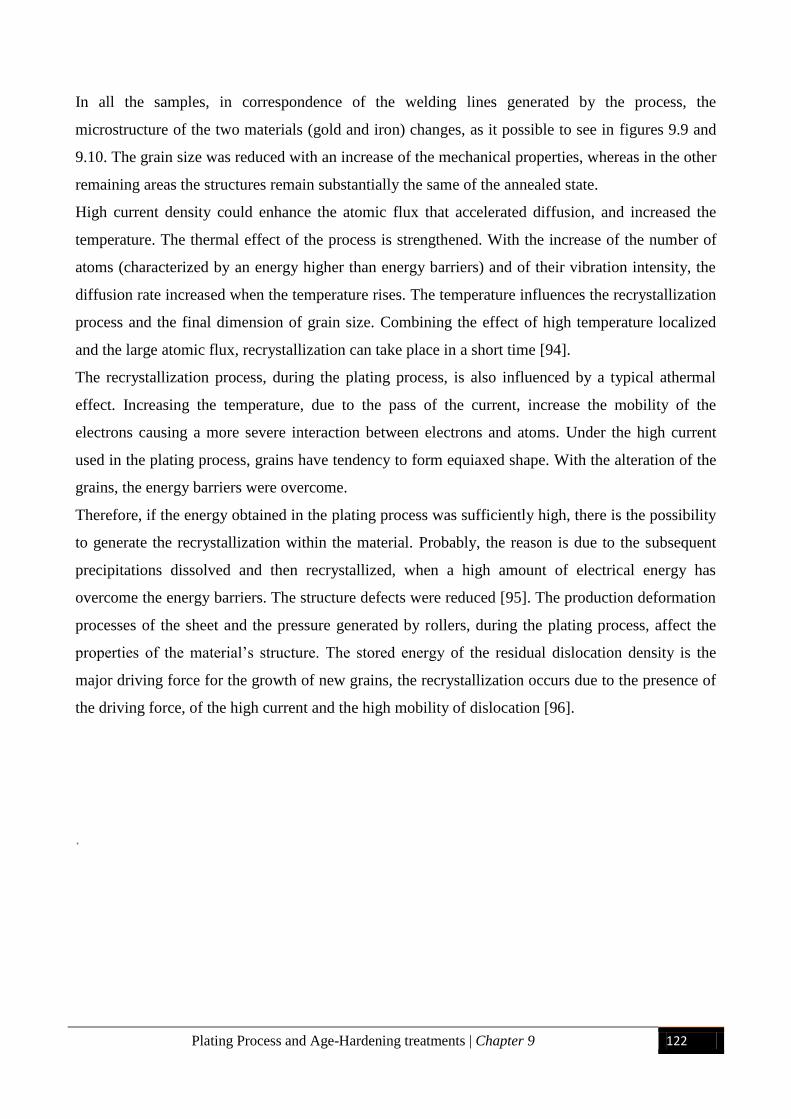
Plating Process and Age-Hardening treatments | Chapter 9 122
In all the samples, in correspondence of the welding lines generated by the process, the
microstructure of the two materials (gold and iron) changes, as it possible to see in figures 9.9 and
9.10. The grain size was reduced with an increase of the mechanical properties, whereas in the other
remaining areas the structures remain substantially the same of the annealed state.
High current density could enhance the atomic flux that accelerated diffusion, and increased the
temperature. The thermal effect of the process is strengthened. With the increase of the number of
atoms (characterized by an energy higher than energy barriers) and of their vibration intensity, the
diffusion rate increased when the temperature rises. The temperature influences the recrystallization
process and the final dimension of grain size. Combining the effect of high temperature localized
and the large atomic flux, recrystallization can take place in a short time [94].
The recrystallization process, during the plating process, is also influenced by a typical athermal
effect. Increasing the temperature, due to the pass of the current, increase the mobility of the
electrons causing a more severe interaction between electrons and atoms. Under the high current
used in the plating process, grains have tendency to form equiaxed shape. With the alteration of the
grains, the energy barriers were overcome.
Therefore, if the energy obtained in the plating process was sufficiently high, there is the possibility
to generate the recrystallization within the material. Probably, the reason is due to the subsequent
precipitations dissolved and then recrystallized, when a high amount of electrical energy has
overcome the energy barriers. The structure defects were reduced [95]. The production deformation
processes of the sheet and the pressure generated by rollers, during the plating process, affect the
properties of the material’s structure. The stored energy of the residual dislocation density is the
major driving force for the growth of new grains, the recrystallization occurs due to the presence of
the driving force, of the high current and the high mobility of dislocation [96].
.

Plating Process and Age-Hardening treatments | Chapter 9 123
9.2 AGE-HARDENING TREATMENTS
9.2.1 Introduction
The production of hollow and small thicknesses jewelry, obtained by plastic deformation processes
and subsequent hardening by particular heat treatments, occupies a relevant place into the
production of goldsmith companies. However, the used alloys have to maintain a good workability
to guarantee the possibility of high reduction of section during the deformation process. In this work
different hardening processes were tested with the aim to improve the hardness of the gold alloy
used to make hollow chains. Different compositions of 18 Kt, 14 Kt, 10 Kt and 9 Kt yellow gold
alloys were investigated. The influence of the hardening mechanisms, the compositions and process
parameters on microstructure and mechanical properties was evaluated.
All the different samples of gold alloys, coming from the production process, were considered in
the annealed state. Hardening treatments were performed in a static furnace with an inert
atmosphere. The samples were treated for different time (2h or 2h30’) and temperatures, from 200
°C to 300 °C, in order to analyze the effect of these parameters on the mechanical properties and on
the microstructure. Mechanical properties were evaluated with micro-hardness tests. The micro
structural analysis was performed by optical microscope observation and X-ray diffraction analysis.
9.2.2 Results and Discussion
18 Kt thermosetting gold alloy
Regarding the 18 Kt gold yellow alloys, two different composition, reported in Tab. 9.6, were
tested.
Tab. 9.6 - Compositions of the two gold thermosetting alloy tested
Au [%] Ag [%] Zn [%] Cu [%]
Alloy 1 75.0 4.5 1.5 19.0
Alloy 2 75.0 7.5 2.5 15.0
The alloy 1, with the higher percentage of copper in mass, presented the highest values of hardness,
Tab. 9.7.
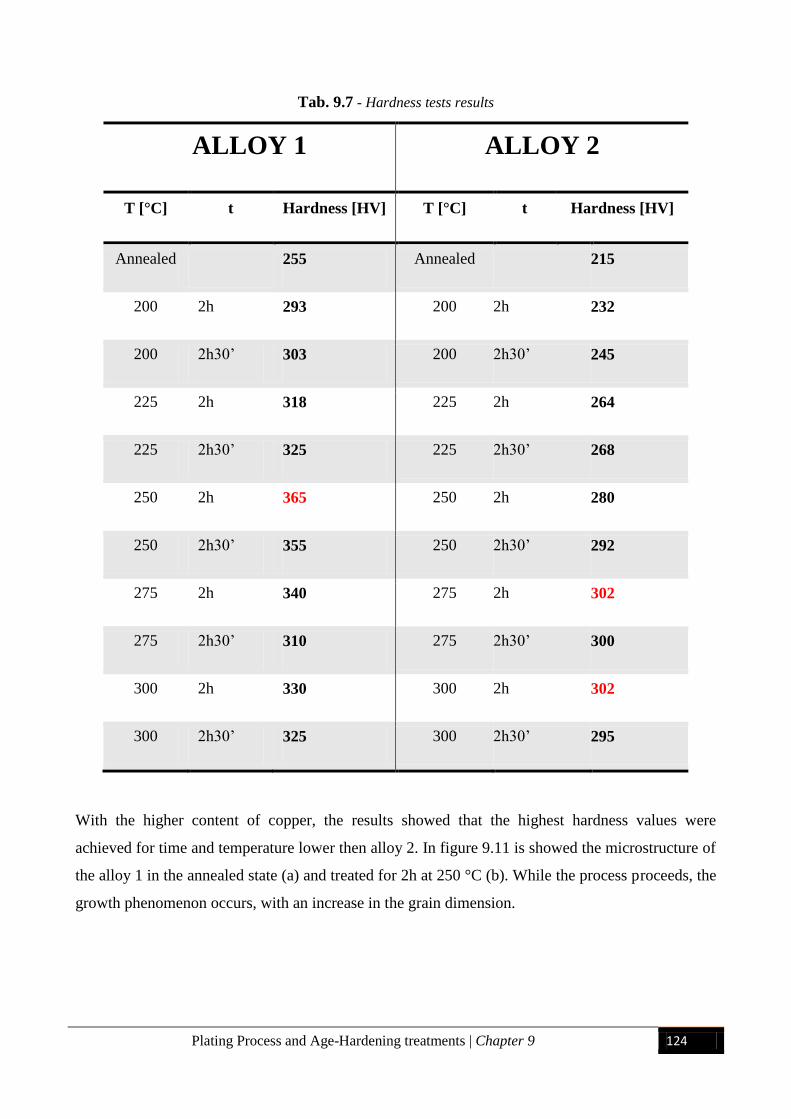
Plating Process and Age-Hardening treatments | Chapter 9 124
Tab. 9.7 - Hardness tests results
ALLOY 1 ALLOY 2
T [°C] t Hardness [HV] T [°C] t Hardness [HV]
Annealed 255 Annealed 215
200 2h 293 200 2h 232
200 2h30’ 303 200 2h30’ 245
225 2h 318 225 2h 264
225 2h30’ 325 225 2h30’ 268
250 2h 365 250 2h 280
250 2h30’ 355 250 2h30’ 292
275 2h 340 275 2h 302
275 2h30’ 310 275 2h30’ 300
300 2h 330 300 2h 302
300 2h30’ 325 300 2h30’ 295
With the higher content of copper, the results showed that the highest hardness values were
achieved for time and temperature lower then alloy 2. In figure 9.11 is showed the microstructure of
the alloy 1 in the annealed state (a) and treated for 2h at 250 °C (b). While the process proceeds, the
growth phenomenon occurs, with an increase in the grain dimension.
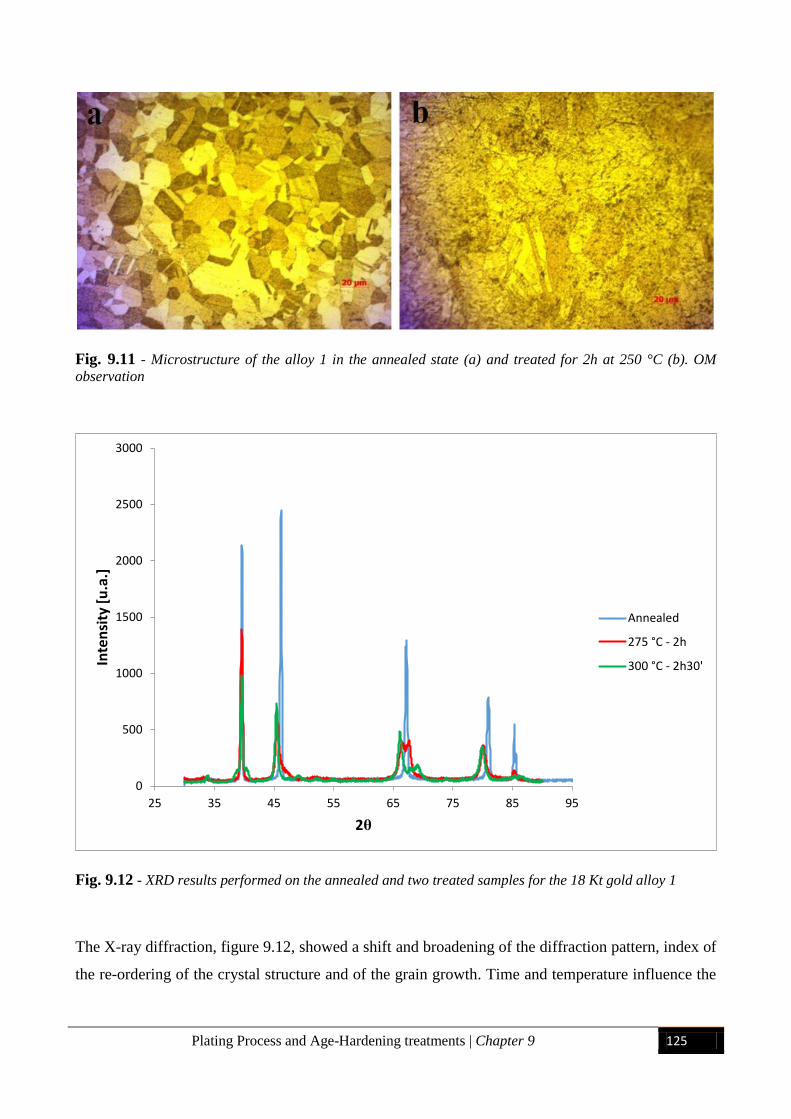
Plating Process and Age-Hardening treatments | Chapter 9 125
Fig. 9.11 - Microstructure of the alloy 1 in the annealed state (a) and treated for 2h at 250 °C (b). OM
observation
Fig. 9.12 - XRD results performed on the annealed and two treated samples for the 18 Kt gold alloy 1
The X-ray diffraction, figure 9.12, showed a shift and broadening of the diffraction pattern, index of
the re-ordering of the crystal structure and of the grain growth. Time and temperature influence the
0
500
1000
1500
2000
2500
3000
25 35 45 55 65 75 85 95
Inte
nsi
ty [
u.a
.]
2θ
Annealed
275 °C - 2h
300 °C - 2h30'
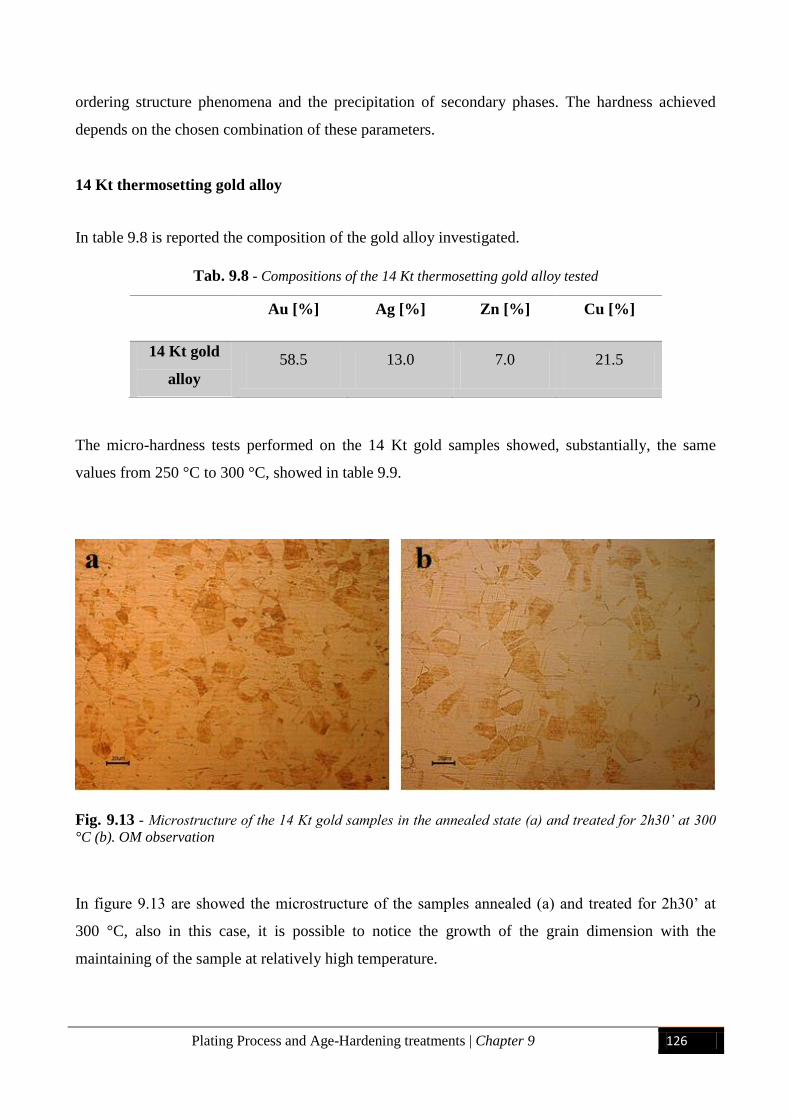
Plating Process and Age-Hardening treatments | Chapter 9 126
ordering structure phenomena and the precipitation of secondary phases. The hardness achieved
depends on the chosen combination of these parameters.
14 Kt thermosetting gold alloy
In table 9.8 is reported the composition of the gold alloy investigated.
Tab. 9.8 - Compositions of the 14 Kt thermosetting gold alloy tested
Au [%] Ag [%] Zn [%] Cu [%]
14 Kt gold
alloy
58.5 13.0 7.0 21.5
The micro-hardness tests performed on the 14 Kt gold samples showed, substantially, the same
values from 250 °C to 300 °C, showed in table 9.9.
Fig. 9.13 - Microstructure of the 14 Kt gold samples in the annealed state (a) and treated for 2h30’ at 300
°C (b). OM observation
In figure 9.13 are showed the microstructure of the samples annealed (a) and treated for 2h30’ at
300 °C, also in this case, it is possible to notice the growth of the grain dimension with the
maintaining of the sample at relatively high temperature.
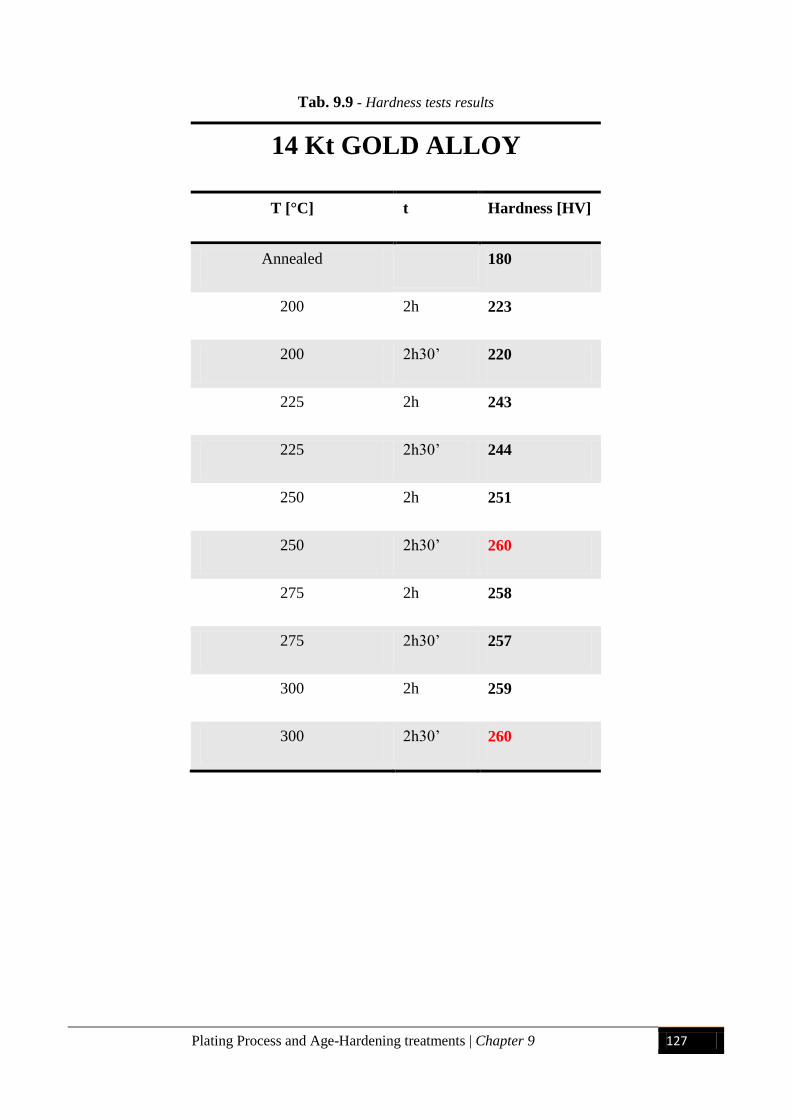
Plating Process and Age-Hardening treatments | Chapter 9 127
Tab. 9.9 - Hardness tests results
14 Kt GOLD ALLOY
T [°C] t Hardness [HV]
Annealed 180
200 2h 223
200 2h30’ 220
225 2h 243
225 2h30’ 244
250 2h 251
250 2h30’ 260
275 2h 258
275 2h30’ 257
300 2h 259
300 2h30’ 260
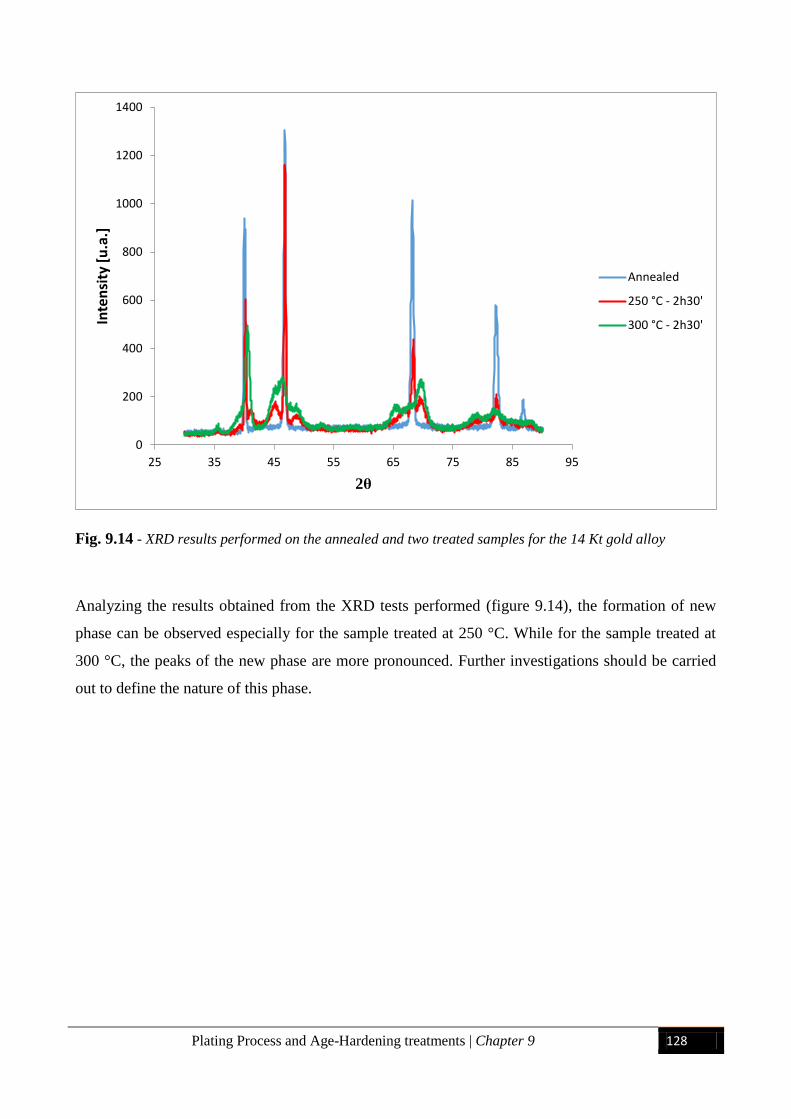
Plating Process and Age-Hardening treatments | Chapter 9 128
Fig. 9.14 - XRD results performed on the annealed and two treated samples for the 14 Kt gold alloy
Analyzing the results obtained from the XRD tests performed (figure 9.14), the formation of new
phase can be observed especially for the sample treated at 250 °C. While for the sample treated at
300 °C, the peaks of the new phase are more pronounced. Further investigations should be carried
out to define the nature of this phase.
0
200
400
600
800
1000
1200
1400
25 35 45 55 65 75 85 95
Inte
nsi
ty [
u.a
.]
2θ
Annealed
250 °C - 2h30'
300 °C - 2h30'
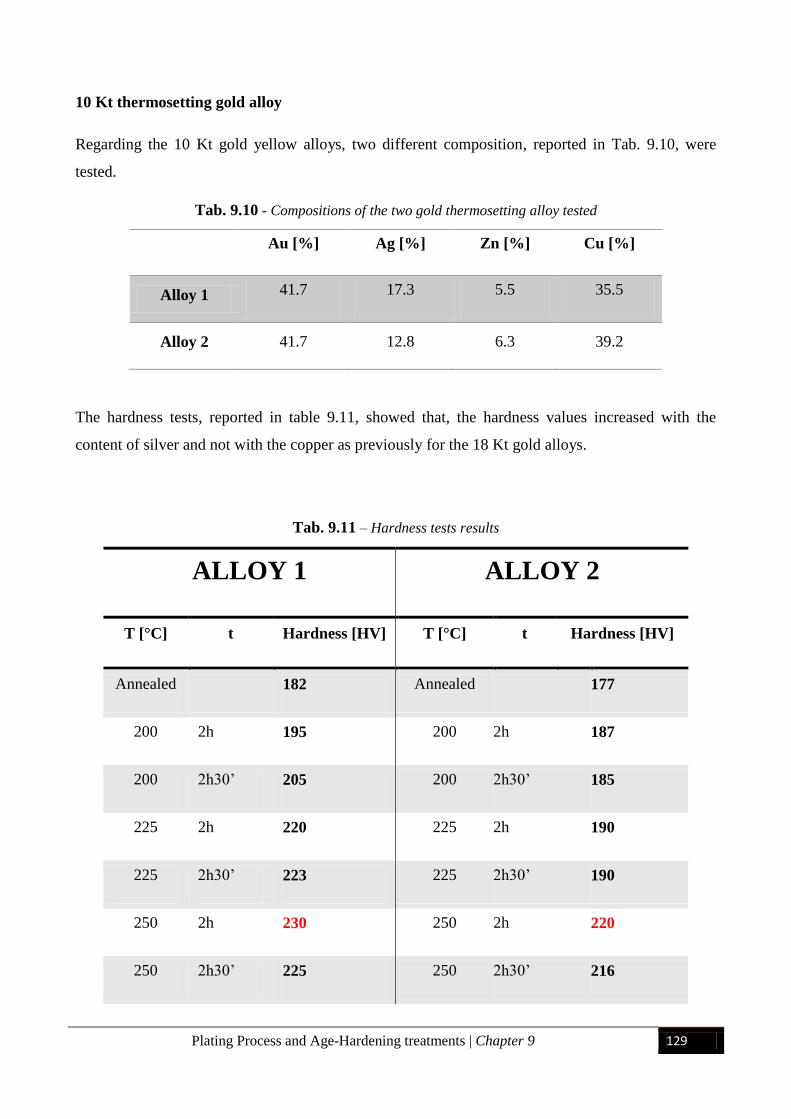
Plating Process and Age-Hardening treatments | Chapter 9 129
10 Kt thermosetting gold alloy
Regarding the 10 Kt gold yellow alloys, two different composition, reported in Tab. 9.10, were
tested.
Tab. 9.10 - Compositions of the two gold thermosetting alloy tested
Au [%] Ag [%] Zn [%] Cu [%]
Alloy 1 41.7 17.3 5.5 35.5
Alloy 2 41.7 12.8 6.3 39.2
The hardness tests, reported in table 9.11, showed that, the hardness values increased with the
content of silver and not with the copper as previously for the 18 Kt gold alloys.
Tab. 9.11 – Hardness tests results
ALLOY 1 ALLOY 2
T [°C] t Hardness [HV] T [°C] t Hardness [HV]
Annealed 182 Annealed 177
200 2h 195 200 2h 187
200 2h30’ 205 200 2h30’ 185
225 2h 220 225 2h 190
225 2h30’ 223 225 2h30’ 190
250 2h 230 250 2h 220
250 2h30’ 225 250 2h30’ 216
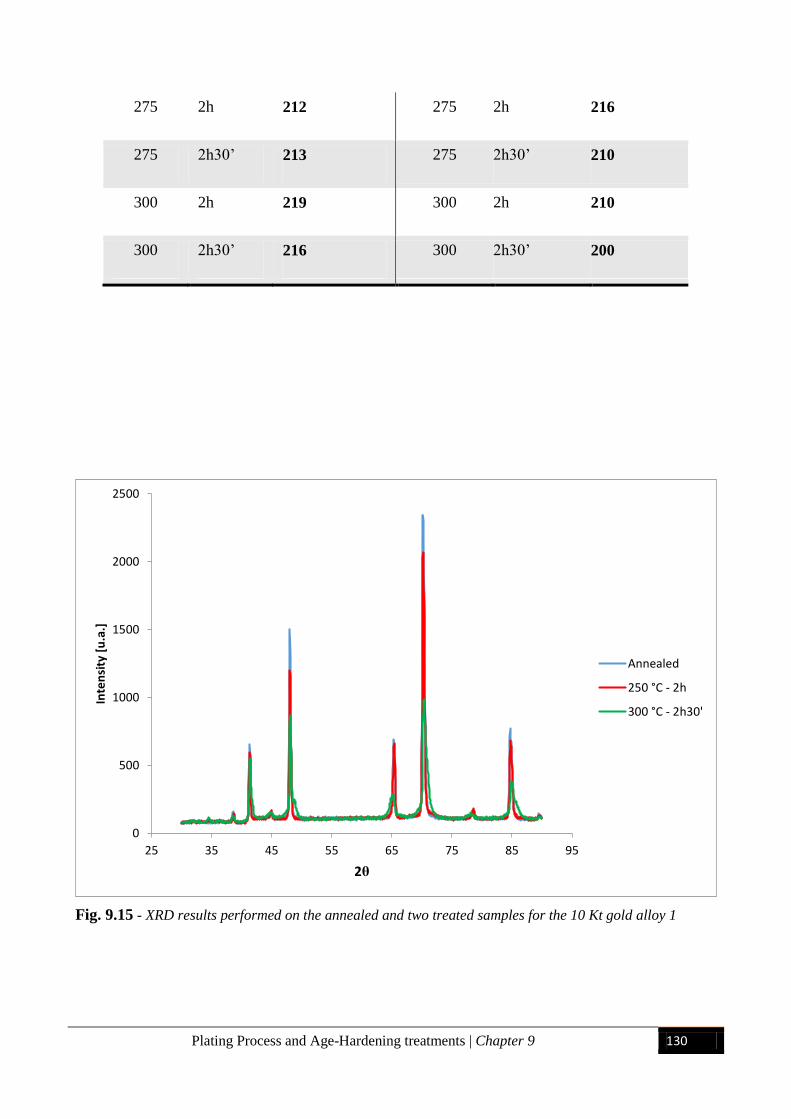
Plating Process and Age-Hardening treatments | Chapter 9 130
275 2h 212 275 2h 216
275 2h30’ 213 275 2h30’ 210
300 2h 219 300 2h 210
300 2h30’ 216 300 2h30’ 200
Fig. 9.15 - XRD results performed on the annealed and two treated samples for the 10 Kt gold alloy 1
0
500
1000
1500
2000
2500
25 35 45 55 65 75 85 95
Inte
nsi
ty [
u.a
.]
2θ
Annealed
250 °C - 2h
300 °C - 2h30'
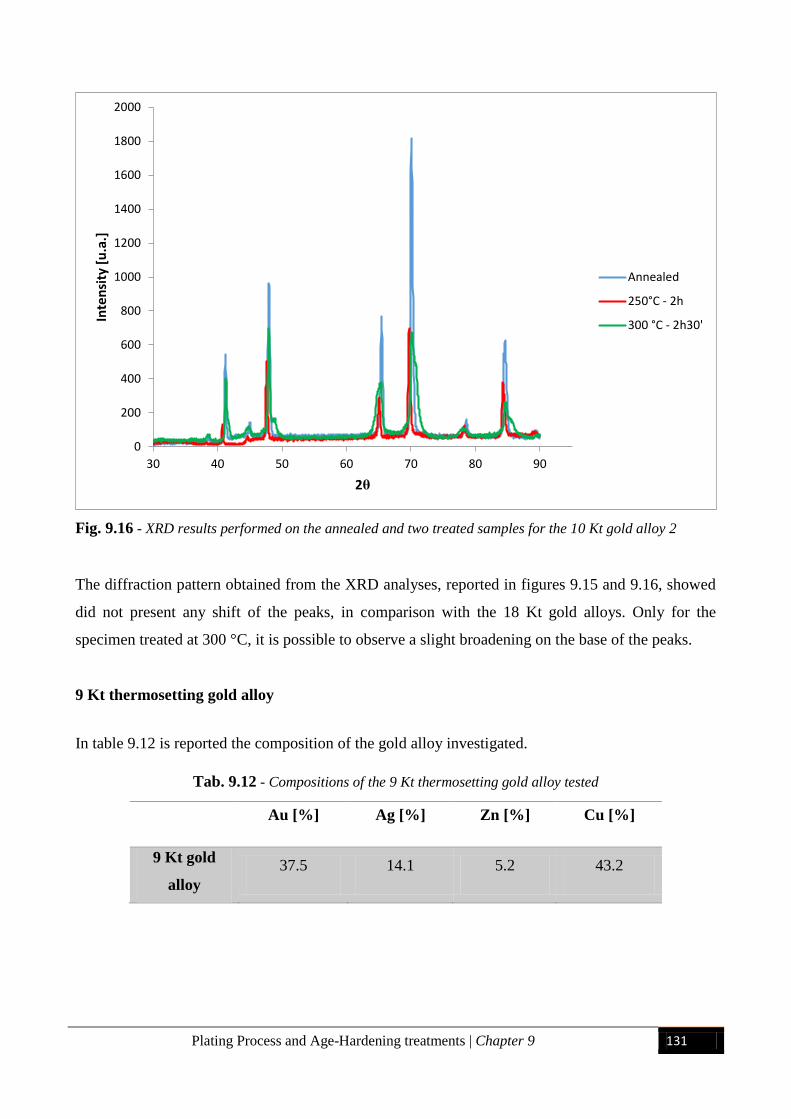
Plating Process and Age-Hardening treatments | Chapter 9 131
Fig. 9.16 - XRD results performed on the annealed and two treated samples for the 10 Kt gold alloy 2
The diffraction pattern obtained from the XRD analyses, reported in figures 9.15 and 9.16, showed
did not present any shift of the peaks, in comparison with the 18 Kt gold alloys. Only for the
specimen treated at 300 °C, it is possible to observe a slight broadening on the base of the peaks.
9 Kt thermosetting gold alloy
In table 9.12 is reported the composition of the gold alloy investigated.
Tab. 9.12 - Compositions of the 9 Kt thermosetting gold alloy tested
Au [%] Ag [%] Zn [%] Cu [%]
9 Kt gold
alloy
37.5 14.1 5.2 43.2
0
200
400
600
800
1000
1200
1400
1600
1800
2000
30 40 50 60 70 80 90
Inte
nsi
ty [
u.a
.]
2θ
Annealed
250°C - 2h
300 °C - 2h30'
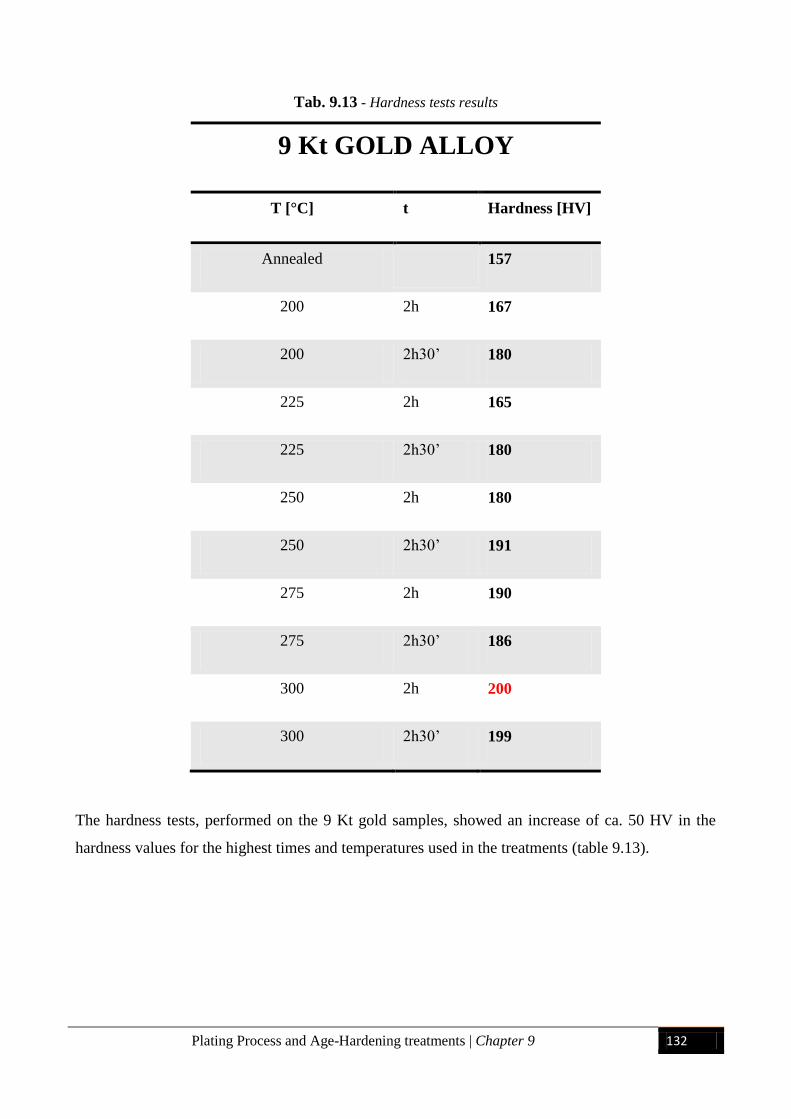
Plating Process and Age-Hardening treatments | Chapter 9 132
Tab. 9.13 - Hardness tests results
9 Kt GOLD ALLOY
T [°C] t Hardness [HV]
Annealed 157
200 2h 167
200 2h30’ 180
225 2h 165
225 2h30’ 180
250 2h 180
250 2h30’ 191
275 2h 190
275 2h30’ 186
300 2h 200
300 2h30’ 199
The hardness tests, performed on the 9 Kt gold samples, showed an increase of ca. 50 HV in the
hardness values for the highest times and temperatures used in the treatments (table 9.13).
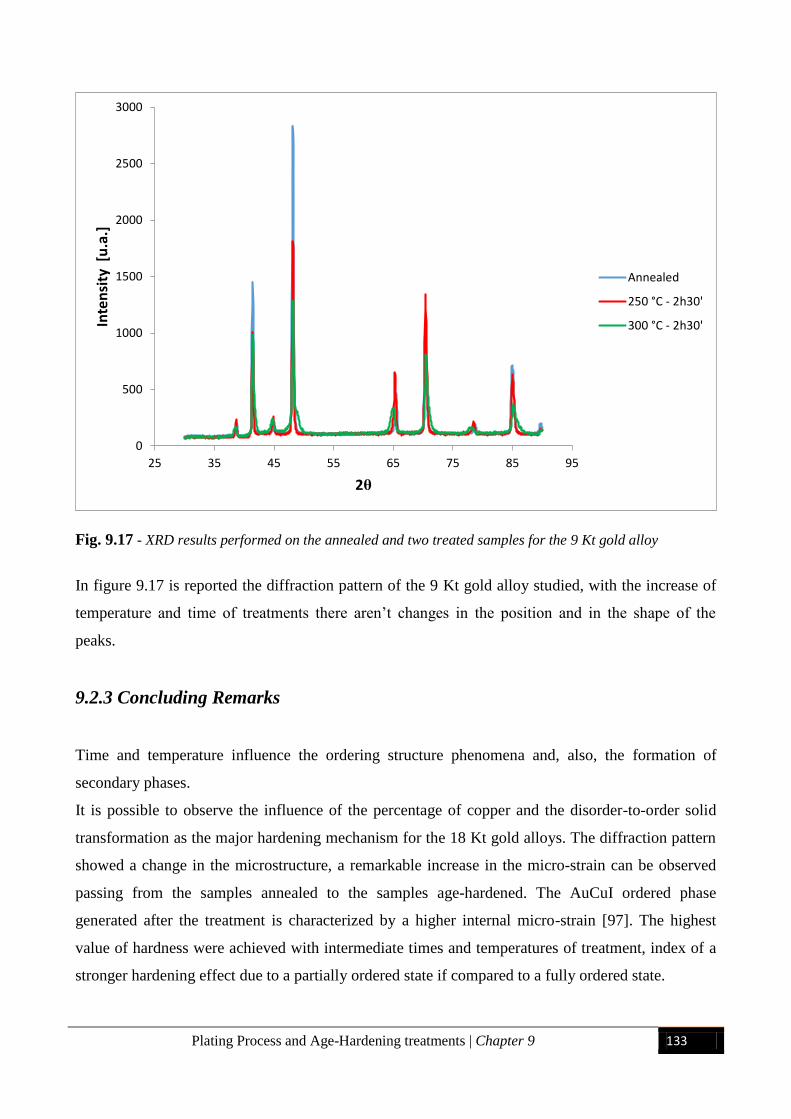
Plating Process and Age-Hardening treatments | Chapter 9 133
Fig. 9.17 - XRD results performed on the annealed and two treated samples for the 9 Kt gold alloy
In figure 9.17 is reported the diffraction pattern of the 9 Kt gold alloy studied, with the increase of
temperature and time of treatments there aren’t changes in the position and in the shape of the
peaks.
9.2.3 Concluding Remarks
Time and temperature influence the ordering structure phenomena and, also, the formation of
secondary phases.
It is possible to observe the influence of the percentage of copper and the disorder-to-order solid
transformation as the major hardening mechanism for the 18 Kt gold alloys. The diffraction pattern
showed a change in the microstructure, a remarkable increase in the micro-strain can be observed
passing from the samples annealed to the samples age-hardened. The AuCuI ordered phase
generated after the treatment is characterized by a higher internal micro-strain [97]. The highest
value of hardness were achieved with intermediate times and temperatures of treatment, index of a
stronger hardening effect due to a partially ordered state if compared to a fully ordered state.
0
500
1000
1500
2000
2500
3000
25 35 45 55 65 75 85 95
Inte
nsi
ty [
u.a
.]
2θ
Annealed
250 °C - 2h30'
300 °C - 2h30'
Plating Process and Age-Hardening treatments | Chapter 9 134
Regarding the 14 Kt thermosetting gold alloy studied, the analysis showed that exist a cooperation
between the disorder-to-order solid transformation and the precipitation of secondary phases. In this
case, other analyses are necessary to explain better the hardening phenomena.
With the lowest carat gold alloys (10 Kt, 9 Kt), instead, the hardening mechanism that overcomes is
the precipitation hardening and not the re-ordering, which increases with the percentage of silver
and other elements (like grain refiners).
A suitable control of the grain size and of the heat treatments allows achieving the necessary
properties to guarantee machinability and quality to the product.

Plating Process and Age-Hardening treatments | Chapter 9 135
136
CONCLUSIONS
In this thesis work, after a short introduction on the state of art of jewelry production, the industrial
production processes of gold chains were studied, in order to optimize the parameters used in the
production cycle, the compositions of gold alloys and the mechanical properties of the semi-
finished products. In the last years, the scientific approach to the traditional jewelry industries has
been adopted more and more often. The aim is to reduce the production wastes, to improve the
characteristics of the final artifacts surface and to increase the constancy of results.
All the sampling was carried out at Filk S.p.A., the goldsmith company partner of the research, the
characterization was performed at the Department of Industrial Engineering of the Padua University
and at Progold S.p.A.
In the first experimental part of the thesis were described the results obtained by the analyses of the
production process of gold welding wires. After a primary investigation, the temperatures of
crucible and mould, the time and temperatures of the annealing steps and the quenching system
after melting and annealing processes were modified. The velocity of the rollers, during the
deformation process, was decreased. The results showed, using the new optimized process, a
reduction of the hardness and of the grain size. Furthermore, a greater microstructural homogeneity
and the increase of ductility allowed to improve the workability of the material. The tensile tests
performed on the final annealed samples, showed a smaller range of variability and a better
uniformity of the tensile curves, demonstrating the suitable control of the parameters during all the
production cycle. Another important aspect analyzed is the influence of the production parameters
on the tensile state presents within the material. Through the annealing treatments, it was possible to
restore a positive compressive state in comparison with the undesired tensile state obtained after the
deformation processes. This is an important aspect considering the emptying process with acids
used by the company. The greater homogeneity of the microstructure, a smaller grain size and a
reduction of the residual stresses, obtained with the new optimized process, are preferred because
these characteristics cause an increase in the corrosion resistance of the material.
Adopting these changes in the production cycle of the company, it was possible to improve the
quality of the semi-finished products, increase the machinability of the welding wires and the
industrial scraps were, almost completely, eliminated.
Another part of the experimental study was focused on the analysis and optimization of the
compositions and production processes for the realization of gold alloy sheets.
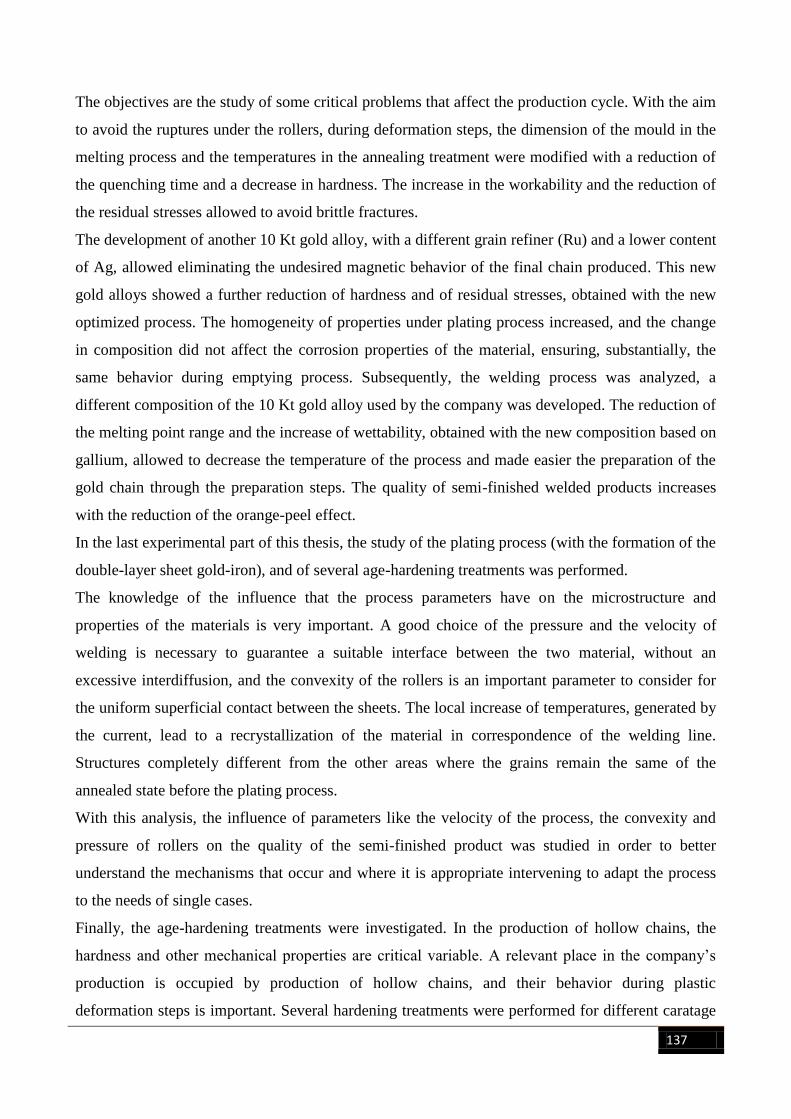
137
The objectives are the study of some critical problems that affect the production cycle. With the aim
to avoid the ruptures under the rollers, during deformation steps, the dimension of the mould in the
melting process and the temperatures in the annealing treatment were modified with a reduction of
the quenching time and a decrease in hardness. The increase in the workability and the reduction of
the residual stresses allowed to avoid brittle fractures.
The development of another 10 Kt gold alloy, with a different grain refiner (Ru) and a lower content
of Ag, allowed eliminating the undesired magnetic behavior of the final chain produced. This new
gold alloys showed a further reduction of hardness and of residual stresses, obtained with the new
optimized process. The homogeneity of properties under plating process increased, and the change
in composition did not affect the corrosion properties of the material, ensuring, substantially, the
same behavior during emptying process. Subsequently, the welding process was analyzed, a
different composition of the 10 Kt gold alloy used by the company was developed. The reduction of
the melting point range and the increase of wettability, obtained with the new composition based on
gallium, allowed to decrease the temperature of the process and made easier the preparation of the
gold chain through the preparation steps. The quality of semi-finished welded products increases
with the reduction of the orange-peel effect.
In the last experimental part of this thesis, the study of the plating process (with the formation of the
double-layer sheet gold-iron), and of several age-hardening treatments was performed.
The knowledge of the influence that the process parameters have on the microstructure and
properties of the materials is very important. A good choice of the pressure and the velocity of
welding is necessary to guarantee a suitable interface between the two material, without an
excessive interdiffusion, and the convexity of the rollers is an important parameter to consider for
the uniform superficial contact between the sheets. The local increase of temperatures, generated by
the current, lead to a recrystallization of the material in correspondence of the welding line.
Structures completely different from the other areas where the grains remain the same of the
annealed state before the plating process.
With this analysis, the influence of parameters like the velocity of the process, the convexity and
pressure of rollers on the quality of the semi-finished product was studied in order to better
understand the mechanisms that occur and where it is appropriate intervening to adapt the process
to the needs of single cases.
Finally, the age-hardening treatments were investigated. In the production of hollow chains, the
hardness and other mechanical properties are critical variable. A relevant place in the company’s
production is occupied by production of hollow chains, and their behavior during plastic
deformation steps is important. Several hardening treatments were performed for different caratage
138
of gold alloys. The hardness and XRD tests showed that for 18 Kt gold alloy the hardening
mechanism that overcome is the solid disorder-to-order transformation, controlled by the percentage
of copper present in the composition. Instead, for the lower carat gold alloy the hardening
phenomenon is controlled by the Ag content into the gold alloy, because, in this case, is the
generation of secondary phases mechanism that overcome. A suitable control of composition, time
and temperatures of treatments is suggested to guarantee an increase of hardness adequate for the
mechanical deformation to which the material undergoes. The tests performed allowed to optimize
this parameter for the thermosetting alloy used by the company, improving the resistance and the
quality of the semi-finished product.
Concluding this thesis work was devoted to optimize the production parameters from the melting
process to the final production of the semi-finished welded. The experimental work showed that the
modification of the process parameters and the formulation of different compositions of gold alloys,
can improve the properties of the semi-finished and final products, and can, also, reduce the amount
of industrial scraps, with a reduction of the overall cost of the process. So the results reported,
permit to extend the knowledge regarding the gold chain production processes and the possible
usefulness of a scientific approach also in the handcrafted jewelry world.

139
140
REFERENCES
[1] Gold Survey 2008, Published by GFMS Ltd. London, 2008.
[2] CRC Handbook of Chemistry and Physics, D. R. Lide (ed.) (Taylor & Francis, London, 2008).
[3] Impact of gold nanoparticles combined to x-ray irradiation on bacteria, A. Simon-Deckers, E.
Brun, B.Gouget, M. Carriere, and C. Sicard-Roselli, Gold Bull., 2008, 41, 187.
[4] The fascinating implications of new results in gold chemistry, H. Schmidbaur, Gold Bull., 1990,
23, 11.
[5] Relativity and the periodic system of elements, P. Pyykko and J.-P. Desclaux, Acc. Chem. Res.,
1979, 12, 276.
[6] Relativistic effects in gold chemistry. I. Diatomic gold compounds, P. Schwerdtfeger, M. Dolg,
W. H. E. Schwarz, G. A. Bowmaker, and P. D. W. Boyd, J. Chem. Phys., 1989, 91, 1762.
[7] Relativistic effects in inorganic and organometallic chemistry, N. Kaltsoyannis, J. Chem. Soc.
Dalton Trans., 1997, 1, 1.
[8] Wetting and surface tension measurements on gold alloys, E. Ricci, R. Novakovic, Gold Bull.,
2001, 34, 41.
[9] Size and temperature-dependent structural transitions in gold nanoparticles, K. Koga, T.
Ikeshoji, K. Sugawara, Phys. Rev. Lett., 2004, 92, 115507.
[10] The chemistry of gold as an anion, M. Jansen, Chem. Soc. Rev., 2008, 37, 1826.
[11] Optical properties of the intermetallic compounds AuAl2, AuGa2 and AuIn2, S. S.
Vishnubhatla, J. P. Jan, Philos. Mag., 1967, 16, 45.
[12] Solid State Physics, N. W. Ashcroft, N. D. Mermin (ed.) (Harcourt College Publishers, New
York, 1976).
[13] Optical properties of selected elements, J. H. Weaver, H. P. R. Frederikse, CRC Handbook of
Chemistry and Physics, D. R. Lide (ed.) (CRC Press, Boca Raton, 2001) 133.
[14] Colour Res. and Appl., K. Nassau, 1987, 12, 4
[15] Precious Metals Science and Technology, K. Yonemitsu, eds. L.S. Benner, T. Suzuki, K.
Meguro, S. Tanaka, International Precious Metals Institute, Allentown, 1991, p.13
[16] Coloured gold alloys, C. Cretu, E. van der Lingen, Gold Bulletin, December 1999, Volume 32,
Issue 4, pp 115-126
[17] The Santa Fe Symposium on Jewelry Manufacturing Technology 1988, D.P. Agarwal, G.
Raykhtsaum, ed. D. Schneller, Santa Fe, 1988, p. 229
[18] American Jewelry Manufacturer, M. Plotnick, Jan. 1991, 20
141
[19] Light and Color, R.D. Overheim, D.L. Wagner, John Wiley & Sons Inc., New York, 1982, 63,
253
[20] American Jewelry Manufacturer, G. Raykhtsaum, D.P. Agarwal, February 1990, 116
[21] Selected properties of gold, J. G. Cohn, Gold Bulletin, 1979, 12, 21.
[22] The malleability of gold. An explanation of its unique mode of deformation, J. Nutting, J. L.
Nuttall, Gold Bulletin, 1977, 10, 2.
[23] Melting in small gold clusters: a Density Functional molecular dynamics study, B. Soule de
Bas, M. J. Ford, and M. B. Cortie, J. Phys: Condensed Matter, 2006, 18, 55.
[24] Direct observation of ferromagnetic spin polarization in gold nanoparticles, Y. Yamamoto, T.
Miura, M. Suzuki, N. Kawamura, H. Miyagawa, T. Nakamura, K. Kobayashi, T. Teranishi, and H.
Hori, Phys. Rev. Lett., 2004, 93, 116801.
[25] Phase Diagrams of Binary Gold Alloys, eds. H. Okamoto, T. B. Massalski, ASM International,
Metals Park, Ohio, 1987.
[26] Ternary Alloy Systems, Subvolume B: Noble Metal Systems, eds. G. Effenberg, S. Ilyenko,
Landolt-Bornstein New Series Group IV Volume 11, Springer-Verlag, Berlin, Germany, 2006.
[27] The Structures of Binary Compounds. Cohesion and Structure, P. Villars, K. Mathis, F.
Hulliger, F.R. De Boer, D.G. Pettifor (Eds.), vol. 2, North Holland, Amsterdam, 1989.
[28] A survey of gold intermetallic chemistry, R. Ferro, A. Saccone, D. Maccio, and S. Delfino,
Gold Bulletin, 2003, 36(2), 39.
[29] Gold in dentistry: alloys, uses and performance, H. Knosp, R. J. Holliday, and C. W. Corti,
Gold Bulletin, 2003, 36(3), 93.
[30] The effects of small additions and impurities on properties of carat golds, D. Ott, Gold
Technology, 1997, 22, 31.
[31] Grain size of gold and gold alloys, D. Ott and Ch. J. Raub, Gold Bulletin, 1981, 14(2), 69.
[32] The mobility and migration of boundaries, in Recrystallization and Related Annealing
Phenomena (Second Edition), F. J. Humphreys and M. Hatherly, Elsevier, New York, 2004, 121.
[33] Influence of small additions on the properties of gold and gold alloys (in German), D. Ott and
Ch. J. Raub, Part I: Metall, 1980, 34, 629; Part II: Metall, 1981, 35, 543; Part III: Metall, 1981, 35,
1005; Part IV: Metall, 1982, 36, 150.
[34] Gold-silver-copper alloys, A. S. McDonald, G. H. Sistare, in Metals Handbook, American
Society for Metals, Materials Park, OH, 1979, 2, 681.
[35] Hardening of gold-based dental casting alloys: Influence of minor additions and thermal
ageing, J. J. Laberge, D. Treheux, P. Guiraldeng, Gold Bulletin, 1979, 12(2), 45.
[36] Palladium Recovery, Properties and Uses, E. M. Wise, Academic Press, New York, 1968.
142
[37] The development of 990 gold-titanium: Its production, use and properties, G. Gafner, Gold
Bulletin, 1989, 22, 112.
[38] Stable strengthening of 990 gold, D. M. Jacobson, M. R. Harrison, S. P. S. Sangha, Gold
Bulletin, 1996, 29(3), 95.
[39] The development of a novel gold alloy with 995 fineness and increased hardness, M. du Toit,
E. van der Lingen, L. Glaner, and R. Suss, Gold Bulletin, 2002, 35(2), 46.
[40] Alloying and strengthening of gold via rare earth metal additions, Y. Ning, Gold Bulletin,
2001, 34(3), 77.
[41] Thermodynamic modelling of precious metals alloys, B. Kempf, S. Schmauder, Gold Bulletin,
1998, 31(2), 51.
[42] Hardening of low-alloyed gold, J. Fischer-Buhner, Gold Bulletin, 2005, 38(3), 120–131.
[43] Dispersion hardened gold: A new material of improved strength at high temperatures, M.
Poniatowski, M. Clasing, Gold Bulletin, 1972, 5, 34.
[44] Z. Metallkde., L. Nowack, 1930, 22, 94-103.
[45] Acta Met., M. Hirabayashi, S. Weissmann, 1962, 10, 25-36.
[46] Age-hardening and related phase transformations in dental gold alloys, K. Yasuda, Gold
Bulletin, 1987, 20(4), 90.
[47] A plain man’s guide to alloy phase diagrams: their use in jewellery manufacture – Part 2, M.
Grimwade, Gold Technology, 2000, 30, 8.
[48] Gold: Science and Application, C. Corti, R. Holliday, Taylor & Francis Group, 2009.
[49] The colour of Au-Ag-Cu alloys: Quantitative mapping of the ternary diagram, R. M. German,
M. M. Guzowski, D. C. Wright, Gold Bulletin, 1980, 13, 113.
[50] Don’t let nickel get under your skin – the European experience!, R. Rushforth, Gold
Technology, 2000, 28, 2.
[51] Development of 18ct white gold alloys without Ni and Pd, A. Basso, J. Fischer-Buehner, M.
Poliero, in Proceedings of The Santa Fe Symposium on Jewelry Manufacturing Technology 2008,
ed. E. Bell, Met-Chem Research, Albuquerque, NM, 2008, 31.
[52] Production and characterisation of 18 carat white gold alloys conforming to European
Directive 94/27 CE, M. Dabala, M. Magrini, M. Poliero, and R. Galvani, Gold Technology, 1999,
25, 29.
[53] Blue black and purple! The special colours of gold, C. W. Corti, in Proceedings of The Santa
Fe Symposium on Jewelry Manufacturing Technology 2004, ed. E. Bell, Met-Chem Research,
Albuquerque, NM, 2004, 121.
143
[54] S. Hori, K. Kurokawa, T. Shimizo, M. Steel, M. Tsuboi, K. Yanagase, in Precious Metals
Science And Technology, eds. L.S. Benner, T. Suzuki, K. Meguro, S. Tanaka, International Precious
Metals Institute, Allentown, 1991, p. 430
[55] Microstructure of Au-Al systems manipulated by rapid solidification techniques, K.
Wongpreedee and P. Ruethaithananon, paper presented at Gold 2009, 5th International Conference
on Gold Science, Technology and its Applications, Heidelberg, 2009.
[56] Determination of the 76 wt% Au section of the Al-Au-Cu phase diagram, F. C. Levey, M. B.
Cortie, L. A. Cornish, Journal of Alloys and Compounds, 2003, 354, 171.
[57] On the compounds of Sodium and Potassium with Gold (in German), U. Quadt, F. Weibke, W.
Blitz, Zeitschrift für anorganische und allgemeine Chemie, 1937, 232, 298.
[58] Phase width and valence electron concentration of the ternary cubic Zintl phases of the NaTl
type (in German), H. Pauly, A. Weiss, H. Witte, Zeitschrift fur Metallkunde, 1968, 59(7), 554.
[59] Gold casting alloys: The effect of Zinc additions on their behaviour, Ch. Raub, D. Ott, Gold
Bulletin, 1983, 16, 2.
[60] The bonding of gold and gold alloys to non-metallic materials, W. S. Rapson, Gold Bulletin,
1979, 12(3), 108.
[61] Alloys by Design: Knowing the answer before spending the money, B. Lohwongwatana, E.
Nisaratanaporn, in Proceedings of The Sante Fe Symposium on Jewelry Manufacturing Technology
2008, ed. E. Bell, Met-Chem Research, Albuquerque, NM, 2008, 201.
[62] Production of gold findings by stamping, F. Klotz, Gold Technology, No. 33, 2001, 13–16.
[63] Bi-metal solder flush products and their use for high productivity manufacture, In Proceedings
of the Santa Fe Symposium on Jewelry Manufacturing Technology, G. Normandeau, ed. D.
Schneller, 1991, 149–170, Albuquerque, NM: Met-Chem Research.
[64] The shape of the future – recent developments in electroforming, C. W. Corti, AJM Magazine,
Issue 3/03, March 2003, 51–59.
[65] Electroforming in gold jewelry production, F. Simon, Gold Technology, No. 4, May 1991, 10–
15.
[66] Recent developments in the field of electroforming, a production process for hallmarkable
hollow jewelry, F. Simon, Gold Technology, No. 16, July 1995, 22–29.
[67] Back to basics: Investment casting, Part I, C. W. Corti, Gold Technology, 2000, No. 28, 27–
32.
[68] Handbook on Casting and Other Defects, D. Ott, 1997, London: World Gold Council.
[69] Vibration technology for the solidification process of investment casting, P. Hofmann, In Proc.
3rd Jewellery Technology Forum, May 2006, 189–199. Vicenza, Italy: Legor Group.
144
[70] Stone-in-place casting for high-end jewelry, H. Schuster, In Proceedings of the Santa Fe
Symposium on Jewelry Manufacturing Technology, 2008, ed. E. Bell, 283–294. Albuquerque, NM:
Met Chem Research.
[71] Advances in the prevention of investment casting defects by computer simulation, J. Fischer-
Buhner, In Proceedings of the Santa Fe Symposium on Jewelry Manufacturing Technology, 2007,
ed. E. Bell, 149–172. Albuquerque, NM: Met-Chem Research.
[72] Hollow karat gold jewelry from strip and tube, P. Raw, Gold Technology, No. 35, Summer
2002, 3–10.
[73] The production of karat gold chain wire, P. Taimsalu, Aurum, No. 14, 1983, 49–55.
[74] Overview: Joining technology in chain manufacture, A. Canaglia, Gold Technology, No. 17,
October 1995, 20–25.
[75] Evaluation of strength and quality of chains, D. P. Agarwal, Gold Technology, No. 24,
September 1998, 2–5.
[76] Health, safety and environmental pollution in gold jewelry manufacture, M. F. Grimwade,
Gold Technology, No. 18, April 1996, 4–10.
[77] Sintering technology for jewelry and multicolor rings, In Proceedings of the Santa Fe
Symposium on Jewelry Manufacturing Technology, K. Weisner, 2005, ed. E. Bell, 501–519.
Albuquerque, NM: Met-Chem Research.
[78] Comparative study on metal finishing techniques on standard sample of cast gold, In
Proceedings of the Santa Fe Symposium on Jewelry Manufacturing Technology, M. Dreher, 1991,
ed. D. Schneller, 27–44. Albuquerque, NM: Met-Chem Research.
[79] Gold wedding rings from powder – tomorrow’s technology today, P. Raw, Gold Technology,
No. 27, November 1999, 2–8.
[80] Laser applications in gold jewellery production, S. Valenti, Gold Technology, No. 34, Spring
2002, 14–20.
[81] Metal injection molding (MIM) for gold jewelry production, J. T. Strauss, Gold Technology,
No. 20, November 1996, 17–29.
[82] The role of CAD/CAM in the modern jewelry business, L. C. Molinari, M. C. Megazzini, E.
Bemporad, Gold Technology, No. 23, April 1998, 3–7.
[83] CAD-CAM technology: transforming the goldsmith’s workshop, M. G. Malagoli, Gold
Technology, No. 34, Spring 2002, 31–35.
[84] Residual Stress – Measurement by Diffraction and Interpretation, I.C. Noyan, J.B. Cohen,
1987, Materials Research and Engineering, Springer-Verlag, New York Inc.
145
[85] Micromorphological Studies of the Corrosion of Gold Alloy, A. J. Forty, Gold Bulletin, March,
1981, Volume 14, Issue 1, pp 25-35.
[86] J. Electrochem. Soc., H. W. Pickering, C. Wagner, 1967, 114, 698-706.
[87] Fundamental Aspects of Stress Corrosion Cracking, H. W. Pickering, edited by R. W. Staehle,
A. J. Forty, D. van Rooyen. N.A.C.E., 1967, Houston, TX, pp. 159-174.
[88] J. Dent. Res., K. F. Leinfelder, D. F. Taylor, 1977, 56, (3), 335-345.
[89] Werkstoffe und Korrosion., A. Randak, F. W. Trautes, 1970, Vol 21, no. 2, page 97.
[90] Corrosion, K. Elayaperumal, P. K. De, J. Balachandra, 1972, Vol 28, no. 7, page 269.
[91] Effect of microstructure and residual stresses, generated from different annealing and
deformation processes, on the corrosion and mechanical properties of gold welding alloy wires, C.
Cason, L. Pezzato, M. Breda, F. Furlan, M. Dabalà, Gold Bulletin, December 2015, Volume 48,
Issue 3-4, pp 135-145.
[92] Design and Analysis of Experiments (8th Edition), Douglas C. Montgomery, John Wiley and
Sons. ISBN: 978-1118-14692-7.
[93] Effect of the composition and production parameters on the microstructure, residual stresses,
mechanical and corrosion properties of gold alloys used in industrial jewelry processes, (in press),
C. Cason, L. Pezzato, K. Brunelli, F. Furlan, M. Dabalà, Advanced in Materials Science, ISSN:
2398-6883
[94] The electroplastic effect in metals, H. Conrad, Strength of Materials, Vol. 16, No. 2, pp 103-
106, February 1984.
[95] Effects of electric current on solid state phase transformations in metals, H. Conrad, in
Materials Science and Engineering A287 (2000) 227-237.
[96] Nanocrystallization of amorphous Fe-Si-B alloys using high current density electropulsing,
Z.H. Lai, H. Conrad, G.Q. Teng, Y.S. Chao, Materials Science & Engineering, 2000
[97] Microstructure and mechanical properties of a 18Kt 5N gold alloy after different heat
treatments, L. Pezzato, G. Magnabosco, K. Brunelli, M. Breda, M. Dabalà, Metallogr. Microstruct.
Anal., DOI 10.1007/s13632-016-0262-4, 2016.
146
LIST OF PUBLICATIONS
Published Papers
- CASON C., Pezzato L, Breda M, Furlan F, Dabalà M Effect of microstructure and residual
stresses, generated from different annealing and deformation processes, on the corrosion
and mechanical properties of gold-welding alloy wires. GOLD BULLETIN, December
2015, Volume 48, Issue 3, pp 135–145
Submitted and accepted
- CASON C., Pezzato L, Brunelli K, Furlan F, Dabalà M Effect of the composition and
production parameters on the microstructure, residual stresses, mechanical and corrosion
properties of gold alloys used in industrial jewelry process. ADVANCED MATERIAL
SCIENCE (AMS), Volume 1, Issue 2
Conference Proceedings
- CASON C., Pezzato L, Dabalà M (in press) Gold alloys hardening: effect of composition
and heat treatment on mechanical properties of gold alloys. JOURNAL OF APPLIED
BIOMATERIALS & FUNCTIONAL MATERIALS, ISSN: 2280-8000
- CASON C., Pezzato L, Breda M, Dabalà M Effect of microstructure and residual stresses,
generated from different annealing and deformation processes, on the corrosion and
mechanical properties of gold welding alloy wires. Conference Proceedings. Warsaw,
Poland, 21-25 September 2015
- CASON C., Pezzato L, Brunelli K, Dabalà M Effect of the composition and production
process parameters on the microstructure, residual stresses, mechanical and corrosion
properties of gold alloys used in industrial processes. Journal of Material Sciences &
Engineering, June 2016, Volume 5, Issue 3, pp 68

147
- CASON C., Pezzato L, Brunelli K, Dabalà M Effetto della composizione e dei parametri di
produzione sulle caratteristiche di leghe d’oro in 10 Kt usate in processi industriali.
Conference Proceedings. Parma, Italy. 36° Convegno Nazionale AIM, 21-23 September
2016
148
ACKNOWLEDGMENTS
The realization of this work was made possible by the collaboration between the Department of
Industrial Engineering of Padua and Filk S.p.A.
First of all, I want to thank the management of Filk S.p.A., in particular Pietro Cremasco and Elisa
Cremasco who believed in this project, I thank also Mario and Carlo Cremasco for the helpful
discussions. Special thanks goes to Ing. Fabrizio Furlan for the help, the advices and the trust
shown.
I want to thank my supervisor prof. Manuele Dabalà for the support and the constant presence.
Thanks also to the other members of the metallurgy group: Katya, Giulia, Massimiliano for the
patience and the important help.
I thank also Luca, Pierre, Totò, Marco and Claudio for the collaboration and for all they have given
me during these three years.
Returning to the company that has taken me over these years and allowed me to grow
professionally; thanks to Emiliano, Cristopher, Lisa, Marco, Luca C., Ernesto, Giampietro, Elena,
Mauro, Luca Z., Alfredo, Andrea and Nicola. Special thanks goes to my first two mentors, Mirco
and Luciano, the greater part of my training was done under your supervision. I began to learn the
ropes from you.
Important was also the support and help given by the laboratories of Progold S.p.A., thanks to Ing.
Daniele Maggian, to Dr. Valerio Doppio and to the “chemical etching magician” Dr. Patrizio
Sbornicchia for the collaboration and the advices given.
Finally, I want to thank my family for always believing in me. Special thanks to Anna, to be always
present, always willing to listen me, to support my professional choices and, very important, to bear
me.
149
RINGRAZIAMENTI
È stato possibile portare a compimento questo lavoro di ricerca grazie alla collaborazione tra il
Dipartimento di Ingegneria Industriale dell’Università di Padova e dell’azienda orafa Filk.
Prima di tutto voglio ringraziare la direzione aziendale, in particolare il presidente Pietro Cremasco
ed Elisa Cremasco che hanno creduto in questo progetto, ringrazio inoltre Mario e Carlo Cremasco
per le utili discussioni e il loro contributo nelle fasi produttive. Un ringraziamento speciale va al
direttore di produzione Ing. Fabrizio Furlan per l’aiuto, i consigli e la fiducia dimostratami.
Voglio ringraziare il mio supervisore prof. Manuele Dabalà per il supporto e la presenza costante.
Un grazie a tutti gli altri membri del gruppo metallurgico di Padova: Katya, Giulia e Massimiliano
per la pazienza e il grande aiuto.
Ringrazio inoltre Luca, Pierre, Totò, Marco e Claudio per la collaborazione e tutto quello che mi
hanno dato durante questi tre anni. Anche se suddivisi tra già dottorati e ancora dottorandi, il
gruppo, come pure l’esperienza lavorativa al vostro fianco, rimarranno unici.
Ritornando all’azienda che mi ha accolto in questi ultimi anni e mi ha permesso di crescere
professionalmente; vorrei ringraziare Emiliano, Cristopher, Lisa, Marco, Luca C., Ernesto,
Giampietro, Elena, Mauro, Luca Z., Alfredo, Andrea e Nicola. Un ringraziamento speciale va ai
miei primi due mentori, Mirco e Luciano, gran parte del mio addestramento è stato compiuto sotto
la vostra attenta supervisione. Con voi, posso dire di “essermi fatto le ossa” professionalmente
parlando, e sono contento che siate stati per me guide prima ancora che colleghi.
Molto importante è stato inoltre il supporto e l’aiuto conferito dai laboratori dell’azienda Progold,
un grazie doveroso va all’Ing. Daniele Maggian, al Dr. Valerio Doppio e al “mago degli attacchi”
Dr. Patrizio Sbornicchia per la collaborazione, i consigli e l’enorme passione per questo mondo di
ricerca che ci accomuna.
Infine, come non poter ringraziare la mia famiglia per aver creduto in me e per essersi dimostrati
sempre disponibili. Tutto ciò che sono oggi e quello che ho portato a termine lo devo a voi, e non
smetterò mai di ripeterlo, i miei traguardi alla fin fine sono i vostri traguardi. Un ringraziamento
speciale va ad Anna, per essere sempre presente, sempre disposta ad ascoltarmi, per supportare le
mie scelte professionali e, molto importante, per sopportarmi con estrema pazienza.

150

![INDEX [paduaresearch.cab.unipd.it]paduaresearch.cab.unipd.it/3498/1/tesi3.pdf · 1. introduction 3 1.1 hydrogeophysics in hydrological systems 8 1.1.1 the saturated zone 8 1.1.2 the](https://img.pdfslide.us/doc/110x75/5f3a9f7144e7680c117a5f68/index-1-introduction-3-11-hydrogeophysics-in-hydrological-systems-8-111.jpg)