Embed Size (px)
Citation preview
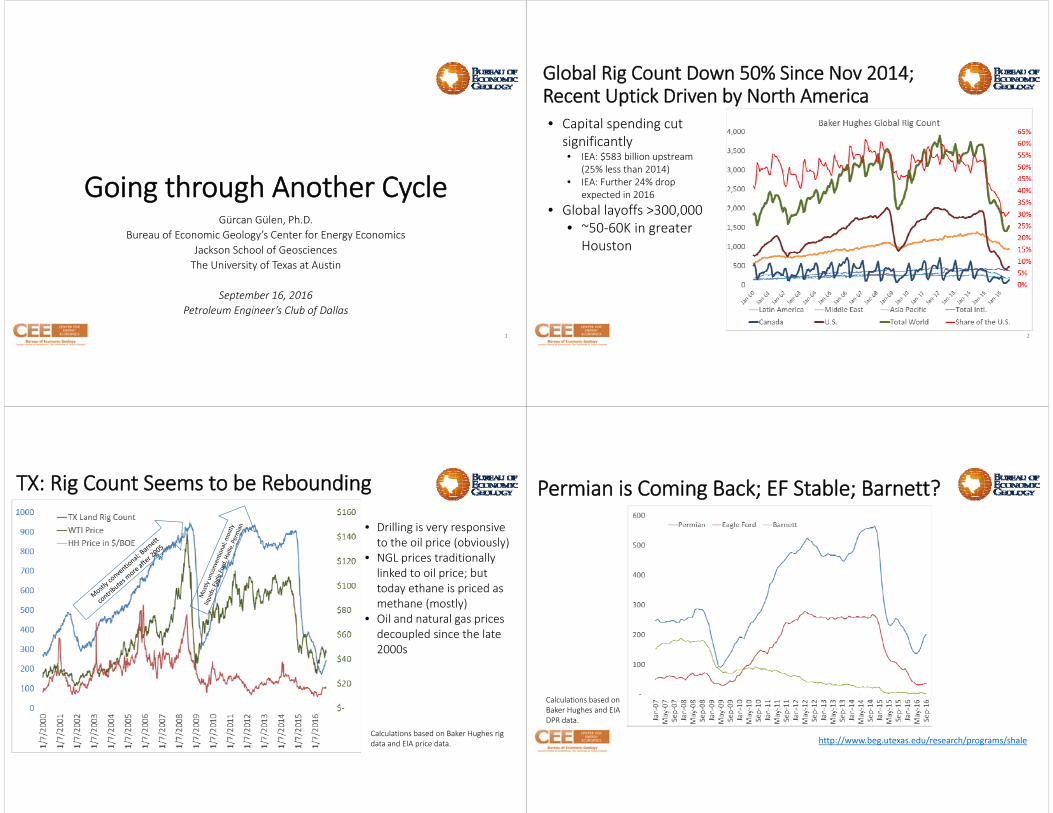
Going through Another CycleGürcan Gülen, Ph.D.
Bureau of Economic Geology’s Center for Energy EconomicsJackson School of GeosciencesThe University of Texas at Austin
September 16, 2016Petroleum Engineer’s Club of Dallas
1
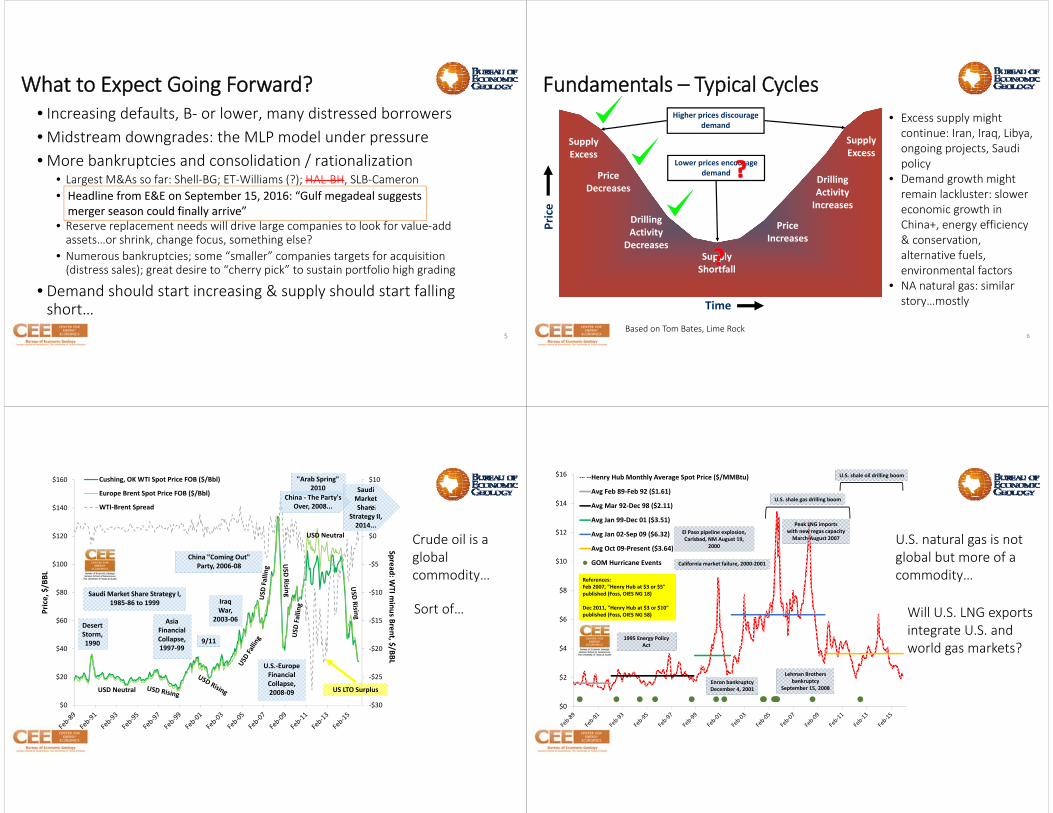
Global Rig Count Down 50% Since Nov 2014; Recent Uptick Driven by North America
2
• Capital spending cut significantly• IEA: $583 billion upstream
(25% less than 2014)• IEA: Further 24% drop
expected in 2016
• Global layoffs >300,000• ~50‐60K in greater Houston
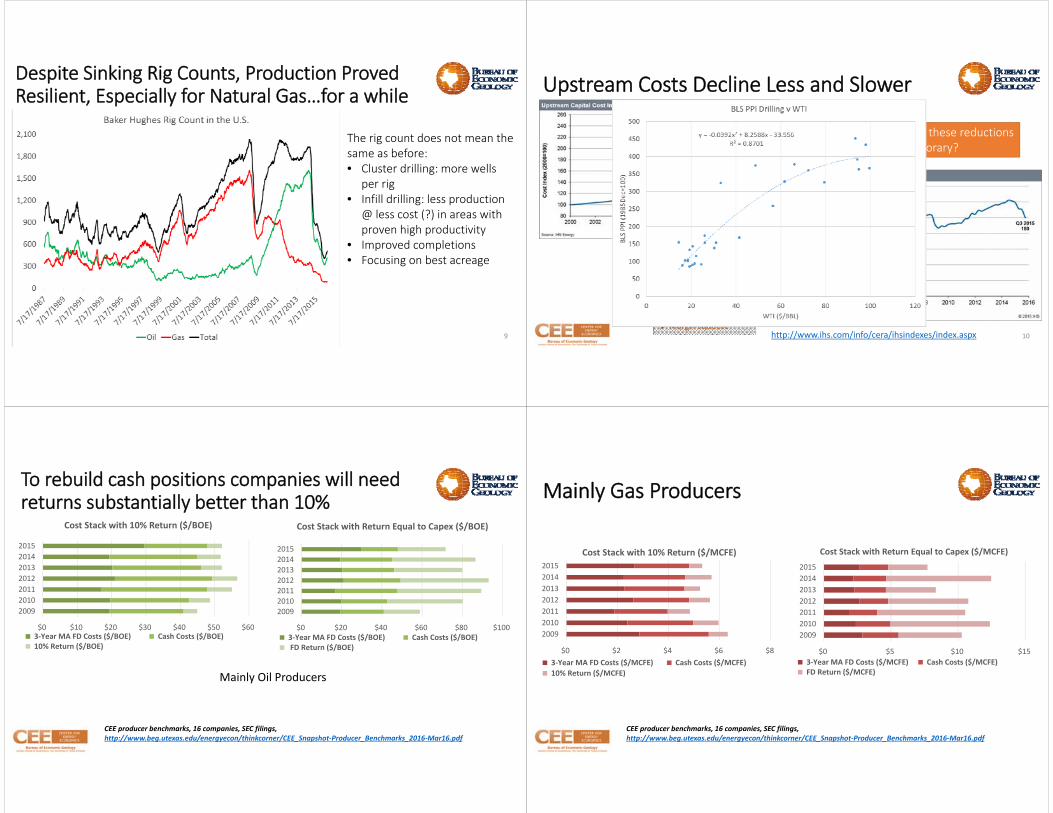
TX: Rig Count Seems to be Rebounding
Calculations based on Baker Hughes rig data and EIA price data.
• Drilling is very responsive to the oil price (obviously)
• NGL prices traditionally linked to oil price; but today ethane is priced as methane (mostly)
• Oil and natural gas prices decoupled since the late 2000s
Permian is Coming Back; EF Stable; Barnett?
Calculations based on Baker Hughes and EIA DPR data.
http://www.beg.utexas.edu/research/programs/shale
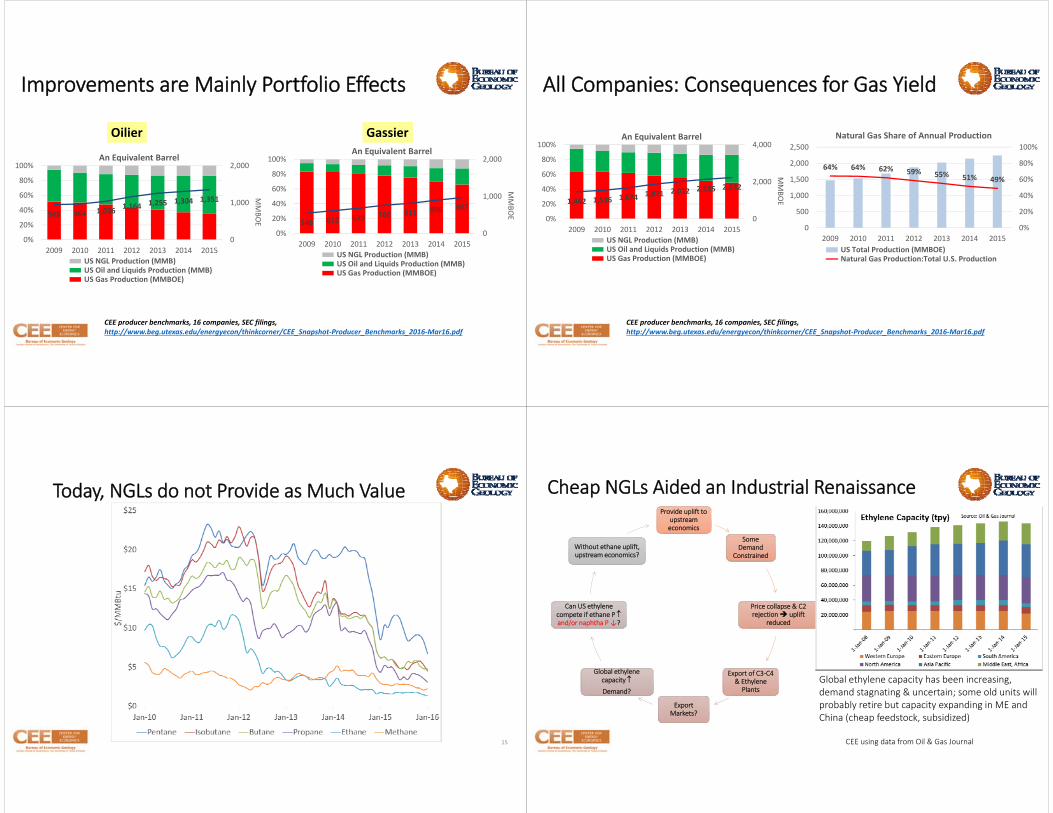
What to Expect Going Forward?• Increasing defaults, B‐ or lower, many distressed borrowers• Midstream downgrades: the MLP model under pressure• More bankruptcies and consolidation / rationalization
• Largest M&As so far: Shell‐BG; ET‐Williams (?); HAL‐BH, SLB‐Cameron• 2015 was slow in M&A mainly due to oil price uncertainty leading to irreconcilable bid‐ask spreads
• Reserve replacement needs will drive large companies to look for value‐add assets…or shrink, change focus, something else?
• Numerous bankruptcies; some “smaller” companies targets for acquisition (distress sales); great desire to “cherry pick” to sustain portfolio high grading
• Demand should start increasing & supply should start falling short…
5
Headline from E&E on September 15, 2016: “Gulf megadeal suggests merger season could finally arrive”
Supply Shortfall
Price Increases
Drilling Activity Increases
Supply Excess
Drilling Activity
Decreases
Price Decreases
Supply Excess
Time
Price
Higher prices discourage demand
Lower prices encourage demand
Based on Tom Bates, Lime Rock
Fundamentals – Typical Cycles
6
• Excess supply might continue: Iran, Iraq, Libya, ongoing projects, Saudi policy
• Demand growth might remain lackluster: slower economic growth in China+, energy efficiency & conservation, alternative fuels, environmental factors
• NA natural gas: similar story…mostly
‐$30
‐$25
‐$20
‐$15
‐$10
‐$5
$0
$5
$10
$0
$20
$40
$60
$80
$100
$120
$140
$160
Spread: WTI m
inus Brent, $/BBL
Price, $/BBL
Cushing, OK WTI Spot Price FOB ($/Bbl)
Europe Brent Spot Price FOB ($/Bbl)
WTI‐Brent Spread
US LTO Surplus
Saudi Market Share Strategy I, 1985‐86 to 1999
China "Coming Out" Party, 2006‐08
U.S.‐Europe Financial Collapse, 2008‐09
Asia Financial Collapse,1997‐99
"Arab Spring" 2010 Saudi
Market Share
Strategy II, 2014...
Desert Storm, 1990
Iraq War,
2003‐06
China ‐ The Party's Over, 2008...
9/11
USD Neutral
USD Neutral
Crude oil is a global commodity…
Sort of…
$0
$2
$4
$6
$8
$10
$12
$14
$16 Henry Hub Monthly Average Spot Price ($/MMBtu)
Avg Feb 89‐Feb 92 ($1.61)
Avg Mar 92‐Dec 98 ($2.11)
Avg Jan 99‐Dec 01 ($3.51)
Avg Jan 02‐Sep 09 ($6.32)
Avg Oct 09‐Present ($3.64)
GOM Hurricane Events
References:Feb 2007, "Henry Hub at $3 or $5" published (Foss, OIES NG 18)
Dec 2011, "Henry Hub at $3 or $10" published (Foss, OIES NG 58)
El Paso pipeline explosion, Carlsbad, NM August 19,
2000
California market failure, 2000‐2001
U.S. shale gas drilling boom
Peak LNG importswith new regas capacityMarch‐August 2007
U.S. shale oil drilling boom
1995 Energy Policy Act
Lehman Brothers bankruptcy
September 15, 2008Enron bankruptcyDecember 4, 2001
U.S. natural gas is not global but more of a commodity…
Will U.S. LNG exports integrate U.S. and world gas markets?
Despite Sinking Rig Counts, Production Proved Resilient, Especially for Natural Gas…for a while
9
The rig count does not mean the same as before: • Cluster drilling: more wells
per rig• Infill drilling: less production
@ less cost (?) in areas with proven high productivity
• Improved completions• Focusing on best acreage
Upstream Costs Decline Less and Slower
10http://www.ihs.com/info/cera/ihsindexes/index.aspx
What percentage of these reductions are temporary?
High prices Input costs increase
Low prices Sticky input costs
Smaller revenue
Margin squeeze
To rebuild cash positions companies will need returns substantially better than 10%
$0 $10 $20 $30 $40 $50 $60
2009201020112012201320142015
Cost Stack with 10% Return ($/BOE)
3‐Year MA FD Costs ($/BOE) Cash Costs ($/BOE) 10% Return ($/BOE)
$0 $20 $40 $60 $80 $100
2009201020112012201320142015
Cost Stack with Return Equal to Capex ($/BOE)
3‐Year MA FD Costs ($/BOE) Cash Costs ($/BOE) FD Return ($/BOE)
Mainly Oil Producers
CEE producer benchmarks, 16 companies, SEC filings, http://www.beg.utexas.edu/energyecon/thinkcorner/CEE_Snapshot‐Producer_Benchmarks_2016‐Mar16.pdf
Mainly Gas Producers
$0 $2 $4 $6 $8
2009201020112012201320142015
Cost Stack with 10% Return ($/MCFE)
3‐Year MA FD Costs ($/MCFE) Cash Costs ($/MCFE) 10% Return ($/MCFE)
$0 $5 $10 $15
2009201020112012201320142015
Cost Stack with Return Equal to Capex ($/MCFE)
3‐Year MA FD Costs ($/MCFE) Cash Costs ($/MCFE) FD Return ($/MCFE)
CEE producer benchmarks, 16 companies, SEC filings, http://www.beg.utexas.edu/energyecon/thinkcorner/CEE_Snapshot‐Producer_Benchmarks_2016‐Mar16.pdf
Improvements are Mainly Portfolio Effects
546 612 679 760 811 896 967
0
1,000
2,000
0%
20%
40%
60%
80%
100%
2009 2010 2011 2012 2013 2014 2015
MMBO
E
An Equivalent Barrel
US NGL Production (MMB) US Oil and Liquids Production (MMB) US Gas Production (MMBOE)
Oilier Gassier
948 964 1,036 1,164 1,255 1,304 1,351
0
1,000
2,000
0%
20%
40%
60%
80%
100%
2009 2010 2011 2012 2013 2014 2015
MMBO
E
An Equivalent Barrel
US NGL Production (MMB) US Oil and Liquids Production (MMB) US Gas Production (MMBOE)
CEE producer benchmarks, 16 companies, SEC filings, http://www.beg.utexas.edu/energyecon/thinkcorner/CEE_Snapshot‐Producer_Benchmarks_2016‐Mar16.pdf
All Companies: Consequences for Gas Yield
1,462 1,536 1,674 1,871 2,012 2,135 2,232
0
2,000
4,000
0%
20%
40%
60%
80%
100%
2009 2010 2011 2012 2013 2014 2015
MMBO
E
An Equivalent Barrel
US NGL Production (MMB) US Oil and Liquids Production (MMB) US Gas Production (MMBOE)
64% 64% 62% 59% 55% 51% 49%
0%
20%
40%
60%
80%
100%
0
500
1,000
1,500
2,000
2,500
2009 2010 2011 2012 2013 2014 2015
Natural Gas Share of Annual Production
US Total Production (MMBOE) Natural Gas Production:Total U.S. Production
CEE producer benchmarks, 16 companies, SEC filings, http://www.beg.utexas.edu/energyecon/thinkcorner/CEE_Snapshot‐Producer_Benchmarks_2016‐Mar16.pdf
Today, NGLs do not Provide as Much Value
15
Cheap NGLs Aided an Industrial RenaissanceProvide uplift to
upstream economics
Some Demand
Constrained
Price collapse & C2 rejection uplift
reduced
Export of C3‐C4 & Ethylene Plants
Export Markets?
Global ethylene capacity
Demand?
Can US ethylene compete if ethane P and/or naphtha P ↓?
Without ethane uplift, upstream economics?
Global ethylene capacity has been increasing, demand stagnating & uncertain; some old units will probably retire but capacity expanding in ME and China (cheap feedstock, subsidized)
CEE using data from Oil & Gas Journal
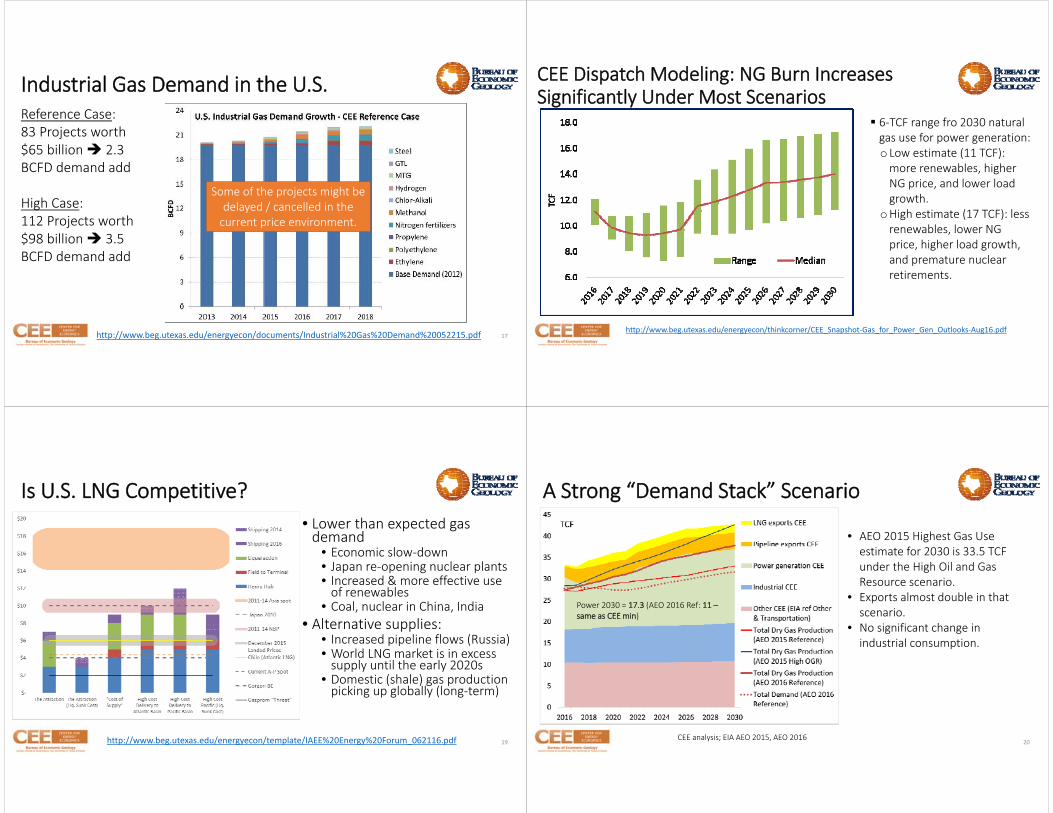
Industrial Gas Demand in the U.S.
17
Reference Case:83 Projects worth $65 billion 2.3 BCFD demand add
High Case:112 Projects worth $98 billion 3.5 BCFD demand add
http://www.beg.utexas.edu/energyecon/documents/Industrial%20Gas%20Demand%20052215.pdf
Some of the projects might be delayed / cancelled in the current price environment.
CEE Dispatch Modeling: NG Burn Increases Significantly Under Most Scenarios
http://www.beg.utexas.edu/energyecon/thinkcorner/CEE_Snapshot‐Gas_for_Power_Gen_Outlooks‐Aug16.pdf
6‐TCF range fro 2030 natural gas use for power generation: o Low estimate (11 TCF): more renewables, higher NG price, and lower load growth.
oHigh estimate (17 TCF): less renewables, lower NG price, higher load growth, and premature nuclear retirements.
Is U.S. LNG Competitive?• Lower than expected gas demand
• Economic slow‐down• Japan re‐opening nuclear plants• Increased & more effective use of renewables
• Coal, nuclear in China, India• Alternative supplies:
• Increased pipeline flows (Russia)• World LNG market is in excess supply until the early 2020s
• Domestic (shale) gas production picking up globally (long‐term)
19http://www.beg.utexas.edu/energyecon/template/IAEE%20Energy%20Forum_062116.pdf
A Strong “Demand Stack” Scenario
20CEE analysis; EIA AEO 2015, AEO 2016
Power 2030 = 17.3 (AEO 2016 Ref: 11 –same as CEE min)
• AEO 2015 Highest Gas Use estimate for 2030 is 33.5 TCF under the High Oil and Gas Resource scenario.
• Exports almost double in that scenario.
• No significant change in industrial consumption.