Embed Size (px)
Citation preview

www.pwc.de
Going East in Life Science:An Introduction
4th DVFA – Life Science ConferenceFrankfurt, May 17, 2011
Dr. Martin SchlohHead of Pharma &Healthcare Consulting Practicein Germany
PwC
Agenda
1. China will become a superpower in Pharma & Healthcare
2. Overview of the investment trends in China along the Pharmaceutical Value Chain
3. Overview of Chinese Life Science M&A
May 2011Going East in Life Science
Slide 2
PwC
China will become a superpower in Pharma & Healthcare
3
PwC
China’s pharma market is poised for continuous growth supported by significant drivers
Slide 4
Going East in Life Science May 2011
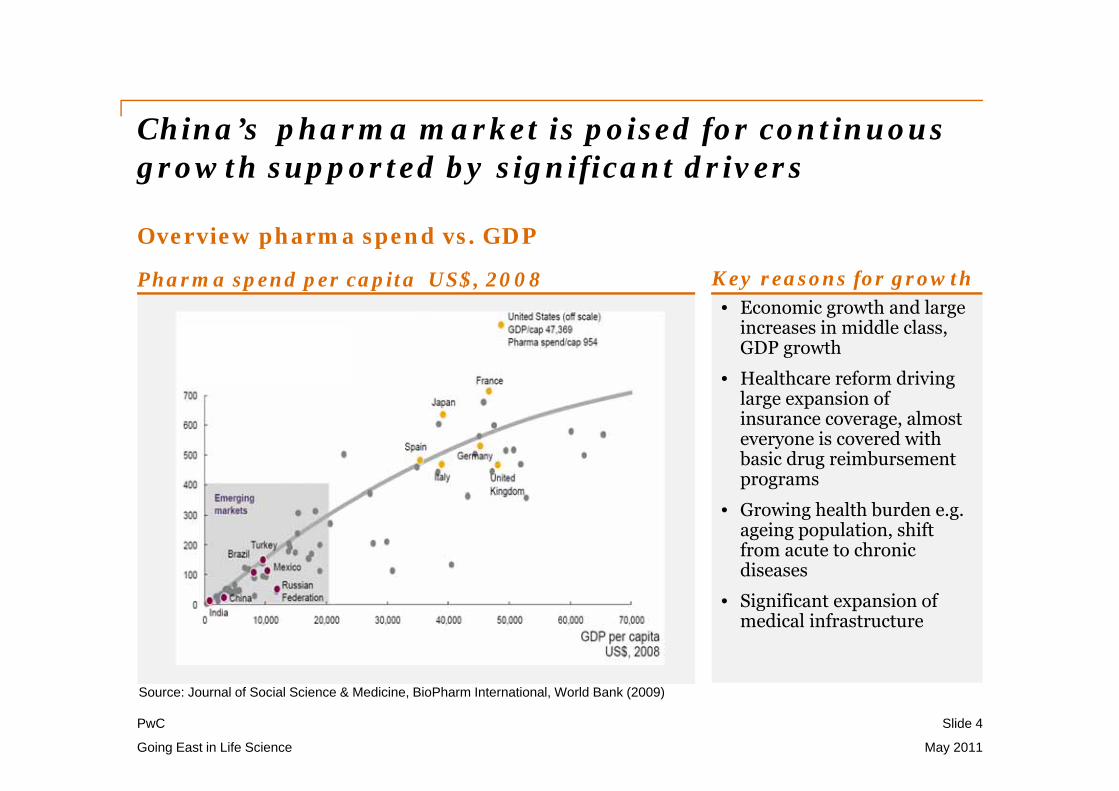
Overview pharma spend vs. GDP
Pharma spend per capita US$, 2008
Source: Journal of Social Science & Medicine, BioPharm International, World Bank (2009)
• Economic growth and large increases in middle class, GDP growth
• Healthcare reform driving large expansion of insurance coverage, almost everyone is covered with basic drug reimbursement programs
• Growing health burden e.g. ageing population, shift from acute to chronic diseases
• Significant expansion of medical infrastructure
Key reasons for growth
PwC
13,4
10,1 10,3
7,87,0 7,2
5.4
5,4
4,6 4,4
16,2
11,711,3
9,6 9,3 9,05.4
5,4
4,64,2
2000 2009
Total healthcare spending is 4.6% of GDP and still far below OECD average
Slide 5
Going East in Life Science May 2011
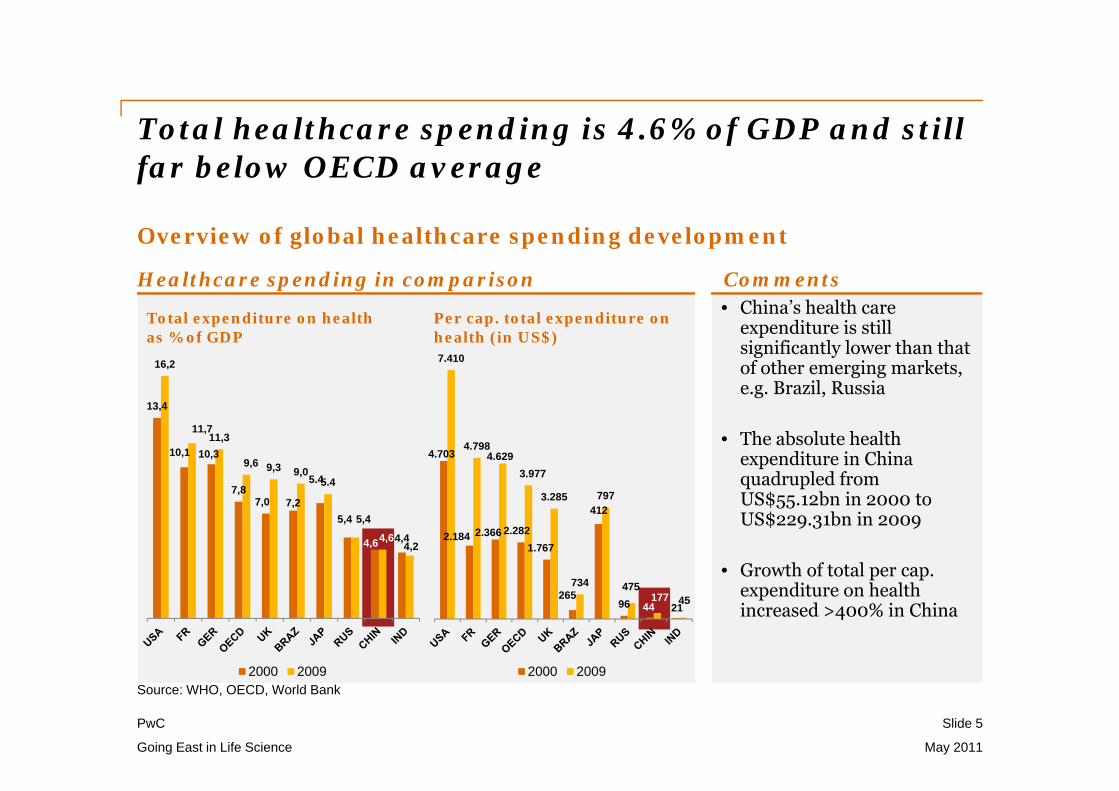
Overview of global healthcare spending development
Healthcare spending in comparison
Total expenditure on health as % of GDP
Per cap. total expenditure on health (in US$)
4.703
2.184 2.366 2.2821.767
265
412
96 44 21
7.410
4.7984.629
3.977
3.285
734
797
475177 45
2000 2009Source: WHO, OECD, World Bank
• China’s health care expenditure is still significantly lower than that of other emerging markets, e.g. Brazil, Russia
• The absolute health expenditure in China quadrupled from US$55.12bn in 2000 to US$229.31bn in 2009
• Growth of total per cap. expenditure on health increased >400% in China
Comments
PwC
OECD average for China would lead to a country wide Pharma & Healthcare super power
Slide 6
Going East in Life Science May 2011
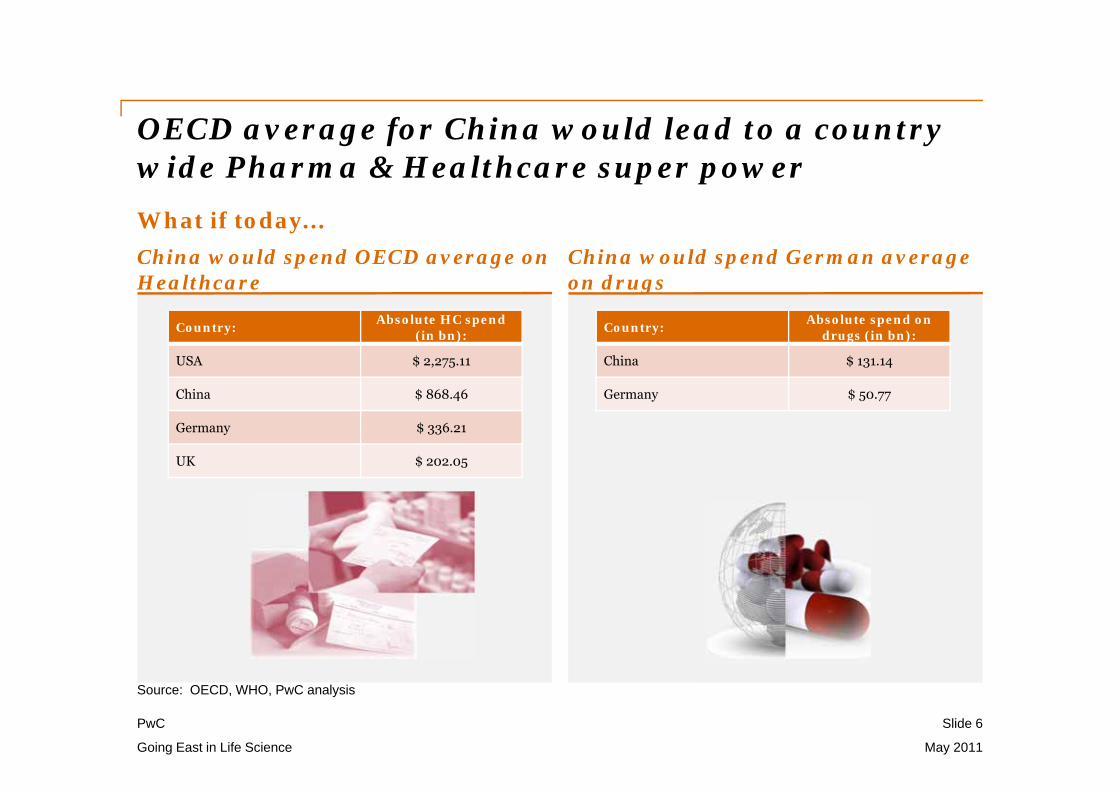
What if today...China would spend OECD average on Healthcare
Source: OECD, WHO, PwC analysis
China would spend German average on drugs
Country: Absolute HC spend (in bn):
USA $ 2,275.11
China $ 868.46
Germany $ 336.21
UK $ 202.05
Country: Absolute spend on drugs (in bn):
China $ 131.14
Germany $ 50.77
PwC
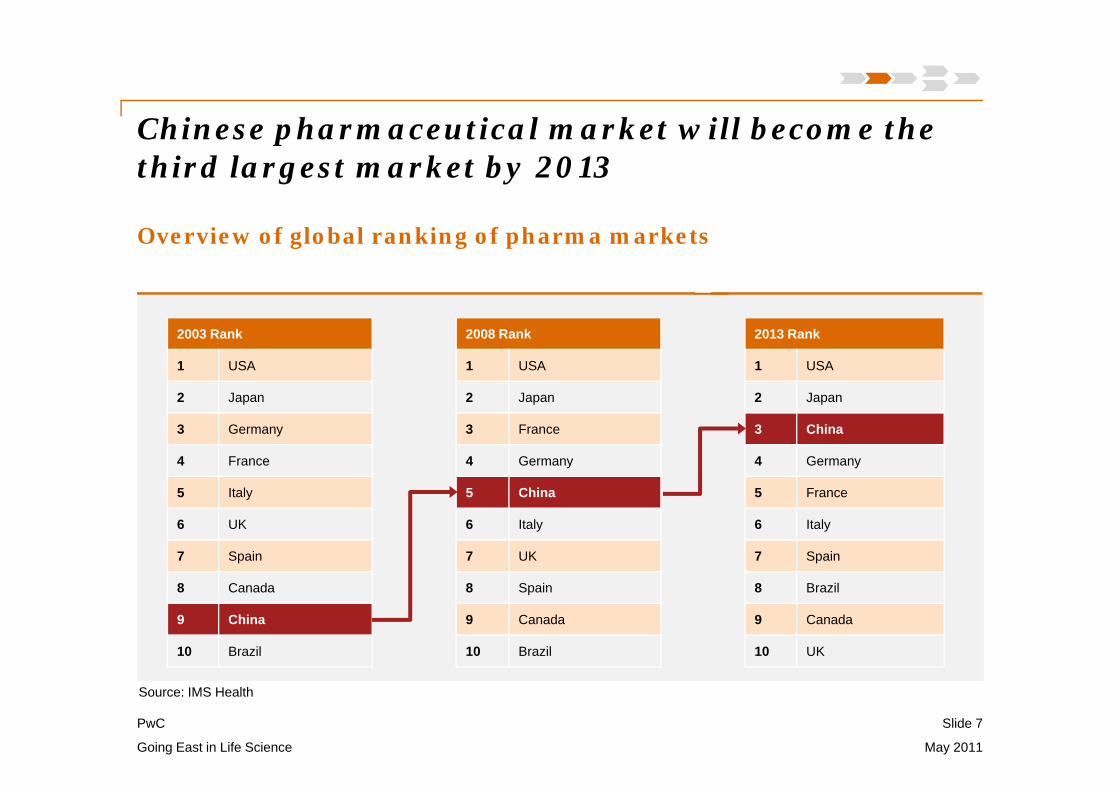
Chinese pharmaceutical market will become the third largest market by 2013
Slide 7
Going East in Life Science May 2011
Overview of global ranking of pharma markets
Source: IMS Health
2003 Rank
1 USA
2 Japan
3 Germany
4 France
5 Italy
6 UK
7 Spain
8 Canada
9 China
10 Brazil
2008 Rank
1 USA
2 Japan
3 France
4 Germany
5 China
6 Italy
7 UK
8 Spain
9 Canada
10 Brazil
2013 Rank
1 USA
2 Japan
3 China
4 Germany
5 France
6 Italy
7 Spain
8 Brazil
9 Canada
10 UK
PwC
€ in billion
3,4
5,8
18,0
5,7
11,2
10,1
12,0
14,5
17,8
51.9
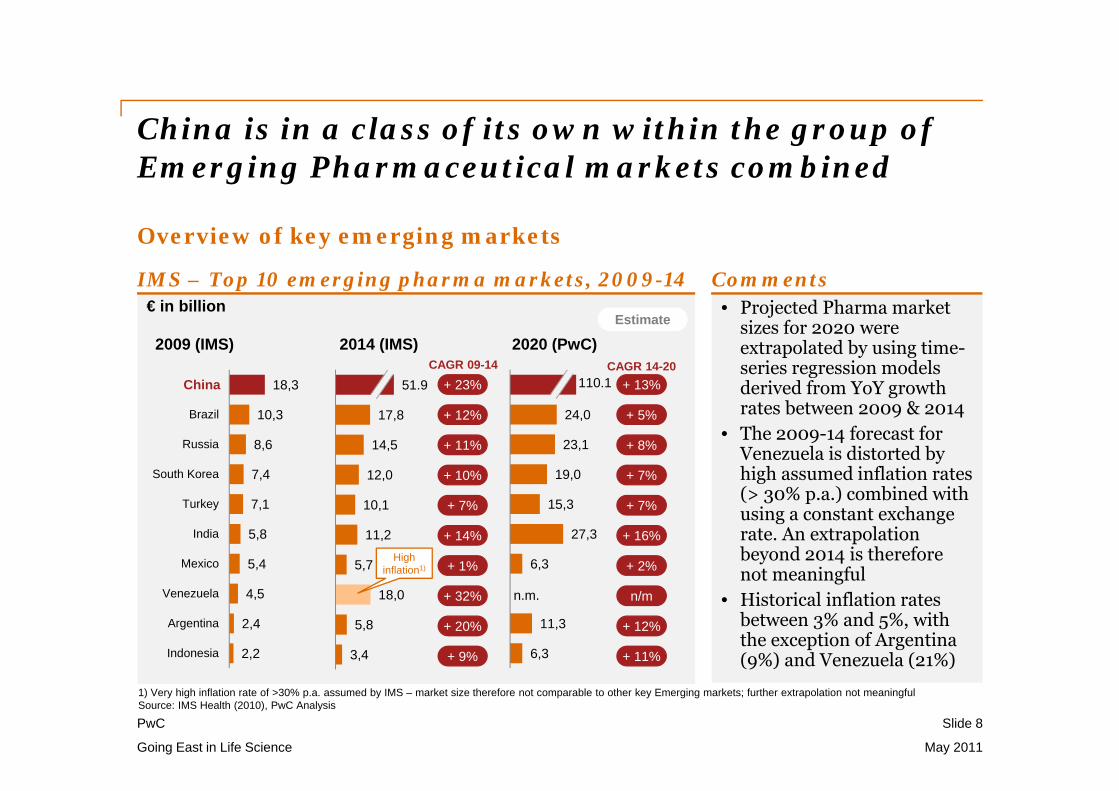
China is in a class of its own within the group of Emerging Pharmaceutical markets combined
Slide 8
Going East in Life Science May 2011
Overview of key emerging markets
IMS – Top 10 emerging pharma markets, 2009-14• Projected Pharma market
sizes for 2020 were extrapolated by using time-series regression models derived from YoY growth rates between 2009 & 2014
• The 2009-14 forecast for Venezuela is distorted by high assumed inflation rates (> 30% p.a.) combined with using a constant exchange rate. An extrapolation beyond 2014 is therefore not meaningful
• Historical inflation rates between 3% and 5%, with the exception of Argentina (9%) and Venezuela (21%)
Comments
1) Very high inflation rate of >30% p.a. assumed by IMS – market size therefore not comparable to other key Emerging markets; further extrapolation not meaningfulSource: IMS Health (2010), PwC Analysis
2,2
2,4
4,5
5,4
5,8
7,1
7,4
8,6
10,3
18,3
Indonesia
Argentina
Venezuela
Mexico
India
Turkey
South Korea
Russia
Brazil
China
6,3
11,3
6,3
27,3
15,3
19,0
23,1
24,0
110.1
+ 5%
+ 8%
+ 7%
+ 7%
+ 16%
+ 2%
n/m
+ 11%
+ 12%
+ 23%
+ 12%
+ 11%
+ 10%
+ 7%
+ 14%
+ 1%
+ 32%
+ 9%
+ 20%
High inflation1)
China
n.m.
110.1 + 13%
2009 (IMS) 2014 (IMS) 2020 (PwC)CAGR 14-20CAGR 09-14
Estimate
PwC
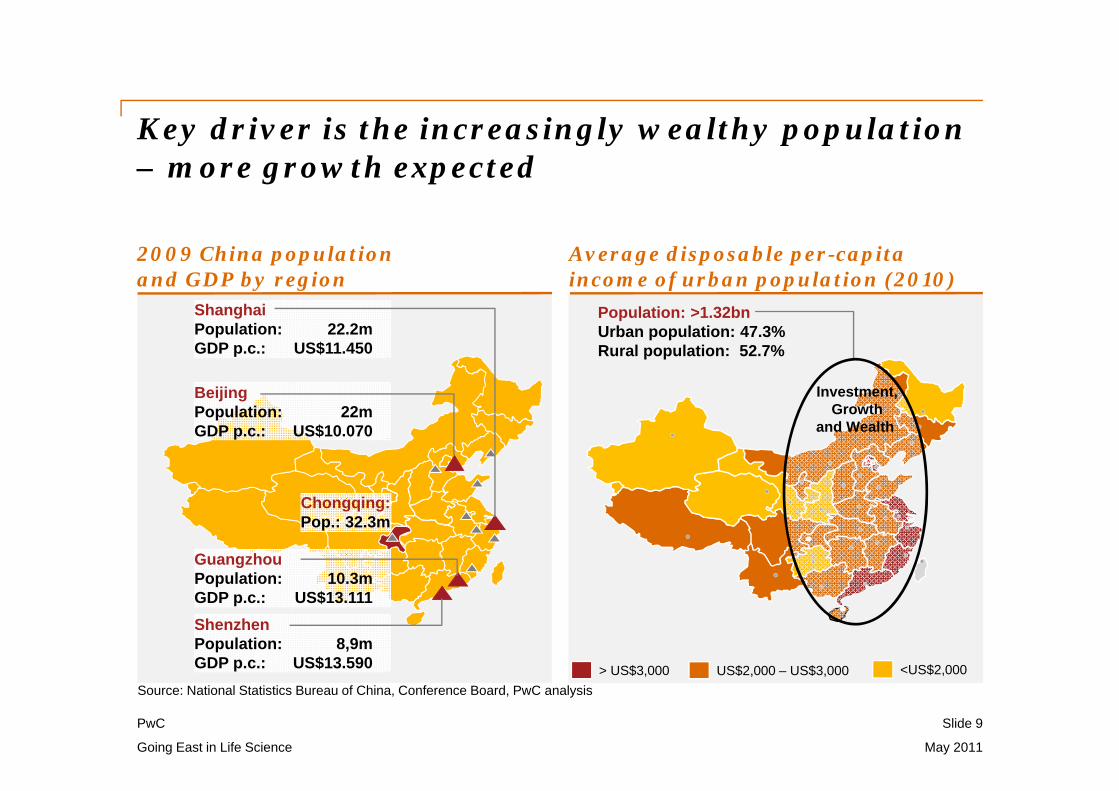
Key driver is the increasingly wealthy population – more growth expected
Slide 9
Going East in Life Science May 2011
2009 China populationand GDP by region
ShanghaiPopulation: 22.2mGDP p.c.: US$11.450
Chongqing:Pop.: 32.3m
Population: >1.32bnUrban population: 47.3%Rural population: 52.7%
> US$3,000 US$2,000 – US$3,000 <US$2,000Source: National Statistics Bureau of China, Conference Board, PwC analysis
GuangzhouPopulation: 10.3mGDP p.c.: US$13.111ShenzhenPopulation: 8,9mGDP p.c.: US$13.590
Investment,Growth
and Wealth
Average disposable per-capita income of urban population (2010)
BeijingPopulation: 22mGDP p.c.: US$10.070
PwC
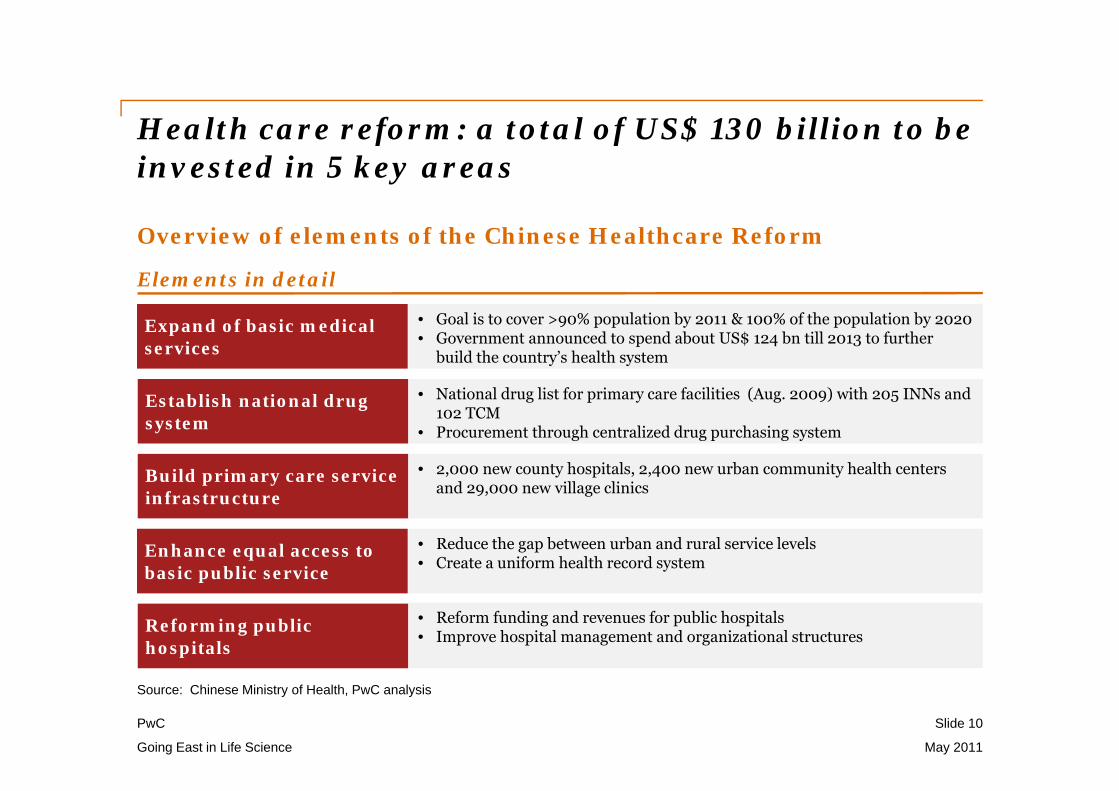
Health care reform: a total of US$ 130 billion to be invested in 5 key areas
Slide 10
Going East in Life Science May 2011
Overview of elements of the Chinese Healthcare Reform
Elements in detail
Expand of basic medical services
Establish national drug system
Build primary care service infrastructure
Enhance equal access to basic public service
Reforming public hospitals
• Goal is to cover >90% population by 2011 & 100% of the population by 2020• Government announced to spend about US$ 124 bn till 2013 to further
build the country’s health system
• National drug list for primary care facilities (Aug. 2009) with 205 INNs and 102 TCM
• Procurement through centralized drug purchasing system
• 2,000 new county hospitals, 2,400 new urban community health centers and 29,000 new village clinics
• Reduce the gap between urban and rural service levels• Create a uniform health record system
• Reform funding and revenues for public hospitals • Improve hospital management and organizational structures
Source: Chinese Ministry of Health, PwC analysis
PwC
19,835,8
64,32,6
5,9
13
9,3
15,0
22,5
2007 2010 2014
Pharma market is expected to continue its fantastic growth path
Slide 11
Going East in Life Science May 2011
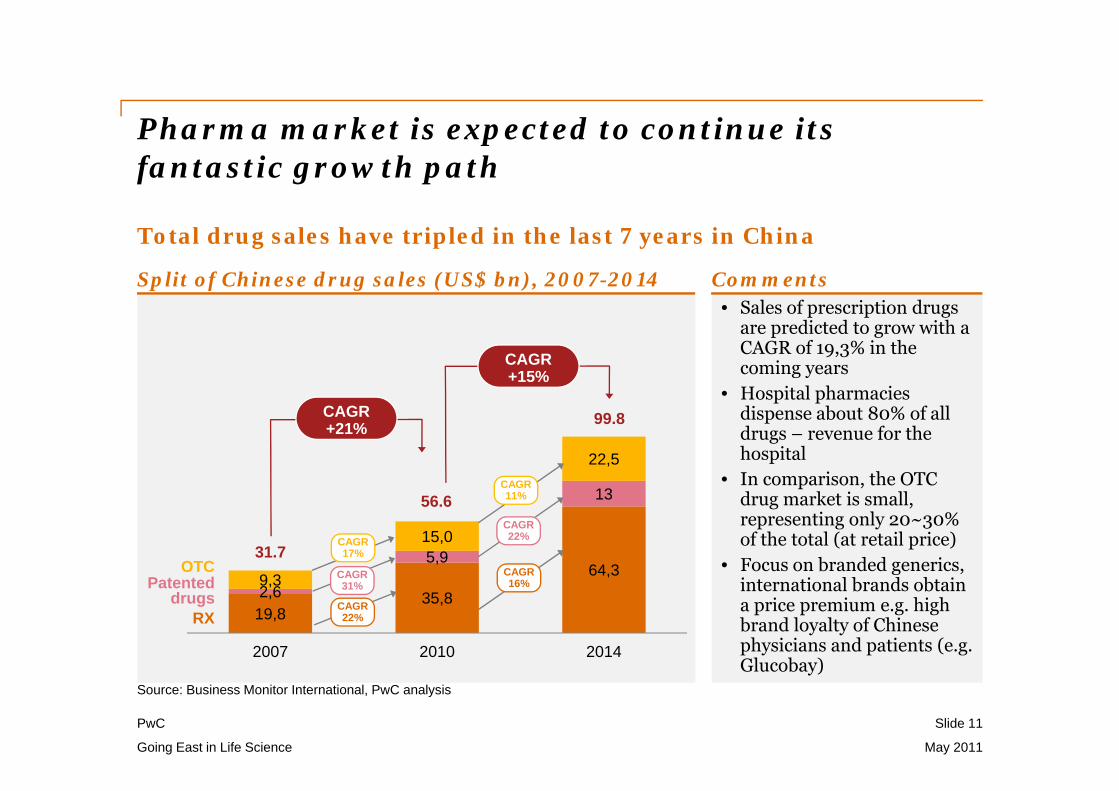
Total drug sales have tripled in the last 7 years in China
Source: Business Monitor International, PwC analysis
• Sales of prescription drugs are predicted to grow with a CAGR of 19,3% in the coming years
• Hospital pharmacies dispense about 80% of all drugs – revenue for the hospital
• In comparison, the OTC drug market is small, representing only 20~30% of the total (at retail price)
• Focus on branded generics, international brands obtain a price premium e.g. high brand loyalty of Chinese physicians and patients (e.g. Glucobay)
CommentsSplit of Chinese drug sales (US$ bn), 2007-2014
CAGR 31%
31.7
56.6
99.8
RX
OTCPatented
drugs
CAGR+21%
CAGR+15%
CAGR 22%
CAGR 17%
CAGR 22%
CAGR 16%
CAGR 11%
PwC
12,7%
4,4%
11,8%1,3%
27,1%
9,6%2,3%7,1%2,4%
21,3%
Market
Antibiotics still dominate the Chinese market, creating more than 25% of market value (2009)
Slide 12
Going East in Life Science May 2011
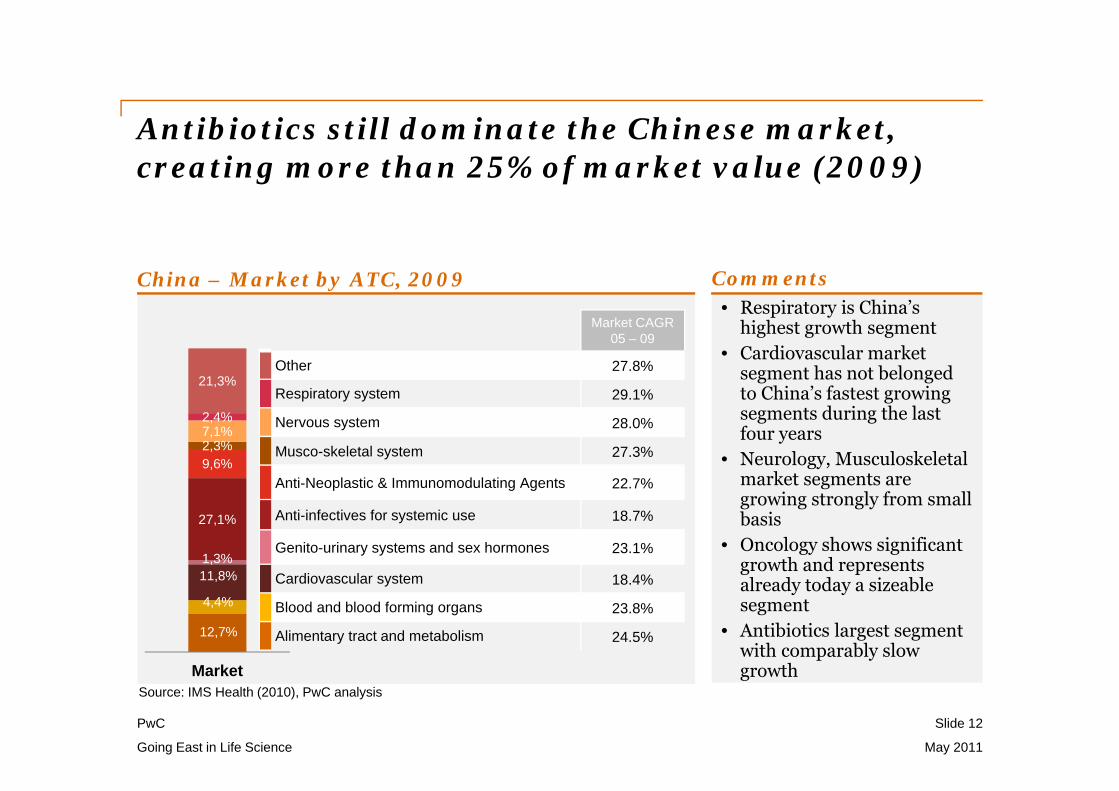
China – Market by ATC, 2009
Source: IMS Health (2010), PwC analysis
• Respiratory is China’s highest growth segment
• Cardiovascular market segment has not belonged to China’s fastest growing segments during the last four years
• Neurology, Musculoskeletal market segments are growing strongly from small basis
• Oncology shows significant growth and represents already today a sizeable segment
• Antibiotics largest segment with comparably slow growth
Comments
Market CAGR05 – 09
Other 27.8%
Respiratory system 29.1%
Nervous system 28.0%
Musco-skeletal system 27.3%
Anti-Neoplastic & Immunomodulating Agents 22.7%
Anti-infectives for systemic use 18.7%
Genito-urinary systems and sex hormones 23.1%
Cardiovascular system 18.4%
Blood and blood forming organs 23.8%
Alimentary tract and metabolism 24.5%
PwC
The pharma market is dominated by international companies
Slide 13
Going East in Life Science May 2011
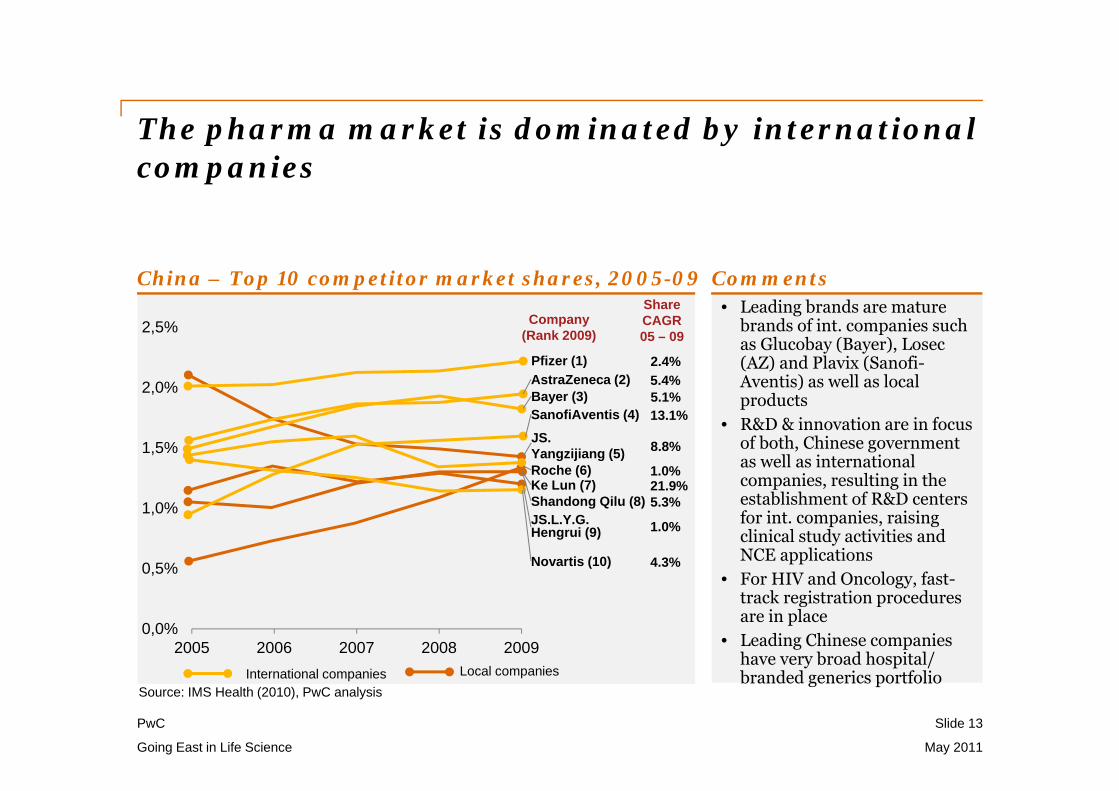
China – Top 10 competitor market shares, 2005-09
Source: IMS Health (2010), PwC analysis
• Leading brands are mature brands of int. companies such as Glucobay (Bayer), Losec(AZ) and Plavix (Sanofi-Aventis) as well as local products
• R&D & innovation are in focus of both, Chinese government as well as international companies, resulting in the establishment of R&D centers for int. companies, raising clinical study activities and NCE applications
• For HIV and Oncology, fast-track registration procedures are in place
• Leading Chinese companies have very broad hospital/ branded generics portfolio
Comments
0,0%
0,5%
1,0%
1,5%
2,0%
2,5%
2005 2006 2007 2008 2009
Pfizer (1)
Bayer (3)AstraZeneca (2)
SanofiAventis (4)JS. Yangzijiang (5)Roche (6)
Shandong Qilu (8)Ke Lun (7)
JS.L.Y.G. Hengrui (9)
Novartis (10)
Company(Rank 2009)
ShareCAGR05 – 09
2.4%
5.1%5.4%
13.1%
8.8%
1.0%
5.3%21.9%
1.0%
4.3%
Local companiesInternational companies
PwC
Overview of the investment trends in China along the Pharmaceutical Value Chain
14
PwC
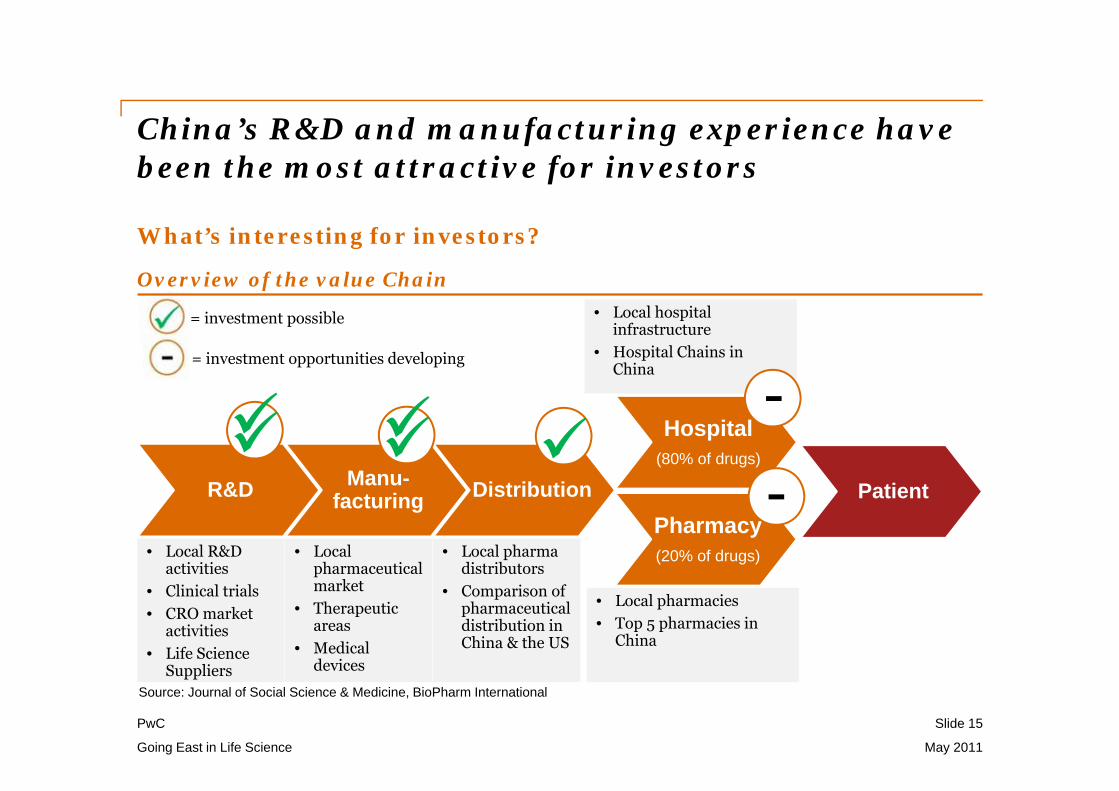
China’s R&D and manufacturing experience have been the most attractive for investors
Slide 15
Going East in Life Science May 2011
What’s interesting for investors?
Overview of the value Chain
Source: Journal of Social Science & Medicine, BioPharm International
R&D Manu-facturing Distribution
Hospital(80% of drugs)
PatientPharmacy(20% of drugs)• Local R&D
activities• Clinical trials• CRO market
activities• Life Science
Suppliers
• Local pharmaceutical market
• Therapeutic areas
• Medical devices
• Local pharma distributors
• Comparison of pharmaceutical distribution in China & the US
• Local hospital infrastructure
• Hospital Chains in China
• Local pharmacies• Top 5 pharmacies in
China
--
= investment possible
= investment opportunities developing
PwC
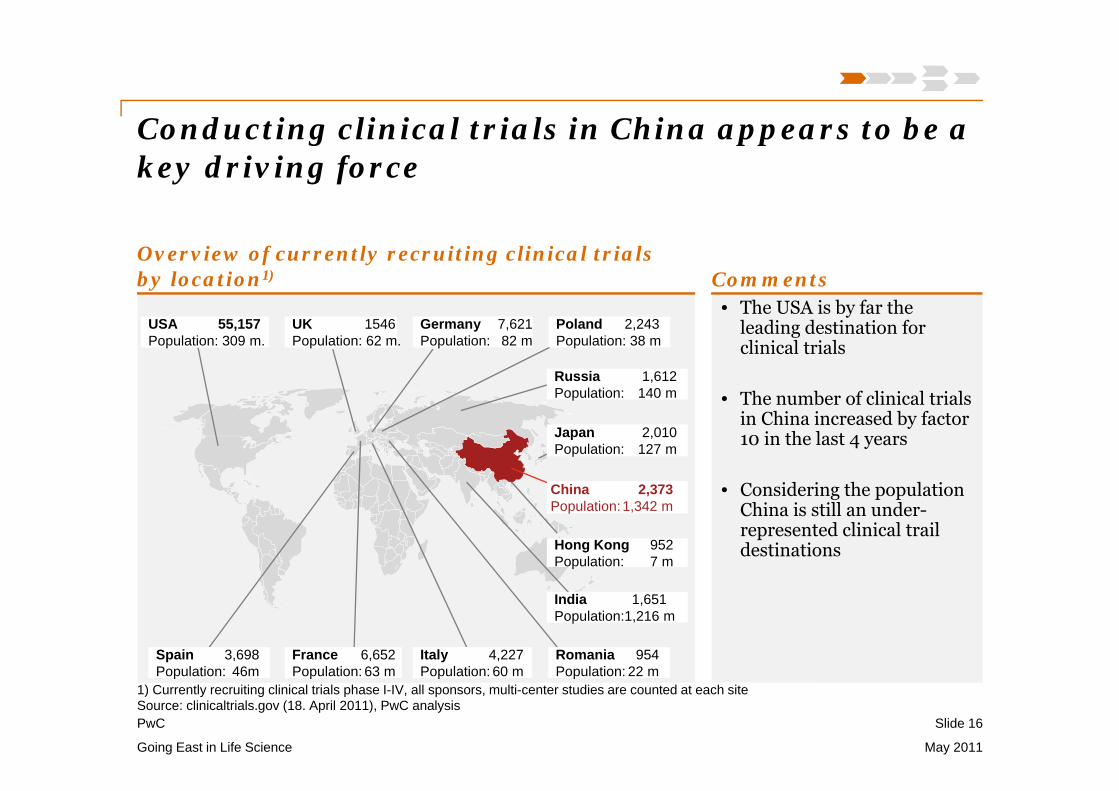
• The USA is by far the leading destination for clinical trials
• The number of clinical trials in China increased by factor 10 in the last 4 years
• Considering the population China is still an under-represented clinical trail destinations
Conducting clinical trials in China appears to be a key driving force
Slide 16
Going East in Life Science May 2011
Overview of currently recruiting clinical trials by location1)
Germany 7,621Population: 82 m
Poland 2,243Population: 38 m
Russia 1,612Population: 140 m
Japan 2,010Population: 127 m
China 2,373Population:1,342 m
Hong Kong 952Population: 7 m
India 1,651Population:1,216 m
Romania 954Population: 22 m
Italy 4,227Population: 60 m
Spain 3,698Population: 46m
France 6,652Population: 63 m
UK 1546Population: 62 m.
USA 55,157Population: 309 m.
Comments
1) Currently recruiting clinical trials phase I-IV, all sponsors, multi-center studies are counted at each siteSource: clinicaltrials.gov (18. April 2011), PwC analysis
PwC
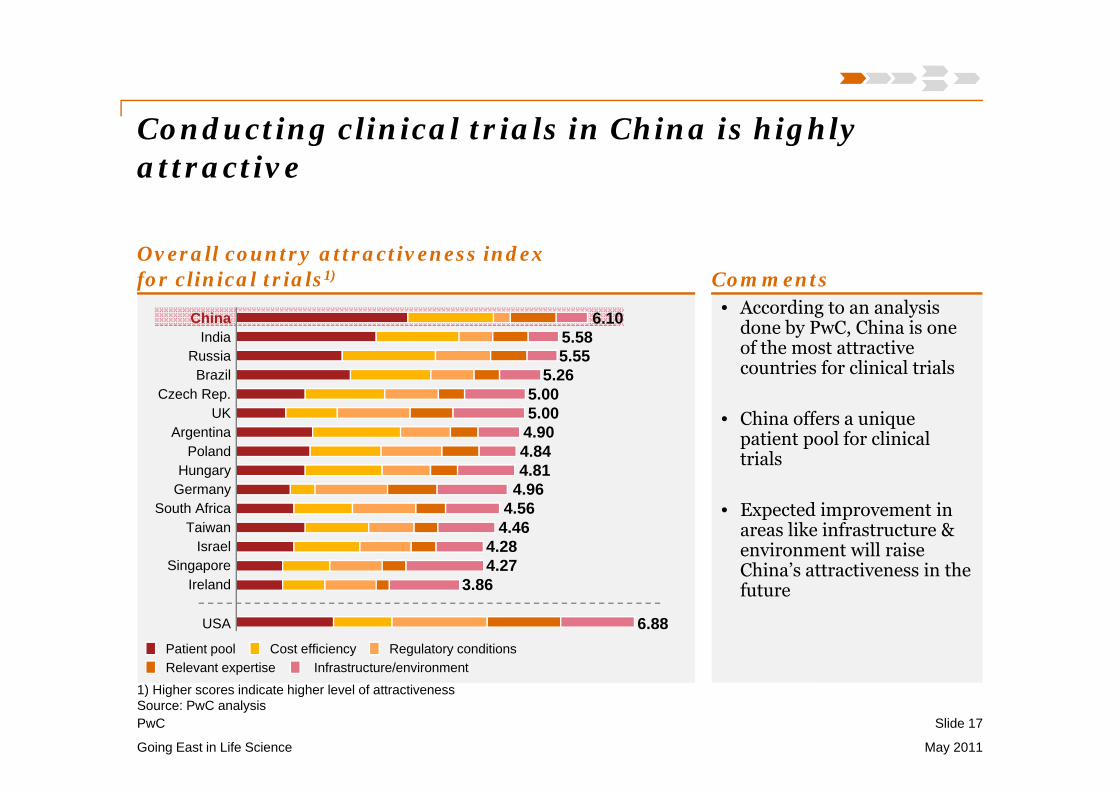
• According to an analysis done by PwC, China is one of the most attractive countries for clinical trials
• China offers a unique patient pool for clinical trials
• Expected improvement in areas like infrastructure & environment will raise China’s attractiveness in the future
Conducting clinical trials in China is highly attractive
Slide 17
Going East in Life Science May 2011
Overall country attractiveness indexfor clinical trials1) Comments
Patient pool Cost efficiency Regulatory conditionsRelevant expertise Infrastructure/environment
ChinaIndia
RussiaBrazil
Czech Rep.UK
ArgentinaPoland
HungaryGermany
South AfricaTaiwan
IsraelSingapore
Ireland
USA
6.105.585.55
5.265.005.00
4.904.844.81
4.964.56
4.464.284.27
3.86
6.88
1) Higher scores indicate higher level of attractivenessSource: PwC analysis
PwC
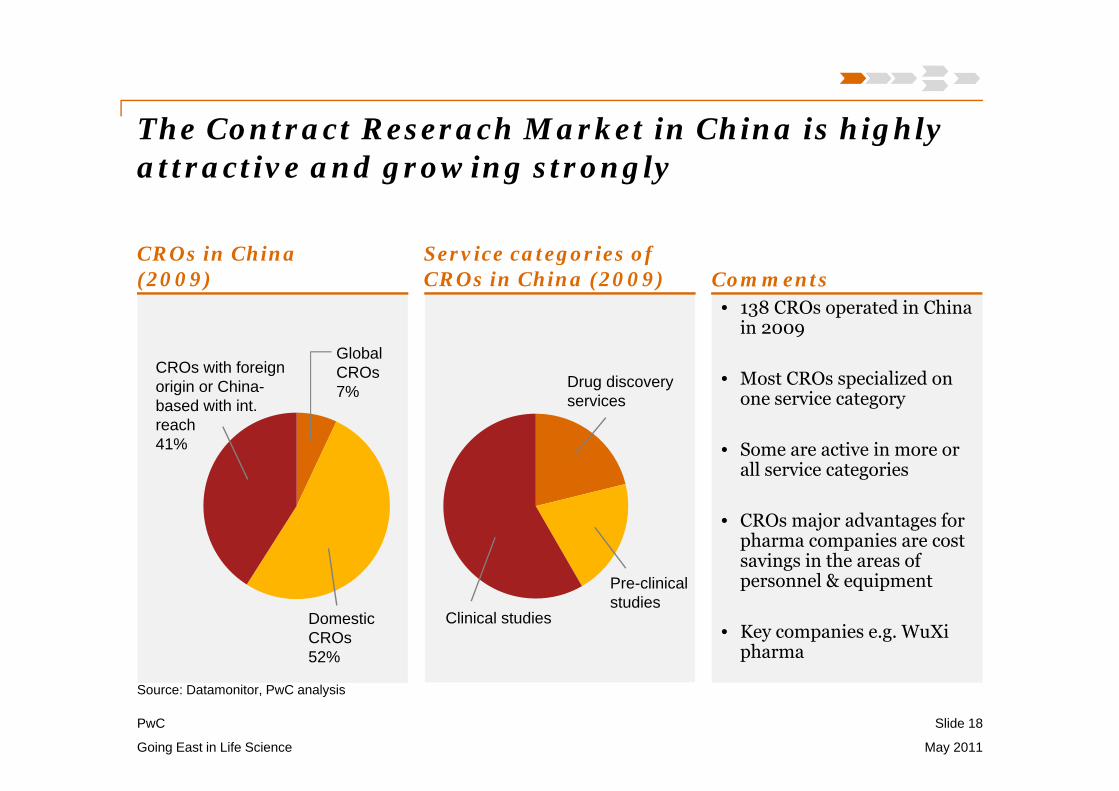
The Contract Reserach Market in China is highly attractive and growing strongly
Slide 18
Going East in Life Science May 2011
CROs in China(2009)
Source: Datamonitor, PwC analysis
• 138 CROs operated in China in 2009
• Most CROs specialized on one service category
• Some are active in more or all service categories
• CROs major advantages for pharma companies are cost savings in the areas of personnel & equipment
• Key companies e.g. WuXipharma
CommentsService categories of CROs in China (2009)
CROs with foreign origin or China-based with int. reach 41%
Drug discovery services
Domestic CROs 52%
Pre-clinical studies
Clinical studies
GlobalCROs7%

PwC
Multinational companies have located R&D activities to China
Slide 19
Going East in Life Science May 2011
R&D activities in China
• 10-year plan to establish research centre• Plans to employ over 1000 researchers at the
Shanghai research centre by 2017
• Spent >US$150m between 2005 and 2009• Consecutively moving research resources from
the USA to China
• Is planning to invest US$ .25b in R&D in China between 2009 and 2014
• Will employ 1000 R&D associates in China by 2014
• Built the first fully functional clinical drug R&D centre by a multinational in China (US$ 100m)
• Is planning to intensive its R&D activities in China continuing from 2011
• Opened a R&D headquarters in China in 2008• Estimates to spend US$100m on R&D in China
between 2008 and 2012
• Built a US$1oomn research centre in China in 2006
• Is in the process of constructing new R&D facilities in China at present
Source: Business Monitor International, China Daily, The Times, Datamonitor
PwC
The Chinese pharma market is still very fragmented potentially offering opportunities
May 2011Going East in Life Science
Slide 20
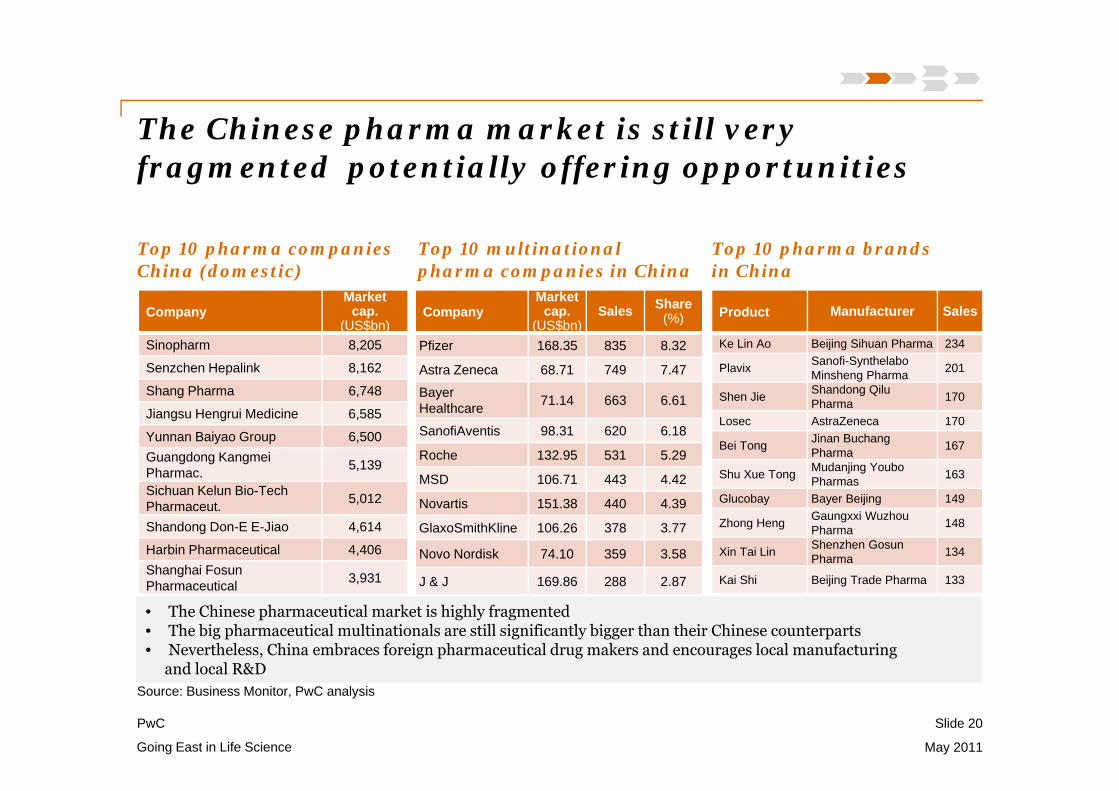
Top 10 pharma companiesChina (domestic)
Top 10 multinational pharma companies in China
Top 10 pharma brandsin China
Source: Business Monitor, PwC analysis
CompanyMarket
cap. (US$bn)
Sales Share(%)
Pfizer 168.35 835 8.32
Astra Zeneca 68.71 749 7.47
Bayer Healthcare 71.14 663 6.61
SanofiAventis 98.31 620 6.18
Roche 132.95 531 5.29
MSD 106.71 443 4.42
Novartis 151.38 440 4.39
GlaxoSmithKline 106.26 378 3.77
Novo Nordisk 74.10 359 3.58
J & J 169.86 288 2.87
Product Manufacturer Sales
Ke Lin Ao Beijing Sihuan Pharma 234
Plavix Sanofi-SynthelaboMinsheng Pharma 201
Shen Jie Shandong QiluPharma 170
Losec AstraZeneca 170
Bei Tong Jinan BuchangPharma 167
Shu Xue Tong Mudanjing YouboPharmas 163
Glucobay Bayer Beijing 149
Zhong Heng Gaungxxi WuzhouPharma 148
Xin Tai Lin Shenzhen GosunPharma 134
Kai Shi Beijing Trade Pharma 133
• The Chinese pharmaceutical market is highly fragmented• The big pharmaceutical multinationals are still significantly bigger than their Chinese counterparts• Nevertheless, China embraces foreign pharmaceutical drug makers and encourages local manufacturing
and local R&D
CompanyMarket
cap. (US$bn)
Sinopharm 8,205
Senzchen Hepalink 8,162
Shang Pharma 6,748
Jiangsu Hengrui Medicine 6,585
Yunnan Baiyao Group 6,500Guangdong KangmeiPharmac. 5,139
Sichuan Kelun Bio-Tech Pharmaceut. 5,012
Shandong Don-E E-Jiao 4,614
Harbin Pharmaceutical 4,406Shanghai FosunPharmaceutical 3,931
PwC
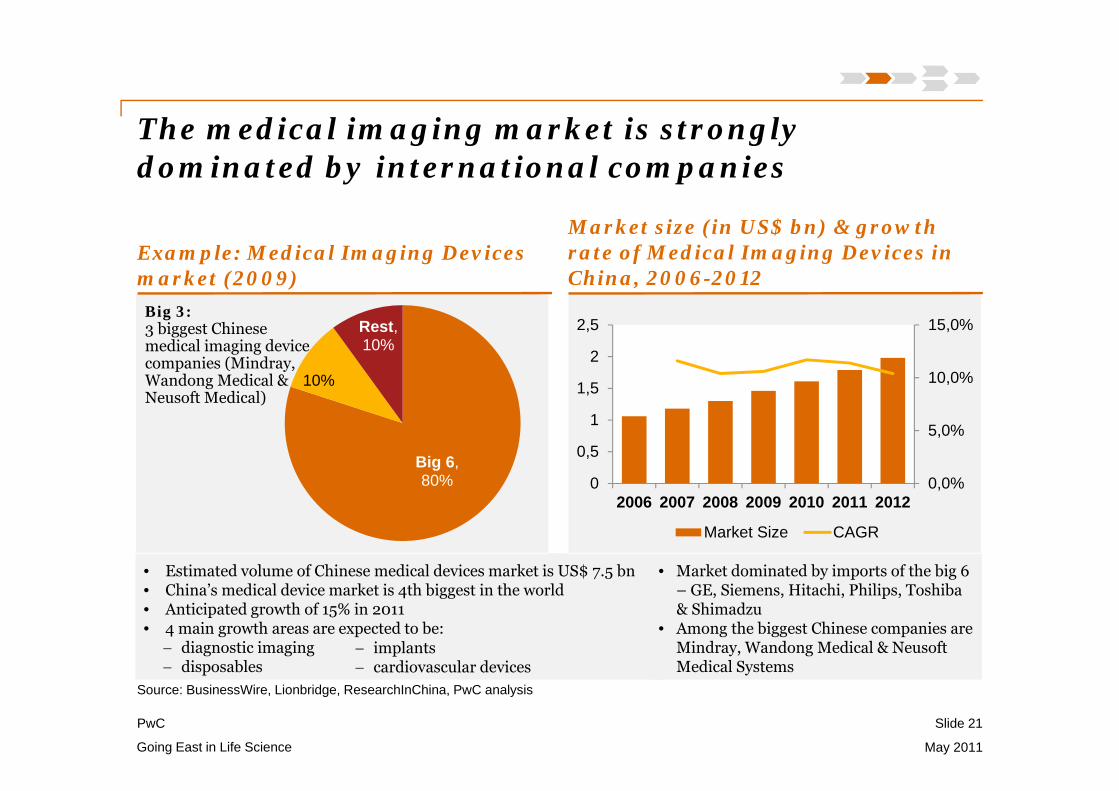
• Estimated volume of Chinese medical devices market is US$ 7.5 bn• China’s medical device market is 4th biggest in the world• Anticipated growth of 15% in 2011• 4 main growth areas are expected to be:
diagnostic imaging disposables
implants cardiovascular devices
• Market dominated by imports of the big 6 – GE, Siemens, Hitachi, Philips, Toshiba & Shimadzu
• Among the biggest Chinese companies are Mindray, Wandong Medical & NeusoftMedical Systems
Big 6, 80%
10%
Rest, 10%
The medical imaging market is stronglydominated by international companies
May 2011Going East in Life Science
Slide 21
Source: BusinessWire, Lionbridge, ResearchInChina, PwC analysis
0,0%
5,0%
10,0%
15,0%
0
0,5
1
1,5
2
2,5
2006 2007 2008 2009 2010 2011 2012
Market Size CAGR
Big 3:3 biggest Chinese medical imaging device companies (Mindray, Wandong Medical & Neusoft Medical)
Example: Medical Imaging Devices market (2009)
Market size (in US$ bn) & growth rate of Medical Imaging Devices in China, 2006-2012
PwC
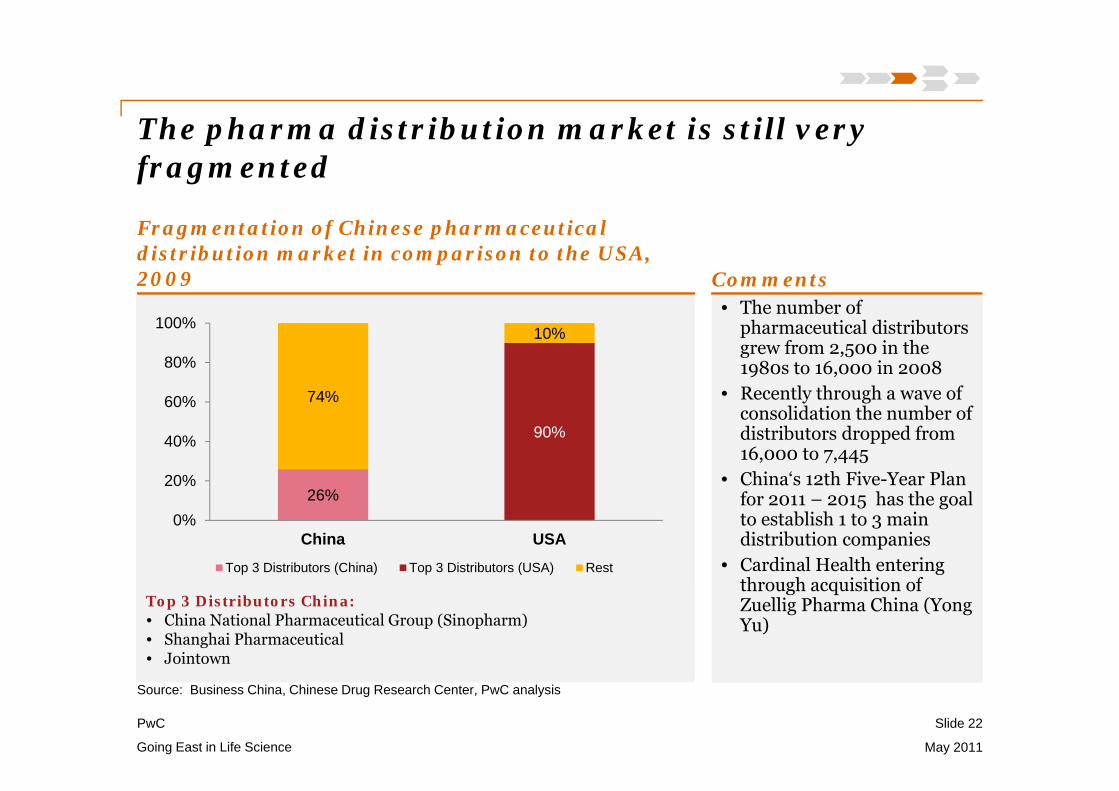
The pharma distribution market is still very fragmented
May 2011Going East in Life Science
Slide 22
Top 3 Distributors China:• China National Pharmaceutical Group (Sinopharm)• Shanghai Pharmaceutical• Jointown
26%
90%
74%
10%
0%
20%
40%
60%
80%
100%
China USATop 3 Distributors (China) Top 3 Distributors (USA) Rest
Source: Business China, Chinese Drug Research Center, PwC analysis
• The number of pharmaceutical distributors grew from 2,500 in the 1980s to 16,000 in 2008
• Recently through a wave of consolidation the number of distributors dropped from 16,000 to 7,445
• China‘s 12th Five-Year Plan for 2011 – 2015 has the goal to establish 1 to 3 main distribution companies
• Cardinal Health entering through acquisition of Zuellig Pharma China (Yong Yu)
Comments
Fragmentation of Chinese pharmaceutical distribution market in comparison to the USA, 2009
PwC
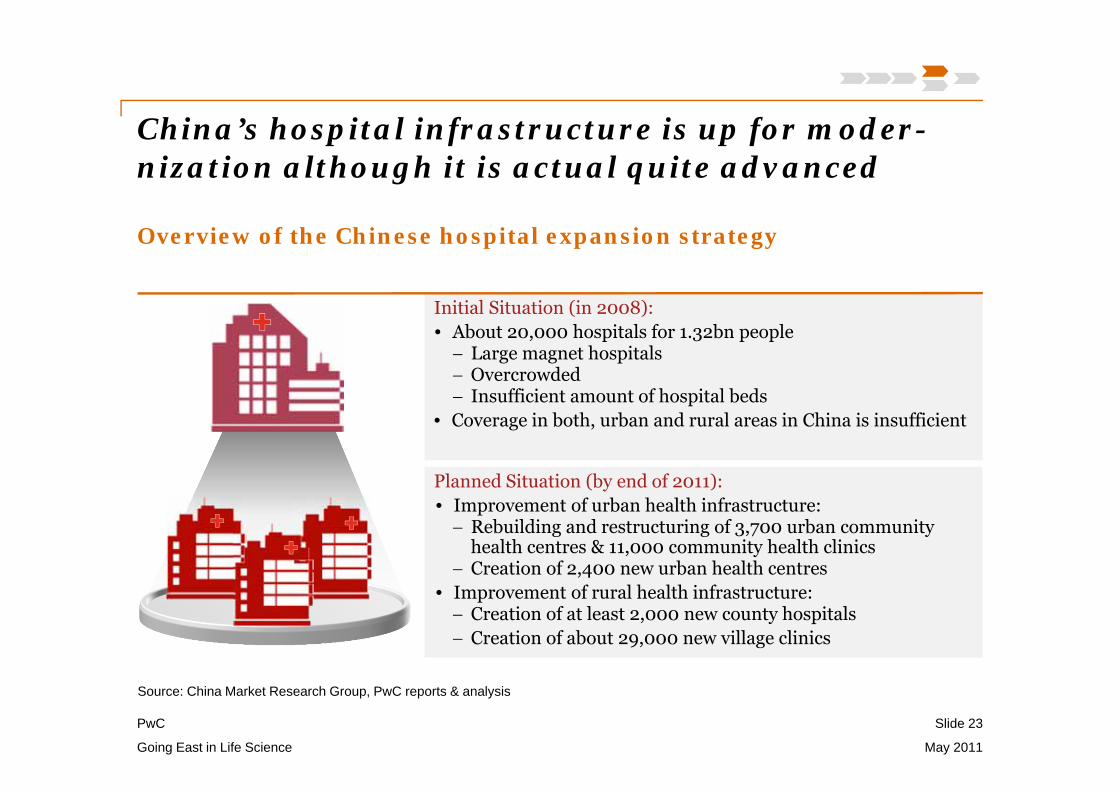
China’s hospital infrastructure is up for moder-nization although it is actual quite advanced
Slide 23
Going East in Life Science May 2011
Overview of the Chinese hospital expansion strategy
Initial Situation (in 2008):• About 20,000 hospitals for 1.32bn people Large magnet hospitals Overcrowded Insufficient amount of hospital beds
• Coverage in both, urban and rural areas in China is insufficient
Planned Situation (by end of 2011):• Improvement of urban health infrastructure: Rebuilding and restructuring of 3,700 urban community
health centres & 11,000 community health clinics Creation of 2,400 new urban health centres
• Improvement of rural health infrastructure: Creation of at least 2,000 new county hospitals Creation of about 29,000 new village clinics
Source: China Market Research Group, PwC reports & analysis
PwC
Overview Hospitals in China
May 2011Going East in Life Science
Slide 24
Source: Chinese Ministry of Health, China Statistics, PwC analysis
• Over 16,000 large public non-profit hospitals- management view:◦ less sophisticated in management systems◦ weak organizational structure◦ simple financial management◦ limited planning & organizational control◦ government subsidies only cover <10% of total expenses
Not yet true corporate bodies with self-controlling& self-stimulating mechanisms
• Supplemented by approx. 4,000 smaller private for-profit hospitals foreign investor able to hold 70% of joint-venture (regulation in 2000)
• Average joint-venture hospital in China <50 beds
PwC
Pharmacy chain are an interesting target as drug purchases will move from hospital to retail
Slide 25
Going East in Life Science May 2011
Overview Pharmacies in China
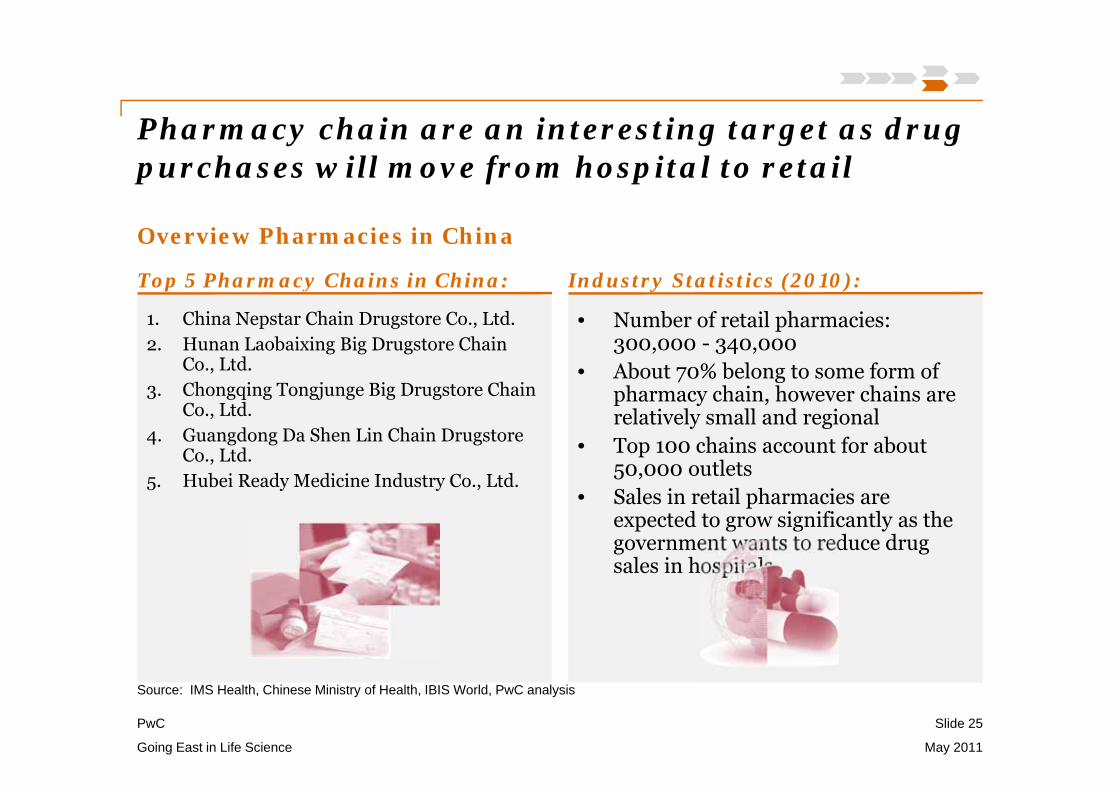
Top 5 Pharmacy Chains in China:
1. China Nepstar Chain Drugstore Co., Ltd.2. Hunan Laobaixing Big Drugstore Chain
Co., Ltd.3. Chongqing Tongjunge Big Drugstore Chain
Co., Ltd.4. Guangdong Da Shen Lin Chain Drugstore
Co., Ltd.5. Hubei Ready Medicine Industry Co., Ltd.
• Number of retail pharmacies: 300,000 - 340,000
• About 70% belong to some form of pharmacy chain, however chains are relatively small and regional
• Top 100 chains account for about 50,000 outlets
• Sales in retail pharmacies are expected to grow significantly as the government wants to reduce drug sales in hospitals
Source: IMS Health, Chinese Ministry of Health, IBIS World, PwC analysis
Industry Statistics (2010):
PwC
Overview of Chinese Life Science M&A
26
PwC
78
77
101
92
118
153
191151
228
214
85
101
124
129
137
181128
197
268
310
Financial Services
Healthcare
Consumer Staples
Consumer Products andServices
Energy and Power
High Technology
Conglomerate
Real Estate
Industrials
Materials
1H '10 1H'09
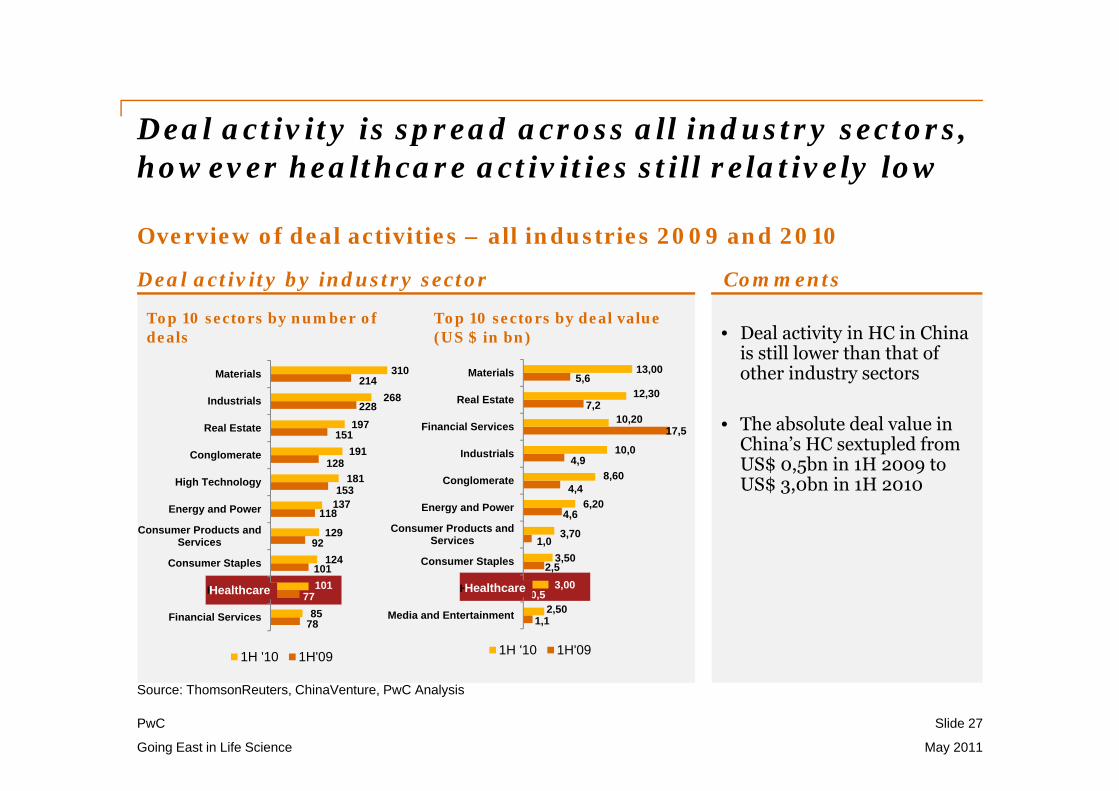
Deal activity is spread across all industry sectors, however healthcare activities still relatively low
Slide 27
Going East in Life Science May 2011
Overview of deal activities – all industries 2009 and 2010
Deal activity by industry sector
Top 10 sectors by number of deals
Top 10 sectors by deal value (US $ in bn)
Source: ThomsonReuters, ChinaVenture, PwC Analysis
• Deal activity in HC in China is still lower than that of other industry sectors
• The absolute deal value in China’s HC sextupled from US$ 0,5bn in 1H 2009 to US$ 3,0bn in 1H 2010
Comments
1,1
0,5
2,5
1,0
4,6
4,4
4,9
17,5
7,2
5,6
2,50
3,00
3,50
3,70
6,20
8,60
10,0
10,20
12,30
13,00
Media and Entertainment
Healthcare
Consumer Staples
Consumer Products andServices
Energy and Power
Conglomerate
Industrials
Financial Services
Real Estate
Materials
1H '10 1H'09
Healthcare Healthcare
PwC
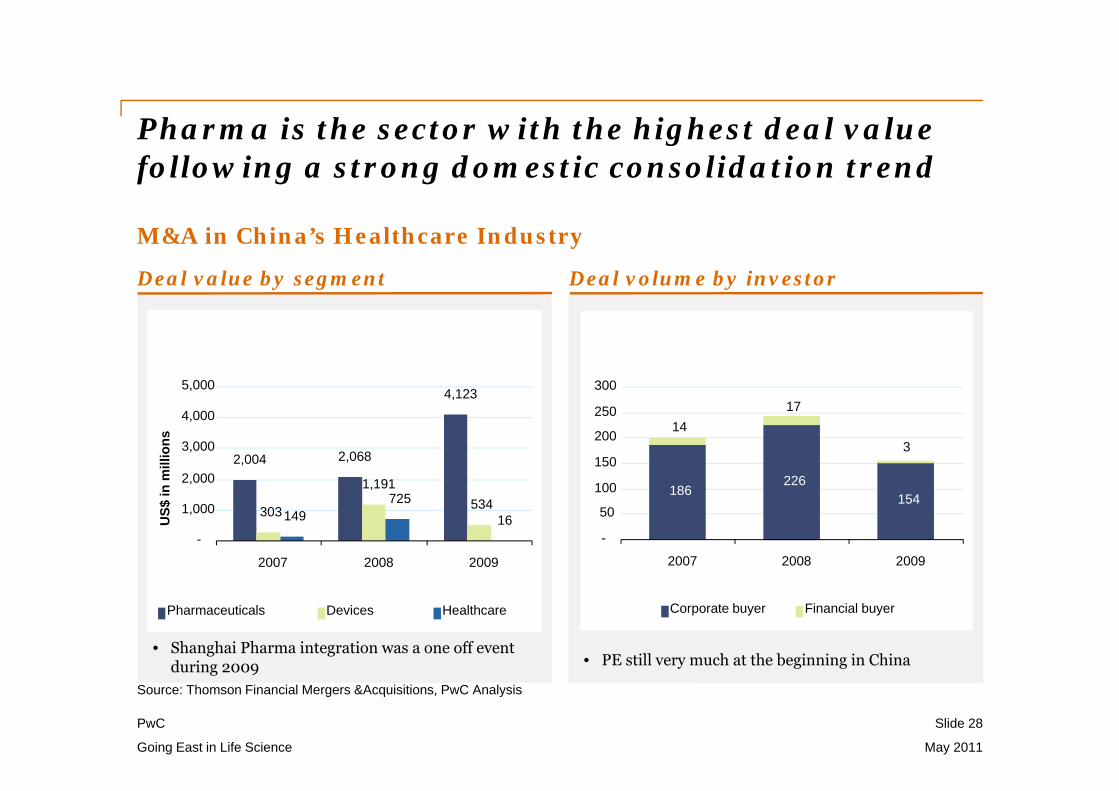
Pharma is the sector with the highest deal value following a strong domestic consolidation trend
Slide 28
Going East in Life Science May 2011
Deal value by segment Deal volume by investor
• PE still very much at the beginning in China • Shanghai Pharma integration was a one off event
during 2009 Source: Thomson Financial Mergers &Acquisitions, PwC Analysis
2,004 2,068
4,123
303
1,191534
149725
16-
1,000
2,000
3,000
4,000
5,000
2007 2008 2009
US$
in m
illio
ns
Pharmaceuticals Devices Healthcare
186226
154
1417
3
-
50
100
150
200
250
300
2007 2008 2009
Corporate buyer Financial buyer
M&A in China’s Healthcare Industry
PwC
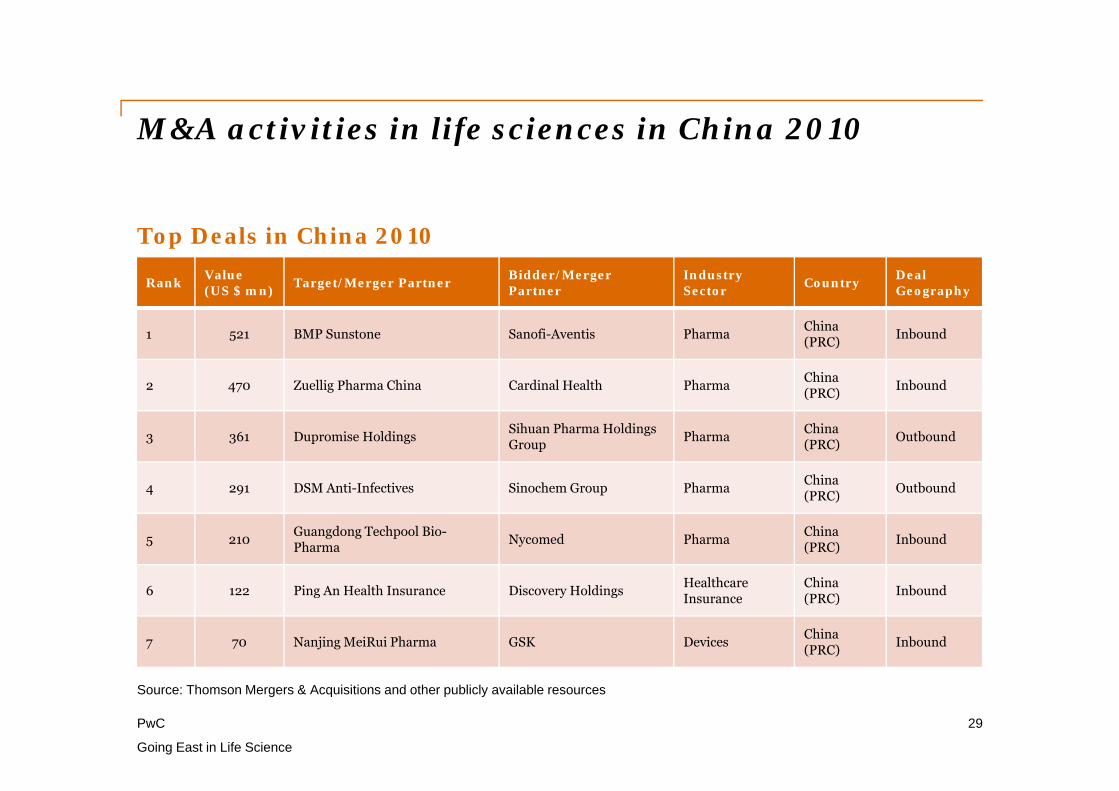
M&A activities in life sciences in China 2010
29
Going East in Life Science
Rank Value (US $ mn) Target/Merger Partner Bidder/Merger
PartnerIndustrySector Country Deal
Geography
1 521 BMP Sunstone Sanofi-Aventis Pharma China (PRC) Inbound
2 470 Zuellig Pharma China Cardinal Health Pharma China (PRC) Inbound
3 361 Dupromise Holdings Sihuan Pharma Holdings Group Pharma China
(PRC) Outbound
4 291 DSM Anti-Infectives Sinochem Group Pharma China (PRC) Outbound
5 210 Guangdong Techpool Bio-Pharma Nycomed Pharma China
(PRC) Inbound
6 122 Ping An Health Insurance Discovery Holdings HealthcareInsurance
China (PRC) Inbound
7 70 Nanjing MeiRui Pharma GSK Devices China (PRC) Inbound
Source: Thomson Mergers & Acquisitions and other publicly available resources
Top Deals in China 2010
PwC
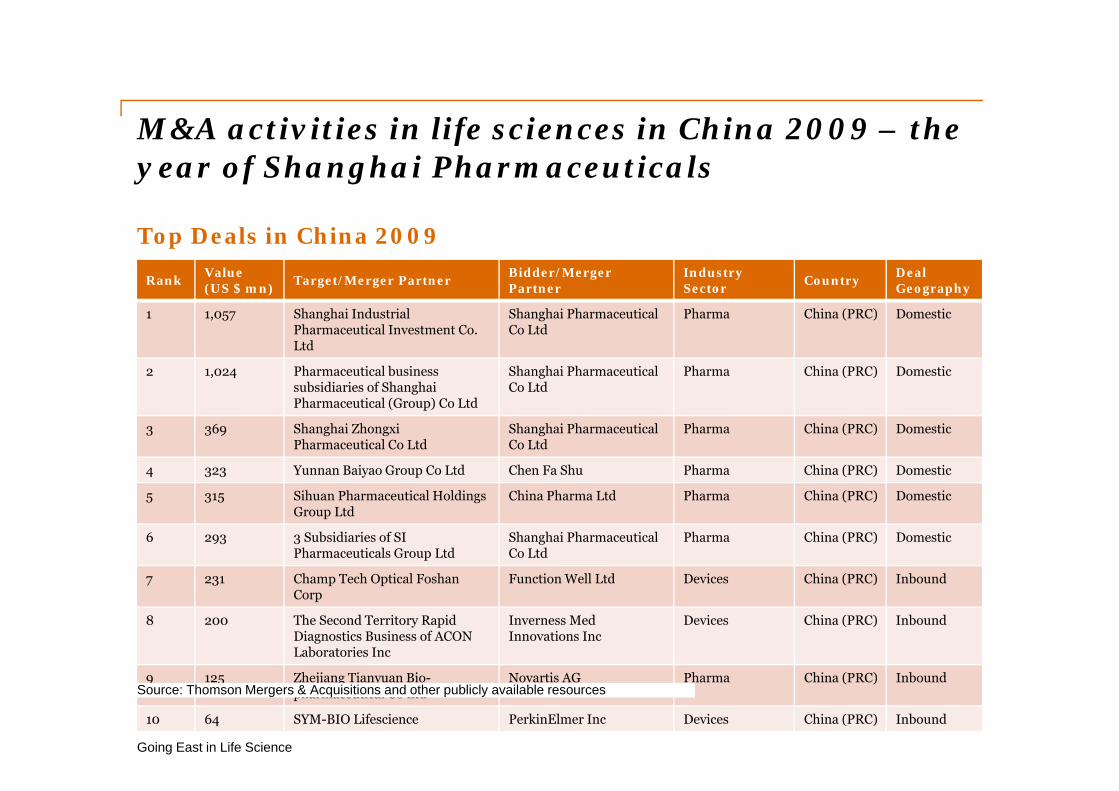
M&A activities in life sciences in China 2009 – the year of Shanghai Pharmaceuticals
30
Going East in Life Science
Rank Value (US $ mn) Target/Merger Partner Bidder/Merger
PartnerIndustrySector Country Deal
Geography
1 1,057 Shanghai Industrial Pharmaceutical Investment Co. Ltd
Shanghai Pharmaceutical Co Ltd
Pharma China (PRC) Domestic
2 1,024 Pharmaceutical business subsidiaries of Shanghai Pharmaceutical (Group) Co Ltd
Shanghai Pharmaceutical Co Ltd
Pharma China (PRC) Domestic
3 369 Shanghai ZhongxiPharmaceutical Co Ltd
Shanghai Pharmaceutical Co Ltd
Pharma China (PRC) Domestic
4 323 Yunnan Baiyao Group Co Ltd Chen Fa Shu Pharma China (PRC) Domestic
5 315 Sihuan Pharmaceutical Holdings Group Ltd
China Pharma Ltd Pharma China (PRC) Domestic
6 293 3 Subsidiaries of SI Pharmaceuticals Group Ltd
Shanghai Pharmaceutical Co Ltd
Pharma China (PRC) Domestic
7 231 Champ Tech Optical FoshanCorp
Function Well Ltd Devices China (PRC) Inbound
8 200 The Second Territory Rapid Diagnostics Business of ACON Laboratories Inc
Inverness Med Innovations Inc
Devices China (PRC) Inbound
9 125 Zhejiang Tianyuan Bio-pharmaceutical Co Ltd
Novartis AG Pharma China (PRC) Inbound
10 64 SYM-BIO Lifescience PerkinElmer Inc Devices China (PRC) Inbound
Source: Thomson Mergers & Acquisitions and other publicly available resources
Top Deals in China 2009
PwC
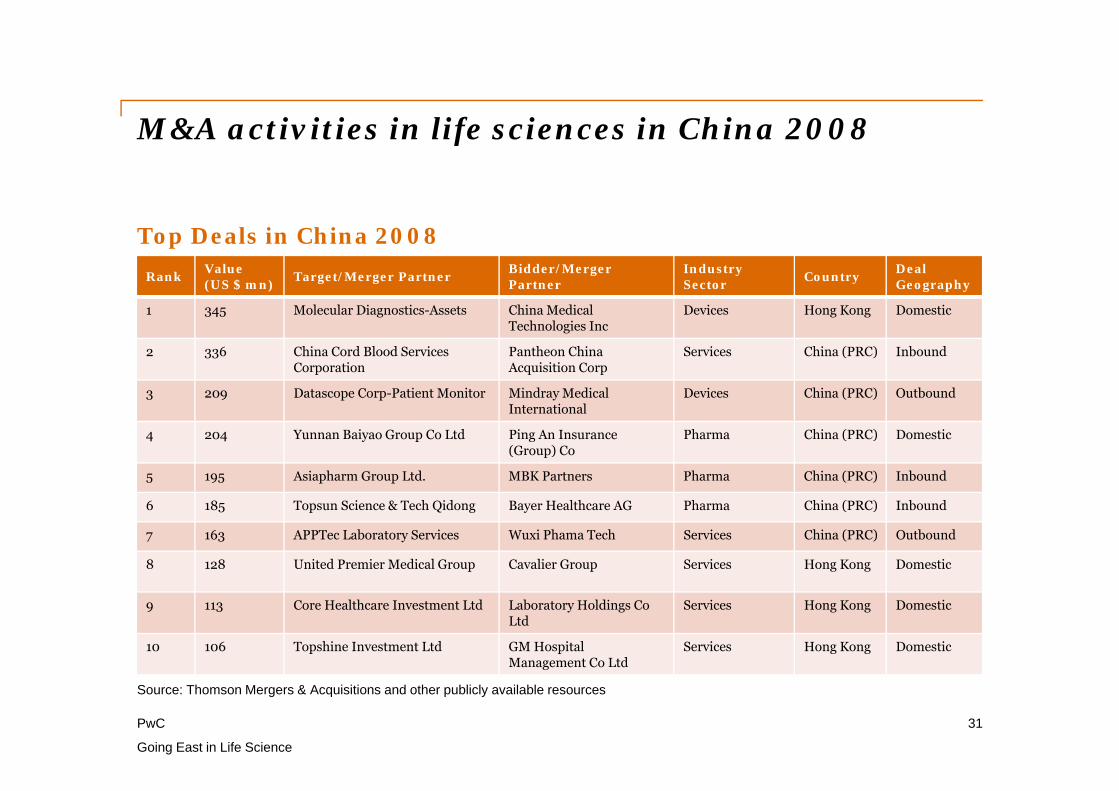
M&A activities in life sciences in China 2008
31
Going East in Life Science
Rank Value (US $ mn) Target/Merger Partner Bidder/Merger
PartnerIndustrySector Country Deal
Geography
1 345 Molecular Diagnostics-Assets China Medical Technologies Inc
Devices Hong Kong Domestic
2 336 China Cord Blood Services Corporation
Pantheon China Acquisition Corp
Services China (PRC) Inbound
3 209 Datascope Corp-Patient Monitor Mindray Medical International
Devices China (PRC) Outbound
4 204 Yunnan Baiyao Group Co Ltd Ping An Insurance (Group) Co
Pharma China (PRC) Domestic
5 195 Asiapharm Group Ltd. MBK Partners Pharma China (PRC) Inbound
6 185 Topsun Science & Tech Qidong Bayer Healthcare AG Pharma China (PRC) Inbound
7 163 APPTec Laboratory Services Wuxi Phama Tech Services China (PRC) Outbound
8 128 United Premier Medical Group Cavalier Group Services Hong Kong Domestic
9 113 Core Healthcare Investment Ltd Laboratory Holdings Co Ltd
Services Hong Kong Domestic
10 106 Topshine Investment Ltd GM Hospital Management Co Ltd
Services Hong Kong Domestic
Source: Thomson Mergers & Acquisitions and other publicly available resources
Top Deals in China 2008
PwC
M&A activities in life sciences in China 2011
Slide 32
Going East in Life Science May 2011
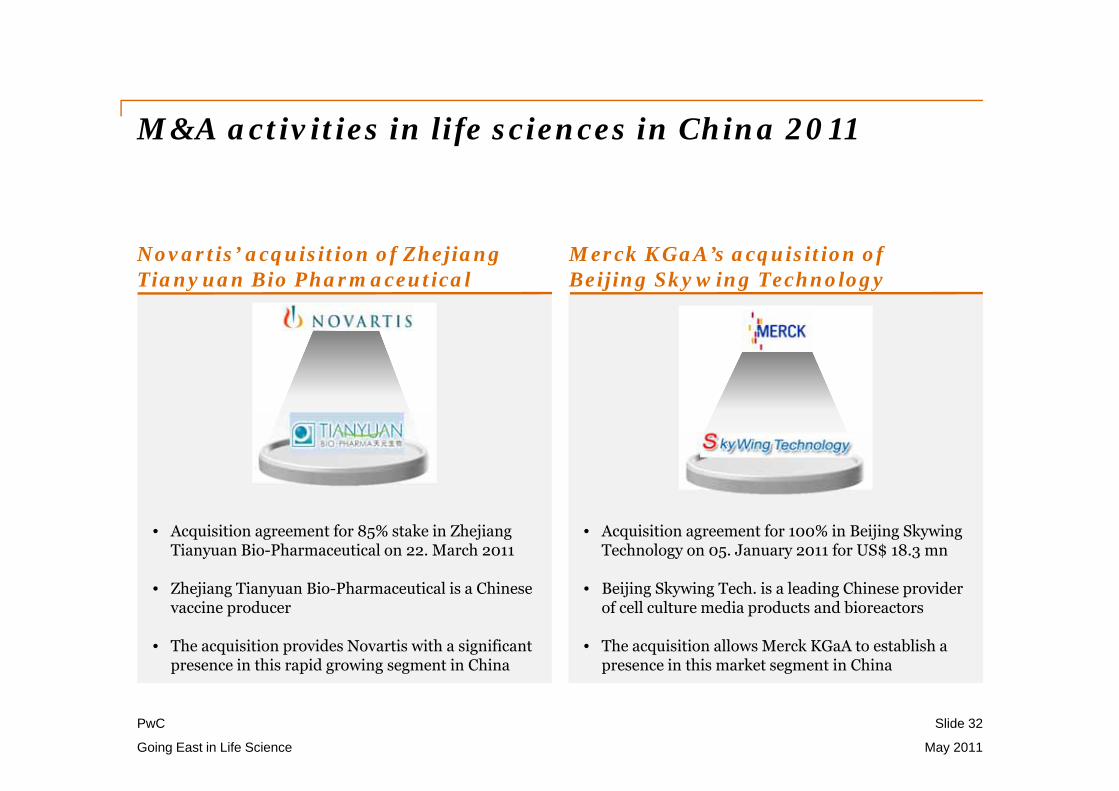
Novartis’ acquisition of Zhejiang Tianyuan Bio Pharmaceutical
Merck KGaA’s acquisition of Beijing Skywing Technology
• Acquisition agreement for 100% in Beijing SkywingTechnology on 05. January 2011 for US$ 18.3 mn
• Beijing Skywing Tech. is a leading Chinese provider of cell culture media products and bioreactors
• The acquisition allows Merck KGaA to establish a presence in this market segment in China
• Acquisition agreement for 85% stake in Zhejiang Tianyuan Bio-Pharmaceutical on 22. March 2011
• Zhejiang Tianyuan Bio-Pharmaceutical is a Chinese vaccine producer
• The acquisition provides Novartis with a significant presence in this rapid growing segment in China
Questions?