Embed Size (px)
Citation preview

Going Deep: The Juno Going Deep: The Juno Mission to JupiterMission to Jupiter
Michael JanssenMichael Janssen
Research ColloquiumResearch Colloquium
University of IdahoUniversity of Idaho
Department of Electrical & Computer EngineeringDepartment of Electrical & Computer Engineering
5 April 20075 April 2007

Outline
• Juno Mission
• The Juno Microwave Radiometer Experiment

Juno
• Juno is a new mission to Jupiter– 1st competed New Frontiers Mission May 2005
Juno Selected
August 2011Launch
October 2013Earth Flyby
October 2016Jupiter Arrival
October 2017Mission End
2017-2018Data Analysis
Mission Timeline:
Jan 2006Phase B start
Website: http://www.juno.wisc.edu/
August
• Experiments:– Gravity Science Experiment
• Doppler tracking– Magnetic Field Investigation
• Magnetometers & star camera– Microwave Radiometer (MWR)
• 6 Frequencies 0.6 - 23 GHz– Polar Magnetospheric Suite
• 5 Instruments– Junocam, optical camera for EPO
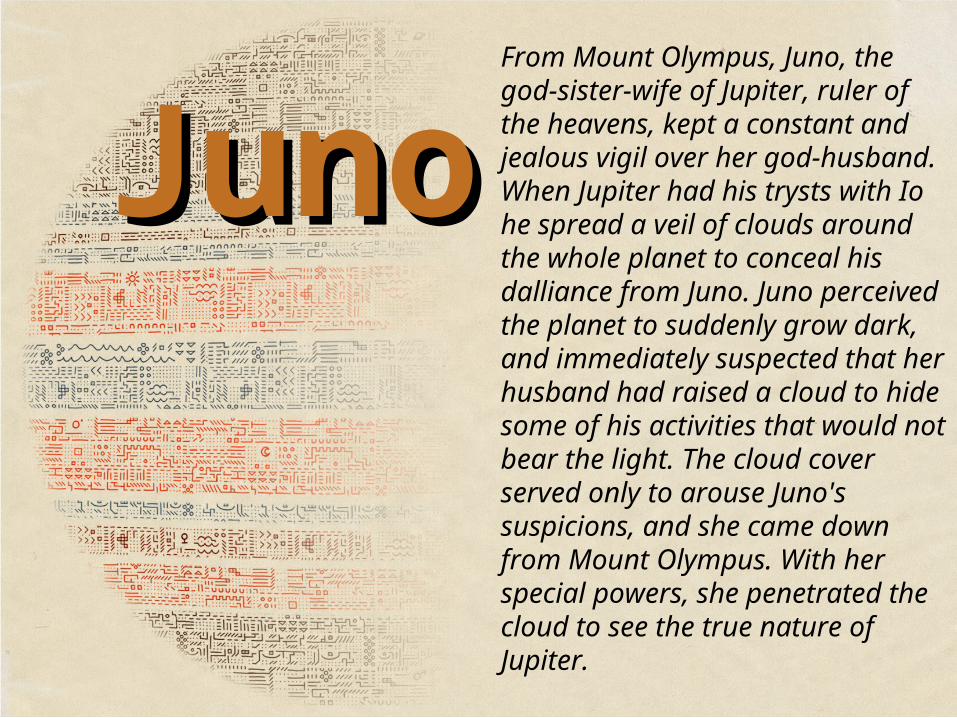
JunoJunoFrom Mount Olympus, Juno, the god-sister-wife of Jupiter, ruler of the heavens, kept a constant and jealous vigil over her god-husband. When Jupiter had his trysts with Io he spread a veil of clouds around the whole planet to conceal his dalliance from Juno. Juno perceived the planet to suddenly grow dark, and immediately suspected that her husband had raised a cloud to hide some of his activities that would not bear the light. The cloud cover served only to arouse Juno's suspicions, and she came down from Mount Olympus. With her special powers, she penetrated the cloud to see the true nature of Jupiter.

Science Team PI Scott Bolton, SWRI
Interior
Atmosphere
Magnetosphere
Mike Allison Andrew IngersollJohn Anderson Michael JanssenSushil Atreya Michael KleinFran Bagenal William KurthMichel Blanc Steve LevinJeremy Bloxham Jonathan LunineJack Connerney Barry MaukAngioletta Coradini David McComasStan Cowley Tobias OwenDaniel Gautier Ed SmithRandy Gladstone Paul SteffesTristan Guillot David StevensonSamuel Gulkis Ed Stone Candice Hansen Richard ThorneWilliam Hubbard
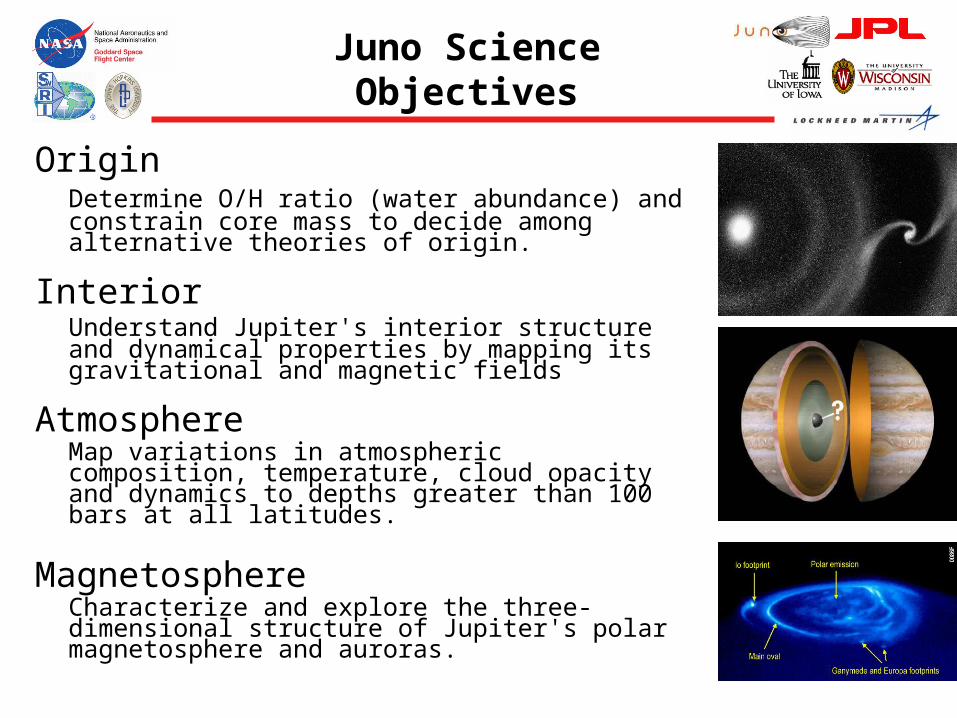
Juno Science Objectives
OriginDetermine O/H ratio (water abundance) and constrain core mass to decide among alternative theories of origin.
InteriorUnderstand Jupiter's interior structure and dynamical properties by mapping its gravitational and magnetic fields
AtmosphereMap variations in atmospheric composition, temperature, cloud opacity and dynamics to depths greater than 100 bars at all latitudes.
MagnetosphereCharacterize and explore the three-dimensional structure of Jupiter's polar magnetosphere and auroras.

Probing Deep and Globally
• Radiometry probes deep into meteorological layer
• Magnetic fields probe into dynamo region of metallic hydrogen layer
• Gravity fields probe into central core region
Juno probes deep into Jupiter in three ways:

Spacecraft Characteristics
20+ m Diameter
Spin-Stabilized
Solar-Powered
Rad-Hard
Mag Boom

Trajectory
View from above ecliptic plane with ecliptic X to right
Jupiter Arrival, 10/19/16
Launch, 8/18/11
Earth flyby, 800 km alt., 10/18/13
DSM, 9/18/12 (date varies)
Y
X
8/2/16
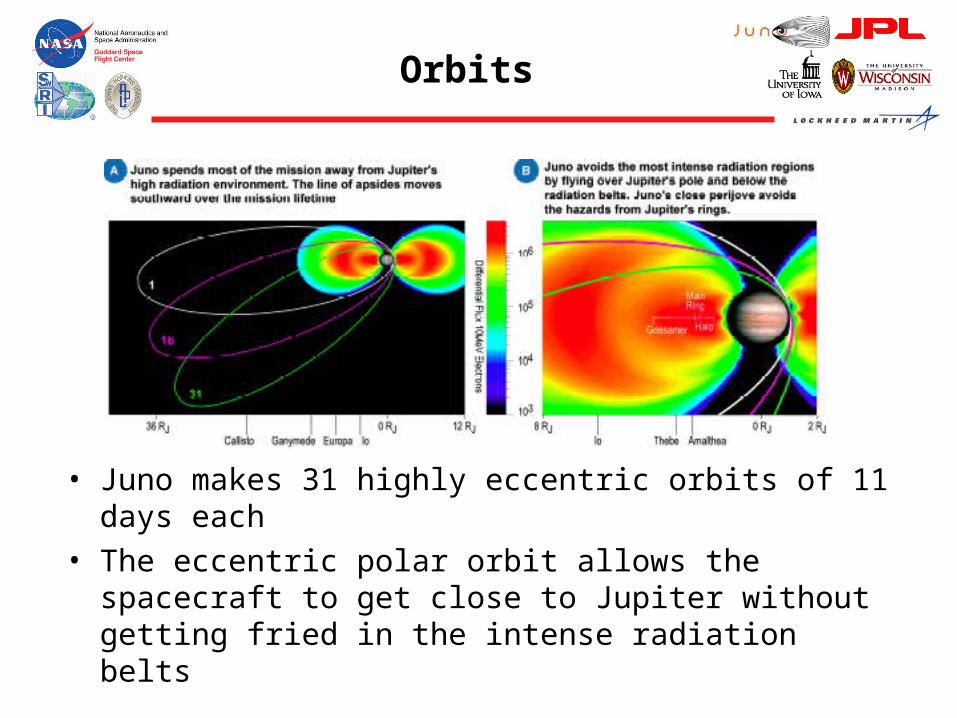
Orbits
• Juno makes 31 highly eccentric orbits of 11 days each• The eccentric polar orbit allows the spacecraft to get
close to Jupiter without getting fried in the intense radiation belts

Orbit Trajectory
QuickTime™ and aBMP decompressor
are needed to see this picture.
31st orbit is shown

Magnetic Investigation
• Led by Jack Connerney (GSFC), with Ed Smith and Neil Murphy (JPL)
• The Juno MAG experiment maps the innermost magnetic field structure of Jupiter at all longitudes
• Measurement system has the following components:– Dual Fluxgate Magnetometers for vector field
(GSFC)– Advanced Stellar Compass (ASC/DTU) for attitude
determination – Scalar Helium Magnetometer for field magnitude
(JPL)– Dedicated MAG boom at end of the solar array
Multiple polar orbits phased to map Jupiter’s magnetic field

Magnetic Field Mapping
QuickTime™ and aCinepak decompressor
are needed to see this picture.

Gravity
Close polar orbit is ideal to measure Jupiter’s gravity field
• Led by John Anderson, Anthony Mittsakus
• Precise measurements of spacecraft motion measure gravity field
• Juno polar orbit measures full gravity field
• Distribution of mass reveals core and deep structure

Gravity Determination of Core Mass and Deep Winds
• J2, J4, J6 and tides give core mass once water abundance is known
• J8 - J30 give deep winds down to r ~ 0.8 RJ
• Red is signature of deep winds; dash is signature of solid body rotation
• Blue dots (X/Ka uplink) show accuracy for baseline mission

Jupiter’s Polar Magnetosphere
QuickTime™ and aPNG decompressor
are needed to see this picture.
QuickTime™ and aH.264 decompressor
are needed to see this picture.
Shown in magnetic coordinates
• Jupiter’s aurora from the Hubble Space Telescope (Clarke et al.)
Rotating with Jupiter

Auroral Investigation
• Juno instruments will measure:– Currents
– EM emissions
– Energetic particles & plasma
– UV and IR auroral emissions
• Jovian Aurora Distribution Experiment (JADE)– David McComas (Southwest Research Institute)
• Energetic Particle Detector (EPD)– Barry Mauk (APL/Johns Hopkins University)
• WAVES (radio & plasma spectral measurement)
– William Kurth (University of Iowa)
• UV spectrograph (UVS)– Randy Gladstone (Southwest Research Institute)
• Jovian InfraRed Auroral Mapper (JIRAM)– Angioletta Coradini (Agenzia Spaziale Italiana)
Polar Magnetosphere Suite:

How did Jupiter form?
Water is key to understanding the formation of Jupiter. We need to distinguish between 3solar and 9solar abundance.
How deep are the atmospheric circulations?
> 200 bars?
~ 6 bars?
MWR Science Objectives
Microwave sounding will address two key questions:

Cosmic Abundances - Why is Water Important?
H2O, NH3, CH4
Water, Ammonia, MethaneHydrogen compounds
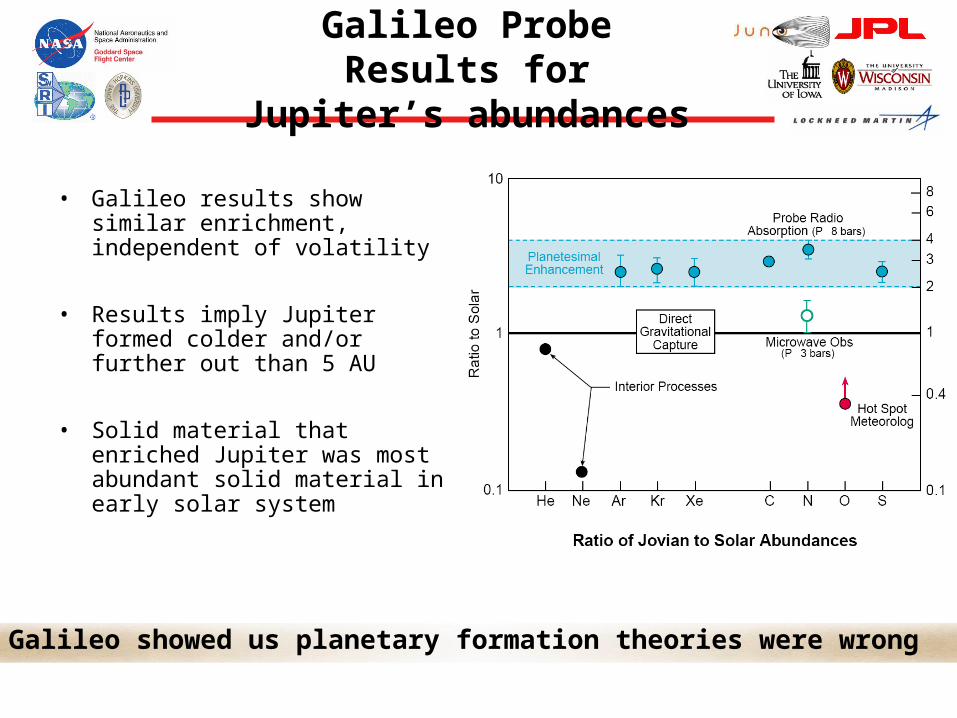
Galileo Probe Results for Jupiter’s abundances
• Galileo results show similar enrichment, independent of volatility
• Results imply Jupiter formed colder and/or further out than 5 AU
• Solid material that enriched Jupiter was most abundant solid material in early solar system
Galileo showed us planetary formation theories were wrong


Microwave Radiometry
• Led by Michael Janssen• Radiometry sounds
atmosphere to 1000-bar depth
• Determines water and ammonia global abundances
• 6 wavelengths between 1.3 and 50 cm

The First Deep Space Radiometer
• 20 lbs, 5 w• 1.9 and 1.35 cm-• Crystal detectors (!)• 5-month project start to
delivery (!)• Verified hot surface, deep
atmosphere

Flight Microwave RadiometersSince Mariner 2
• Planetary (dedicated radiometers)– 0!
• Earth-orbiting– Lots (too numerous to list)
• Other Planetary – MIRO (submillimeter spectrometer)– Magellan (incorporated into radar instrument)– Cassini (incorporated into radar instrument)
• Future planetary– Juno Microwave Radiometer

Resolution is a Problem
Aperture sizefor 1 arcsec
resolution
30 cm
3 m
30 m
300 m
3 km
30 km
Wavelength
1 m 10 m 100 m 1 mm 1 cm 10 cm

10m 1m 10 cm 1 cm 1 mm 100 m
Wavelength
Energetic Electrons
Synchrotron emissionThermal bremsstrahlung
Thermal Blackbody
Spectral lines
What do We See in the Microwave Region?
Jupiter, 20 cm-
Jupiter, 2 cm-
Cosmic background, thermal fluctuations at mm- (from WMAP)

10m 1m 10 cm 1 cm 1 mm 100 m
Wavelength
Energetic Electrons
Synchrotron emissionThermal bremsstrahlung
Thermal Blackbody
Spectral lines
Surfacesshallowdeep
Deep AtmospheresSurfaces
Upper AtmospheresCompositionWinds
Particles andFields
Planetary Science Targets
spectroscopyradiometry
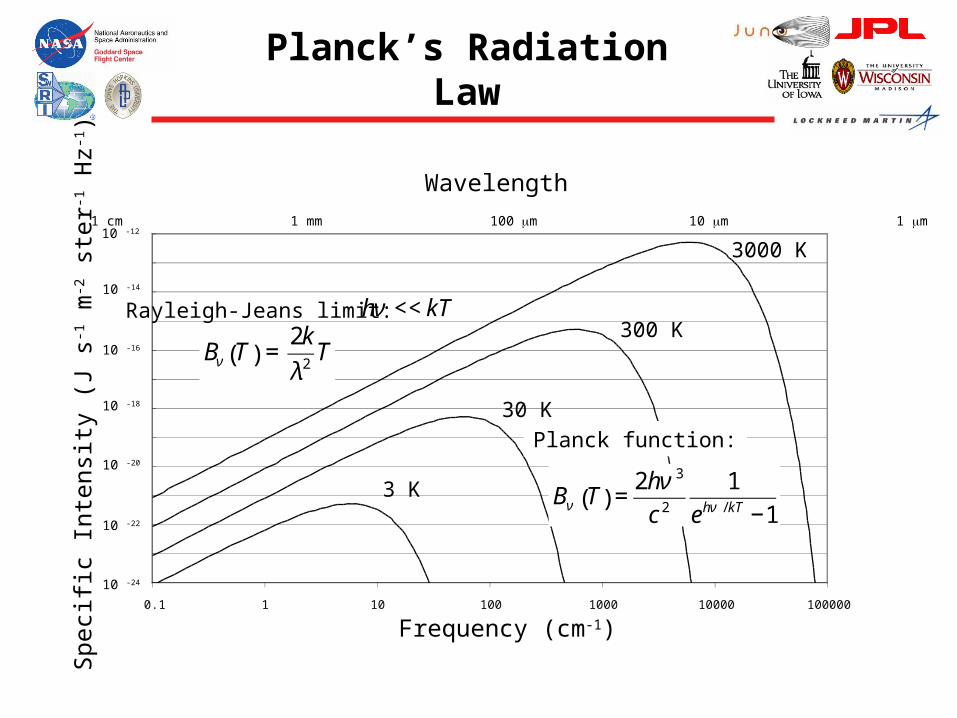
Planck’s Radiation Law
1E-24
1E-23
1E-22
1E-21
1E-20
1E-19
1E-18
1E-17
1E-16
1E-15
1E-14
1E-13
1E-12
0.1 1 10 100 1000 10000 100000
€
Bν T( ) =2k
λ2T
3 K
30 K
300 K
3000 K
Spe
cific
Int
ensi
ty (
J s-1
m-2 s
ter-1
Hz-1
)
10 -12
10 -14
10 -16
10 -18
10 -20
10 -22
10 -24
Frequency (cm-1)
10 cm 1 cm 1 mm 100 m 10 m 1 m 0.1m
Wavelength
Rayleigh-Jeans limit:
€
hν << kT
€
Bν T( ) =2hν 3
c 2
1
ehν / kT −1
Planck function:

Brightness Temperature
In microwave region, brightness of a Blackbody is linear with kinetic temperature T:
€
Bν T( ) =2k
λ2T = Iv
Redefine radiant intensity in units of Kelvin by scaling:
€
TB ν( ) ≡λ2
2kIν
This is “Brightness Temperature”

Atmospheric Sounding
€
TB f( ) = W h, f( )0
∞
∫ T h( ) dhh
W(h)
T(h)
Radiative transfer equation:
where W(f) = weighting
function at frequency f
f1
f2

Atmospheric Sounding (continued)
h
W(h)
T(h)
f1
f2
• Weighting function depends on composition– E.g., NH3, H2O
• Brightness spectrum tells about the distribution of:– Temperature– Composition
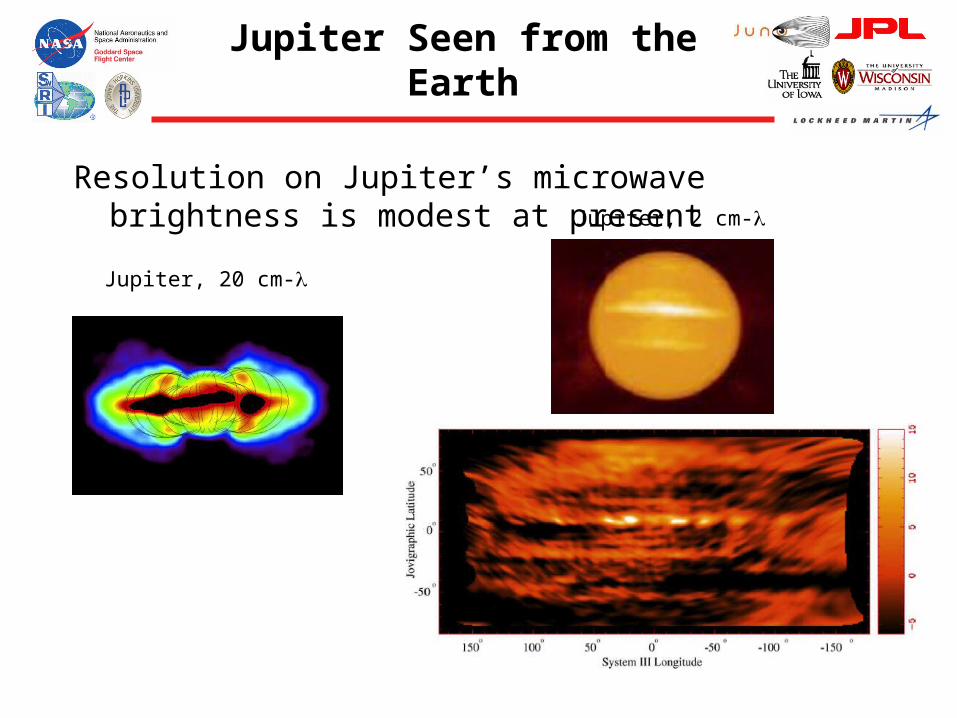
Jupiter Seen from the Earth
Resolution on Jupiter’s microwave brightness is modest at present
Jupiter, 20 cm-
Jupiter, 2 cm-

The Cassini RADAR Radiometer
• Frequency = 13.68 GHz (2.1 cm )• Beamwidth = 0.35° (uses the HGA)• Measurement precision 0.025K /s • Absolute uncertainty 2%• Polarization: 1 linear• Observes in all RADAR modes:
– Radiometer only
– Scatterometer
– Altimeter
– SAR (5 beams alternating)
• Science Objectives– Titan
– Rings
– Saturn atmosphere
– Icy satellites
The radiometer is built The radiometer is built into the Radar receiver into the Radar receiver systemsystem
4-M
RadarLocation

Saturn at Microwave Frequencies
• Best previous maps of Saturn at millimeter/centimeter wavelengths are Earth-based:
(from Grossman, Muhleman, & Berge, 1989)

Saturn from Cassini
• 2.1-cm image formed by continuous pole-to-pole scanning in three separate time segments
• Shows NH3 cloud humidity, seen to vary 100%

MWR Sounding
• The Juno microwave instrument will use six radiometers to measure the thermal emission from Jupiter’s deep atmosphere
• Ammonia and water are the principal sources of microwave emission• Their concentration and distribution will be measured
solar panels
spin axis
12.5, 6.25, 3.125, 1.3-cm
antennas
50-cm antenna
25-cm antenna

Juno Observations
• Unique microwave measurements obtained
Emission angle dependence uniquely measured by along-track scanning
–High spatial resolution obtained
10° foot-prints
–Synchrotron emission avoided
Spacecraft tracks
Along-track scanning
This is a new and powerful approach

De Pater et al., Icarus 173, Vol 2, pp 425-438, 2005
Jupiter’s Spectrum Measured Jupiter’s Spectrum Measured from Earthfrom Earth
Ammonia Opacity only Ammonia and Water Opacity

Water’s Effect on the Spectrum
• Inversion requires measurements at different wavelengths
• Knowledge of the absolute gains at the 2% level is very difficult
• Uncertainties in gains at different wavelengths are uncorrelated
• Another technique is required!
2 % accuracy
Very high accuracy is required to measure water Very high accuracy is required to measure water abundance using brightness temperature spectrumabundance using brightness temperature spectrum

Emission Angle Dependence
Nadir View
Off-Nadir View
R(%) =Tb (nadir) – Tb ()
Tb (nadir) 100
(Janssen et al., Icarus 173, 2005, 447-453)
R is a dimensionless parameter that can be measured to high precision

Two-Point Spectrum of Relative Brightness
• Relies on relative measurement that can be measured to precision of 0.1%
• Does not rely on absolute calibration that is limited to 2%
• Note: not restricted to 2 points

Juno Spacecraft
Electronics Vault2X SpinningSun Sensor
MGAForward LGA
2.5 m HGA (Fix-Mount)
MWR Antenna Panel
Thermal Louver
2X Battery
Fwd REM
MWR600 MHz Antenna
SASU
Solar ArrayArticulation Mechanism
Fwd REM

MWR Antennas
600 MHz
1.2 GHz2.4 GHz
4.8 GHz
9.6 GHz23 GHz
20° Beamwidth (Full-Width at Half Power)
All 12° Beamwidth (Full-Width at Half Power)

Patch Antenna for 0.6 and 1.2 GHz Antennas
Rear View Cross-Sectional View
Patch Radiator
(cavity resonator)
Honeycomb
Support Structure
Feed Network
(power dividers)
Coax fed probe from
feed to patch
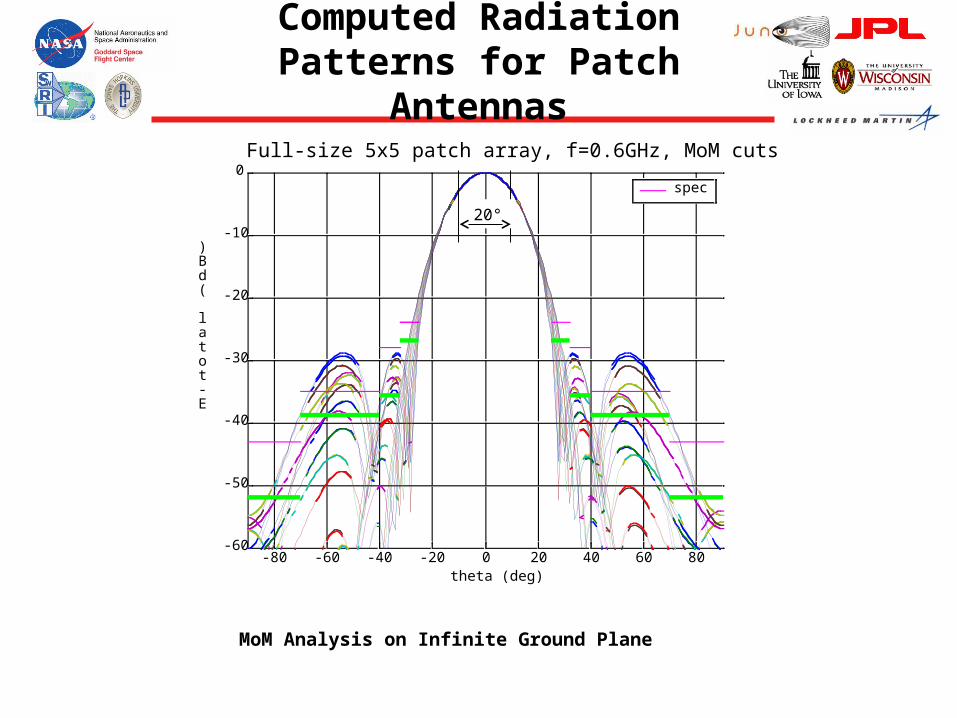
Computed Radiation Patterns for Patch Antennas
MoM Analysis on Infinite Ground Plane
-80 -60 -40 -20 0 20 40 60 80-60
-50
-40
-30
-20
-10
0
theta (deg)
E-total (dB)
Full-size 5x5 patch array, f=0.6GHz, MoM cuts, inf. GP
spec
20°

2.4 - 9.6 GHz Antennas
Top View
Top View – Radiating Face Removed
Metal waveguides form a sturdy box Metal waveguides form a sturdy box beam mechanical structurebeam mechanical structure
Half-wavelength slots Half-wavelength slots leak power into the leak power into the radiation field in a radiation field in a precisely controlled precisely controlled mannermanner
• 2.4 - 9.6 GHz Antennas will be 8x8 Waveguide Slot Array Antennas (5x5 Slot Arrays Shown)

Breadboard of 1.2 GHz Radiometer
RF Input
Bandpass Filter
Detector Circuits
LNA
Dicke Switch
Noise Diode
Isolator
Noise Diode
Bandpass Filter
LNAs
Noise Diodes
Lowpass Filter
Directional Couplers (4x)
Test Port
DC side
RF side

Breadboard Stability
• Exceeds NEDT requirement
• Exceeds stability requirement by ~ order of magnitude

Spacecraft Electronics Vault

Electronics Vault Interior
FGM Electronics
BATT Electronics
UVS Electronics
KA Band SDST-SSPA
PDDU
2X C&DH 2X Sun SensorElectronics
Solar ArraySwitching Unit(SASU)
RadiometerModules (MWR)
WavesElectronics
2X X Band EPC
MWR Electronics
JADEElectronics
PIU
X BandTransponder
X BandTransponder
SHMElectronics
2X SRUElectronics
ASC Electronics(not visible)
2X IMU

Juno
Let's go!
Backup Slides

MWR vs Gravity Orbits
• Doppler tracking for gravity and MWR sounding have different pointing pointing requirements
• Must be done on different orbits
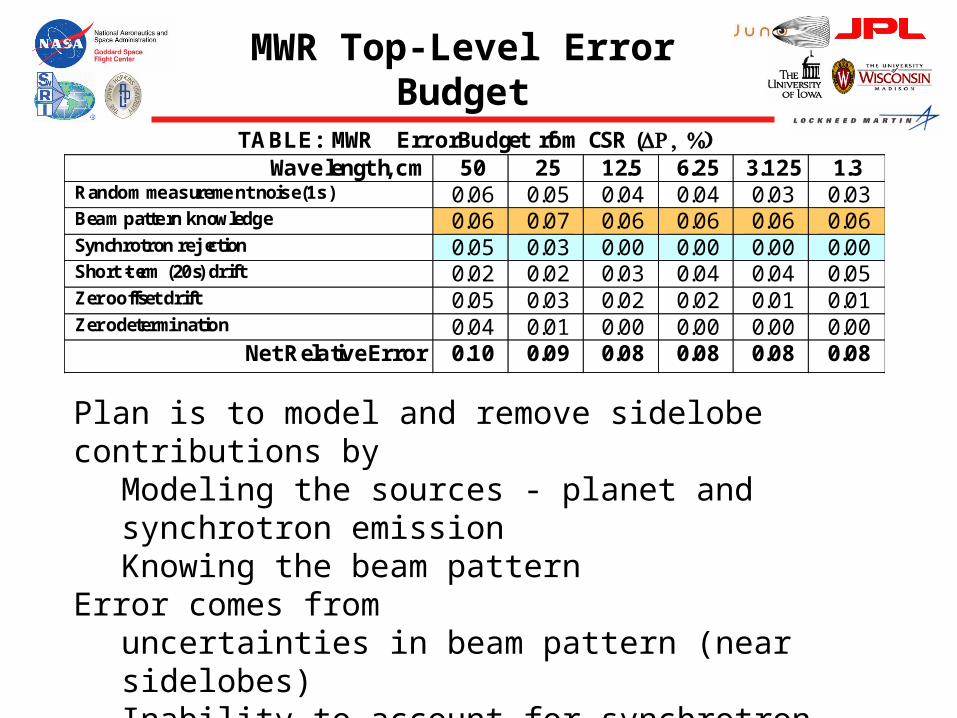
MWR Top-Level Error Budget
TABLE: MWR Error Budget from CSR (ΔR, %)Wavelength, cm 50 25 12.5 6.25 3.125 1.3
Random measurement noise (1s) 0.06 0.05 0.04 0.04 0.03 0.03Beam pattern knowledge 0.06 0.07 0.06 0.06 0.06 0.06Synchrotron rejection 0.05 0.03 0.00 0.00 0.00 0.00Short-term (20s) drift 0.02 0.02 0.03 0.04 0.04 0.05Zero offset drift 0.05 0.03 0.02 0.02 0.01 0.01Zero determination 0.04 0.01 0.00 0.00 0.00 0.00
Net Relative Error 0.10 0.09 0.08 0.08 0.08 0.08
Plan is to model and remove sidelobe contributions byModeling the sources - planet and synchrotron emissionKnowing the beam pattern
Error comes fromuncertainties in beam pattern (near sidelobes)Inability to account for synchrotron contribution (far sidelobes)
The error modeling is complicated - sorry!

Far Sidelobes
• ΔR is calculated for 20% uncertainty in synchrotron model
• Same beam knowledge table used

Juno Core Spacecraft - Aft
Toroidal LGA
2X SRU
2X Fuel Tank
Pressure Transducer Vault 2X Nutation Damper
2X Aft REM
2X Oxidizer Tank
WAVES Electric Antenna
Engine HeatShield
WAVES Mag Search Coil
3X Toggle linkSA articulationMechanism
Engine Cover (open)
Aft LGA (X)
2X Helium Tank
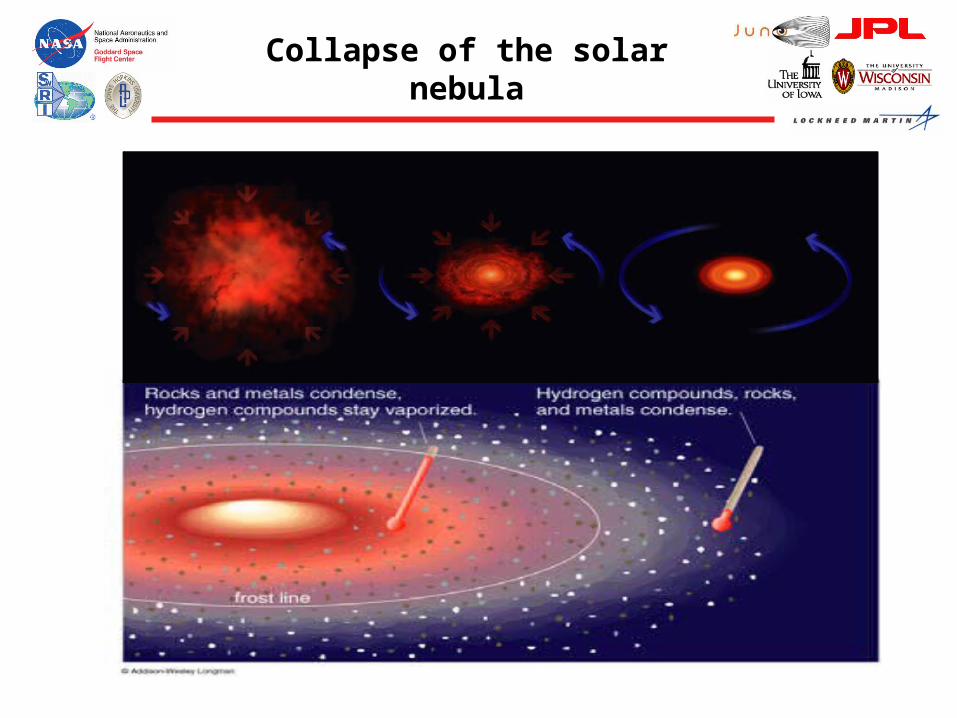
Collapse of the solar nebula

30 au
5 au
30K
150K
Interstellar (ISM)30
K
KBOs
Cold planetesimals and heavy element enrichmentRequires T 30 K to trap N2 and Ar
2-4 solar H2O