Embed Size (px)
Citation preview
1
GODREJ CONSUMER PRODUCTS INVESTOR PRESENTATION
2
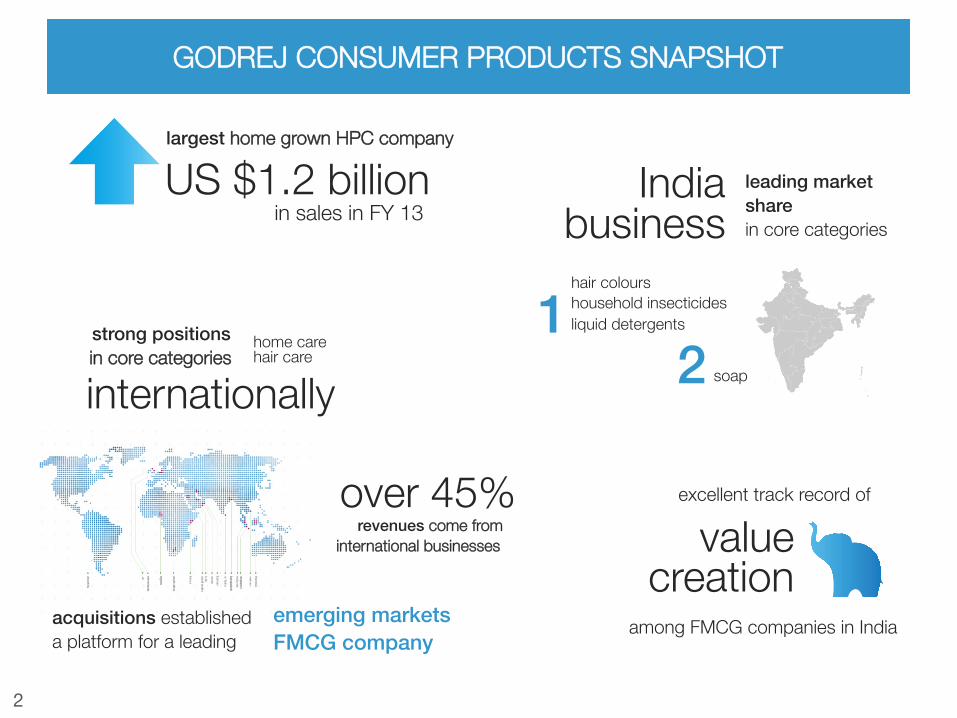
leading market!share!in core categories
India business hair colours household insecticides liquid detergents 1
soap 2
excellent track record of
empathy progression
trust
expression experience
value creation
among FMCG companies in India
US $1.2 billion largest home grown HPC company
in sales in FY 13
internationally strong positions in core categories
home care hair care
acquisitions established a platform for a leading
emerging markets !FMCG company!
over 45% revenues come from
international businesses
"GODREJ CONSUMER PRODUCTS SNAPSHOT"
3
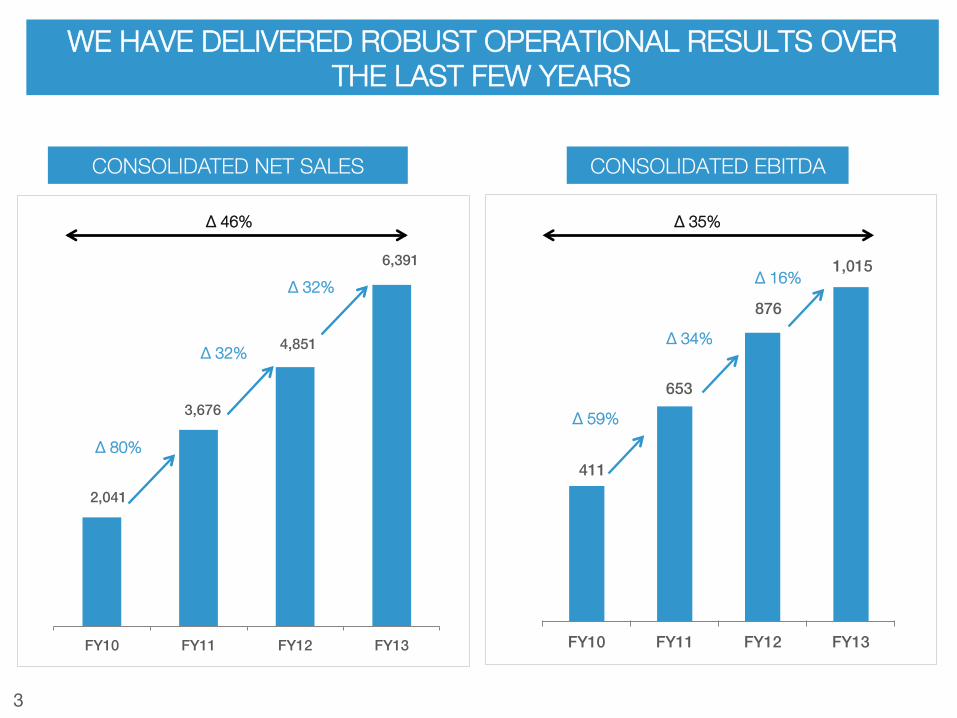
WE HAVE DELIVERED ROBUST OPERATIONAL RESULTS OVER "THE LAST FEW YEARS
2,041 !
3,676 !
4,851 !
6,391 !
FY10! FY11! FY12! FY13!
∆ 46%
∆ 80%
∆ 32%
CONSOLIDATED NET SALES CONSOLIDATED EBITDA
∆ 32%
411 !
653 !
876 !
1,015 !
FY10! FY11! FY12! FY13!
∆ 59%
∆ 34%
∆ 16%
∆ 35%
4
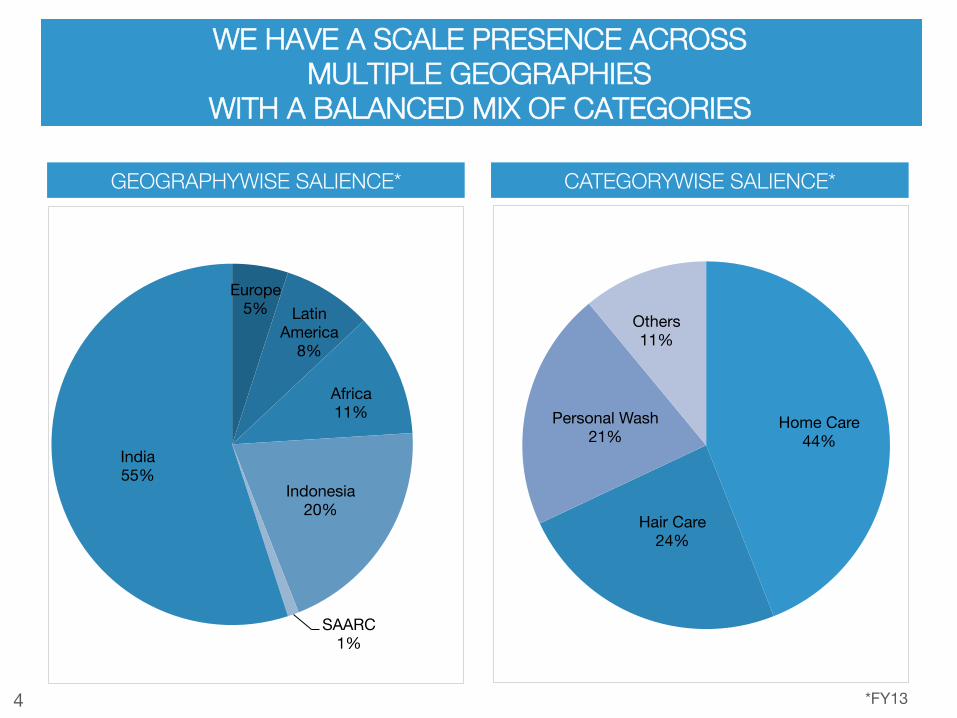
Home Care 44%
Hair Care 24%
Personal Wash 21%
Others 11%
WE HAVE A SCALE PRESENCE ACROSS "MULTIPLE GEOGRAPHIES "
WITH A BALANCED MIX OF CATEGORIES
GEOGRAPHYWISE SALIENCE* CATEGORYWISE SALIENCE*
*FY13
Europe 5% Latin
America 8%
Africa 11%
Indonesia 20%
SAARC 1%
India 55%
5
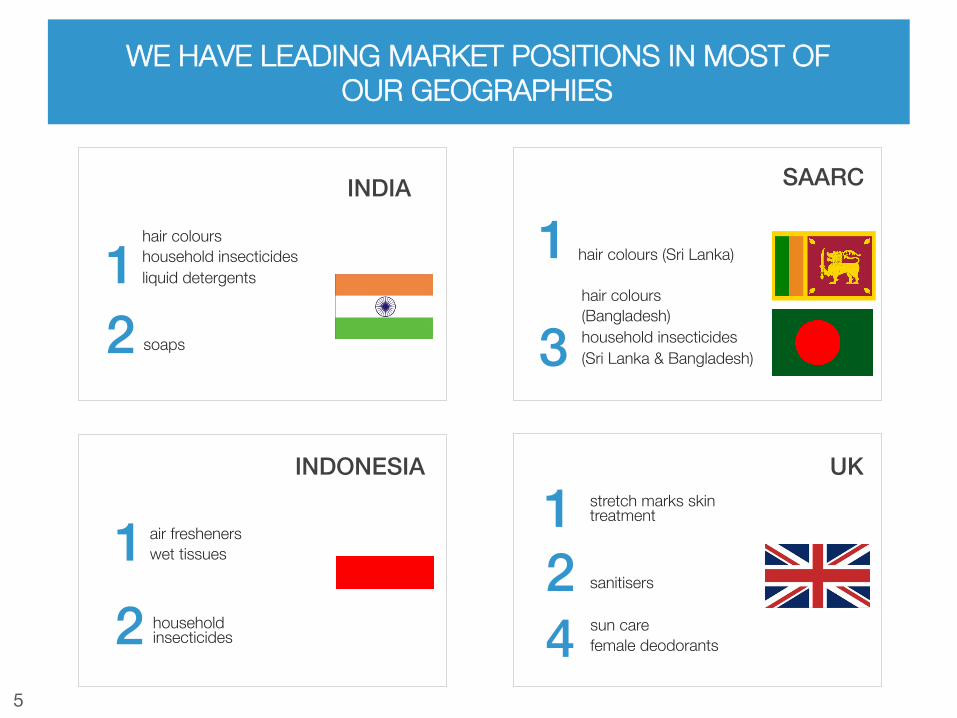
WE HAVE LEADING MARKET POSITIONS IN MOST OF "OUR GEOGRAPHIES
INDIA!
hair colours household insecticides liquid detergents 1soaps 2
SAARC!
hair colours (Sri Lanka) 1
3hair colours (Bangladesh) household insecticides (Sri Lanka & Bangladesh)
INDONESIA!
air fresheners wet tissues 1household insecticides 2
UK!stretch marks skin treatment 1sanitisers 2
4 sun care female deodorants
6
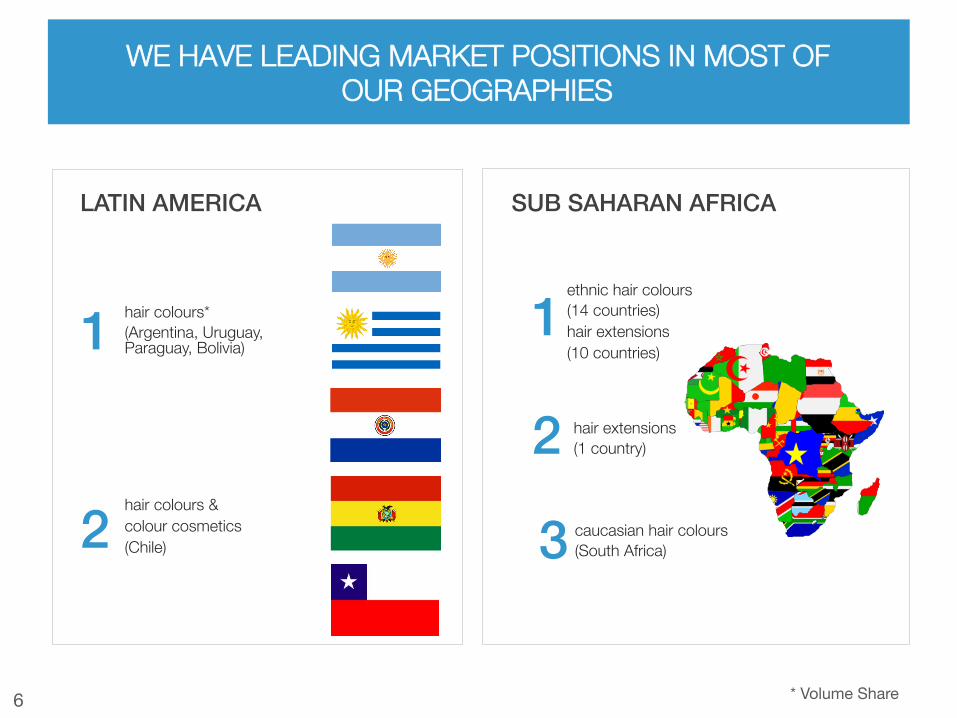
WE HAVE LEADING MARKET POSITIONS IN MOST OF "OUR GEOGRAPHIES
LATIN AMERICA!
hair colours* (Argentina, Uruguay, Paraguay, Bolivia)
1
hair colours & colour cosmetics (Chile)
2
SUB SAHARAN AFRICA!
ethnic hair colours (14 countries) hair extensions (10 countries)
1!
2!
3
hair extensions (1 country)
caucasian hair colours (South Africa)
* Volume Share
7
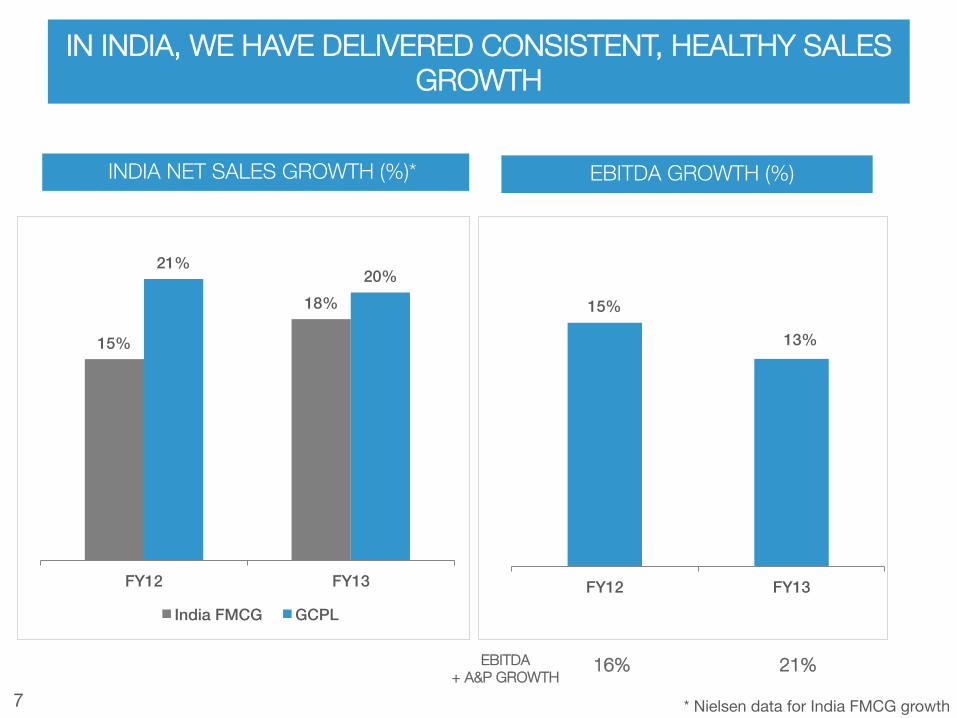
IN INDIA, WE HAVE DELIVERED CONSISTENT, HEALTHY SALES GROWTH
INDIA NET SALES GROWTH (%)*
15%!
13%!
FY12! FY13!
EBITDA + A&P GROWTH
16% 21%
EBITDA GROWTH (%)
15%!
18%!
21%!20%!
FY12! FY13!
India FMCG ! GCPL!
* Nielsen data for India FMCG growth
8
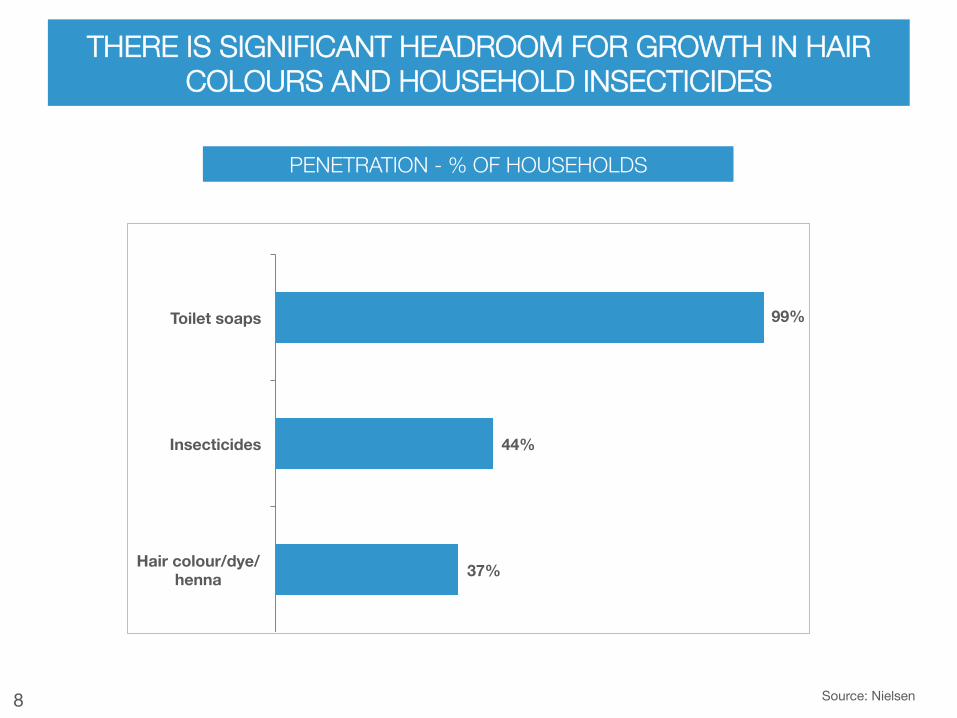
THERE IS SIGNIFICANT HEADROOM FOR GROWTH IN HAIR COLOURS AND HOUSEHOLD INSECTICIDES
37%
44%
99%
Hair colour/dye/henna
Insecticides
Toilet soaps
PENETRATION - % OF HOUSEHOLDS
Source: Nielsen
9
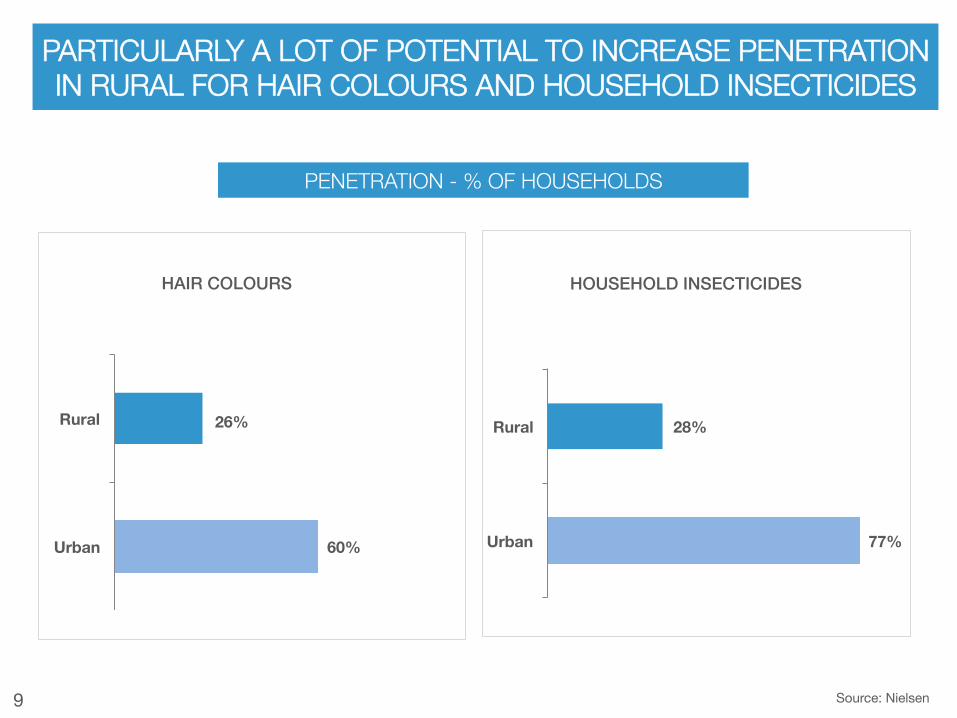
PARTICULARLY A LOT OF POTENTIAL TO INCREASE PENETRATION IN RURAL FOR HAIR COLOURS AND HOUSEHOLD INSECTICIDES
PENETRATION - % OF HOUSEHOLDS
Source: Nielsen
HAIR COLOURS! HOUSEHOLD INSECTICIDES!
60%
26%
Urban
Rural
77%
28%
Urban
Rural
10
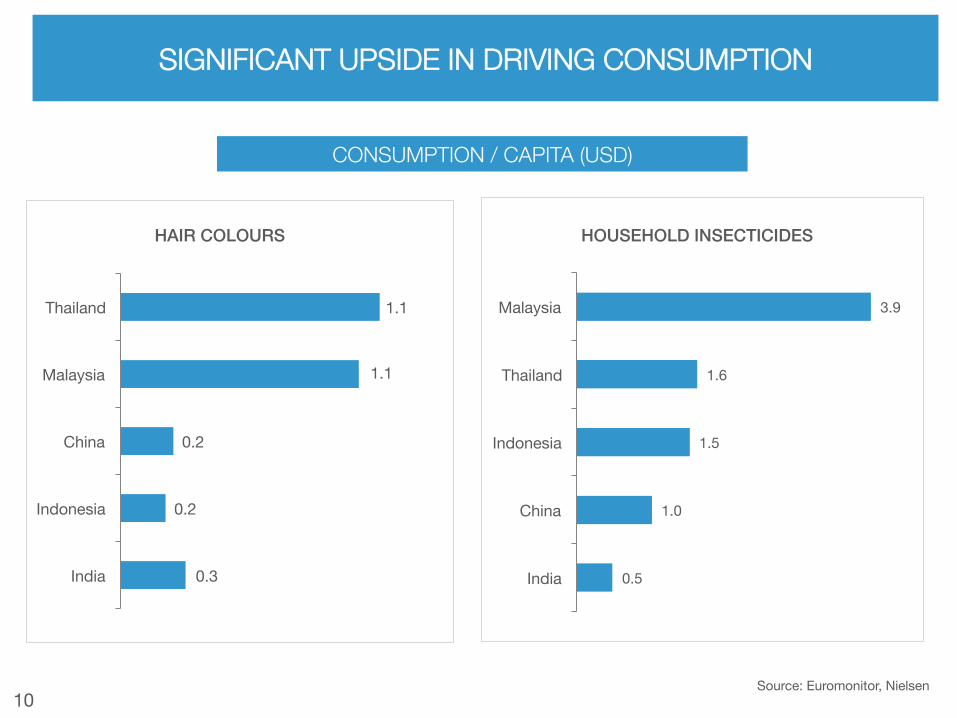
0.5
1.0
1.5
1.6
3.9
India
China
Indonesia
Thailand
Malaysia
0.3
0.2
0.2
1.1
1.1
India
Indonesia
China
Malaysia
Thailand
SIGNIFICANT UPSIDE IN DRIVING CONSUMPTION
CONSUMPTION / CAPITA (USD)
Source: Euromonitor, Nielsen
HAIR COLOURS! HOUSEHOLD INSECTICIDES!
11
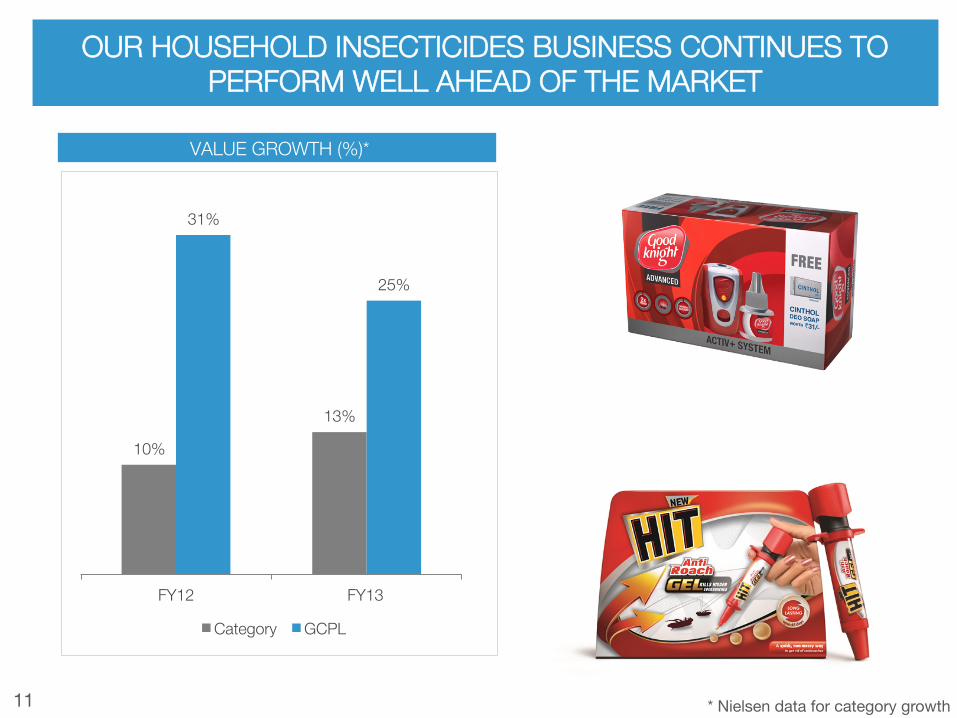
OUR HOUSEHOLD INSECTICIDES BUSINESS CONTINUES TO "PERFORM WELL AHEAD OF THE MARKET
VALUE GROWTH (%)*
10%
13%
31%
25%
FY12 FY13
Category GCPL
* Nielsen data for category growth
12
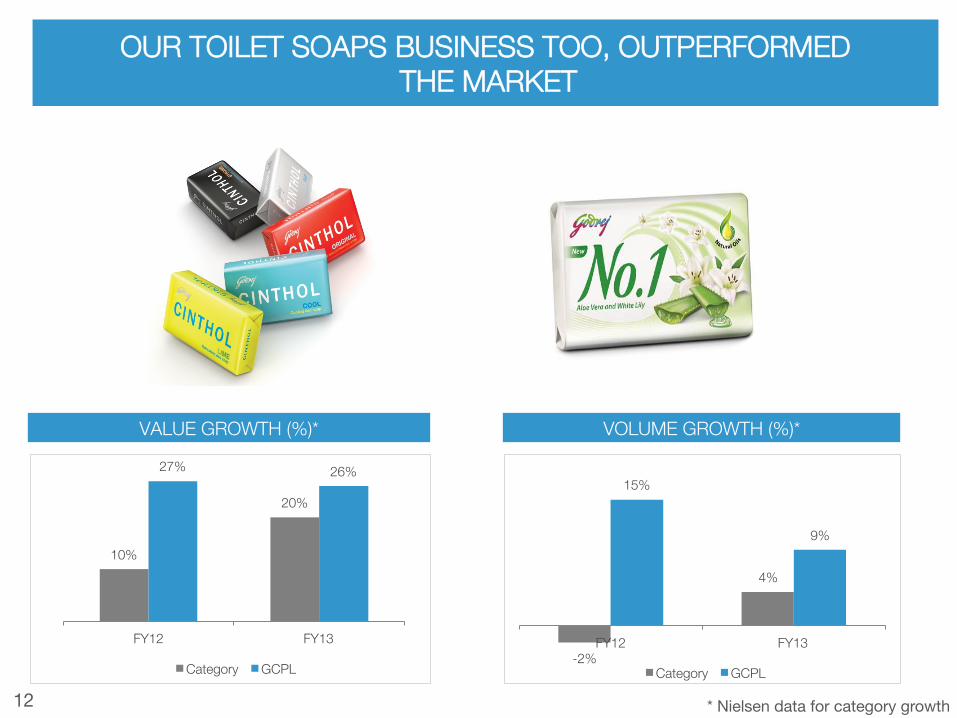
OUR TOILET SOAPS BUSINESS TOO, OUTPERFORMED" THE MARKET
VALUE GROWTH (%)* VOLUME GROWTH (%)*
10%
20%
27% 26%
FY12 FY13
Category GCPL -2%
4%
15%
9%
FY12 FY13
Category GCPL
* Nielsen data for category growth
13
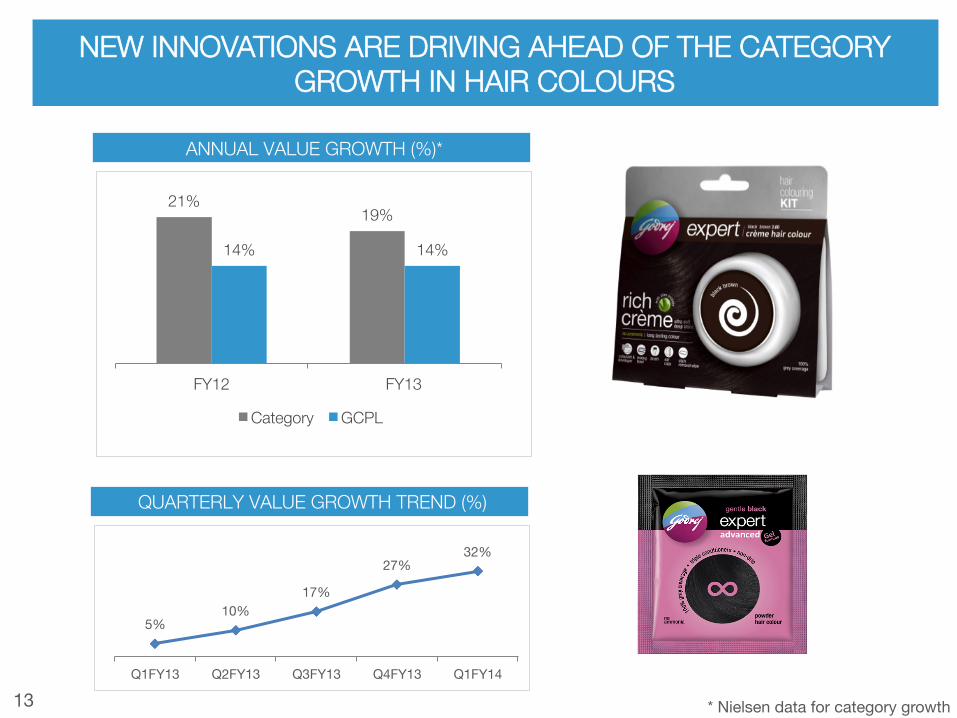
NEW INNOVATIONS ARE DRIVING AHEAD OF THE CATEGORY "GROWTH IN HAIR COLOURS
ANNUAL VALUE GROWTH (%)*
21% 19%
14% 14%
FY12 FY13
Category GCPL
QUARTERLY VALUE GROWTH TREND (%)
* Nielsen data for category growth
5% 10%
17%
27% 32%
Q1FY13 Q2FY13 Q3FY13 Q4FY13 Q1FY14
14
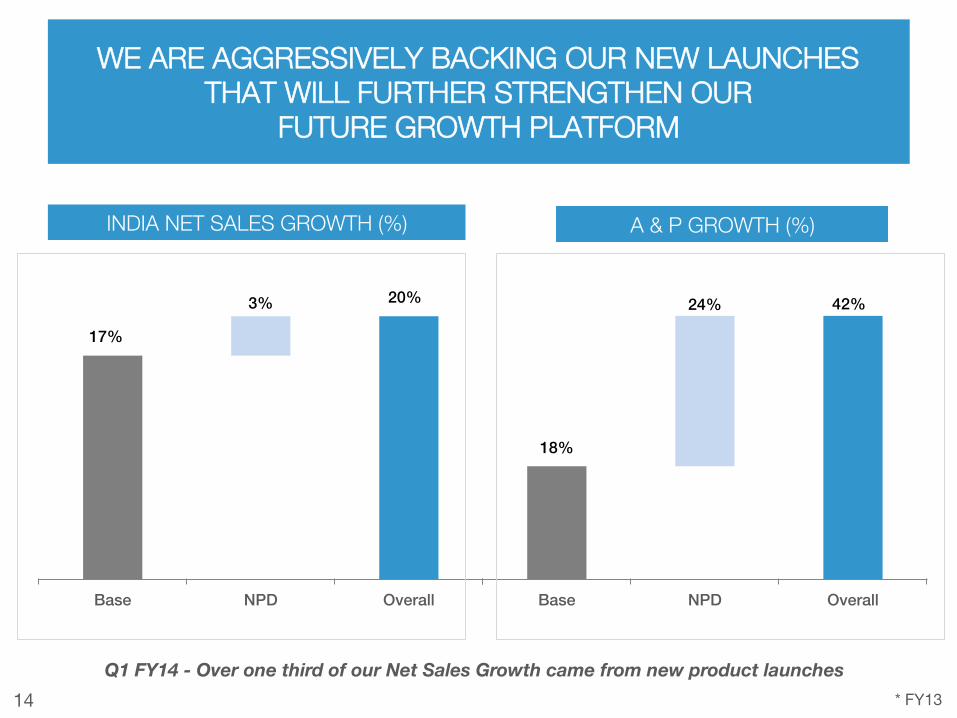
WE ARE AGGRESSIVELY BACKING OUR NEW LAUNCHES "THAT WILL FURTHER STRENGTHEN OUR "
FUTURE GROWTH PLATFORM
17%!
3%! 20%!
Base! NPD! Overall!
42%!
18%!
24%!
Base! NPD! Overall!
INDIA NET SALES GROWTH (%) A & P GROWTH (%)
* FY13
Q1 FY14 - Over one third of our Net Sales Growth came from new product launches
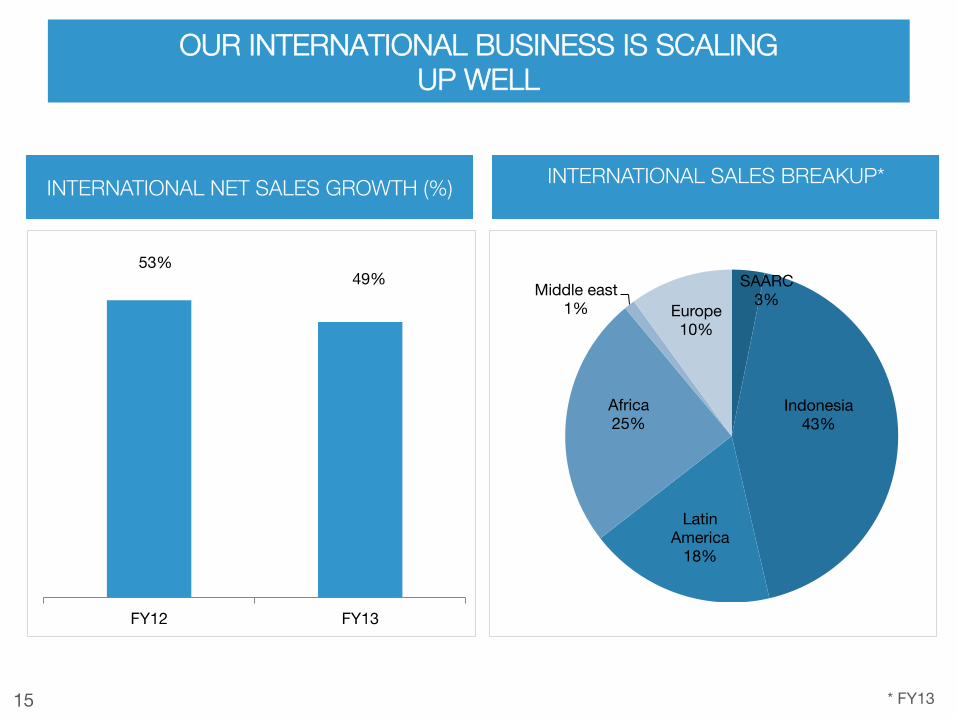
15
OUR INTERNATIONAL BUSINESS IS SCALING "UP WELL
INTERNATIONAL SALES BREAKUP* INTERNATIONAL NET SALES GROWTH (%)
* FY13
SAARC 3%
Indonesia 43%
Latin America
18%
Africa 25%
Middle east 1% Europe
10%
53% 49%
FY12 FY13
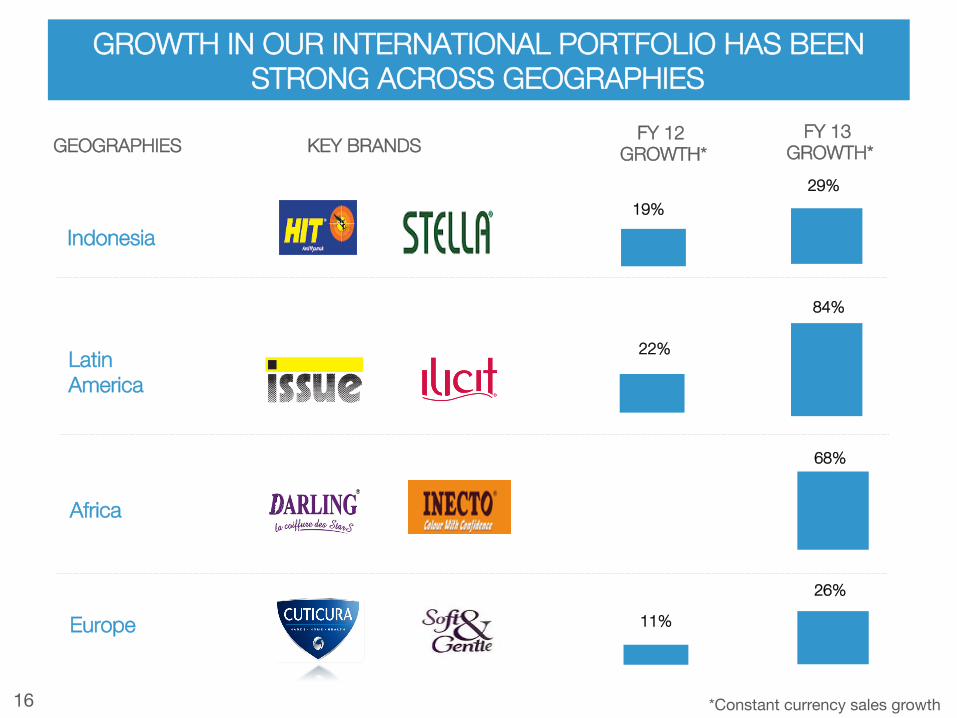
16
GROWTH IN OUR INTERNATIONAL PORTFOLIO HAS BEEN "STRONG ACROSS GEOGRAPHIES
Indonesia
GEOGRAPHIES KEY BRANDS
Latin America
Africa
Europe
FY 12 GROWTH*
FY 13 GROWTH*
29% 19%
22%
84%
11%
26%
68%
*Constant currency sales growth
17
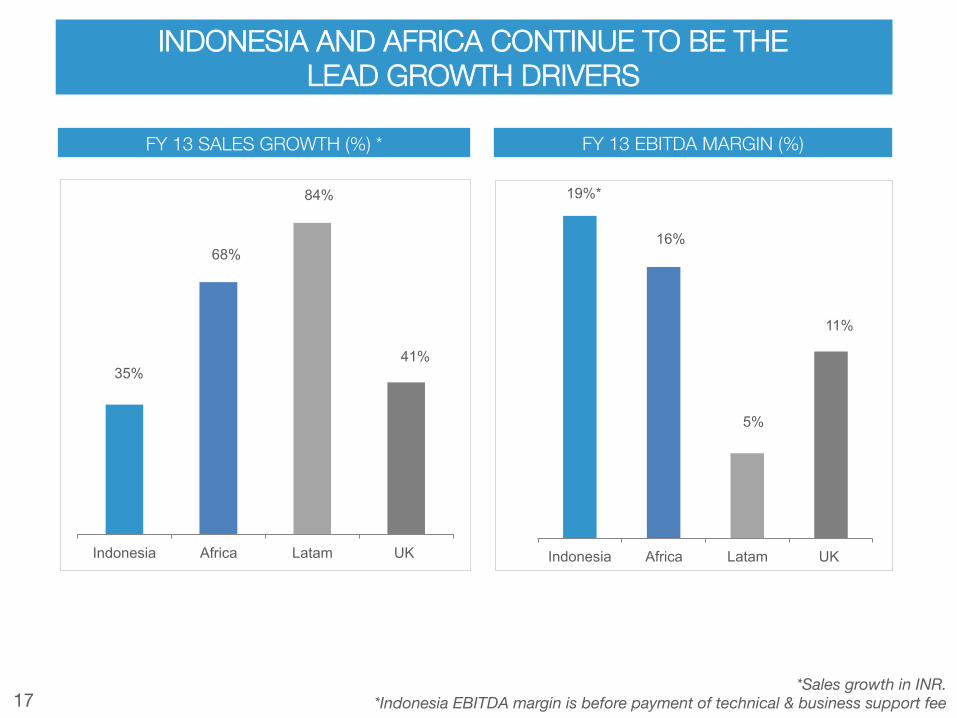
INDONESIA AND AFRICA CONTINUE TO BE THE "LEAD GROWTH DRIVERS
FY 13 SALES GROWTH (%) * FY 13 EBITDA MARGIN (%)
35%
68%
84%
41%
Indonesia Africa Latam UK
19%*
16%
5%
11%
Indonesia Africa Latam UK
*Sales growth in INR. *Indonesia EBITDA margin is before payment of technical & business support fee
18
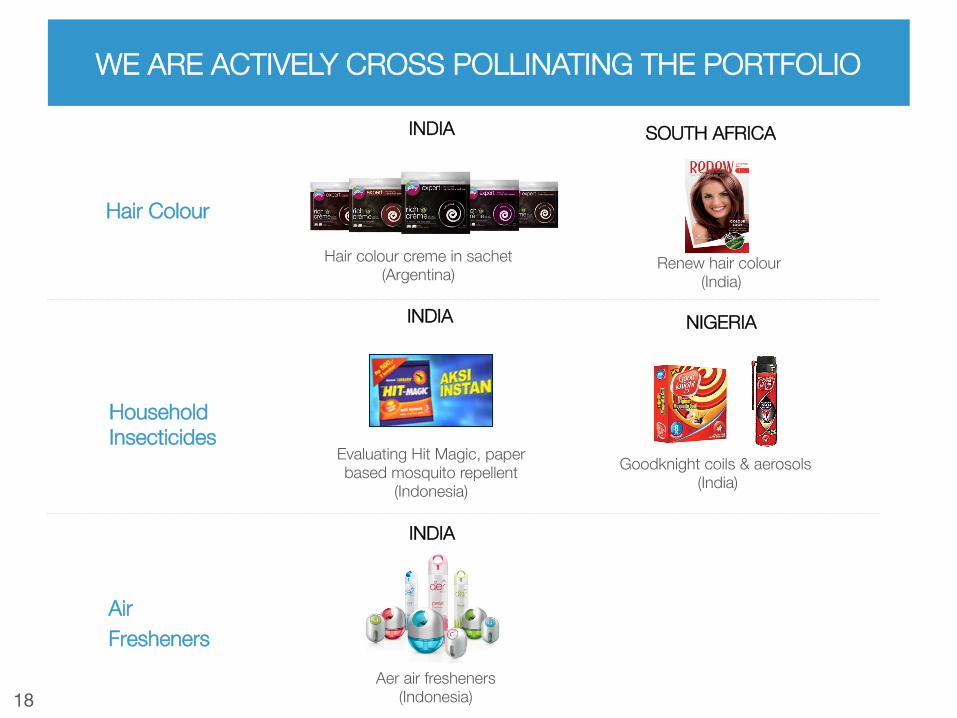
WE ARE ACTIVELY CROSS POLLINATING THE PORTFOLIO
Hair Colour
Household Insecticides
Air Fresheners
INDIA SOUTH AFRICA
Hair colour creme in sachet (Argentina)
Renew hair colour (India)
Goodknight coils & aerosols (India)
Evaluating Hit Magic, paper based mosquito repellent
(Indonesia)
Aer air fresheners (Indonesia)
INDIA NIGERIA
INDIA
19
WE CONTINUE TO FOCUS ON INTEGRATING OUR "ACQUISITIONS
Successful integration of international businesses in the Godrej way, maintaining the right balance between localization and creating the right Godrej culture
Implemented one performance and rewards programme across the globe
Strong Controls & IT infrastructure India best practices being incorporated in the operations processes. SAP Implementation underway
Disciplined M&A approach based on 3 by 3 focus on emerging markets in Asia, Africa and Latin America in 3 core categories
International Centre
dedicated expertise in product supply chain, R&D, marketing, finance and human capital
Investing in training and development of talent
20
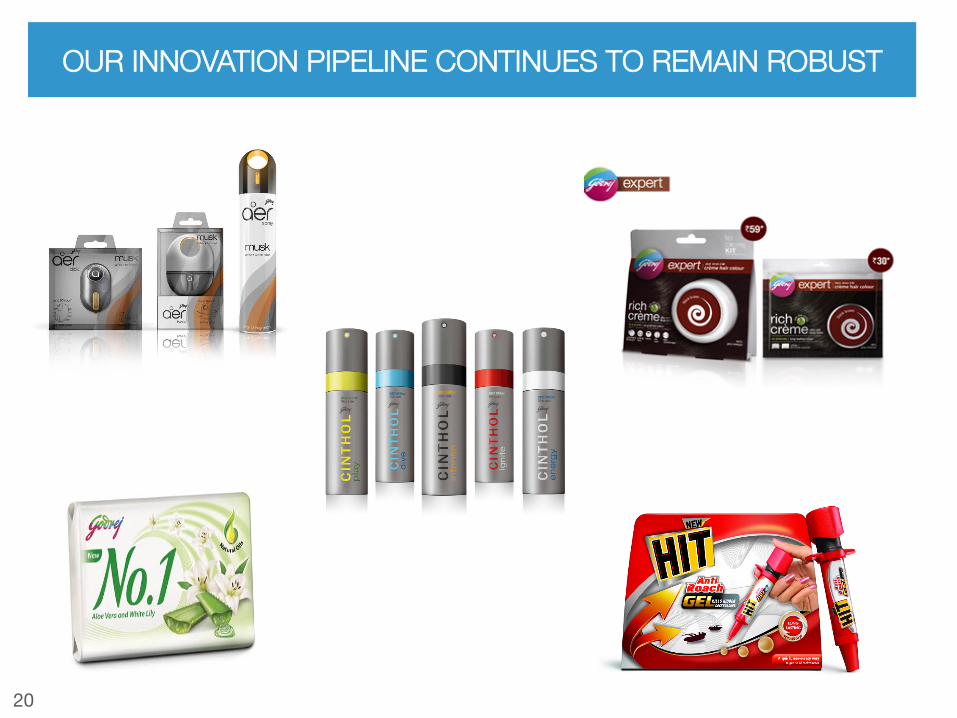
OUR INNOVATION PIPELINE CONTINUES TO REMAIN ROBUST
21
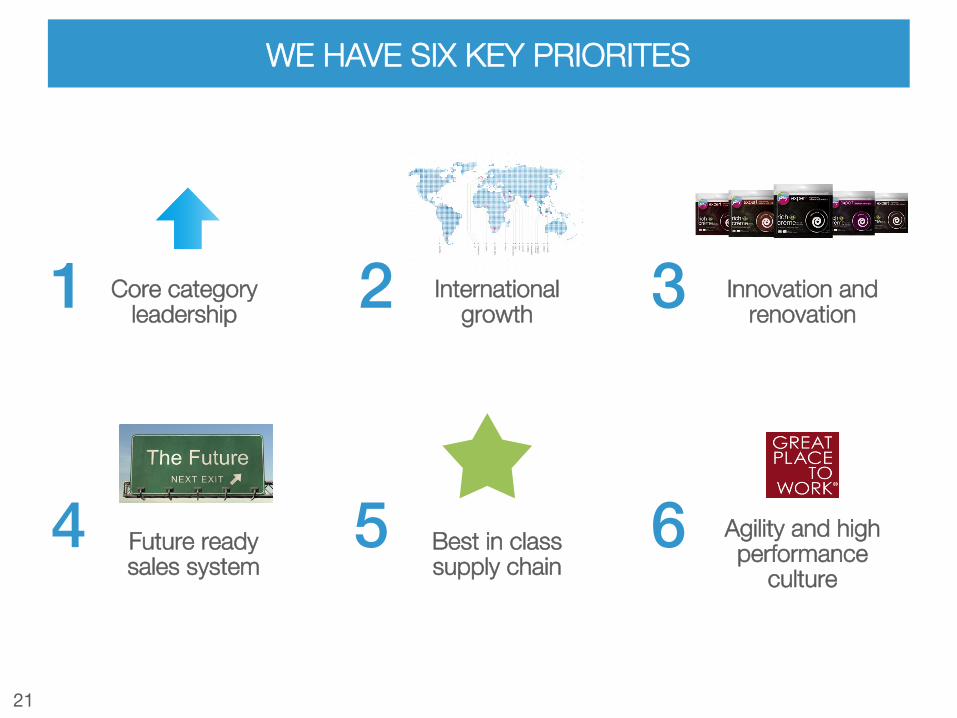
WE HAVE SIX KEY PRIORITES
Core category leadership
International growth
Innovation and renovation
Future ready sales system
Best in class supply chain
Agility and high performance
culture
2! 3!1!
5! 6!4!
empathy progression
trust
expression experience
22
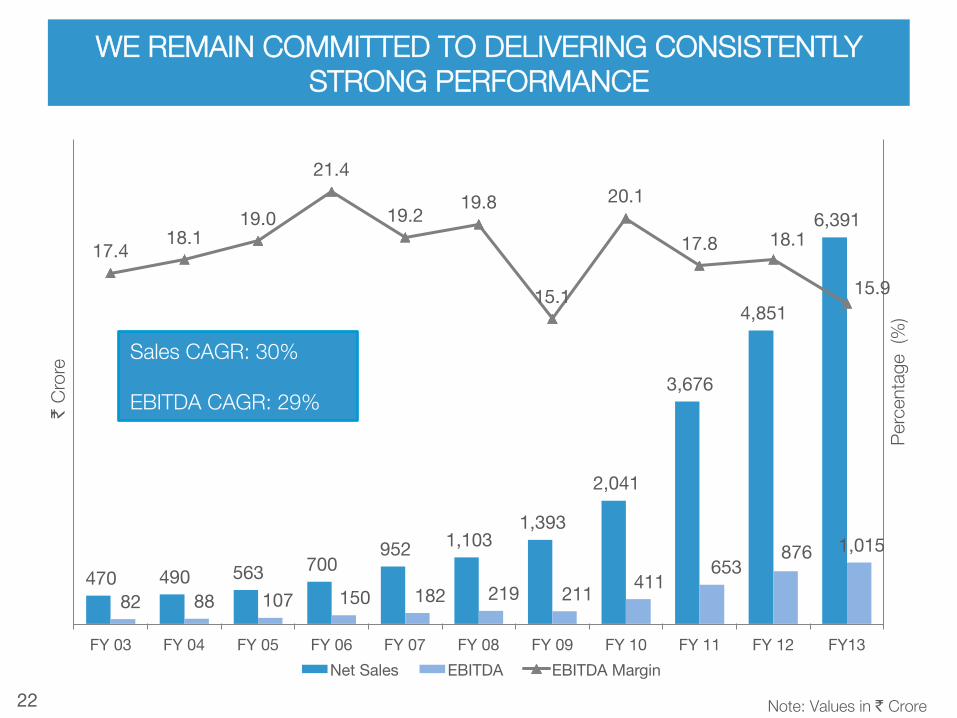
470 490 563 700 952 1,103
1,393
2,041
3,676
4,851
6,391
82 88 107 150 182 219 211 411 653
876 1,015
17.4 18.1 19.0
21.4
19.2 19.8
15.1
20.1
17.8 18.1
15.9
FY 03 FY 04 FY 05 FY 06 FY 07 FY 08 FY 09 FY 10 FY 11 FY 12 FY13
Perc
enta
ge (
%)
` Cr
ore
Net Sales EBITDA EBITDA Margin
Note: Values in ` Crore
Sales CAGR: 30% EBITDA CAGR: 29%
WE REMAIN COMMITTED TO DELIVERING CONSISTENTLY"STRONG PERFORMANCE
23
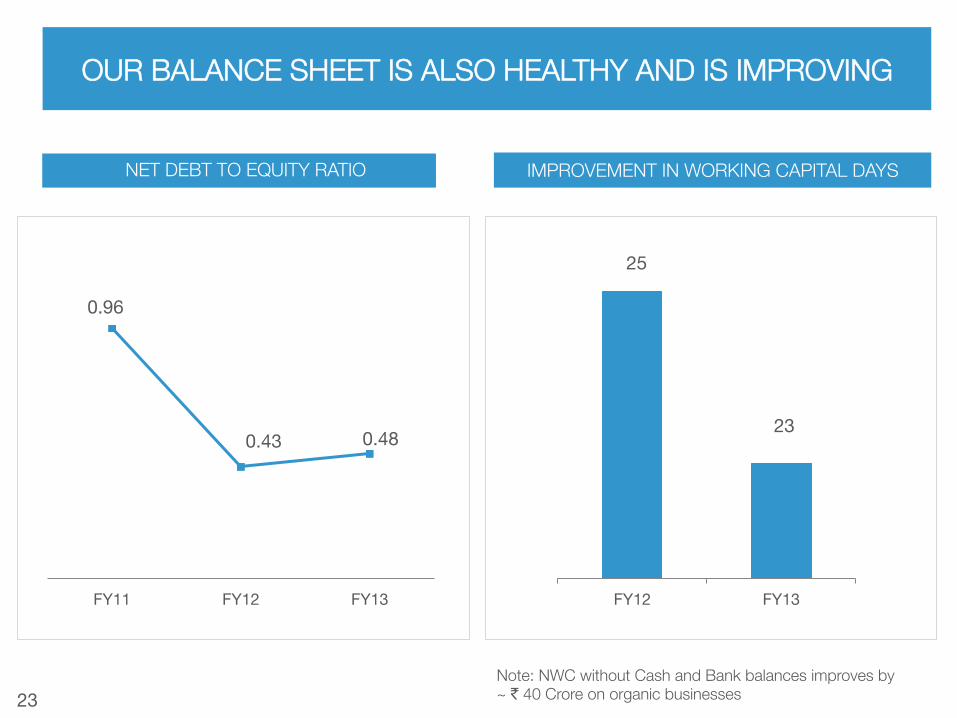
NET DEBT TO EQUITY RATIO IMPROVEMENT IN WORKING CAPITAL DAYS
0.96
0.43 0.48
FY11 FY12 FY13
25
23
FY12 FY13
Note: NWC without Cash and Bank balances improves by ~ ` 40 Crore on organic businesses
OUR BALANCE SHEET IS ALSO HEALTHY AND IS IMPROVING
24
Q1FY14 Snapshot
25
BUSINESS SNAPSHOT
Ahead of the category performance in all three categories
Improving product mix and lower palm oil prices is driving gross margin benefits
New launches witnessing good success and driving penetration in relatively underpenetrated categories
DOMESTIC BUSINESS CONTINUES TO DELIVER STRONG PERFORMANCE
26
BUSINESS SNAPSHOT
Indonesia business continues to deliver robust growth rates while expanding market leadership
Africa business - new product rollouts such as household insecticides, wet hair care product to leverage existing distribution capabilities
Margin improvement projects in Latin America underway; business holding up market share amidst tough competition
INTERNATIONAL BUSINESS CONTINUES TO SCALE UP
UK business gains extra scale after acquisition of S&G while continuing to witness healthy organic growth rates
27
BUSINESS SNAPSHOT
Weakening macro environment in a few of our operating countries
Currency volatility – Indian Rupee, South African Rand, Argentinian Peso, Indonesian Rupiah
Rising inflation – fuel costs, employee costs, etc.
28
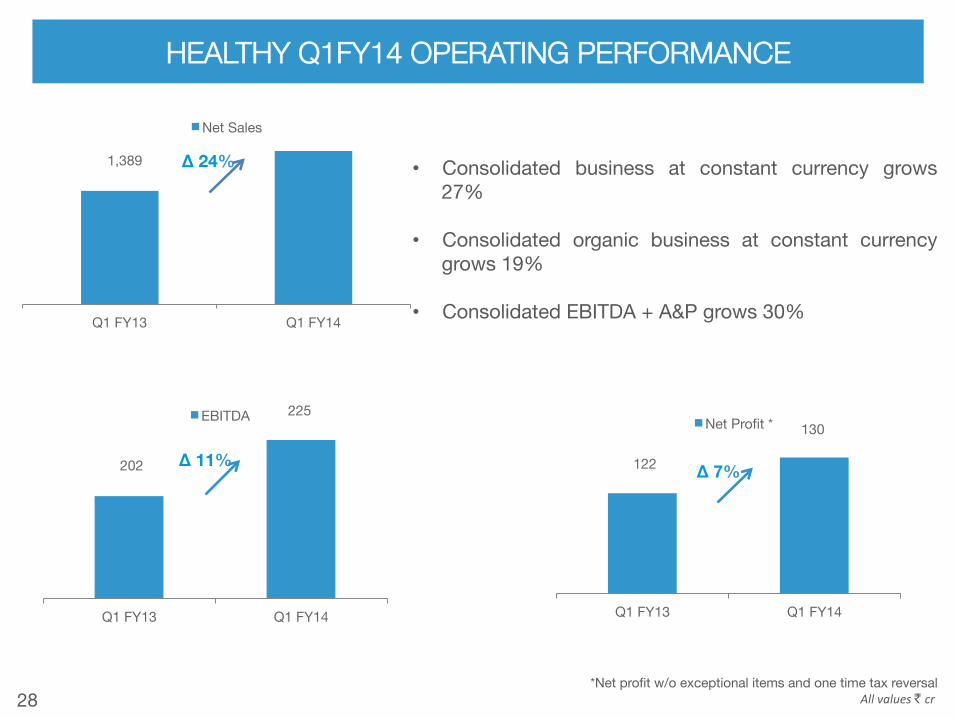
1,389
Q1 FY13 Q1 FY14
Net Sales
*Net profit w/o exceptional items and one time tax reversal All values ` cr
HEALTHY Q1FY14 OPERATING PERFORMANCE
∆ 24%
202
225
Q1 FY13 Q1 FY14
EBITDA
122
130
Q1 FY13 Q1 FY14
Net Profit *
∆ 11% ∆ 7%
• Consolidated business at constant currency grows 27%
• Consolidated organic business at constant currency grows 19%
• Consolidated EBITDA + A&P grows 30%
29
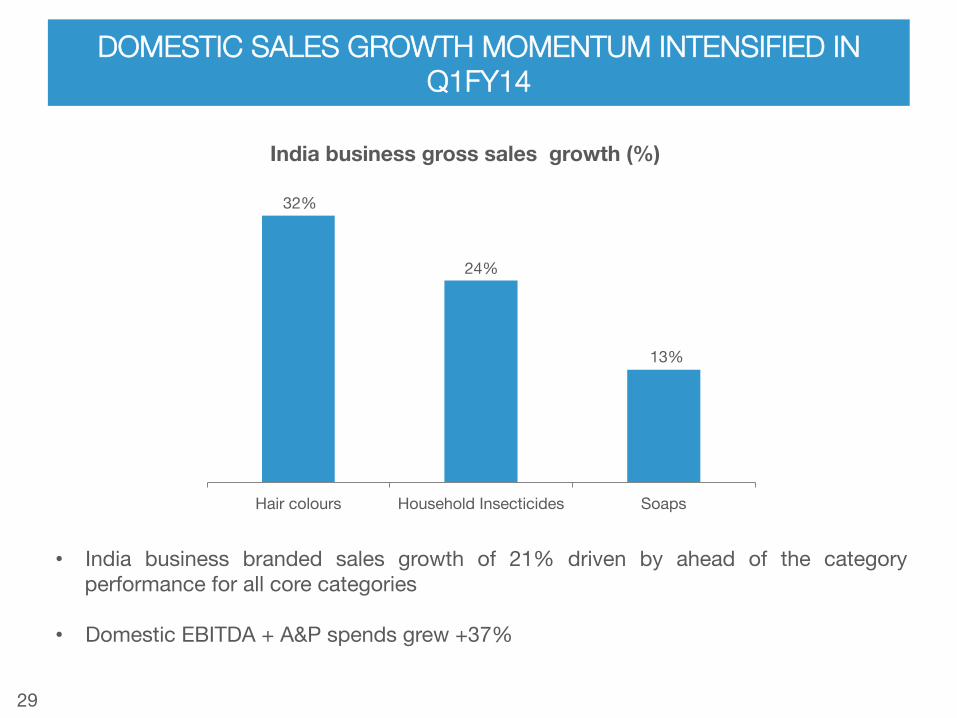
DOMESTIC SALES GROWTH MOMENTUM INTENSIFIED IN Q1FY14
32%
24%
13%
Hair colours Household Insecticides Soaps
India business gross sales growth (%)
• India business branded sales growth of 21% driven by ahead of the category performance for all core categories
• Domestic EBITDA + A&P spends grew +37%
30
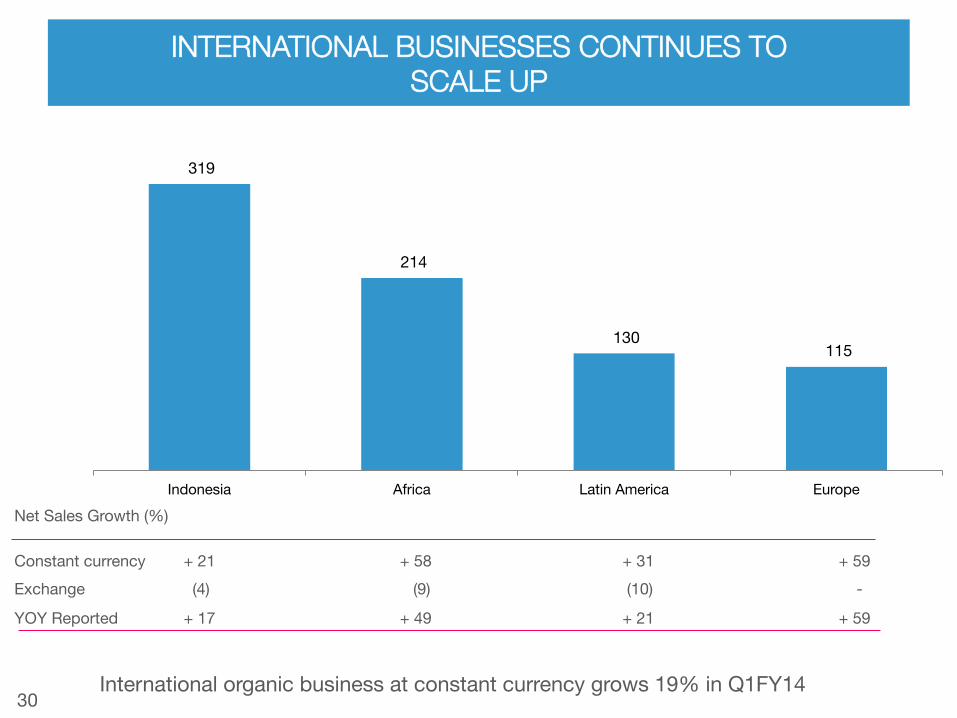
INTERNATIONAL BUSINESSES CONTINUES TO "SCALE UP
319
214
130 115
Indonesia Africa Latin America Europe
Net Sales Growth (%)
Constant currency + 21 + 58 + 31 + 59 Exchange (4) (9) (10) -
YOY Reported + 17 + 49 + 21 + 59
International organic business at constant currency grows 19% in Q1FY14
31
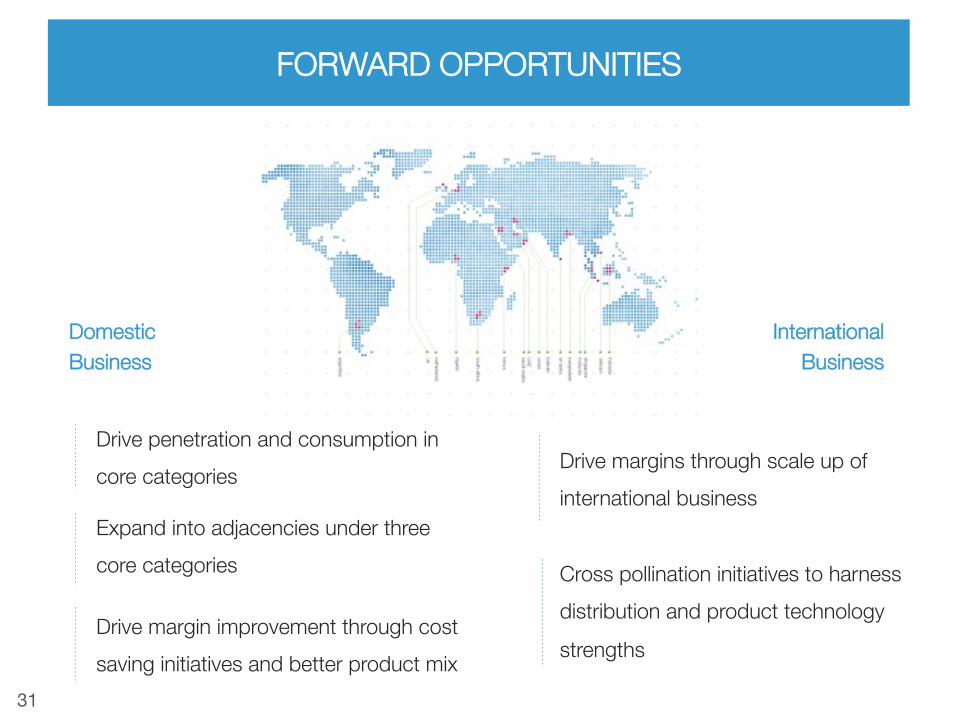
FORWARD OPPORTUNITIES
Drive penetration and consumption in core categories
Expand into adjacencies under three core categories
Drive margin improvement through cost saving initiatives and better product mix
Drive margins through scale up of international business
Cross pollination initiatives to harness distribution and product technology strengths
Domestic Business
International Business
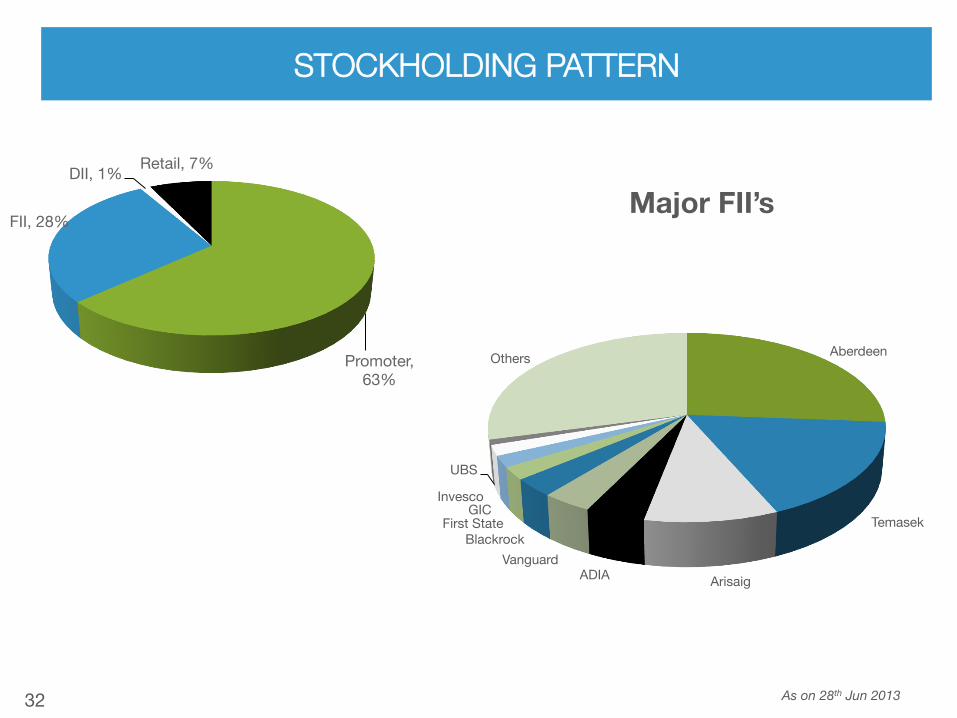
32 As on 28th Jun 2013
Major FII’s
STOCKHOLDING PATTERN
Promoter, 63%
FII, 28%
DII, 1% Retail, 7%
Aberdeen
Temasek
Arisaig ADIA Vanguard
Blackrock First State
GIC Invesco
UBS
Others
33
P Ganesh CFO [email protected] D +91 22 2519 4313
Sameer Shah Associate Vice President - Finance & Investor Relations [email protected] D +91 22 2519 4467
for more details please visit :-
"CONTACT US @"
http://www.godrejcp.com

34
THANK YOU FOR YOUR TIME AND CONSIDERATION!