Embed Size (px)
Citation preview

GODAN Action - Monitoring & Evaluation framework, Theory of
Change (narrative) and LogFrame
Deliverable no: D4.3.1 and D4.3.2 30 November 2016
Deliverable title GODAN Action - Monitoring & Evaluation framework, Theory of Change (narrative) and LogFrame
Month of Delivery M6
Authors Onno Roosenschoon (Wageningen Environmental Research) Isaura Lopes Ramos, Chris Addison (CTA) Alan Stanley (IDS)
Date 30 November 2016
Version information
Version Date Changes
4.0 24 July 2016 1st “public” version of the narrative, based on the ToC of 21 July 2016
5.0 27 July 2016 Updated version with comments of GODAN partners
6.0 2 November 2016 All comments processed
7.0 21 November 2016 Version 6 in GODAN deliverable template
8.0 30 November 2016 Final edits
2
Summary
This document contains the Monitoring & Evaluation (M&E) framework, the narrative of the GODAN Action Theory of Change (ToC) and the LogFrame.
In order to deliver on the project objectives, a robust Monitoring & Evaluation (M&E) framework needs to be developed to connect the three focal areas and work alongside them. The M&E framework contains a number of documents, templates and sheets and possibly support tools such as the M&E framework and Research Uptake templates. The M&E matrix as it is presented in this deliverable is a more elaborated version of the LogFrame, in the sense that in addition of the indicators presented in the LogFrame, a number of indicators on a lower, more detailed level is presented. These additional indicators are distilled from the GODAN Action proposal, completed by indicators which are the result of the work in Task 4.1 around the Research Uptake Strategy, eg the Research Uptake workshop. Research Uptake templates have been developed to guide and monitor how the project can reach stakeholders and interact with them and how the research uptake objectives will be achieved. These templates have been developed as part of task 4.1 Research Uptake, but they will be presented in this deliverable as part of the M&E framework. Details of the uptake strategies developed for each deliverable, should be documented using the uptake workplan template, also developed as part of task 4.1 Research Uptake.
The ToC is the result of a process which started with the initial proposal in response of the DFID invitation to tender. In this proposal a preliminary Theory of Change was presented, which was an elaboration of a ToC drafted by DFID . The ToC presented in this deliverable 1
has been created from the ground up, but with this preliminary ToC as guidance, next to the GODAN Business Case . The GODAN Action ToC will help the project to remain focussed 2
on how the GODAN Action outputs contribute to expected outcomes and on the highest level, the impact the project aims to achieve. At this stage, this ToC cannot be more than a first version, which will be elaborated as soon as the Thematic Topics have been selected.The selected Topics will make it possible to better define and narrow down the GODAN Action outputs and how these will feed into the related outcomes.
The LogFrame can be seen as the contract between DFID (as the project sponsor) and the GODAN Action project (as the project contractor). The indicators listed the LogFrame will assist DFID in their evaluation if GODAN Action has met its goals over time as agreed with DFID. Initially the LogFrame was based on the GODAN Action ToC and contained GODAN Action only indicators. However, DFID expressed a strong preference to combine the existing GODAN Secretariat LogFrame with the new GODAN Action LogFrame, since both initiatives are not only part of the same overarching DFID programme, but essentially share outcomes and impact.
1 https://devtracker.dfid.gov.uk/projects/GB-1-203202/documents 2 http://iati.dfid.gov.uk/iati_documents/4756693.odt
3

Table of contents
1 Monitoring & Evaluation 5 1.1 Introduction 5 1.2 The GODAN Action M&E matrix 5 1.3 Research Uptake templates 6 1.4 Research Uptake workplan 6
2 GODAN Action Theory of Change 8 2.1 Problem statement 8 2.2 High-level impact 9 2.3 Intermediate level impacts 9 2.4 Outputs 10
3 GODAN LogFrame 11 3.1 Introduction 11 3.2 The GODAN LogFrame process 11 3.3 GODAN LogFrame guidance notes 12
Annex 1 - GODAN Action Monitoring & Evaluation matrix
Annex 2 - GODAN Action Theory of Change
Annex 3 - GODAN Secretariat/GODAN Action combined LogFrame
Annex 4 - GODAN Secretariat/GODAN Action combined Theory of Change narrative
4
1 Monitoring & Evaluation
1.1 Introduction In order to deliver on the project objectives, a robust Monitoring & Evaluation (M&E) framework needs to be developed to connect the three focal areas and work alongside them, while also retaining a degree of independence from the implementation of the project to create a space for objective reporting and reflection on the project’s progress. The research uptake strategy and M&E work streams both intersect the three focal areas.
The overall objectives of the M&E work stream are threefold. Firstly, it will ensure GODAN Action is accountable to DFID, it will also support internal evaluation and learning activities to improve the strategic management and implementation of the programme, and thirdly, it will support the two independent evaluations of GODAN that DFID will commission . 3
Ensuring accountability to DFID is primarily based on the LogFrame, as described in paragraph 2. However, the LogFrame contains indicators at a higher level, or aggregated indicators. The indicators as presented in the M&E matrix (annex 1) are on a lower level, closely connected to the work performed in the selected thematic topics in the implementation phase.
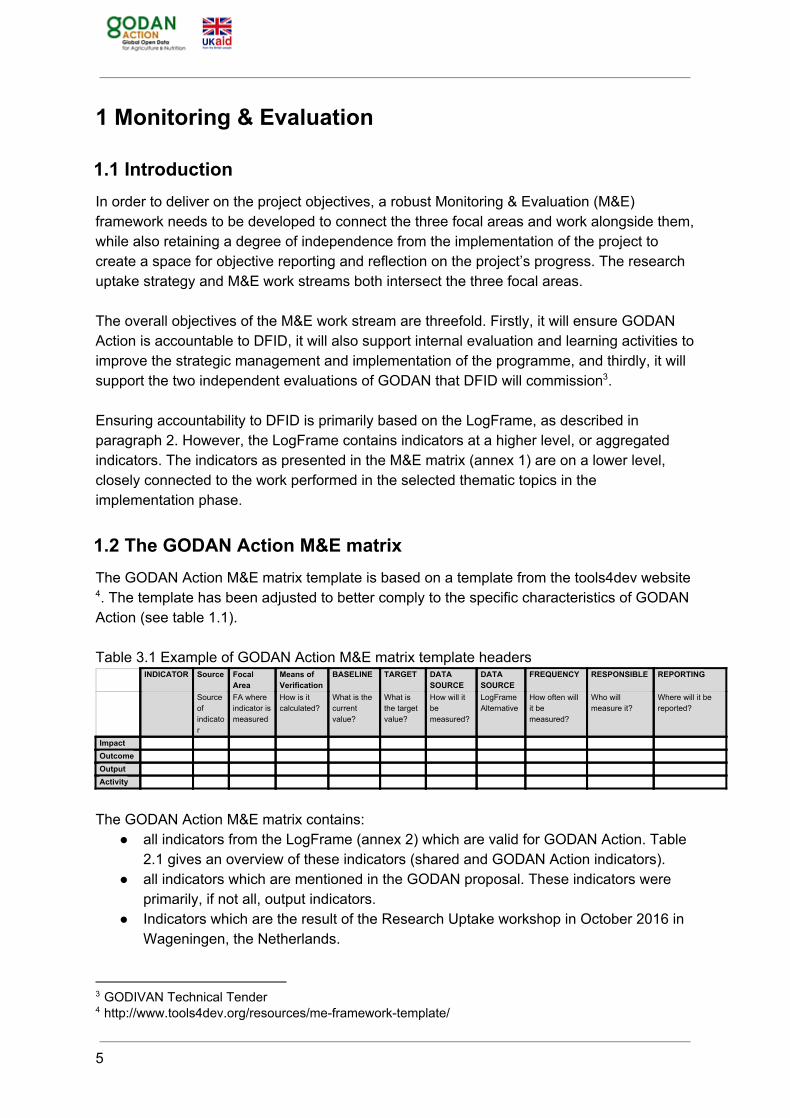
1.2 The GODAN Action M&E matrix The GODAN Action M&E matrix template is based on a template from the tools4dev website. The template has been adjusted to better comply to the specific characteristics of GODAN4
Action (see table 1.1).
Table 3.1 Example of GODAN Action M&E matrix template headers INDICATOR Source Focal
Area Means of Verification
BASELINE TARGET DATA SOURCE
DATA SOURCE
FREQUENCY RESPONSIBLE REPORTING
Source of indicator
FA where indicator is measured
How is it calculated?
What is the current value?
What is the target value?
How will it be measured?
LogFrame Alternative
How often will it be measured?
Who will measure it?
Where will it be reported?
Impact Outcome Output Activity
The GODAN Action M&E matrix contains: ● all indicators from the LogFrame (annex 2) which are valid for GODAN Action. Table
2.1 gives an overview of these indicators (shared and GODAN Action indicators).● all indicators which are mentioned in the GODAN proposal. These indicators were
primarily, if not all, output indicators.● Indicators which are the result of the Research Uptake workshop in October 2016 in
Wageningen, the Netherlands.
3 GODIVAN Technical Tender 4 http://www.tools4dev.org/resources/me-framework-template/
5

● Indicators related to activities. In cases, some activities need to be completed before an output.
Currently, with the project in the Inception phase, it is not yet possible to elaborate more on the indicators than as it is presented in annex 1. Especially outputs and activities are very closely connected to and dependent on the thematic topics, which vary in nature considerably. In addition some indicators have been included, even though at this stage it is yet unclear if the activities in which these should be collected and measured, will indeed take place. This M&E matrix is therefore a 1st version, which gives guidance for now, but needs to be updated in close collaboration with the thematic topic and Focal Area leads right at the start of the Implementation phase.
1.3 Research Uptake templates Included in the M&E matrix are additional indicators developed as part of the research uptake strategy for GODAN Action. These indicators are being developed at the output level for each deliverable. They are primarily concerned with generating lessons from uptake activities and information about stakeholders that can be fed back into the design of future uptake work. As such they are not designed to contribute directly to the overall reporting documented in the logframe but do however offer additional opportunities to gather useful evidence and examples of how GODAN Action deliverables are contributing to the project’s outcomes and outputs. To facilitate the effective documentation of these indicators and capture learning from uptake activities we have designed a research uptake template to systematically record the 5
approach taken to uptake for individual deliverables, measure performance and document learning. During the inception phase we have tested and refined the template with the GODAN Action partners working under each Focal Area. Moving forward it will be the responsibility of Focal Area leads to complete and maintain these templates for each deliverable with regular milestones included in the work plan for review and feedback into the design of future uptake activities.
1.4 Research Uptake workplan Details of the uptake strategies developed for each deliverable, should be documented using the uptake workplan template. Responsibility for documenting uptake strategies for each deliverable rests with the focal area leads. This information will then be used to maintain a workplan and link the uptake indicators developed to the overall M&E framework for the project. The work plan includes
5 https://docs.google.com/document/d/1R4Fs-DxNc8X3aMNTSfraZMZXqbKM1q4r32i_4B3TS4I/edit
6

quarterly milestones for each uptake strategy to be reviewed and updated (although they can be updated at any time as new information becomes available). The Guidance notes to the Research Uptake Strategy deliverable (D4.1.1) provide more info in detail.
7
2 GODAN Action Theory of Change
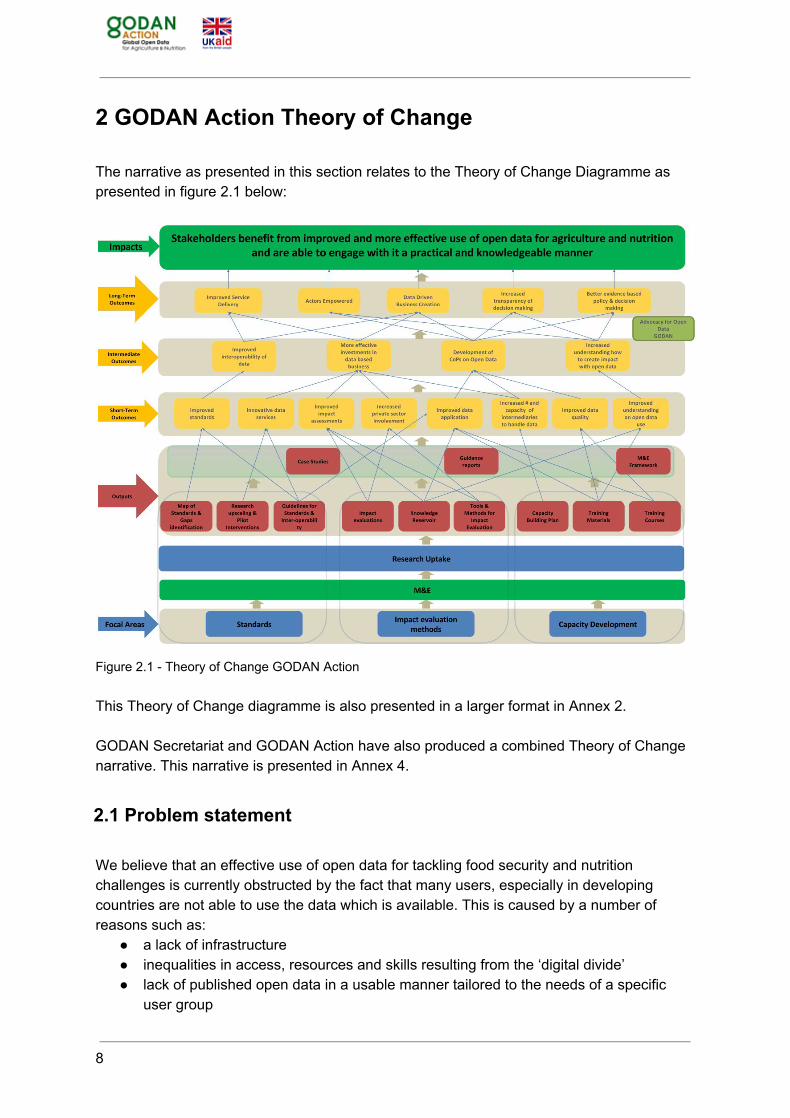
The narrative as presented in this section relates to the Theory of Change Diagramme as presented in figure 2.1 below:
Figure 2.1 - Theory of Change GODAN Action This Theory of Change diagramme is also presented in a larger format in Annex 2. GODAN Secretariat and GODAN Action have also produced a combined Theory of Change narrative. This narrative is presented in Annex 4.
2.1 Problem statement
We believe that an effective use of open data for tackling food security and nutrition challenges is currently obstructed by the fact that many users, especially in developing countries are not able to use the data which is available. This is caused by a number of reasons such as:
● a lack of infrastructure ● inequalities in access, resources and skills resulting from the ‘digital divide’ ● lack of published open data in a usable manner tailored to the needs of a specific
user group
8

● lack of awareness that open data exists ● lack of transparency ● problems with data privacy ● failing citizen engagement.
2.2 High-level impact
The desired impact of GODAN Action is: "Stakeholders benefit from improved and more effective use of open data for agriculture and nutrition and are able to engage with it a practical and knowledgeable manner” The envisioned long term outcomes are:
● improved service delivery by businesses using open data in agriculture and nutrition ● smallholders, Communities of Practice, business and other stakeholders empowered
by being able to access and use open data ● data driven business creation ● increased transparency of decision making by policymakers, since it will be more
clear to the public how these decisions came to be and whether or not they are justified
● better evidence based policy & decision making
2.3 Intermediate level impacts
These long term outcomes can be linked to desired changes at intermediate level (to be achieved during Phase 1 and Phase 2 (approximately 6 years timespan), including:
● improved interoperability of data through providing improved standards and innovative services. This should improve service delivery and enable the creation of data-driven businesses. To attain this outcome, we foresee the development of standards and interoperability specifications (to be identified during M6-M12).
● enabling environment for more effective investments in data based business and better evidence-based policy making, by providing examples of improved tools for impact assessment, as well as by analysing barriers that hinder the full potential of open data initiatives and investments for data publishers, researchers and entrepreneurs.
● Communities of Practice (CoPs) on open data will be created as a result of providing capacity building initiatives targeting intermediaries. The CoP with their increased understanding of open data and how to create impact will stimulate data driven business creation but also better evidence based policy & decision making at the long term.
● increased transparency of decision making, better evidence-based policy making and empowerment of actors which will be the result of an increased understanding on how to create impact with open data. The development of tailored training courses will increase the understanding of stakeholders on how to use and handle open data.
9

Moreover, they will be better capable to understand and influence decision makers because of their increased skills related to and understanding of open data.
2.4 Outputs
In order to achieve the intermediate-level impacts, the project has committed to the following outputs in 3 main focal areas (FA):
● for FA1, improving data interoperability by mapping relevant standards and identifying gap; research upscaling and pilot interventions; development of guidelines for standards and interoperability through an online platform for collaboration and dissemination.
● for FA 2 improving impact assessment by evaluating initiatives aimed at improving agriculture and nutrition; populating a knowledge reservoir with information about relevant methods, tools and use cases for impact evaluation of interventions aiming at triggering innovation.
● for FA3, increasing the understanding of stakeholders by developing a capacity building plan to address bottlenecks in open data use; development of training materials; delivery of training courses and the development of innovative training products.
In order to realise synergy with the overall GODAN initiative, the approach is to design and implement an iterative Research Uptake strategy that makes it possible to collectively learn from and mutually contribute across the three focal areas. The project will devise research uptake and influencing templates and guide a facilitated approach ensuring that each focal area is equipped to articulate how it can contribute to moving the long term outcomes forward. In order to monitor, measure and evaluate the project objectives, an M&E framework will connect the three focal areas and work alongside them, by creating a space for objective reporting and reflection on the project’s progress.
10

3 GODAN LogFrame The LogFrame can be seen as the contract between DFID (as the project sponsor) and the GODAN Action project (as the project contractor).
3.1 Introduction The purpose of a LogFrame is to ensure that: 6
● Ensuring project officers and advisers have all the necessary qualitative and quantitative information needed to be able to monitor progress and measure performance throughout the life of the project.
● DFID has robust qualitative and quantitative information to be able to report to the UK public the results achieved with taxpayers’ funds, to strengthen project management capacity among partners (demonstrating what success looks like), and to provide evidence of progress to stakeholders.
In the process of working on a project, the logframe will help to:
● Achieve stakeholder consensus ● Organise the thinking ● Summarise and link the key aspects and anticipated impact of a project ● Communicate information concisely and unambiguously ● Identify measurable performance indicators and the means of verifying progress.
If used properly, it also:
● Brings together in one place a statement of all key aspects of the project in a systematic, concise and coherent way
● Provides a framework for monitoring and evaluation where planned and actual results can be compared.
3.2 The GODAN LogFrame process Initially the incentive was to base the project's LogFrame solely on the GODAN Action ToC. It would therefore only contain GODAN Action indicators. However, in the project’s kick-off meeting with DFID, DFID expressed a strong preference to combine the existing GODAN Secretariat LogFrame with the new GODAN Action LogFrame, since both initiatives are not only part of the same overarching DFID programme (in the GODAN Business Case document referred to as workstream 1 and 2), but essentially share outcomes and impact. The current LogFrame as presented in Annex 3 is the result of a number of iterations between Work Package 4 and participants in Work Packages 1 to 3, representing the 3 Focal Areas and with GODAN Secretariat. The process of creating this LogFrame started
6 https://www.gov.uk/government/publications/dfid-how-to-note-guidance-on-using-the-revised-logical-framework
11

with adding to the GODAN Secretariat LogFrame, impact, outcome and output indicators, in addition to the indicators which were already listed. The next step was to evaluate to what extend indicators were valid exclusively for GODAN Secretariat and GODAN Action respectively, but also which indicators were shared. This annotated version was distributed amongst the project partners, who were asked to complete the fields related to baseline figures of indicators and estimated figures at the milestone dates of the project. This version of the LogFrame was discussed with DFID in a teleconference. DFID’s main comment was that the LogFrame was getting rather large and that especially the number of outcome indicators was too much. In addition, DFID commented that some of the output indicators were less meaningful in the sense that they were not very good indicators to measure success. DFID made some suggestions especially related to the outcome indicators and the LogFrame was updated taking these comments into account. After a final review and editing round with representatives of the GODAN secretariat, the final version has been updated with the information which was also reported in the GODAn Secretariat only LogFrame, as part of GODAN Secretariat's Annual Review of 2016 to DFID.
3.3 GODAN LogFrame guidance notes As stated in the previous paragraph, some of the indicators are valid exclusively for GODAN Secretariat, some only for GODAN Action, some are shared. The following table 2.1 provides an overview, with additional notes on how these indicators should be measured. This is especially an issue and something to keep in mind with the outcome indicators. Since these are shared, and since the LogFrames purpose is to evaluate if the performance of a project is satisfactory, it should be clear what the contribution to a satisfactory performance from both initiatives is. Table 2.1 GODAN LogFrame indicator overview
Indicator Valid for Clarifying Notes
Impact indicator 1 shared -
Impact indicator 2 Action -
Outcome indicator 1 shared The means of verification should be split up between GODAN Network partners and GODAN Action stakeholders and be clear on this in the survey. Make sure that the respective audiences can be identified.
Outcome indicator 2 shared The figures belonging to the milestones should be different for GODAN secretariat and Action. Both have different audiences. GODAN network has more stakeholders or members than GODAN Action, so height of figures has a different meaning for both initiatives. In “means of verification” it should also be made clear that there is a difference in how GODAN Secretariat or Action contribute to the outcome indicator
12
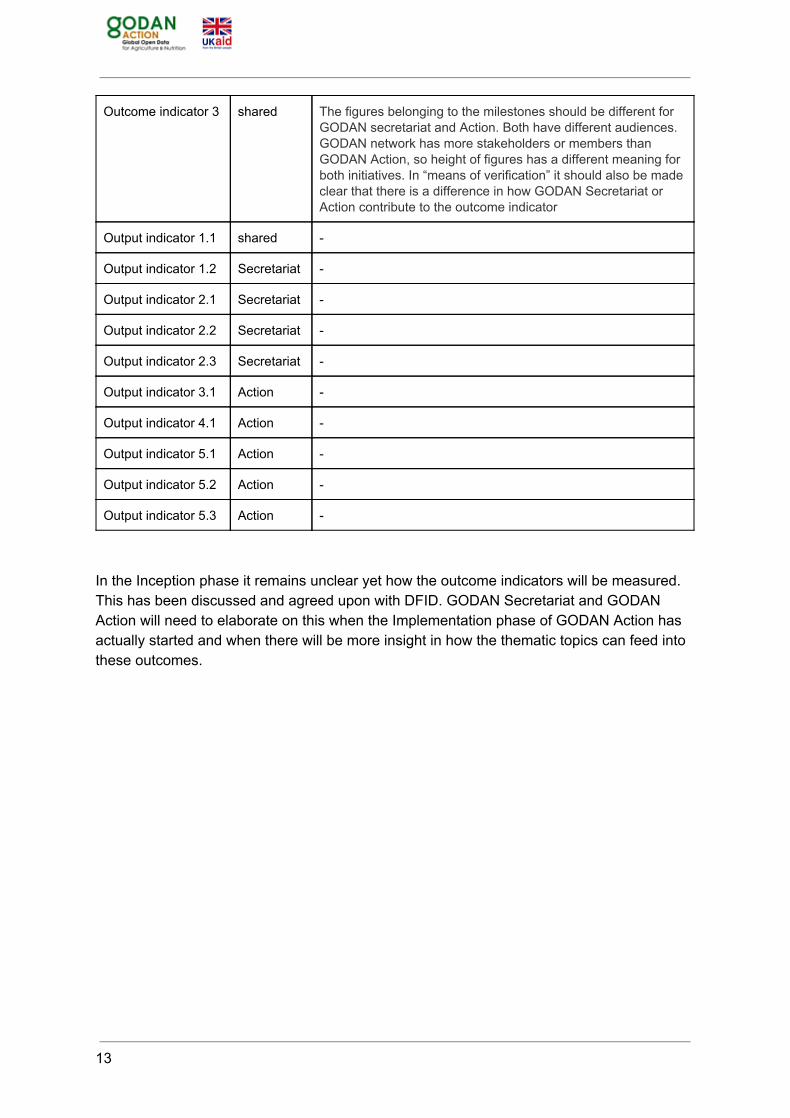
Outcome indicator 3 shared The figures belonging to the milestones should be different for GODAN secretariat and Action. Both have different audiences. GODAN network has more stakeholders or members than GODAN Action, so height of figures has a different meaning for both initiatives. In “means of verification” it should also be made clear that there is a difference in how GODAN Secretariat or Action contribute to the outcome indicator
Output indicator 1.1 shared -
Output indicator 1.2 Secretariat -
Output indicator 2.1 Secretariat -
Output indicator 2.2 Secretariat -
Output indicator 2.3 Secretariat -
Output indicator 3.1 Action -
Output indicator 4.1 Action -
Output indicator 5.1 Action -
Output indicator 5.2 Action -
Output indicator 5.3 Action -
In the Inception phase it remains unclear yet how the outcome indicators will be measured. This has been discussed and agreed upon with DFID. GODAN Secretariat and GODAN Action will need to elaborate on this when the Implementation phase of GODAN Action has actually started and when there will be more insight in how the thematic topics can feed into these outcomes.
13
1
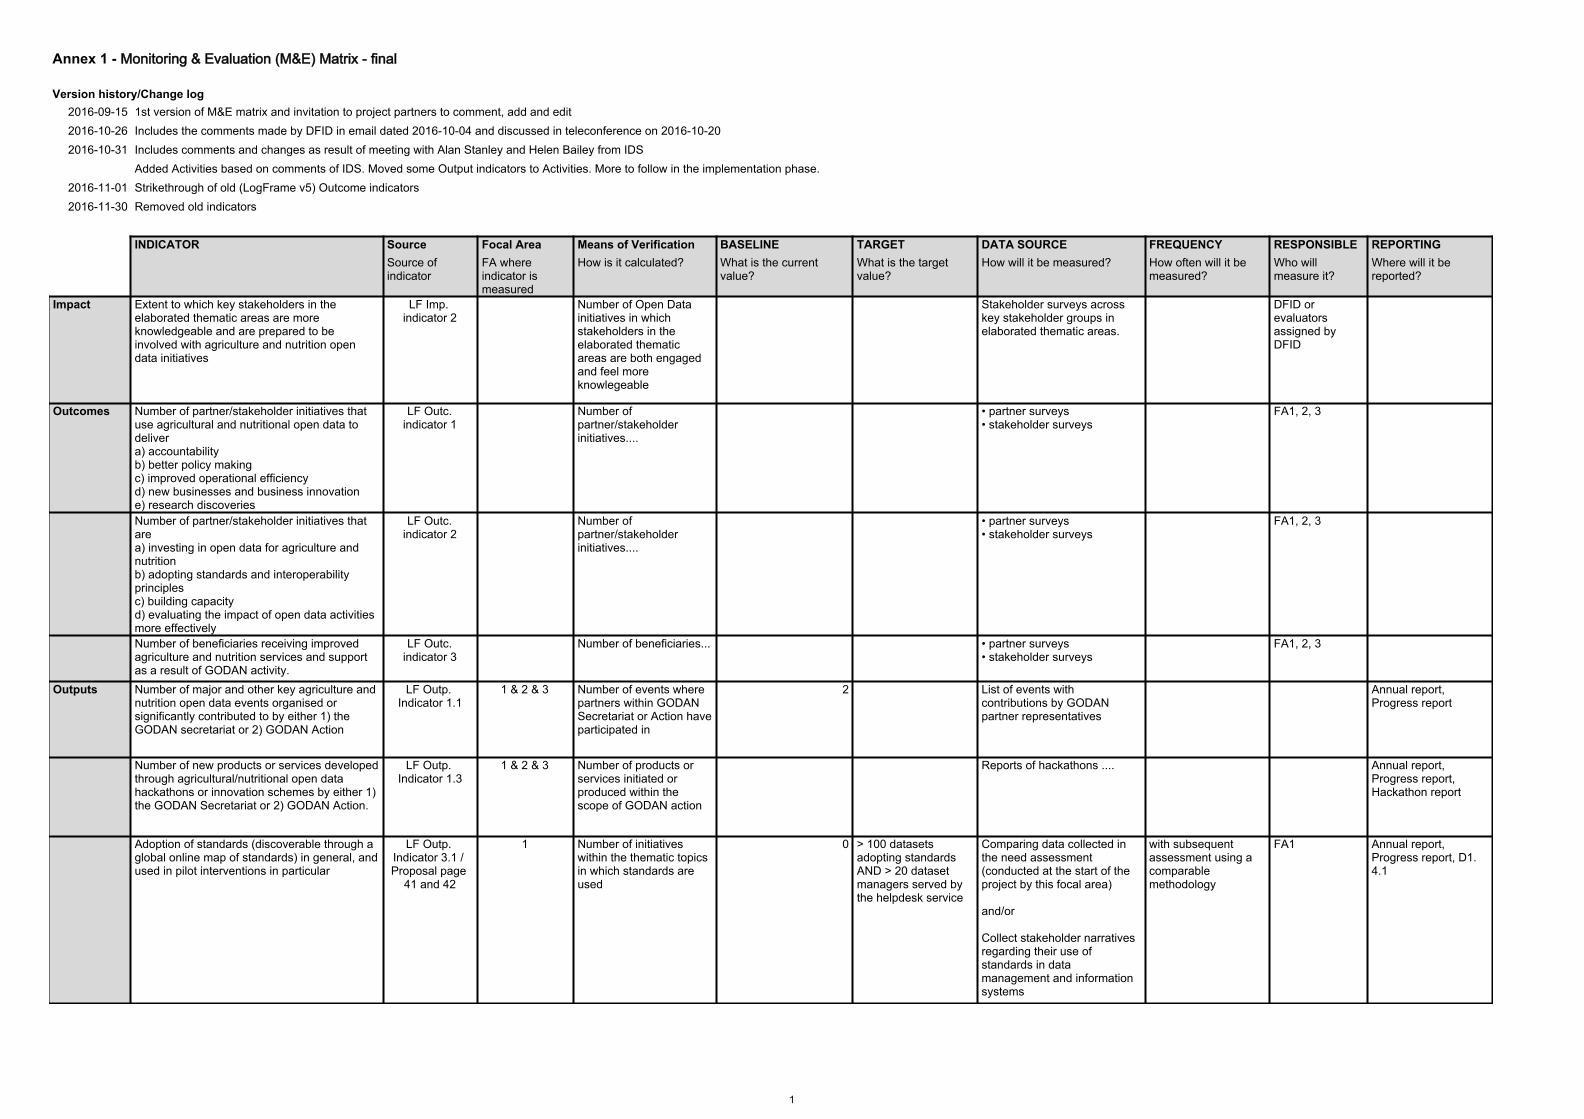
Annex 1 - Monitoring & Evaluation (M&E) Matrix - final
Version history/Change log2016-09-15 1st version of M&E matrix and invitation to project partners to comment, add and edit2016-10-26 Includes the comments made by DFID in email dated 2016-10-04 and discussed in teleconference on 2016-10-20 2016-10-31 Includes comments and changes as result of meeting with Alan Stanley and Helen Bailey from IDS
Added Activities based on comments of IDS. Moved some Output indicators to Activities. More to follow in the implementation phase.2016-11-01 Strikethrough of old (LogFrame v5) Outcome indicators2016-11-30 Removed old indicators
INDICATOR Source Focal Area Means of Verification BASELINE TARGET DATA SOURCE FREQUENCY RESPONSIBLE REPORTING Source of indicator
FA where indicator is measured
How is it calculated? What is the current value?
What is the target value?
How will it be measured? How often will it be measured?
Who will measure it?
Where will it be reported?
Impact Extent to which key stakeholders in the elaborated thematic areas are more knowledgeable and are prepared to be involved with agriculture and nutrition open data initiatives
LF Imp. indicator 2
Number of Open Data initiatives in which stakeholders in the elaborated thematic areas are both engaged and feel more knowlegeable
Stakeholder surveys across key stakeholder groups in elaborated thematic areas.
DFID or evaluators assigned by DFID
Outcomes Number of partner/stakeholder initiatives that use agricultural and nutritional open data to deliver a) accountabilityb) better policy makingc) improved operational efficiencyd) new businesses and business innovatione) research discoveries
LF Outc. indicator 1
Number of partner/stakeholder initiatives....
• partner surveys• stakeholder surveys
FA1, 2, 3
Number of partner/stakeholder initiatives that are a) investing in open data for agriculture andnutritionb) adopting standards and interoperabilityprinciplesc) building capacityd) evaluating the impact of open data activitiesmore effectively
LF Outc. indicator 2
Number of partner/stakeholder initiatives....
• partner surveys• stakeholder surveys
FA1, 2, 3
Number of beneficiaries receiving improved agriculture and nutrition services and support as a result of GODAN activity.
LF Outc. indicator 3
Number of beneficiaries... • partner surveys• stakeholder surveys
FA1, 2, 3
Outputs Number of major and other key agriculture and nutrition open data events organised or significantly contributed to by either 1) the GODAN secretariat or 2) GODAN Action
LF Outp. Indicator 1.1
1 & 2 & 3 Number of events where partners within GODAN Secretariat or Action have participated in
2 List of events with contributions by GODAN partner representatives
Annual report, Progress report
Number of new products or services developed through agricultural/nutritional open data hackathons or innovation schemes by either 1) the GODAN Secretariat or 2) GODAN Action.
LF Outp. Indicator 1.3
1 & 2 & 3 Number of products or services initiated or produced within the scope of GODAN action
Reports of hackathons .... Annual report, Progress report, Hackathon report
Adoption of standards (discoverable through a global online map of standards) in general, and used in pilot interventions in particular
LF Outp. Indicator 3.1 / Proposal page
41 and 42
1 Number of initiatives within the thematic topics in which standards are used
0 > 100 datasets adopting standards AND > 20 dataset managers served by the helpdesk service
Comparing data collected in the need assessment (conducted at the start of the project by this focal area)
and/or
Collect stakeholder narratives regarding their use of standards in data management and informationsystems
with subsequent assessment using a comparable methodology
FA1 Annual report, Progress report, D1.4.1

2
INDICATOR Source Focal Area Means of Verification BASELINE TARGET DATA SOURCE FREQUENCY RESPONSIBLE REPORTING Source of indicator
FA where indicator is measured
How is it calculated? What is the current value?
What is the target value?
How will it be measured? How often will it be measured?
Who will measure it?
Where will it be reported?
Number of standards documented and discoverable through a global online map of standards (indicator is a measure of completeness, not of success)
Proposal page 42
1 Number of relevant standards
The "GODAN Action" map of standards
FA1 Annual report, Progress report, D1.1.1
Use of the online database of existing standards relevant to food and agricultural data
Proposal page 42
1 Number of visitors/number of downloads
• Website statistics• conducting some qualitativeanalysis on the activity withinthe helpdesk facility
Continuously FA1 Annual report, Progress report, D1.3.1
Increased awareness and adoption of existing standards
relates to LF Output indicator 3.1, Research
Uptake Strategy
1 Increased awareness of where to find information on standardsIncreased awareness of what standards existIncreased sign-posting of the Map of Standards as a source
Will need to be set by baseline survey
Survey of open data publishers and aggregators. Web analystics, search and social media tracking
Annually FA1, 4? Research Uptake monitoring template
Nr. of impact evaluations performed and documented (by GODAN Action or by independent stakeholders/communities, initiated/guided by GODAN Action)
LF Outp. Indicator 4.1 / proposal page
42
2 0 8 • citation data• interviews with keystakeholders in the field
FA2 Annual report, Progress report, D2.2.2
Accessibility of the research produced Proposal page 42
1 & 2 & 3 Number of visitors/number of downloads
• Website statistics• Citations
Continuously FA1, 2 ,3 Annual report, Progress report
Collaboration between Open Data standards initiatives
Proposal page 42
1 ?? Documenting initiatives FA1 Annual report, Progress report, D1.3.1
Nr. of integrated methods (including the involved metrics) for impact evaluation provided
Proposal page 32
2 0 3 Assessment of metrics and methods collected and/or developed and pubished by GODAN Action
FA2 Annual report, Progress report, D2.2.1
Nr of on-line accessions of the knowledge reservoir
Proposal page 45
2 Access and # downloads of knowledge reservoir
0 5000 accessions/year500 downloads/year
Logfiles from application (website statistics?)
Continuously FA2 Annual report, Progress report, D2.2.2
Effectiveness of investments in Open Data Proposal page 42
2 tbd 0 • Stakeholder surveys• Follow up interviews
FA2 Annual report, Progress report
Quality of analysis of available evidence Proposal page 42
2 tbd 0 Stakeholder feedback FA2 Annual report, Progress report
Number of people that have benefited from the delivery of capacity development activities ( e.g. online, face2face,seminars, workshops)
LF Outp. Indicator 5.1
3 Total number of people (direct and indirect beneficiaries) trained
35 300 List of attendants and communities represented at capacity building events
every 12 months FA3 Annual report, Progress report, D3.4.1
Level and diversity of participation in capacity buidling needs assessment
relates to LF Outp. Indicator 5.1, Research
Uptake Strategy
3 From user needs survey 1 Total survey responses. Analysis of responses on role, instiutional and geographic spread of survey participants
One-off as part of needs assessment survey
FA3, 4 Research Uptake monitoring template

3
INDICATOR Source Focal Area Means of Verification BASELINE TARGET DATA SOURCE FREQUENCY RESPONSIBLE REPORTING Source of indicator
FA where indicator is measured
How is it calculated? What is the current value?
What is the target value?
How will it be measured? How often will it be measured?
Who will measure it?
Where will it be reported?
Number of intermediaries that are making use of data tools
LF Outp. Indicator 5.2
3 35 300 • feedback survey• reports• project statistics
every 12 months FA3 Annual report, Progress report
Level of alignment and buy-in of GODAN Capacity Development Working Group members with Capacity Development Action Plan
Result of Research
Uptake Workshop
3 Partners and CDWG members support delivery of the Action Plan and participate in the delivery of trainings
9 Collect examples of promoting and sharing the plan themselves. Number of trainings delivered by partners and CDWG members on Action Plan priority topics.
FA3, 4 Research Uptake monitoring template
Increased quality of open data trainings delivered by GODAN CDWG members attributable to the Capacity Development Action Plan and learning from process of producing the plan and conducting needs assessment
Result of research Uptake
Workshop
3 Increased quality of trainings. Increased number of trainings in priority topics identified in the CD PlanBetter quality of design of other capacity development projects
Shares, views etc. Collect case studies of use? Survey of CDWG?Shares, views, citations. Collect examples of learning being applied in design of other CD projects. Survey of CDWG?
Once in year 2 or 3 FA3, 4 Research Uptake monitoring template
Number of CoPs created as a result of capacity development activities
Proposal page 48
3 Number of CoPs created during lifetime of the project
1 3 List of CoPs created every 12 months FA3 Annual report, Progress report, D3.2.2
Increased or better use of Open Data by alumni
Proposal page 42
3 Number of narratives Collecting narratives FA3 Annual report, Progress report
Assess capacity of alumni Proposal page 42
3 Utility of training and changes in their approach and use of Open Data [1]
75 • Feedback questionnaires• Follow up interviews
FA3 Annual report, Progress report
Activities Percentage of standards documented and discoverable through a global online map of standards
Proposal page 41, 42
1 Percentage of relevant standards
74 (VEST Registry) perceived 90% coverage
The "GODAN Action" map of standards
every 12 months FA1 Annual report, Progress report, D1.1.1
Number of standardization guidelines and interoperability specifications for the improvement of standards
Proposal page 41, 42
1 Number of guidelines and specifications
0 3 guidelines documents for three thematic topics; 2 technical specification for vocabulary interoperability
Delivery of guidelines and specifications documents
every 12 months FA1 Annual report, Progress report, D1.2.2
Media products:number of articles,booklets, brochures, video production and innovative training products developed as a result of capacity development activities and uploaded through the GODAN Action and GODAN capacity development working group webpages
LF Outp. Indicator 5.3
3 Number of media products
7 30 Total number of media products developed and uploaded through the GODAN Action and GODAN capacity development working group webpages
every 12 months FA3 Annual report, Progress report, D3.1.3, D3.3.2

Annex 2 - Theory of Change (ToC) - final
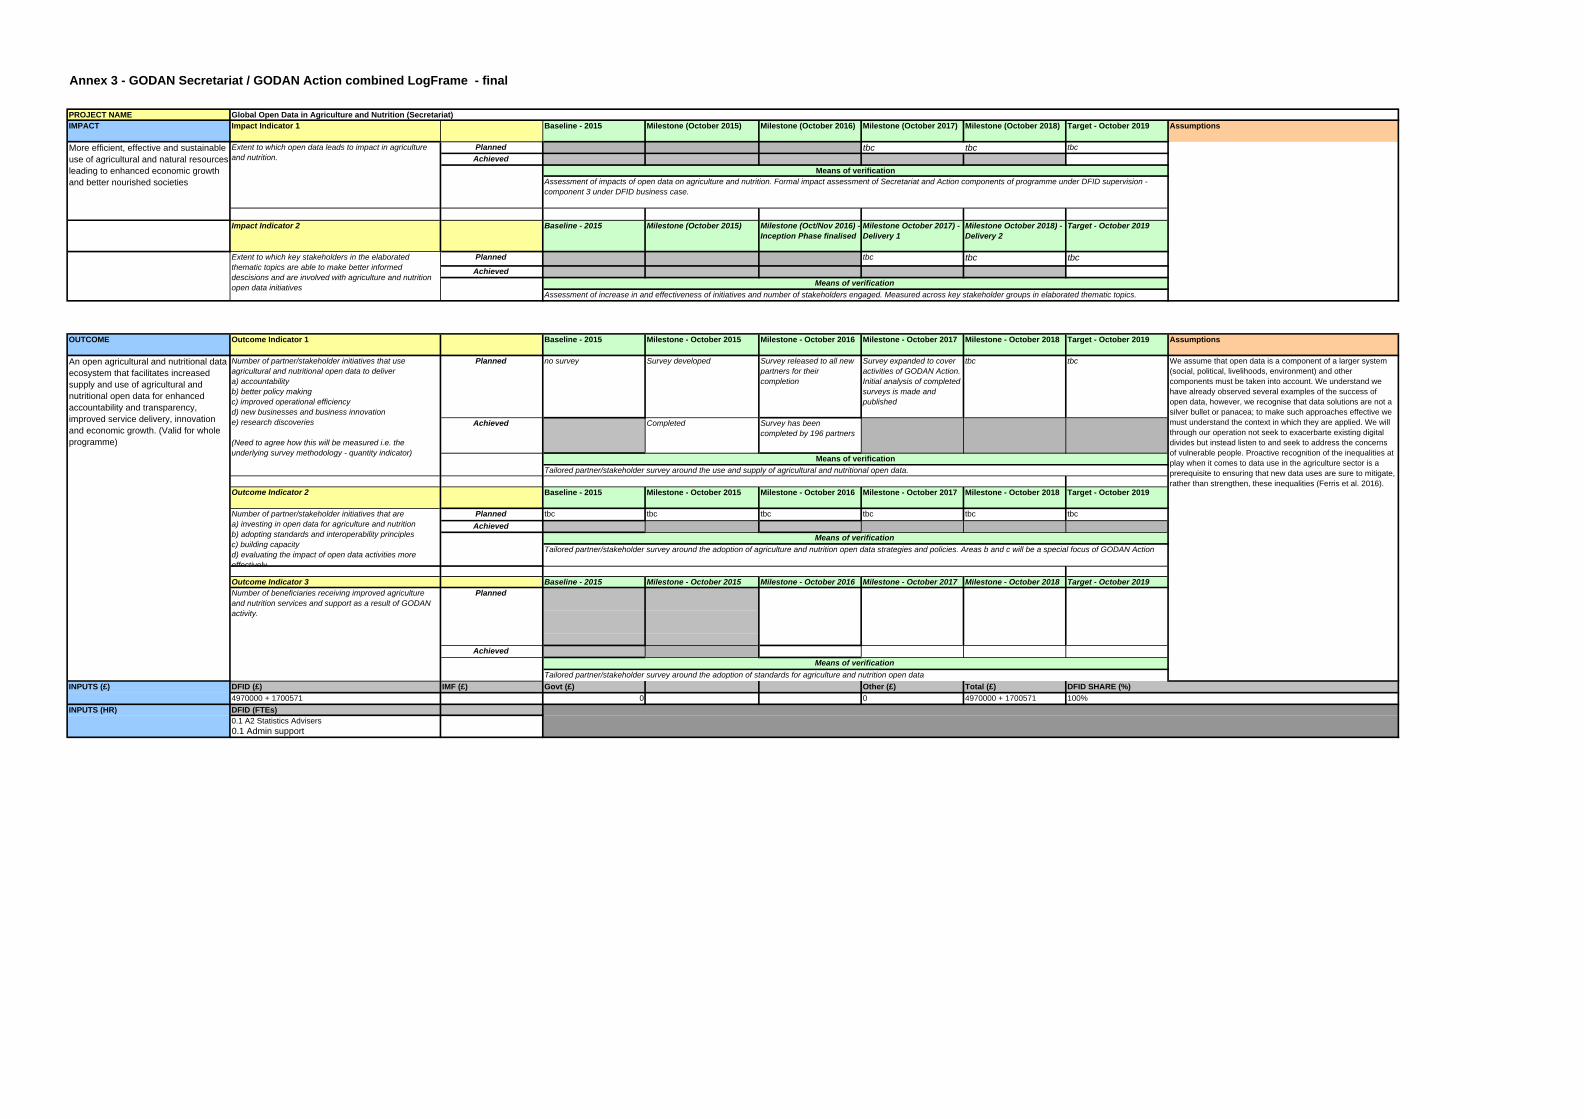
Annex 3 - GODAN Secretariat / GODAN Action combined LogFrame - final
PROJECT NAMEIMPACT Impact Indicator 1 Baseline - 2015 Milestone (October 2015) Milestone (October 2016) Milestone (October 2017) Milestone (October 2018) Target - October 2019 Assumptions
Planned tbc tbc tbcAchieved
Impact Indicator 2 Baseline - 2015 Milestone (October 2015) Milestone (Oct/Nov 2016) - Inception Phase finalised
Milestone October 2017) - Delivery 1
Milestone October 2018) - Delivery 2
Target - October 2019
Planned tbc tbc tbcAchieved
OUTCOME Outcome Indicator 1 Baseline - 2015 Milestone - October 2015 Milestone - October 2016 Milestone - October 2017 Milestone - October 2018 Target - October 2019 Assumptions
Achieved Completed Survey has been completed by 196 partners
Outcome Indicator 2 Baseline - 2015 Milestone - October 2015 Milestone - October 2016 Milestone - October 2017 Milestone - October 2018 Target - October 2019
Planned tbc tbc tbc tbc tbc tbcAchieved
Outcome Indicator 3 Baseline - 2015 Milestone - October 2015 Milestone - October 2016 Milestone - October 2017 Milestone - October 2018 Target - October 2019
Achieved
DFID (£) IMF (£) Govt (£) Other (£) Total (£)4970000 + 1700571 0 0 4970000 + 1700571DFID (FTEs)0.1 A2 Statistics Advisers0.1 Admin support
Global Open Data in Agriculture and Nutrition (Secretariat)
Assessment of increase in and effectiveness of initiatives and number of stakeholders engaged. Measured across key stakeholder groups in elaborated thematic topics.
More efficient, effective and sustainable use of agricultural and natural resources leading to enhanced economic growth and better nourished societies
An open agricultural and nutritional data ecosystem that facilitates increased supply and use of agricultural and nutritional open data for enhanced accountability and transparency, improved service delivery, innovation and economic growth. (Valid for whole programme)
INPUTS (HR)
INPUTS (£)
Extent to which open data leads to impact in agriculture and nutrition.
Extent to which key stakeholders in the elaborated thematic topics are able to make better informed descisions and are involved with agriculture and nutrition open data initiatives
Number of partner/stakeholder initiatives that use agricultural and nutritional open data to deliver a) accountabilityb) better policy makingc) improved operational efficiencyd) new businesses and business innovatione) research discoveries
(Need to agree how this will be measured i.e. the underlying survey methodology - quantity indicator)
Assessment of impacts of open data on agriculture and nutrition. Formal impact assessment of Secretariat and Action components of programme under DFID supervision - component 3 under DFID business case.
Means of verification
PlannedNumber of beneficiaries receiving improved agriculture and nutrition services and support as a result of GODAN activity.
Number of partner/stakeholder initiatives that are a) investing in open data for agriculture and nutritionb) adopting standards and interoperability principlesc) building capacityd) evaluating the impact of open data activities more effectively
tbc We assume that open data is a component of a larger system (social, political, livelihoods, environment) and other components must be taken into account. We understand we have already observed several examples of the success of open data, however, we recognise that data solutions are not a silver bullet or panacea; to make such approaches effective we must understand the context in which they are applied. We will through our operation not seek to exacerbarte existing digital divides but instead listen to and seek to address the concerns of vulnerable people. Proactive recognition of the inequalities at play when it comes to data use in the agriculture sector is a prerequisite to ensuring that new data uses are sure to mitigate, rather than strengthen, these inequalities (Ferris et al. 2016).
Means of verification
Planned
Tailored partner/stakeholder survey around the use and supply of agricultural and nutritional open data.Means of verification
Means of verification
DFID SHARE (%)
no survey Survey developed Survey released to all new partners for their completion
Survey expanded to cover activities of GODAN Action. Initial analysis of completed surveys is made and published
Tailored partner/stakeholder survey around the adoption of agriculture and nutrition open data strategies and policies. Areas b and c will be a special focus of GODAN ActionMeans of verification
100%
tbc
Tailored partner/stakeholder survey around the adoption of standards for agriculture and nutrition open data
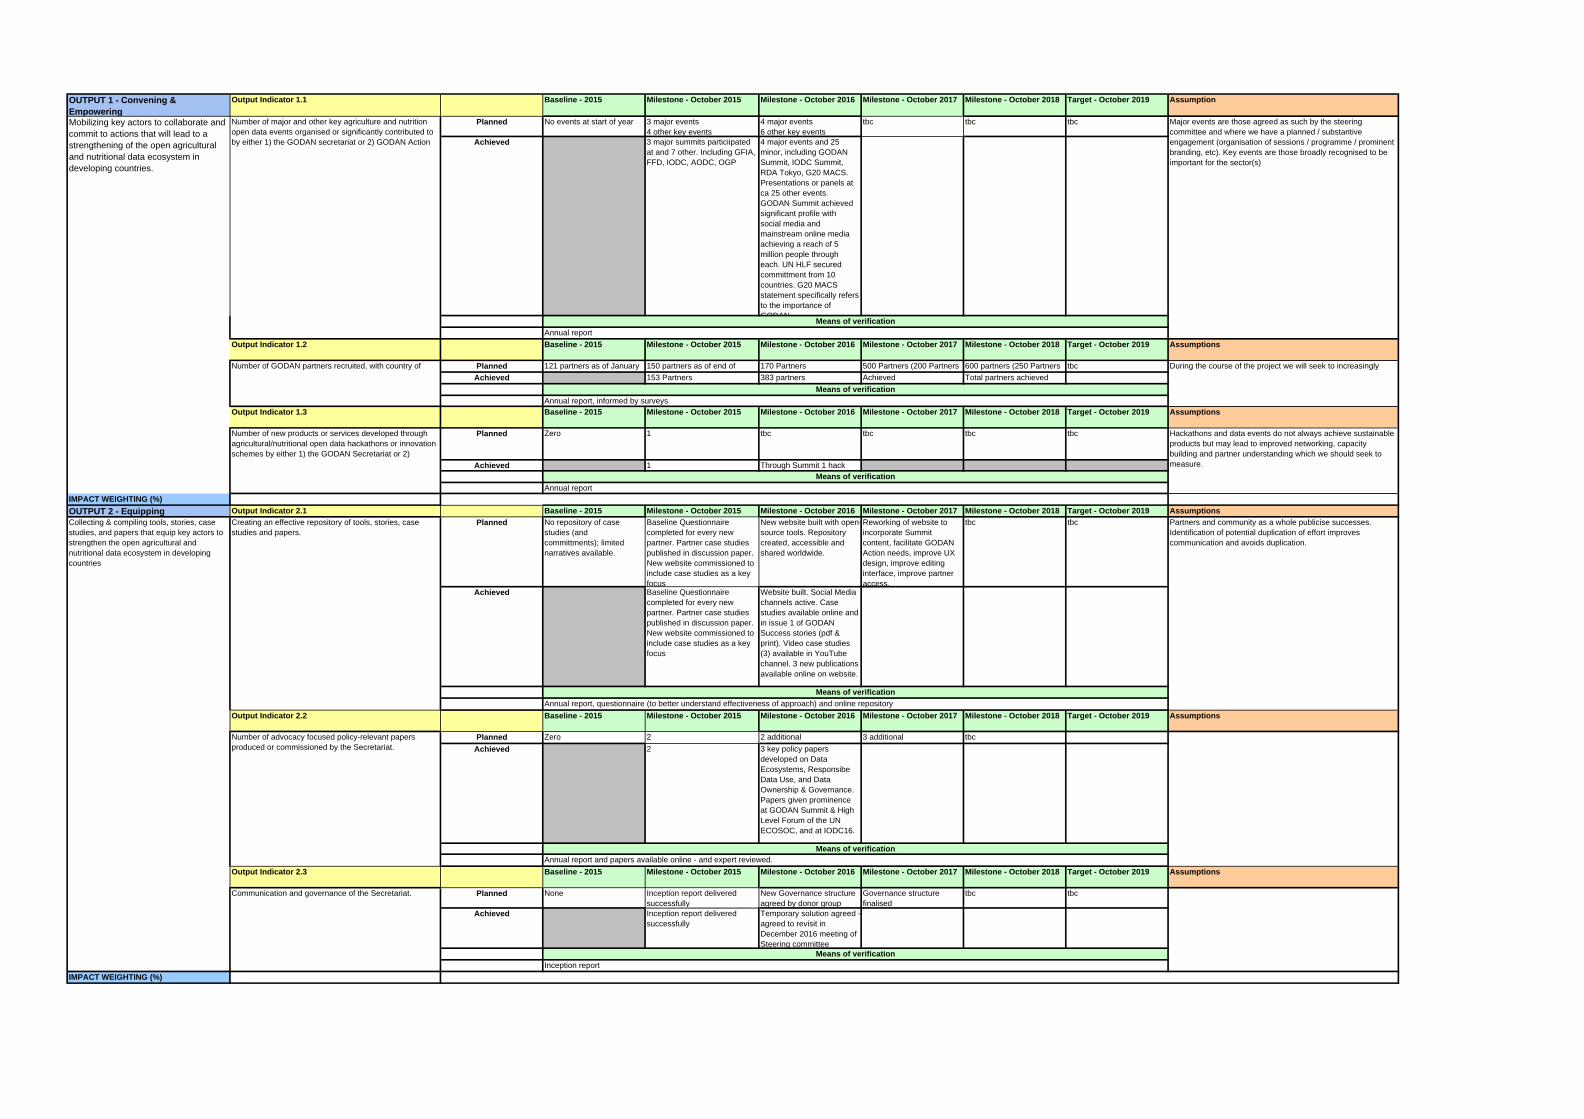
OUTPUT 1 - Convening & Empowering
Output Indicator 1.1 Baseline - 2015 Milestone - October 2015 Milestone - October 2016 Milestone - October 2017 Milestone - October 2018 Target - October 2019 Assumption
Planned No events at start of year 3 major events4 other key events
4 major events6 other key events
tbc tbc tbc
Achieved 3 major summits particiipated at and 7 other. Including GFIA, FFD, IODC, AODC, OGP
4 major events and 25 minor, including GODAN Summit, IODC Summit, RDA Tokyo, G20 MACS. Presentations or panels at ca 25 other events. GODAN Summit achieved significant profile with social media and mainstream online media achieving a reach of 5 million people through each. UN HLF secured committment from 10 countries. G20 MACS statement specifically refers to the importance of GODAN
Output Indicator 1.2 Baseline - 2015 Milestone - October 2015 Milestone - October 2016 Milestone - October 2017 Milestone - October 2018 Target - October 2019 Assumptions
Number of GODAN partners recruited, with country of Planned 121 partners as of January 150 partners as of end of 170 Partners 500 Partners (200 Partners 600 partners (250 Partners tbc During the course of the project we will seek to increasingly Achieved 153 Partners 383 partners Achieved Total partners achieved
Output Indicator 1.3 Baseline - 2015 Milestone - October 2015 Milestone - October 2016 Milestone - October 2017 Milestone - October 2018 Target - October 2019 Assumptions
Number of new products or services developed through agricultural/nutritional open data hackathons or innovation schemes by either 1) the GODAN Secretariat or 2)
Planned Zero 1 tbc tbc tbc tbc
Achieved 1 Through Summit 1 hack
IMPACT WEIGHTING (%)OUTPUT 2 - Equipping Output Indicator 2.1 Baseline - 2015 Milestone - October 2015 Milestone - October 2016 Milestone - October 2017 Milestone - October 2018 Target - October 2019 Assumptions
Planned No repository of case studies (and committments); limited narratives available.
Baseline Questionnaire completed for every new partner. Partner case studies published in discussion paper. New website commissioned to include case studies as a key focus
New website built with open-source tools. Repository created, accessible and shared worldwide.
Reworking of website to incorporate Summit content, facilitate GODAN Action needs, improve UX design, improve editing interface, improve partner access.
tbc tbc
Achieved Baseline Questionnaire completed for every new partner. Partner case studies published in discussion paper. New website commissioned to include case studies as a key focus
Website built. Social Media channels active. Case studies available online and in issue 1 of GODAN Success stories (pdf & print). Video case studies (3) available in YouTube channel. 3 new publications available online on website.
Output Indicator 2.2 Baseline - 2015 Milestone - October 2015 Milestone - October 2016 Milestone - October 2017 Milestone - October 2018 Target - October 2019 Assumptions
Planned Zero 2 2 additional 3 additional tbcAchieved 2 3 key policy papers
developed on Data Ecosystems, Responsibe Data Use, and Data Ownership & Governance. Papers given prominence at GODAN Summit & High Level Forum of the UN ECOSOC, and at IODC16.
Output Indicator 2.3 Baseline - 2015 Milestone - October 2015 Milestone - October 2016 Milestone - October 2017 Milestone - October 2018 Target - October 2019 Assumptions
Planned None Inception report delivered successfully
New Governance structure agreed by donor group
Governance structure finalised
tbc tbc
Achieved Inception report delivered successfully
Temporary solution agreed - agreed to revisit in December 2016 meeting of Steering committee
IMPACT WEIGHTING (%)
Mobilizing key actors to collaborate and commit to actions that will lead to a strengthening of the open agricultural and nutritional data ecosystem in developing countries.
Collecting & compiling tools, stories, case studies, and papers that equip key actors to strengthen the open agricultural and nutritional data ecosystem in developing countries
Number of major and other key agriculture and nutrition open data events organised or significantly contributed to by either 1) the GODAN secretariat or 2) GODAN Action
Number of advocacy focused policy-relevant papers produced or commissioned by the Secretariat.
Creating an effective repository of tools, stories, case studies and papers.
Annual report and papers available online - and expert reviewed.Means of verification
Annual report, questionnaire (to better understand effectiveness of approach) and online repository
Annual report
Means of verification
Inception reportMeans of verification
Communication and governance of the Secretariat.
Partners and community as a whole publicise successes. Identification of potential duplication of effort improves communication and avoids duplication.
Hackathons and data events do not always achieve sustainable products but may lead to improved networking, capacity building and partner understanding which we should seek to measure.
Means of verification
Means of verificationAnnual report, informed by surveys
Major events are those agreed as such by the steering committee and where we have a planned / substantive engagement (organisation of sessions / programme / prominent branding, etc). Key events are those broadly recognised to be important for the sector(s)
Annual reportMeans of verification

OUTPUT 3 - Standards Output Indicator 3.1 Baseline - 2015 Milestone - October 2015 Milestone - October 2016 Milestone - October 2017 Milestone - October 2018 Target - October 2019 Assumptions
Global agricultural open data quality Planned None -- 0 > 20 datasets adopting > 50 datasets adopting standards AND > 20 Achieved None --
IMPACT WEIGHTING (%)OUTPUT 4 - Impact evaluation methods
Output Indicator 4.1 Baseline - 2015 Milestone - October 2015 Milestone - October 2016 Milestone - October 2017 Milestone - October 2018 Target - October 2019 Assumptions
Planned -- -- 0 1 3 8Achieved -- --
IMPACT WEIGHTING (%)OUTPUT 5 - Capacity building Output Indicator 5.1 Baseline - 2015 Milestone - October 2015 Milestone - October 2016 Milestone - October 2017 Milestone - October 2018 Target - October 2019 Assumptions
Planned -- -- 35 100 200 300 direct beneficiaries ( 2 per year training events) /
Achieved -- -- 100
Output Indicator 5.2 Baseline - 2015 Milestone - October 2015 Milestone - October 2016 Milestone - October 2017 Milestone - October 2018 Target - October 2019 Assumptions
Planned -- -- 35 100 200 300Achieved -- --
Output Indicator 5.3 Baseline - 2015 Milestone - October 2015 Milestone - October 2016 Milestone - October 2017 Milestone - October 2018 Target - October 2019 AssumptionsPlanned -- -- 5 10 20 30
Achieved -- --
IMPACT WEIGHTING (%)
Building the capacities of the stakeholders to understand the potential of open agricultural/nutrition data
New metrics and methods developed to generate new evidence onwhat works in open data and how toassess impact
Total number of people (direct and indirect beneficiaries) trained through capacity development activitiesMeans of verification
Means of verificationAssessment of GODAN Action evaluations + targeted survey of stakeholders that use metrics and methods independently
Means of verificationMonitor gap analysis section on "adoption" (for each standard there is a question on adoption) > the map will link standards to adopters. Monitor the analytics from the helpdesk
A certain number of dataset managers put some effort on improving their datasets adopting standards
Adoption of standards (discoverable through a global online map of standards) in general, and used in pilot interventions in particular
Number of impact evaluations performed and documented (by GODAN Action, or by independent stakeholders/communities initiated/guided by GODAN Action)
Media products: number of articles, booklets, brochures, videos and innovative training products developed as a result of capacity development activities and uploaded through the GODAN Action programme and the GODAN capacity development working group webpages
Number of intermediaries (in Community of Practice) that are making use of open data tools as a result of GODAN Action interventions
Number of people that have benefited from the delivery of capacity development activities (including e.g. online, face2face,seminars, workshops)
Means of verificationfeedback survey, reports, project statistics
Total number of media products developed and uploaded through the GODAN Action and GODAN capacity development working group webpagesMeans of verification

Annex 4 - GODAN Secretariat/GODAN Action combined Theory of Change narrative

GODAN Secretariat and Action - Combined Theory of Change
narrative
Part of Deliverable no: D4.3.1
21 November 2016
Deliverable title GODAN Secretariat and Action Combined Theory of Change narrative
Month of Delivery M6
Authors Onno Roosenschoon (Wageningen Environmental Research) Martin Parr, Ruthie Musker (GODAN Secretariat)
Date 21 November 2016
Version information
Version Date Changes
1.0 5 September 2016 1st version with relevant sections of both ToCs brought together in 1 document
2.0 21 November 2016 More elaborated version using GODAN Action deliverable template
2

Summary
This document aims to outline, in narrative form, the combined Theory of Change for the GODAN Secretariat and the GODAN Action initiatives.
This Theory of Change was prepared for the GODAN secretariat by Liz Carolan of the Open Data Institute April 2015, ([email protected]) and edited and supplemented by the Secretariat in June and August 2015, and again with GODAN Action in October and November 2016. It is a living document and will continue to be subject to discussion.
3
Table of contents
1 GODAN Secretariat and Action Combined Theory of Change 5
1.1 Our vision for the world 5
1.1.1 High-level Impacts 5
1.1.2 Intermediate-level impacts 5
1.2 Making this vision a reality 6
1.3 Creating an ecosystem of these actors requires... 6
1.4 What GODAN therefore exists to do... 7
1.5 To do this we will... 7
4
1 GODAN Secretariat and Action Combined Theory of
Change
1.1 Our vision for the world
(Impact - what the broader GODAN network is collectively working towards)
1.1.1 High-level Impacts
We are a group of actors working towards a world where the value chain for agriculture and nutrition is more efficient, innovative, equitable (e.g. by gender, socioeconomic status) and accountable; from, for example, greater yields and access to markets for farmers, through to more nutritious and safe food on plates.
We believe that improving the open availability, use and enrichment of data, and meaningful engagement with stakeholders will enable this vision.
We observe that the agriculture and food sector currently suffers from information asymmetries and closed data practices that limit progress, value generation and the fair distribution of resources. Open data has already been shown in some parts of the value chain, and in other sectors, to enable impacts through:
1.1.2 Intermediate-level impacts
● Data-driven decision making, innovation and business creation ● Improved service delivery ● New, improved and more accessible information products, empowering individuals,
businesses and communities ● Increased transparency of decision making and accountability ● Increased access to data in disadvantaged constituencies that is already available to
actors in well resourced contexts ● Increased interoperability of data ● Improved understanding of impact of open data
5
● Improved understanding of stakeholders on how to use and handle open data
1.2 Making this vision a reality
(Logic - the problem GODAN is set up to solve)
Realising this vision requires an immensely complex system of actors from diverse fields, specialisations, jurisdictions and sectors of the economy acting individually and, importantly, in concert. They need to feel and function as parts of a network/ movement/ “ecosystem”. We will proactively seek to address gender balance in our engagement.
1.3 Creating an ecosystem of these actors requires...
(GODAN Secretariat Outcomes)
1. A common vision, agenda and set of objectives held by the community/ network members
2. An overarching enabling policy, political and technical environment at the national, and international level (e.g. commitments to publishing data, commitments to funding for innovation and projects on open data for agri projects etc.)
3. Network effects (strong connections and alliances) from having time to meet, speak and build relationships that cross sectoral, geographic and thematic boundaries
(GODAN Action Outcomes)
1. Adoption of standards & interoperability by GODAN partners and stakeholders in assessed themes
2. Capacity building focused on better and more effective use of open data 3. Increased capacity to predict and evaluate the impact of open data initiatives
(through development and application of new methods)
(Shared outcomes)
1. Shared tools and methods and evidence base for activities - assets, policy and advocacy messages, activity/ data maps, case studies
6

1.4 What GODAN therefore exists to do...
(Secretariat Outputs - what the GODAN secretariat can do)
GODAN Secretariat exists to convene, equip and empower the network of actors, especially high level actors.
1. Convening the ecosystem: bring key actors together as members of the GODAN network, providing space for conversations, priority setting collaboration and ideas at events, showcases and data hacks.
2. Equipping the ecosystem: collect & compile tools, stories, case studies, and papers 3. Empowering the ecosystem: advocating for high level political and policy actions that
enable action on the ground; that unlock greater data availability, that create public commitments from key actors, and that create space/funds for innovation/ activities for men and women.
(GODAN Action Outputs - what GODAN Action can do)
GODAN Action exists to build understanding of the open data ecosystem and to develop practical models for improvements in the capacity of network actors from policy to value chain to farmer.
1. Map and identify gaps in standards, and improve interoperability 2. Build measures of impact for use in assessment by others as a result of
understanding of what works 3. Build capacity to address bottlenecks in open data use. Develop training materials
and deliver innovative training.
1.5 To do this we will...
(Secretariat activities against which indicators will be developed)
● Organise events - convene member events, showcases, hackathons etc. with at least one large partner event per year and several smaller events (including side-events) organised by partners with some secretariat input.
7

● Create tools and intellectual assets - collect and publish discussion papers, case studies, narratives, mapping exercises.
● Own the vision for GODAN (and its Statement of Purpose), and promote and grow the network, broadening the partner base and stimulating participation in partner organisations.
● High level advocacy / lobbying for an enabling data, policy and political environment through direct policy engagement, exploitation of event and working group opportunities, use of champions and network contacts, and media engagement.
● Create a professional, resourced secretariat, capable of delivering the above, liaising with steering mechanisms, and monitoring the results of own activity through use of surveys and records of partner engagement and activity of partners, and media tracking.
(GODAN Action activities against which indicators will be developed)
● Improving data interoperability by mapping relevant standards and identifying gaps; research upscaling and pilot interventions; development of guidelines for standards and interoperability through an online platform for collaboration and dissemination.
● Improving impact assessment by evaluating initiatives aimed at improving agriculture and nutrition; populating a knowledge reservoir with information about relevant methods, tools and use cases for impact evaluation of interventions aiming at triggering innovation.
● Increasing the understanding of stakeholders by developing a capacity building plan to address bottlenecks in open data use; development of training materials; delivery of training courses and the development of innovative training products.
In order to realise synergies within the overall GODAN initiative, the approach will be to design and implement an iterative Research Uptake strategy that makes it possible to collectively learn from and mutually contribute across focal areas.
8