Embed Size (px)
Citation preview
GOCE OBSERVATIONS FOR DETECTING UNKNOWN TECTONIC
FEATURESBRAITENBERG C. (1), MARIANI P. (1), REGUZZONI M. (2), USSAMI N. (3)
(1) Department of Geosciences, University of Trieste, Trieste ( ITALY), (2) Geophysics of the Lithosphere Department - OGS, c/o Politecnico di Milano - Polo
Regionale di Como, Como, Italy(3) Departamento de Geofisica, Instituto de Astronomia, Geofísica e Ciências Atmosféricas,
Universidade de São Paulo, São Paulo, Brasil
Home page: http://www2.units.it/~braitenberg/e-mail: [email protected]
Goal
• Locate density changes in Earth’s crust• Crustal parameters necessary for:
– Exploration purposes– Seismic risk estimation– Volcanic risk estimation
• Remote and unaccessible areas: superficial properties known• gravity study useful geophysical means of investigation
TOPIC
• Sensitivity analysis of GOCE for tectonic structures
• Model: spherical shell of variable density or thickness
• Input: simulated GOCE degree error curve • Rms error of tensor components at satellite
height• Error curves of existing gravity field models
(EGM2008)
DENSITY AND TECTONICS
• GOCE measures gravity and gravity gradient• -> sensitive to tectonic structures with density
changes. • -> structures without density change are
transparent• -> GOCE only: upper limit of degree N=200;
tectonic structures greater than /2 l min= 100 km
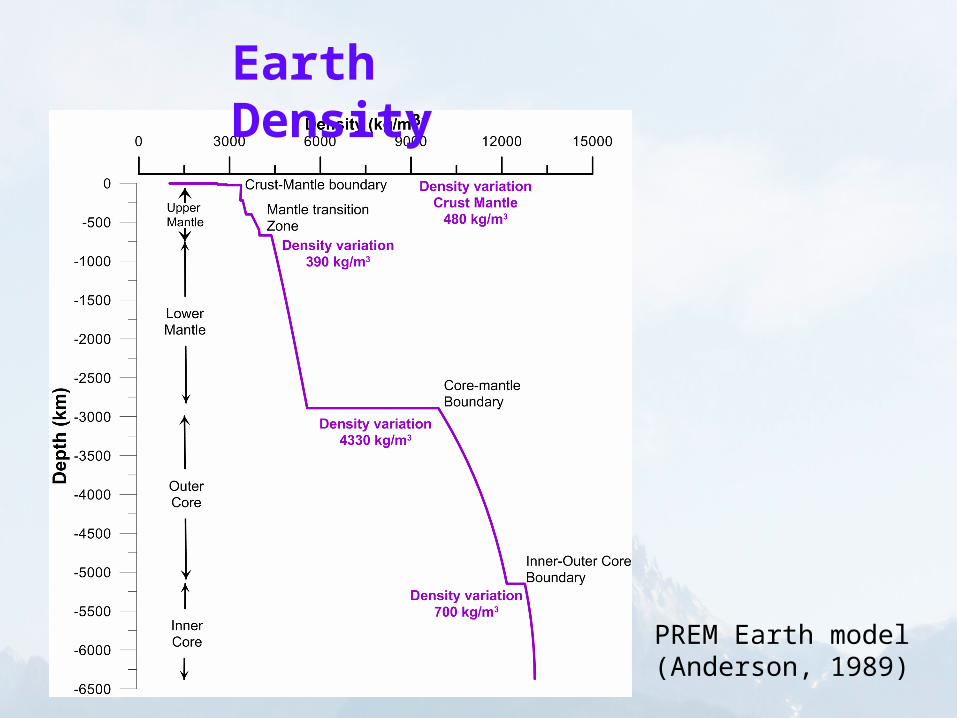
PREM Earth model (Anderson, 1989)
Earth Density
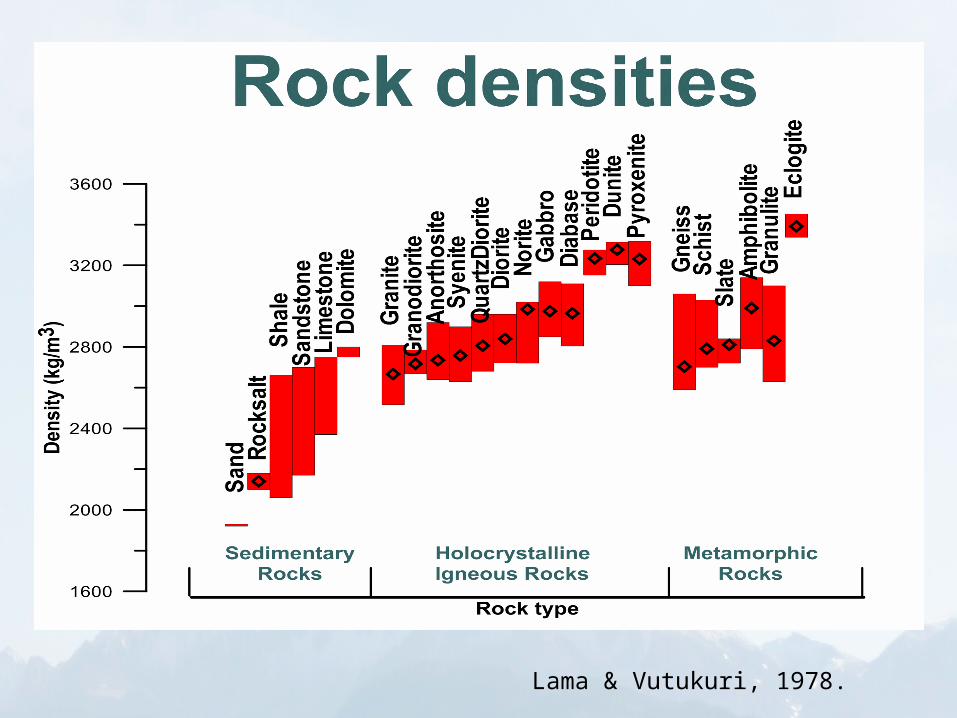
Lama & Vutukuri, 1978.
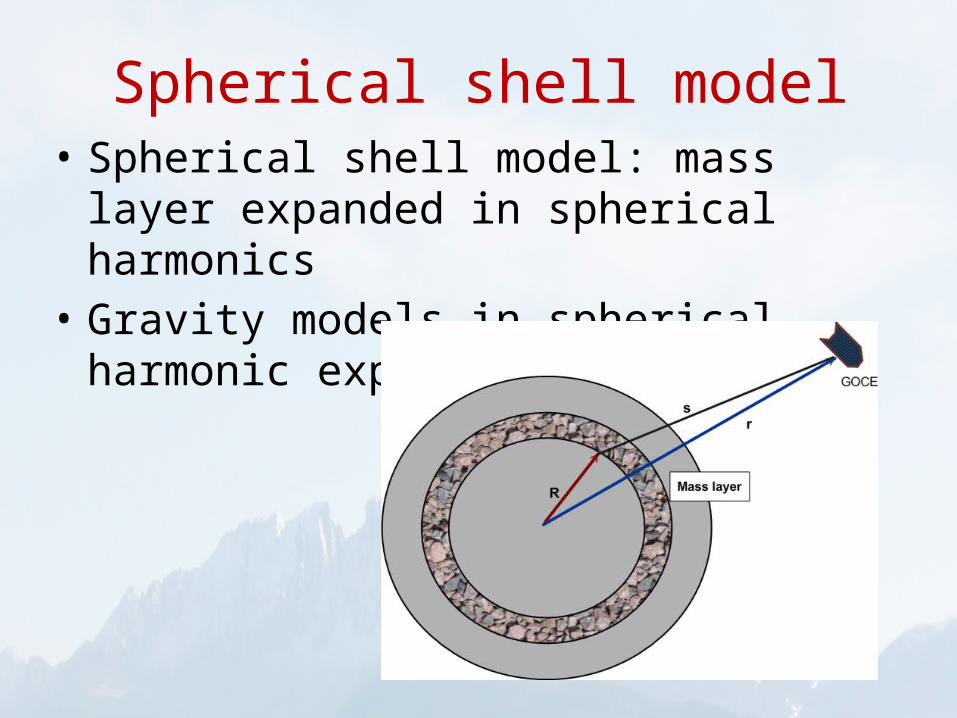
Spherical shell model• Spherical shell model: mass layer expanded in
spherical harmonics• Gravity models in spherical harmonic
expansion
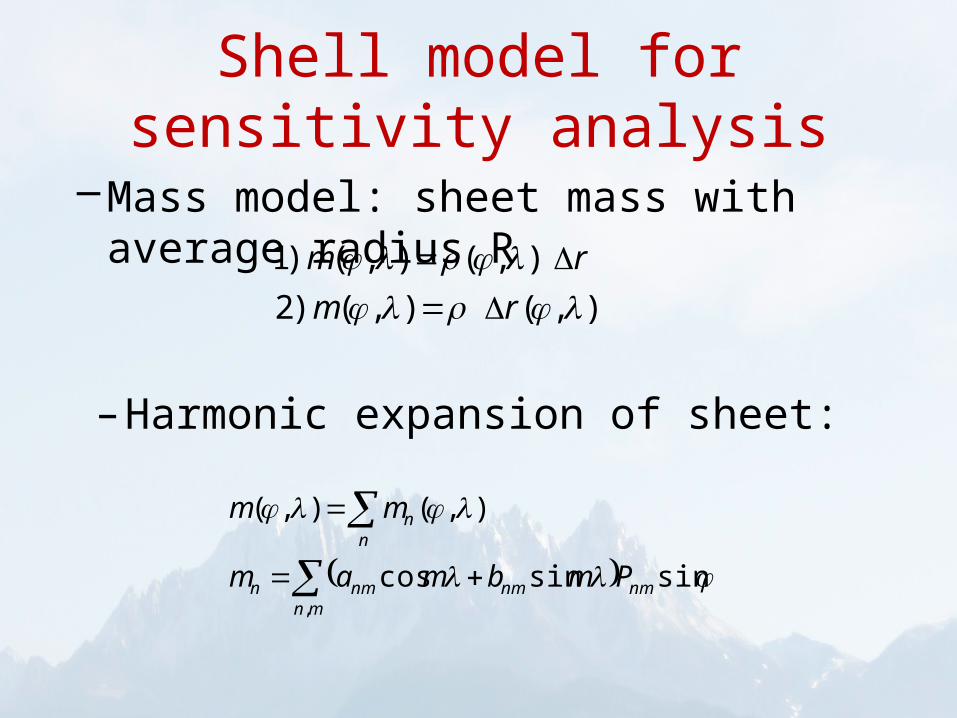
Shell model for sensitivity analysis
– Harmonic expansion of sheet:
sinsincos
),(),(
,nm
mnnmnmn
nn
Pmbmam
mm
–Mass model: sheet mass with average radius R
),(),()2
),(),()1
rm
rm
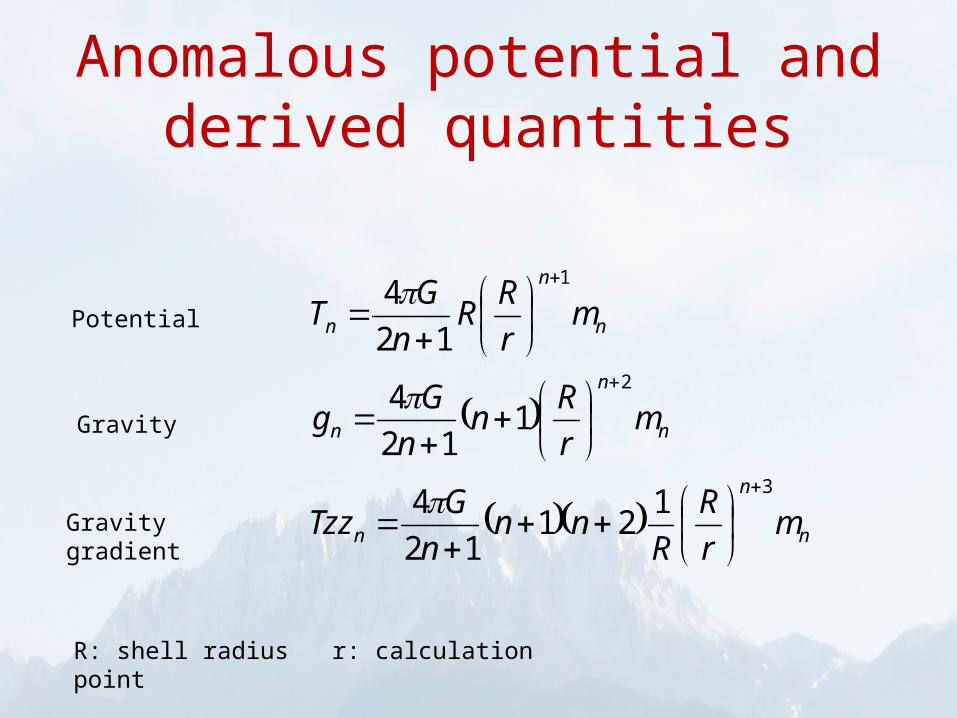
Anomalous potential and derived quantities
n
n
n
n
n
n
n
n
n
mr
R
Rnn
n
GTzz
mr
Rn
n
Gg
mr
RR
n
GT
3
2
1
121
12
4
112
4
12
4
Potential
Gravity
Gravity gradient
R: shell radius r: calculation point
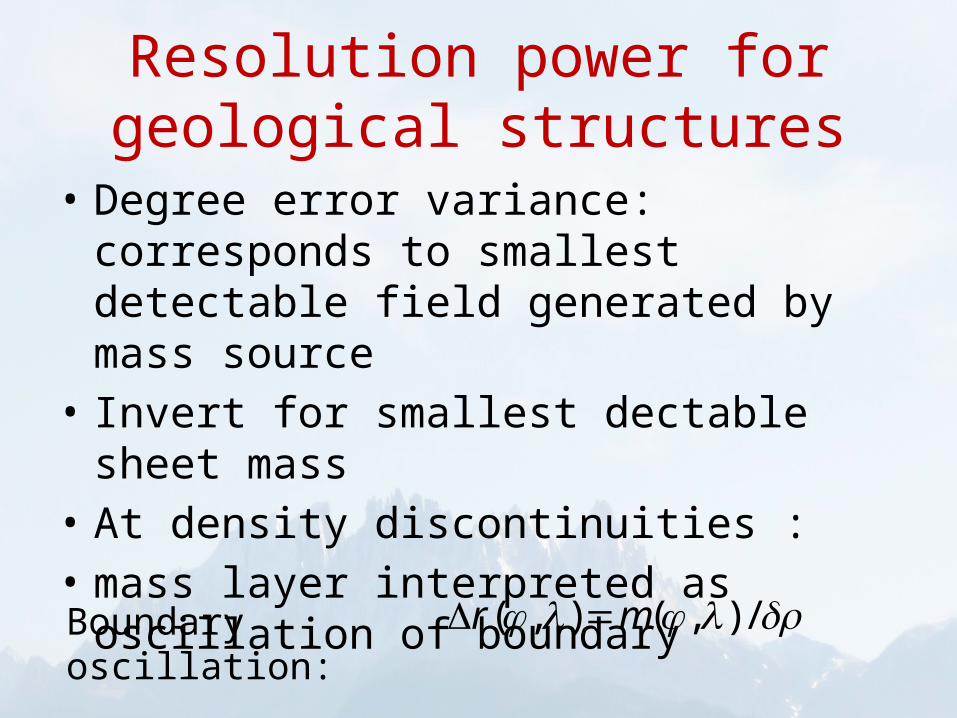
Resolution power for geological structures
• Degree error variance: corresponds to smallest detectable field generated by mass source
• Invert for smallest dectable sheet mass• At density discontinuities : • mass layer interpreted as oscillation of
boundary
/),(),( mr Boundary oscillation:
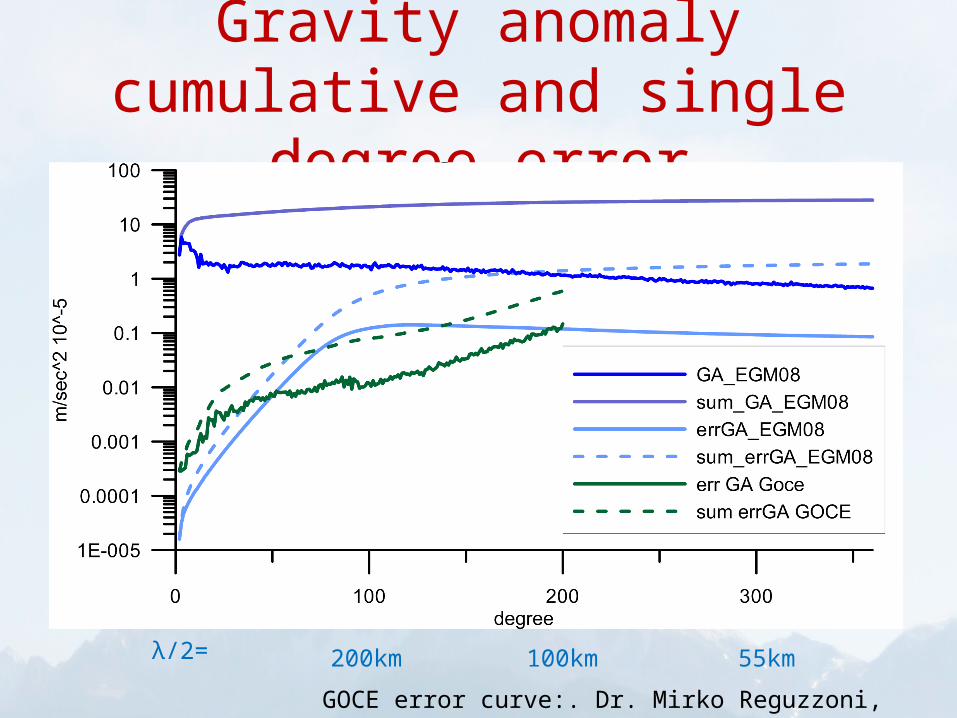
Gravity anomaly cumulative and single degree error
55km200km 100kmλ/2=
GOCE error curve:. Dr. Mirko Reguzzoni, POLIMI & OGS
Invert degree error curves
• Mass-Layer: Crust-Mantle discontinuity • We set: average depth (30 to 70 km) and
density contrast across boundary (500 kg/m3)• We find: minimum decetable oscillation
amplitude of boundary.
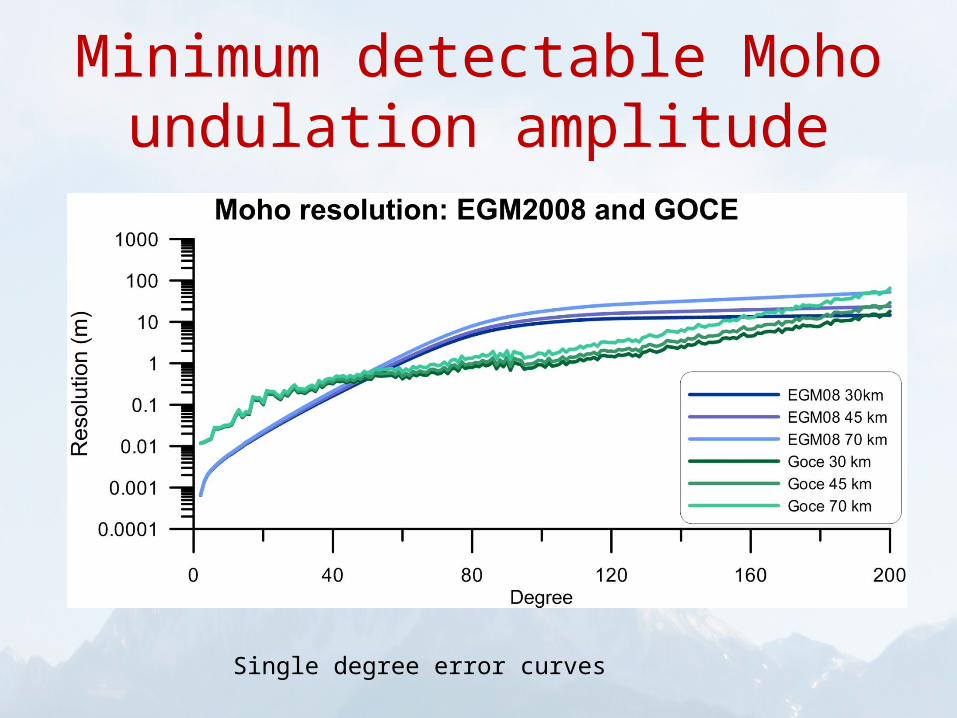
Minimum detectable Moho undulation amplitude
Single degree error curves
GOCE improvement
• Up to one order of magnitude improvement for degree range 52 to 200
• Average depth important.• Greater depth with reduced resolution• Depth depends on geodynamic context:
Craton (45 km), High topography (up to 70 km), normal crust: 35 km
Basement resolution
• Mass layer represents basement - sediment transition
• Average depth 0 km to 10 km• Density contrast: greatly variable• Sediments follow exponential density increase
due to compaction
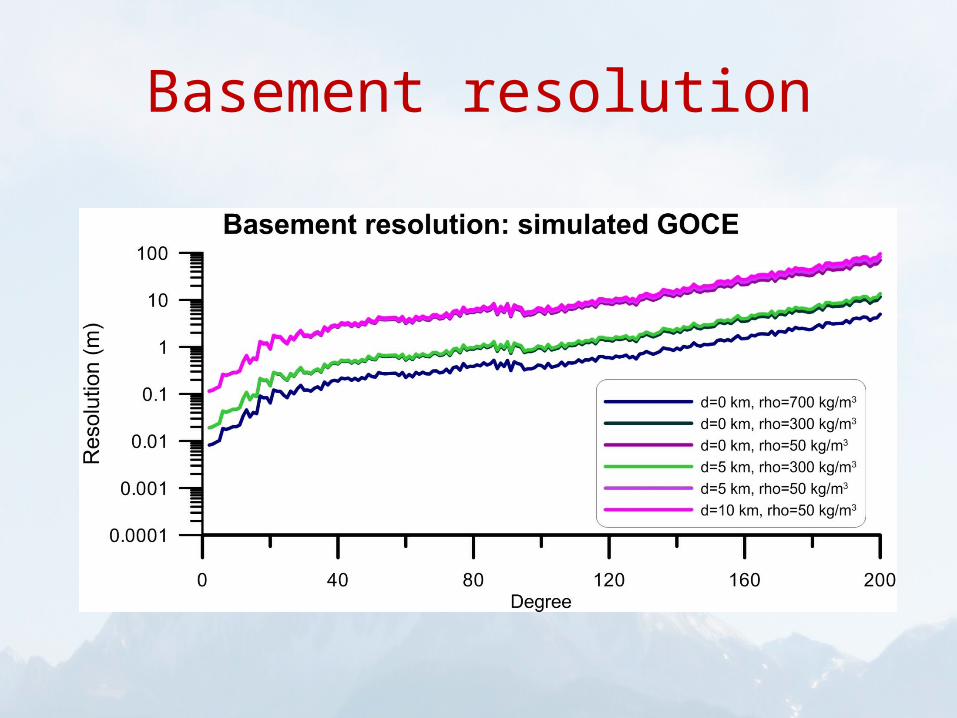
Basement resolution
GOCE resolution
• Single degree error curves give meter level resolution
• Basement depth not important• Density contrast predominant effect
GOCE Gradient measurements
• Use tensor components at satellite height
• Infer crustal density variations• Question: how does sensitivity
compare to sensitivity of airborne gravity?
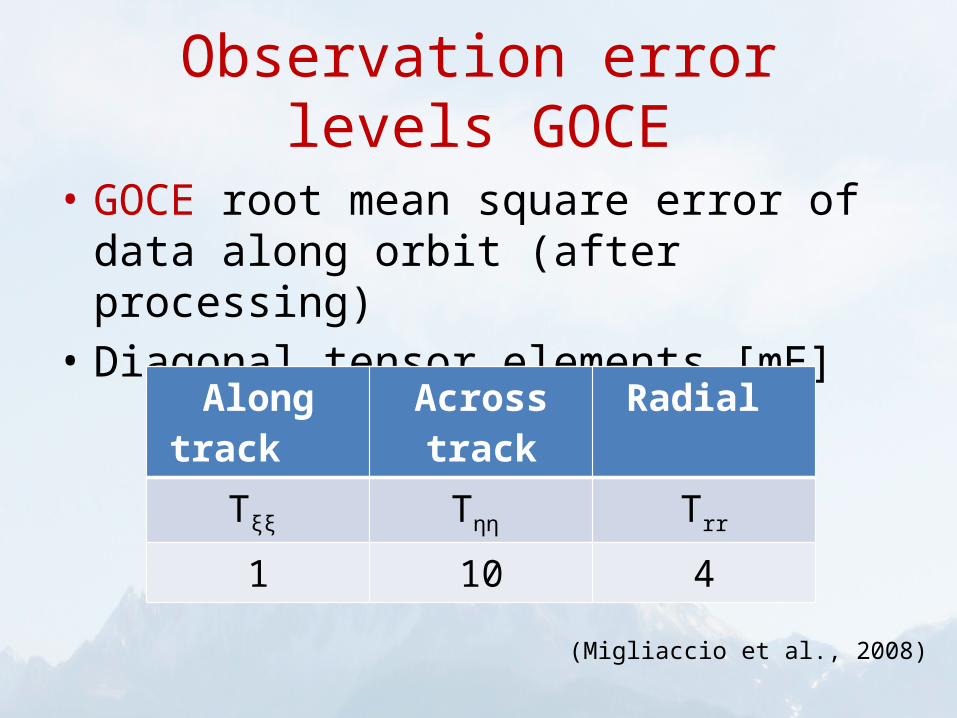
Observation error levels GOCE
• GOCE root mean square error of data along orbit (after processing)
• Diagonal tensor elements [mE]
Along track Across track Radial Tξξ Tηη
Trr
1 10 4
(Migliaccio et al., 2008)
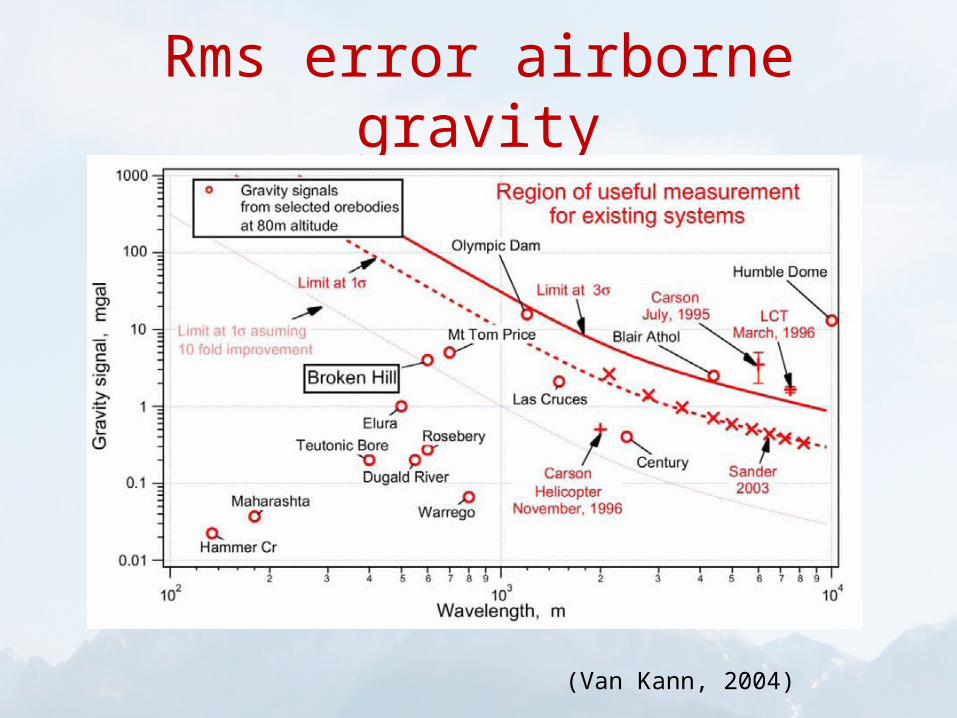
Rms error airborne gravity
(Van Kann, 2004)
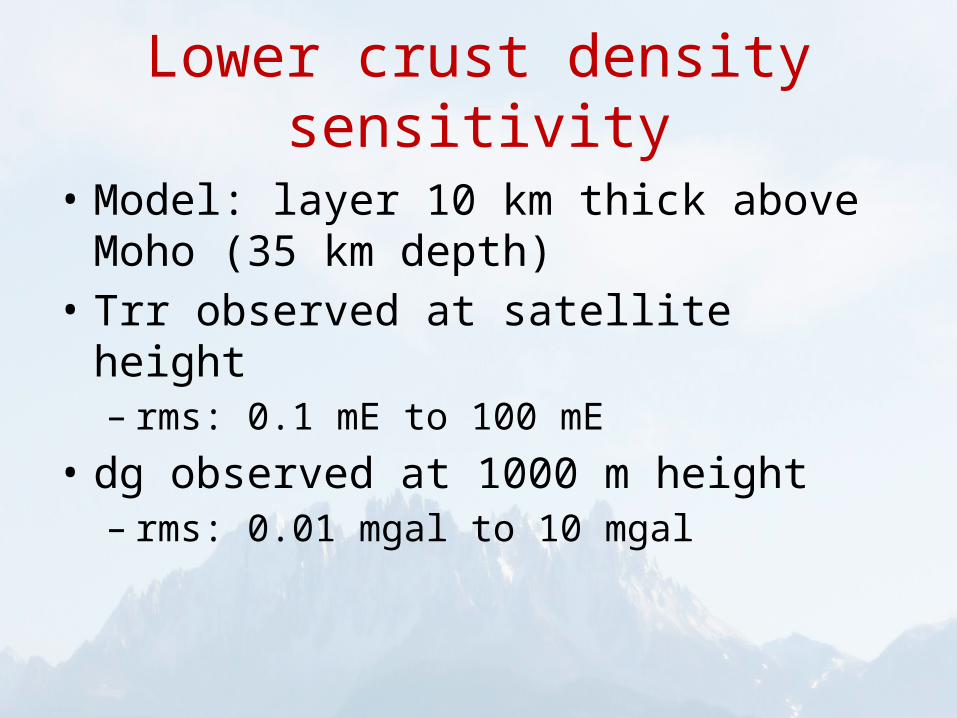
Lower crust density sensitivity
• Model: layer 10 km thick above Moho (35 km depth)
• Trr observed at satellite height– rms: 0.1 mE to 100 mE
• dg observed at 1000 m height– rms: 0.01 mgal to 10 mgal
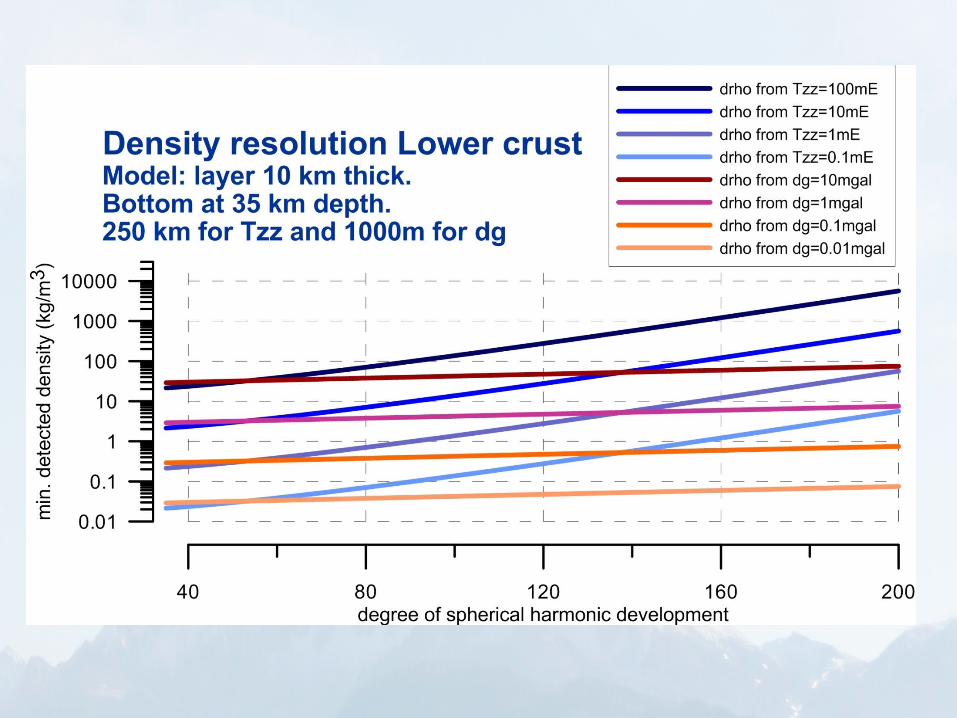
Sensitivity density lower crust
• rms of 1 mgal at 1000m has comparable sensitivity with 1mE rms at satellite height (at wavelengths of 170 km)
• GOCE sensitivity competes with aerogravity surveys
• Sensitivity for GOCE better at longer wavelengths
Example Tibetan crust
• Terrestrial data are scarce and lacking in Himalaya
• Tibetan plateau and Tarim basin contain spectral components accessible to GOCE
• Further investigation is needed of crustal densities
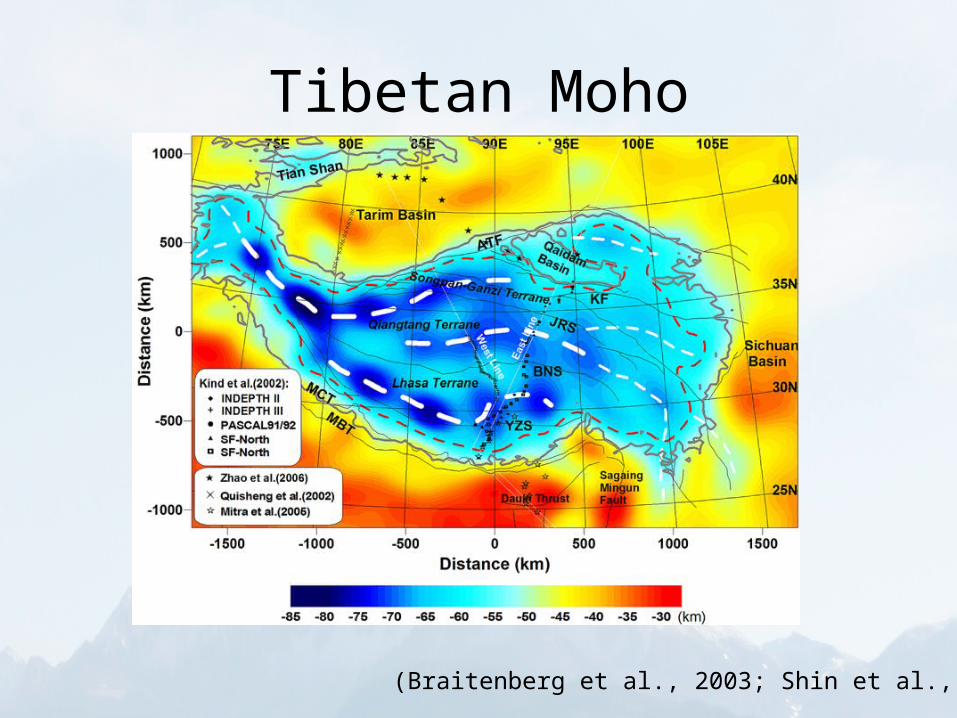
Tibetan Moho
(Braitenberg et al., 2003; Shin et al., 2009)
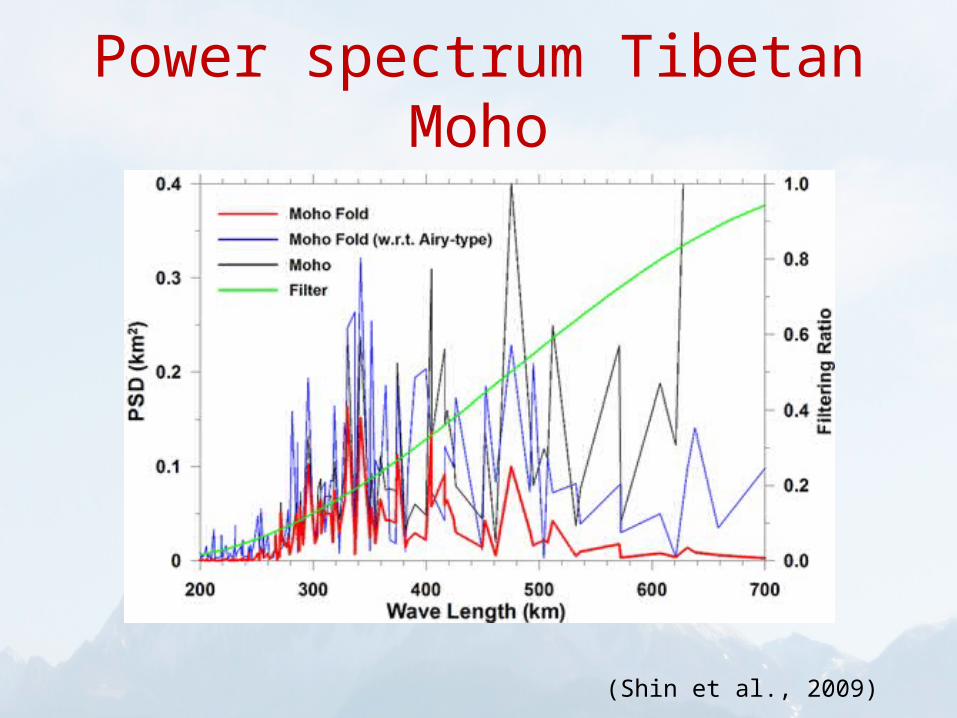
Power spectrum Tibetan Moho
(Shin et al., 2009)
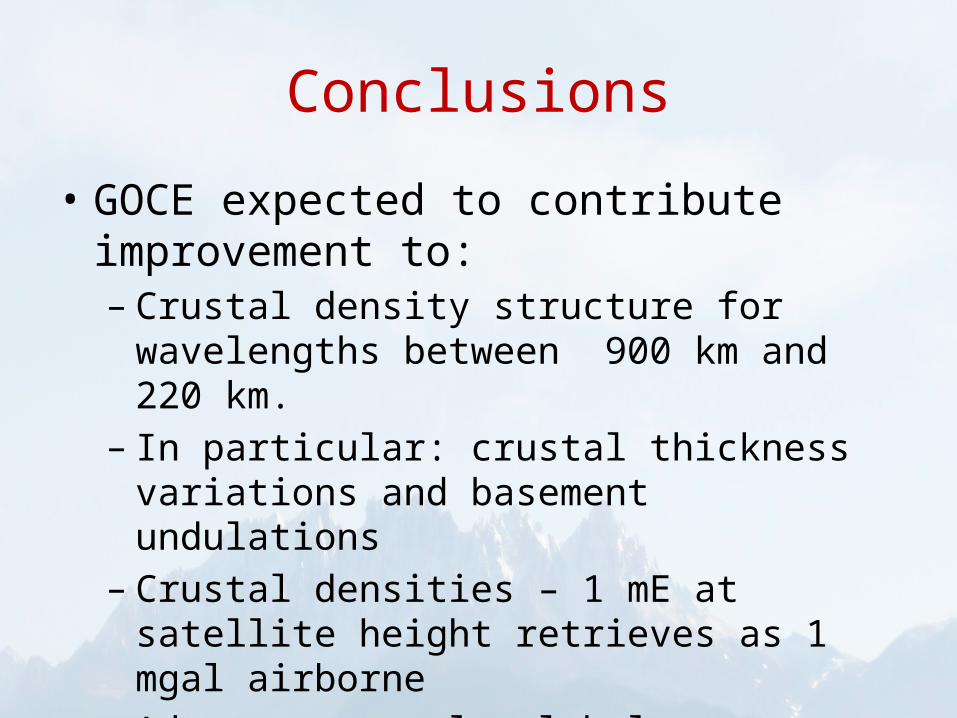
Conclusions
• GOCE expected to contribute improvement to:– Crustal density structure for wavelengths between
900 km and 220 km.– In particular: crustal thickness variations and
basement undulations– Crustal densities – 1 mE at satellite height
retrieves as 1 mgal airborne – Advantage: truly global


![GIORGIO MARIANI - uniroma1.it CV.pdf · CV Giorgio Mariani 4 “Introduzione”. Ralph Waldo Emerson, Condotta di vita. [The Conduct of Life]. ... della letteratura indiano-americana](https://img.pdfslide.us/doc/110x75/5c6950ff09d3f290788ce892/giorgio-mariani-cvpdf-cv-giorgio-mariani-4-introduzione-ralph-waldo.jpg)