Embed Size (px)
Citation preview
Gobert, WTC 2002, 01/25/02
Summarizing, Explaining, and Diagramming: The Differential Effects on Reading Times, Text-Base Representations, and Mental
Models of Science Text
Janice Gobert
Senior Research Scientist Research AssociateThe Concord Consortium Dept. of Learning & Teaching37 Thoreau Street Graduate School of EducationConcord, MA 01742 Harvard University [email protected] Cambridge, MA 01238
Check us out at www.concord.org
This research is funded by the the National Science Foundation under grant No. REC-9806141 awarded to the author. Any opinions, findings,
and conclusions expressed are those of the presenter and do not necessarily reflect the views of the NSF.
Gobert, WTC 2002, 01/25/02
Background to the Research: Study 1
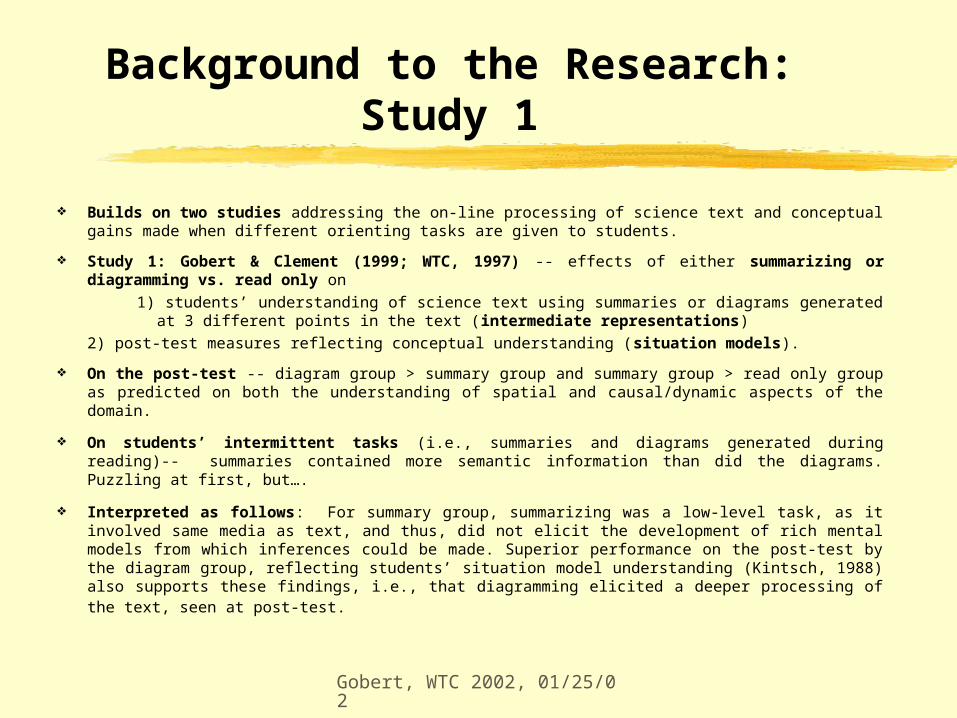
Builds on two studies addressing the on-line processing of science text and conceptual gains made when different orienting tasks are given to students.
Study 1: Gobert & Clement (1999; WTC, 1997) -- effects of either summarizing or diagramming vs. read only on
1) students’ understanding of science text using summaries or diagrams generated at 3 different points in the text (intermediate representations)
2) post-test measures reflecting conceptual understanding (situation models).
On the post-test -- diagram group > summary group and summary group > read only group as predicted on both the understanding of spatial and causal/dynamic aspects of the domain.
On students’ intermittent tasks (i.e., summaries and diagrams generated during reading)-- summaries contained more semantic information than did the diagrams. Puzzling at first, but….
Interpreted as follows: For summary group, summarizing was a low-level task, as it involved same media as text, and thus, did not elicit the development of rich mental models from which inferences could be made. Superior performance on the post-test by the diagram group, reflecting students’ situation model understanding (Kintsch, 1988) also supports these findings, i.e., that diagramming elicited a deeper processing of the text, seen at post-test.
Gobert, WTC 2002, 01/25/02
Background to the Research (cont’d): Study 2
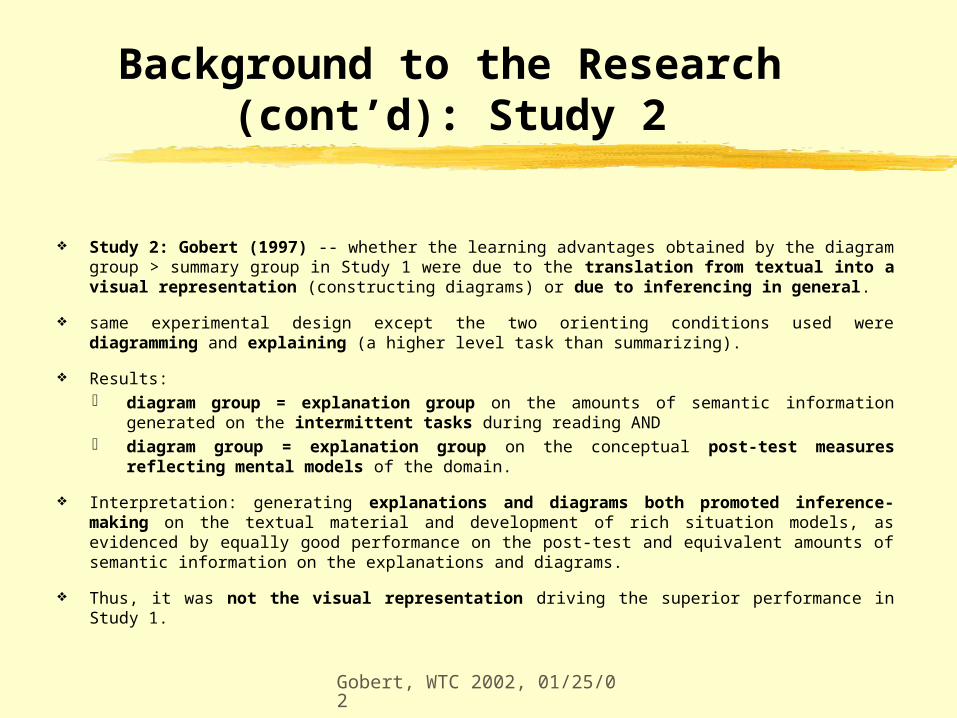
Study 2: Gobert (1997) -- whether the learning advantages obtained by the diagram group > summary group in Study 1 were due to the translation from textual into a visual representation (constructing diagrams) or due to inferencing in general.
same experimental design except the two orienting conditions used were diagramming and explaining (a higher level task than summarizing).
Results: diagram group = explanation group on the amounts of semantic information generated on the
intermittent tasks during reading AND diagram group = explanation group on the conceptual post-test measures reflecting mental
models of the domain.
Interpretation: generating explanations and diagrams both promoted inference-making on the textual material and development of rich situation models, as evidenced by equally good performance on the post-test and equivalent amounts of semantic information on the explanations and diagrams.
Thus, it was not the visual representation driving the superior performance in Study 1.
Gobert, WTC 2002, 01/25/02
Ok, so the visual medium hypothesis was out the window, what now?…
Studies 1 and 2 provided a motivation for investigating the reading time performance, intermittent task performance, and subsequent conceptual understanding in three different orienting conditions in order to track potential differences in text comprehension.
Orienting tasks for Study 3: summarizing, explaining, and diagramming.
IF reading time performance of the explanation = diagram group but > summary group…..
it is possible that similar processes are being used in the explanation and diagram conditions in setting up mental models of the text.
Gobert, WTC 2002, 01/25/02
Research Design: Study 3
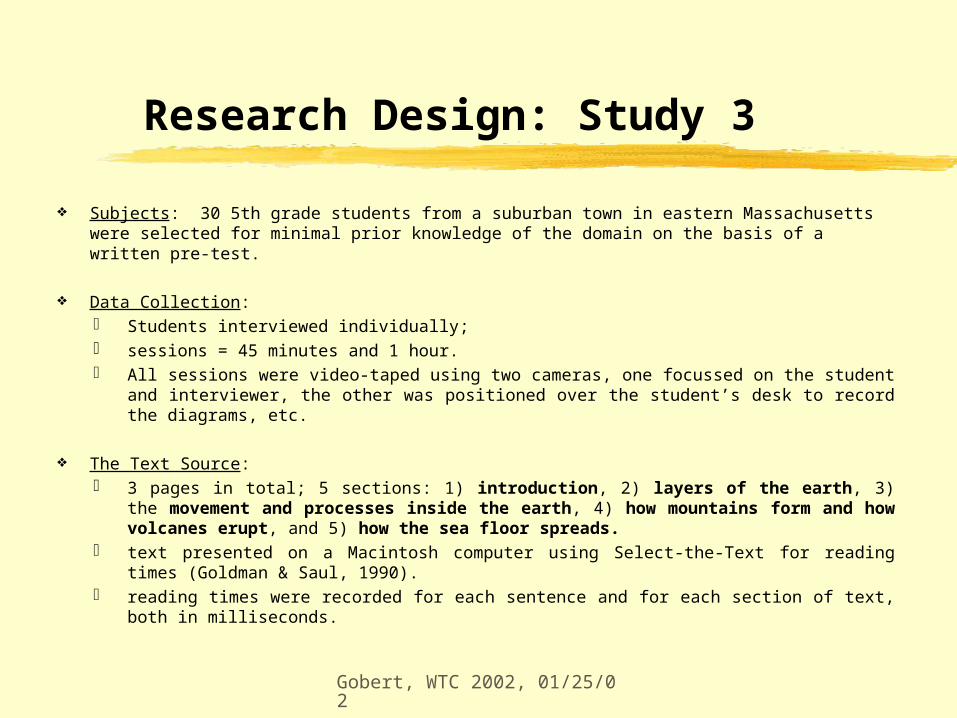
Subjects: 30 5th grade students from a suburban town in eastern Massachusetts were selected for minimal prior knowledge of the domain on the basis of a written pre-test.
Data Collection: Students interviewed individually; sessions = 45 minutes and 1 hour. All sessions were video-taped using two cameras, one focussed on the student and interviewer, the
other was positioned over the student’s desk to record the diagrams, etc.
The Text Source: 3 pages in total; 5 sections: 1) introduction, 2) layers of the earth, 3) the movement and processes
inside the earth, 4) how mountains form and how volcanes erupt, and 5) how the sea floor spreads.
text presented on a Macintosh computer using Select-the-Text for reading times (Goldman & Saul, 1990).
reading times were recorded for each sentence and for each section of text, both in milliseconds.
Gobert, WTC 2002, 01/25/02
Research Design: Study 3 (cont’d)
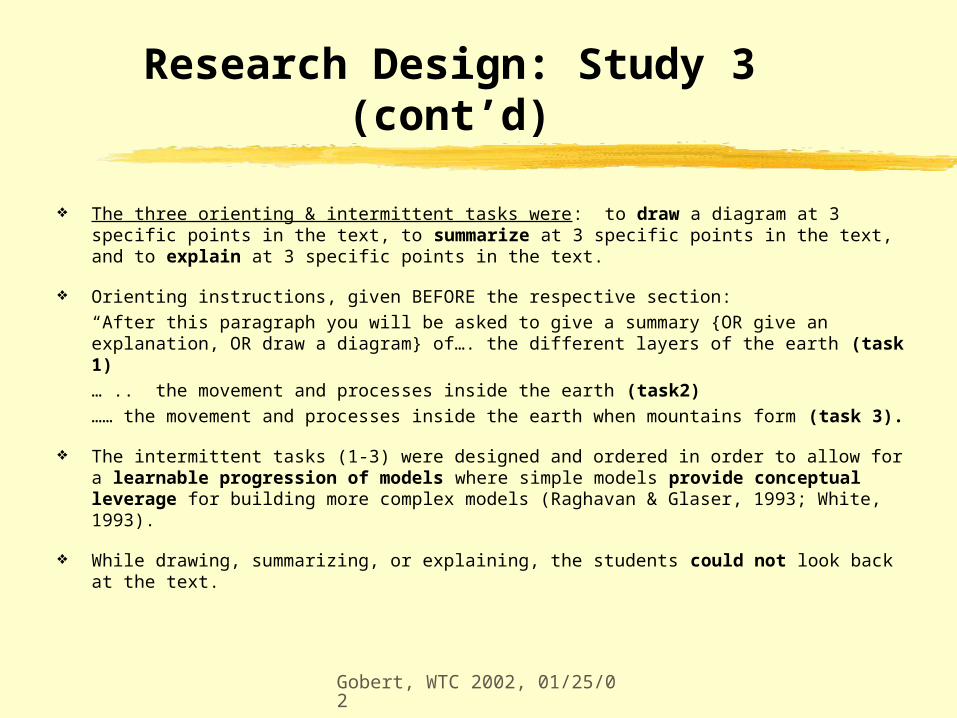
The three orienting & intermittent tasks were: to draw a diagram at 3 specific points in the text, to summarize at 3 specific points in the text, and to explain at 3 specific points in the text.
Orienting instructions, given BEFORE the respective section:
“After this paragraph you will be asked to give a summary {OR give an explanation, OR draw a diagram} of…. the different layers of the earth (task 1)
… .. the movement and processes inside the earth (task2)
…… the movement and processes inside the earth when mountains form (task 3).
The intermittent tasks (1-3) were designed and ordered in order to allow for a learnable progression of models where simple models provide conceptual leverage for building more complex models (Raghavan & Glaser, 1993; White, 1993).
While drawing, summarizing, or explaining, the students could not look back at the text.
Gobert, WTC 2002, 01/25/02
Coding of Students’ Intermittent Data, e.g., Spatial Scoring- Mountain Formation (task 3)
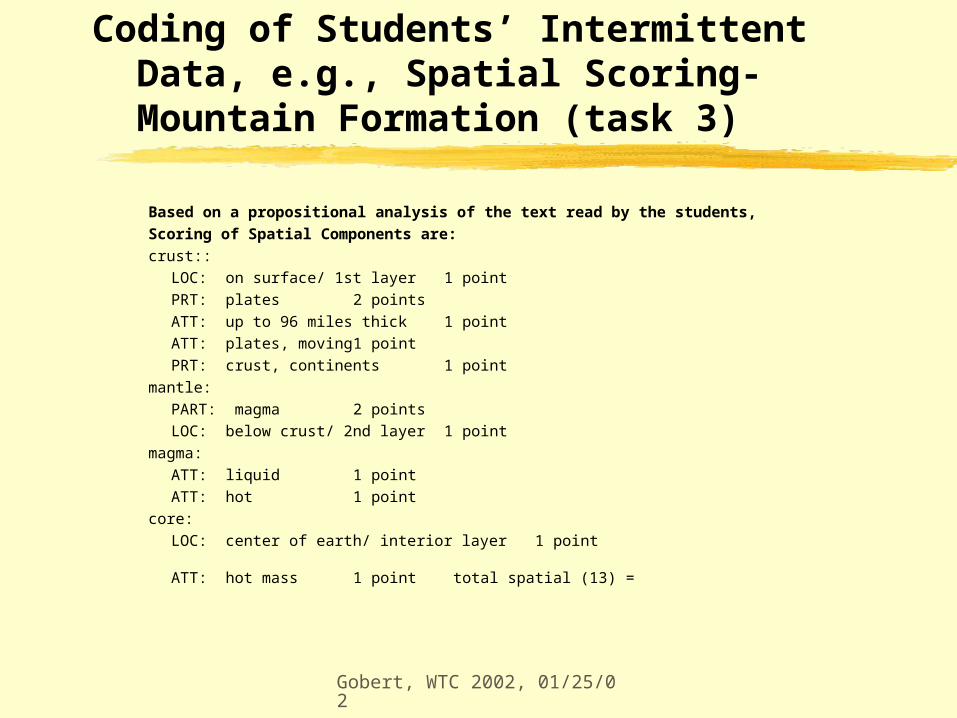
Based on a propositional analysis of the text read by the students,
Scoring of Spatial Components are:
crust::
LOC: on surface/ 1st layer 1 point
PRT: plates 2 points
ATT: up to 96 miles thick 1 point
ATT: plates, moving 1 point
PRT: crust, continents 1 point
mantle:
PART: magma 2 points
LOC: below crust/ 2nd layer 1 point
magma:
ATT: liquid 1 point
ATT: hot 1 point
core:
LOC: center of earth/ interior layer 1 point
ATT: hot mass 1 point total spatial (13) =
Gobert, WTC 2002, 01/25/02
Coding of Students’ Intermittent Data, e.g., Causal Scoring for Mountain Formation (task 3)
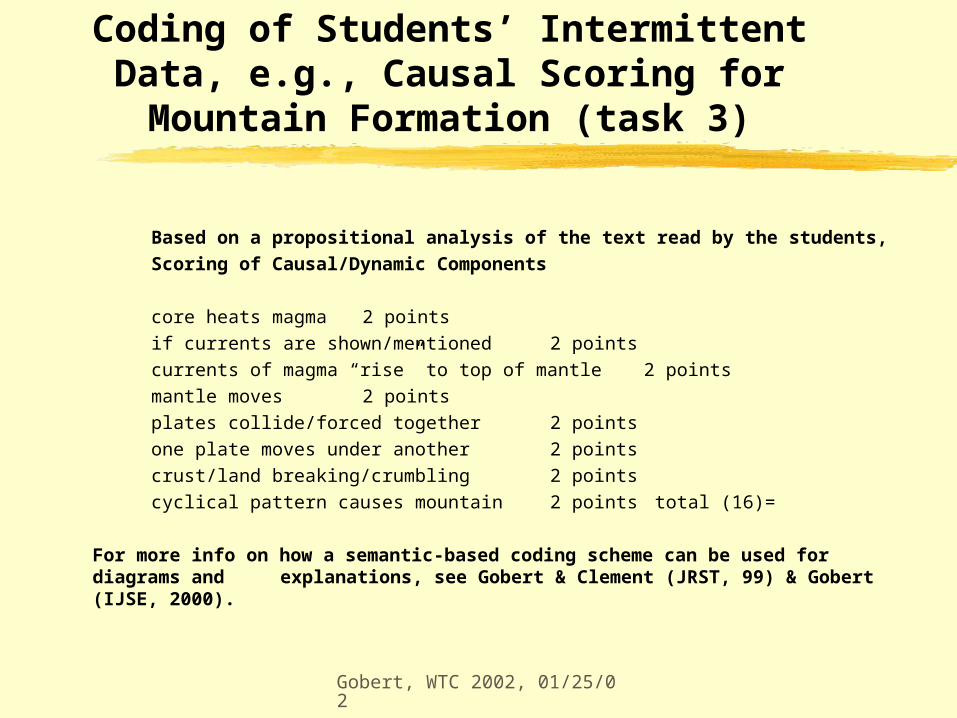
Based on a propositional analysis of the text read by the students,
Scoring of Causal/Dynamic Components
core heats magma 2 points
if currents are shown/mentioned 2 points
currents of magma “rise” to top of mantle 2 points
mantle moves 2 points
plates collide/forced together 2 points
one plate moves under another 2 points
crust/land breaking/crumbling 2 points
cyclical pattern causes mountain 2 points total (16)=
For more info on how a semantic-based coding scheme can be used for diagrams and explanations, see Gobert & Clement (JRST, 99) & Gobert (IJSE, 2000).
Gobert, WTC 2002, 01/25/02
Coding of Students’ Post-test Data
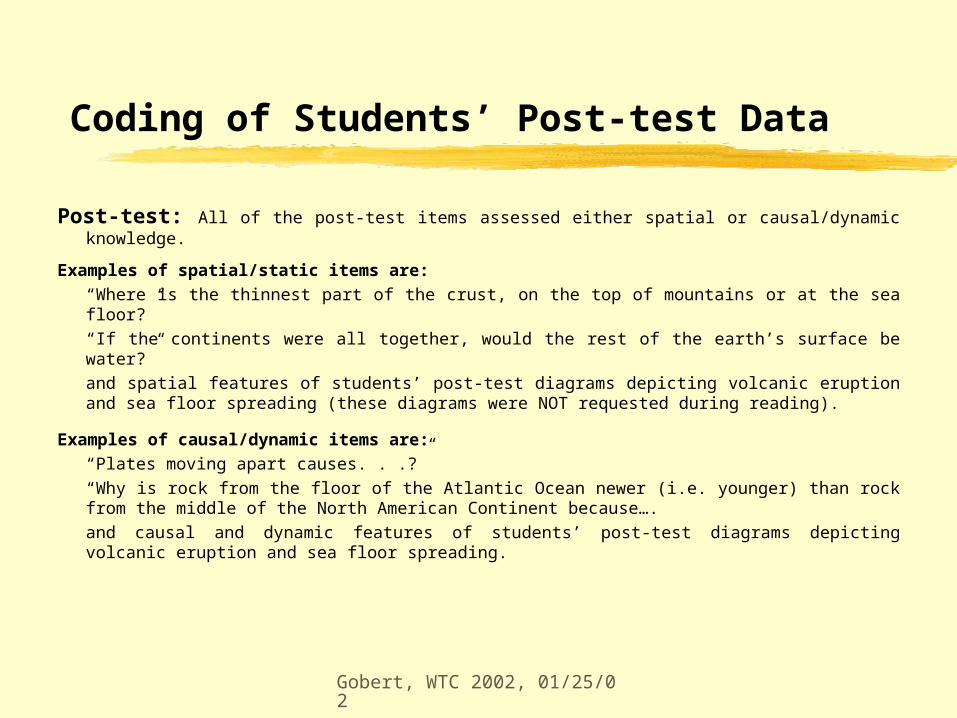
Post-test: All of the post-test items assessed either spatial or causal/dynamic knowledge.
Examples of spatial/static items are:
“Where is the thinnest part of the crust, on the top of mountains or at the sea floor?”
“If the continents were all together, would the rest of the earth’s surface be water?”
and spatial features of students’ post-test diagrams depicting volcanic eruption and sea floor spreading (these diagrams were NOT requested during reading).
Examples of causal/dynamic items are:
“Plates moving apart causes. . .?”
“Why is rock from the floor of the Atlantic Ocean newer (i.e. younger) than rock from the middle of the North American Continent because….
and causal and dynamic features of students’ post-test diagrams depicting volcanic eruption and sea floor spreading.
Gobert, WTC 2002, 01/25/02
Hypotheses Regarding Reading Times
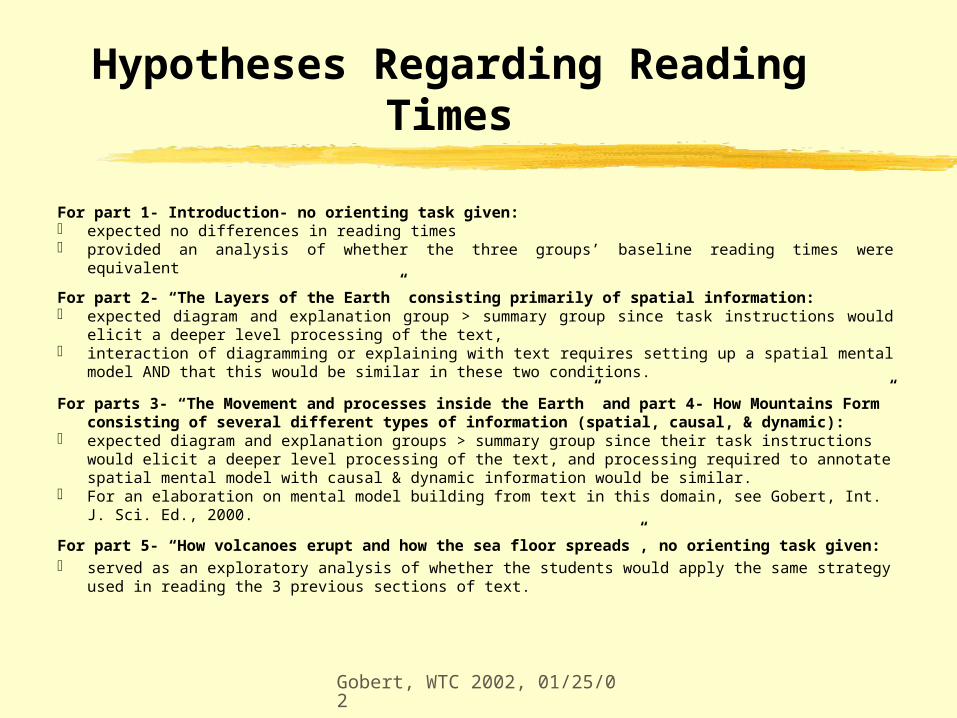
For part 1- Introduction- no orienting task given: expected no differences in reading times provided an analysis of whether the three groups’ baseline reading times were equivalent
For part 2- “The Layers of the Earth” consisting primarily of spatial information: expected diagram and explanation group > summary group since task instructions would elicit a deeper
level processing of the text, interaction of diagramming or explaining with text requires setting up a spatial mental model AND that
this would be similar in these two conditions.
For parts 3- “The Movement and processes inside the Earth” and part 4- How Mountains Form” consisting of several different types of information (spatial, causal, & dynamic):
expected diagram and explanation groups > summary group since their task instructions would elicit a deeper level processing of the text, and processing required to annotate spatial mental model with causal & dynamic information would be similar.
For an elaboration on mental model building from text in this domain, see Gobert, Int. J. Sci. Ed., 2000.
For part 5- “How volcanoes erupt and how the sea floor spreads”, no orienting task given: served as an exploratory analysis of whether the students would apply the same strategy used in reading
the 3 previous sections of text.
Gobert, WTC 2002, 01/25/02
Hypotheses Regarding Post-test Measures
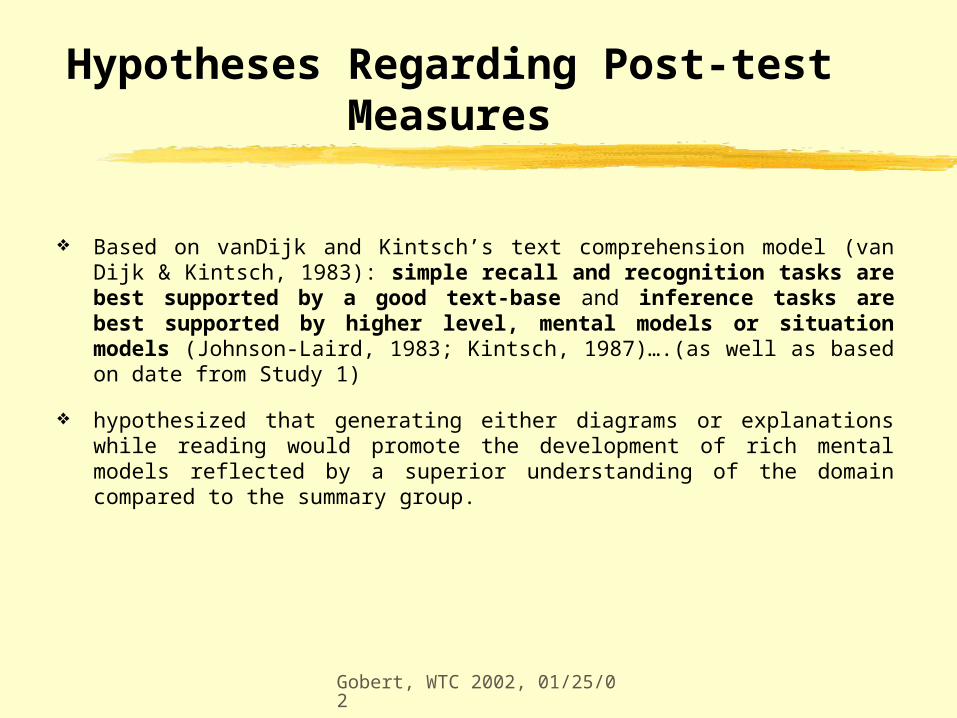
Based on vanDijk and Kintsch’s text comprehension model (van Dijk & Kintsch, 1983): simple recall and recognition tasks are best supported by a good text-base and inference tasks are best supported by higher level, mental models or situation models (Johnson-Laird, 1983; Kintsch, 1987)….(as well as based on date from Study 1)
hypothesized that generating either diagrams or explanations while reading would promote the development of rich mental models reflected by a superior understanding of the domain compared to the summary group.
Gobert, WTC 2002, 01/25/02
Regarding Intermittent Tasks….
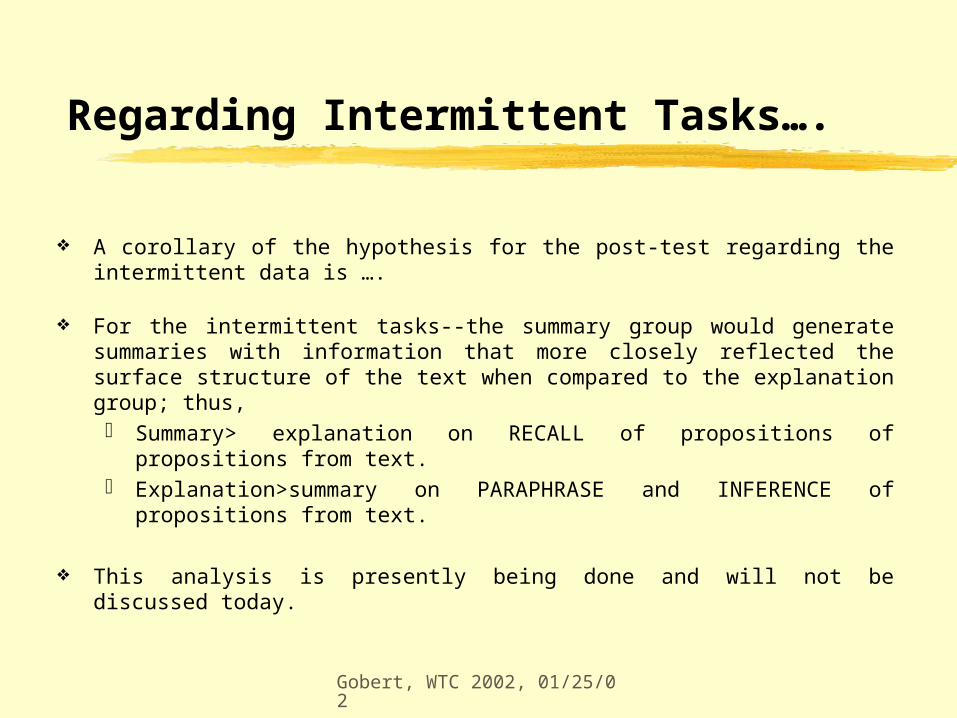
A corollary of the hypothesis for the post-test regarding the intermittent data is ….
For the intermittent tasks--the summary group would generate summaries with information that more closely reflected the surface structure of the text when compared to the explanation group; thus, Summary> explanation on RECALL of propositions of propositions from text. Explanation>summary on PARAPHRASE and INFERENCE of propositions from text.
This analysis is presently being done and will not be discussed today.
Gobert, WTC 2002, 01/25/02
Overview of Results
There are four sets of quantitative data:
1) reading time data for each section of the text,
2) intermittent data generated by the student at 3 points during the text (these data will not be discussed today) and
3) performance on the post-test.
Gobert, WTC 2002, 01/25/02
Analysis of Reading Times
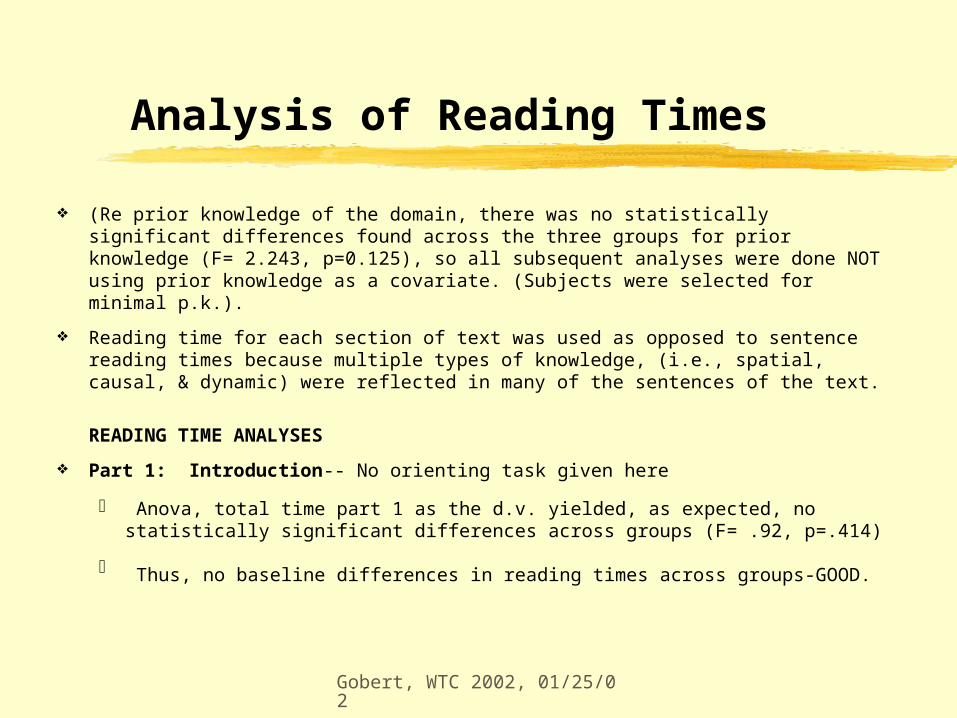
(Re prior knowledge of the domain, there was no statistically significant differences found across the three groups for prior knowledge (F= 2.243, p=0.125), so all subsequent analyses were done NOT using prior knowledge as a covariate. (Subjects were selected for minimal p.k.).
Reading time for each section of text was used as opposed to sentence reading times because multiple types of knowledge, (i.e., spatial, causal, & dynamic) were reflected in many of the sentences of the text.
READING TIME ANALYSES
Part 1: Introduction-- No orienting task given here
Anova, total time part 1 as the d.v. yielded, as expected, no statistically significant differences across groups (F= .92, p=.414)
Thus, no baseline differences in reading times across groups-GOOD.
Gobert, WTC 2002, 01/25/02
Table 1a
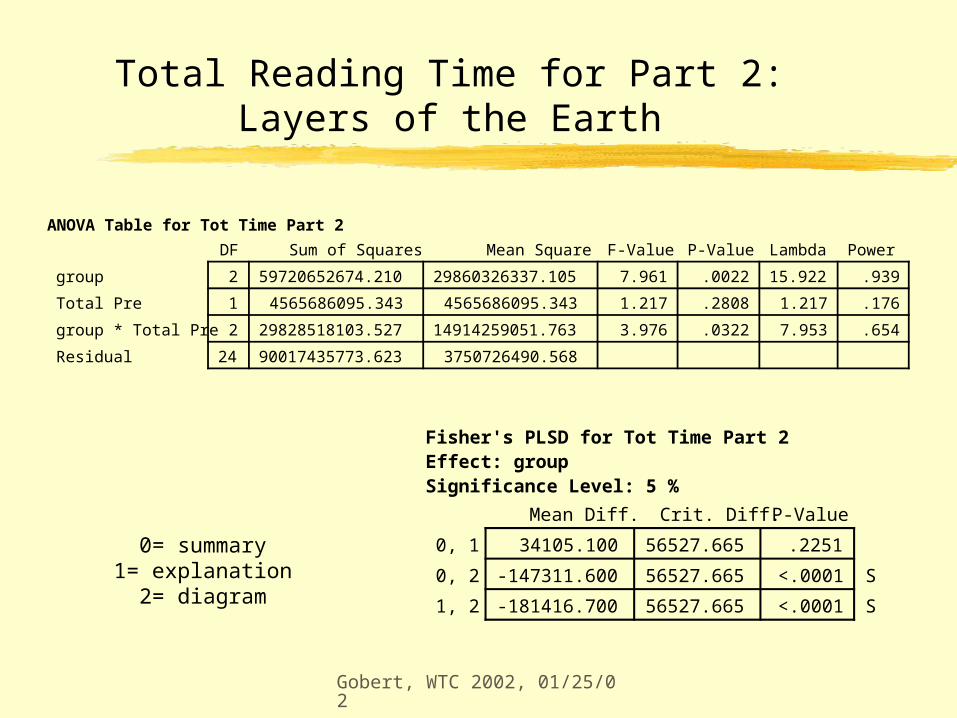
Total Reading Time for Part 2: Layers of the Earth
2 59720652674.210 29860326337.105 7.961 .0022 15.922 .939
1 4565686095.343 4565686095.343 1.217 .2808 1.217 .176
2 29828518103.527 14914259051.763 3.976 .0322 7.953 .654
24 90017435773.623 3750726490.568
DF Sum of Squares Mean Square F-Value P-Value Lambda Power
group
Total Pre
group * Total Pre
Residual
ANOVA Table for Tot Time Part 2
34105.100 56527.665 .2251
-147311.600 56527.665 <.0001 S
-181416.700 56527.665 <.0001 S
Mean Diff. Crit. Diff. P-Value
0, 1
0, 2
1, 2
Fisher's PLSD for Tot Time Part 2Effect: groupSignificance Level: 5 %
0= summary1= explanation
2= diagram
Gobert, WTC 2002, 01/25/02
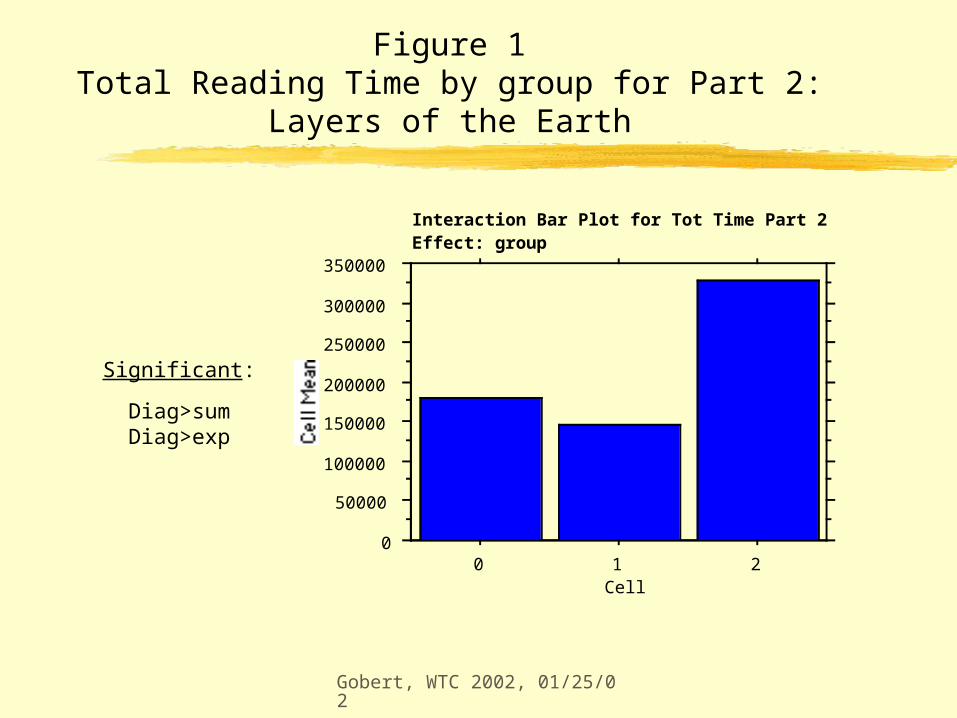
Figure 1Total Reading Time by group for Part 2: Layers of the Earth
0
50000
100000
150000
200000
250000
300000
350000
Cell Mean
0 1 2Cell
Interaction Bar Plot for Tot Time Part 2Effect: group
Significant:
Diag>sumDiag>exp
Gobert, WTC 2002, 01/25/02
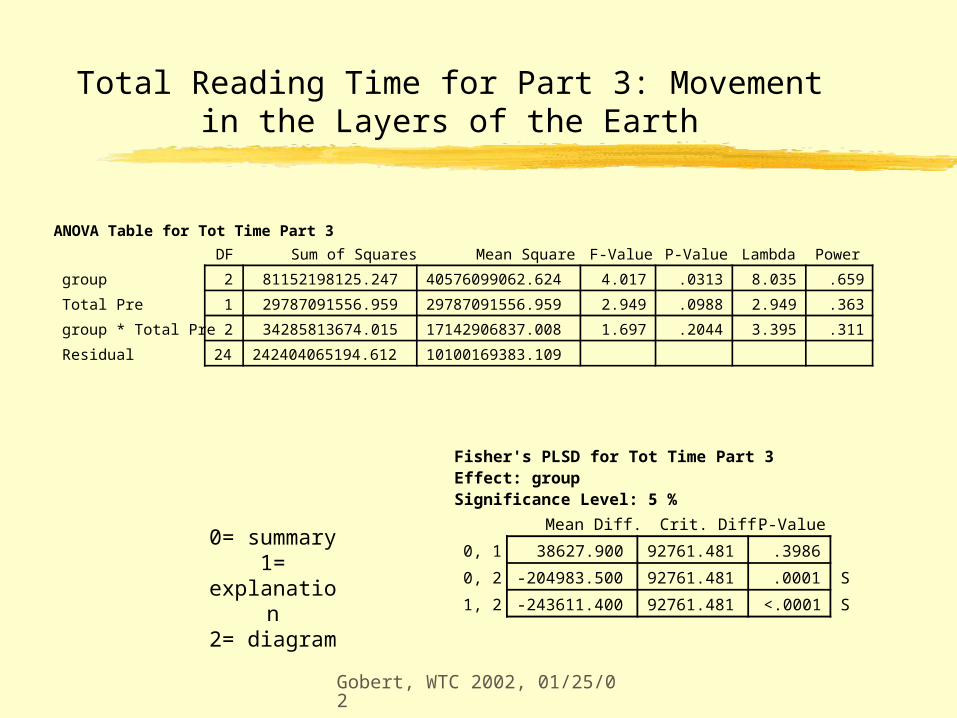
Total Reading Time for Part 3: Movement in the Layers of the Earth
2 81152198125.247 40576099062.624 4.017 .0313 8.035 .659
1 29787091556.959 29787091556.959 2.949 .0988 2.949 .363
2 34285813674.015 17142906837.008 1.697 .2044 3.395 .311
24 242404065194.612 10100169383.109
DF Sum of Squares Mean Square F-Value P-Value Lambda Power
group
Total Pre
group * Total Pre
Residual
ANOVA Table for Tot Time Part 3
38627.900 92761.481 .3986
-204983.500 92761.481 .0001 S
-243611.400 92761.481 <.0001 S
Mean Diff. Crit. Diff. P-Value
0, 1
0, 2
1, 2
Fisher's PLSD for Tot Time Part 3Effect: groupSignificance Level: 5 %
0= summary1= explanation
2= diagram
Gobert, WTC 2002, 01/25/02
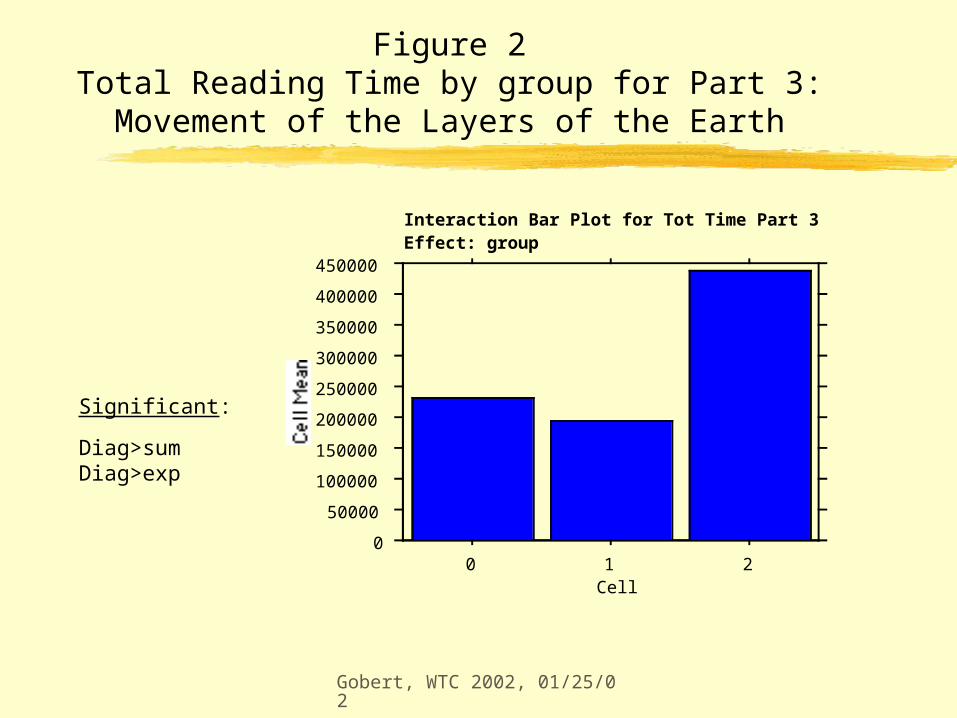
Figure 2Total Reading Time by group for Part 3: Movement of the
Layers of the Earth
0
50000
100000
150000
200000
250000
300000
350000
400000
450000
Cell Mean
0 1 2Cell
Interaction Bar Plot for Tot Time Part 3Effect: group
Significant:
Diag>sumDiag>exp
Gobert, WTC 2002, 01/25/02
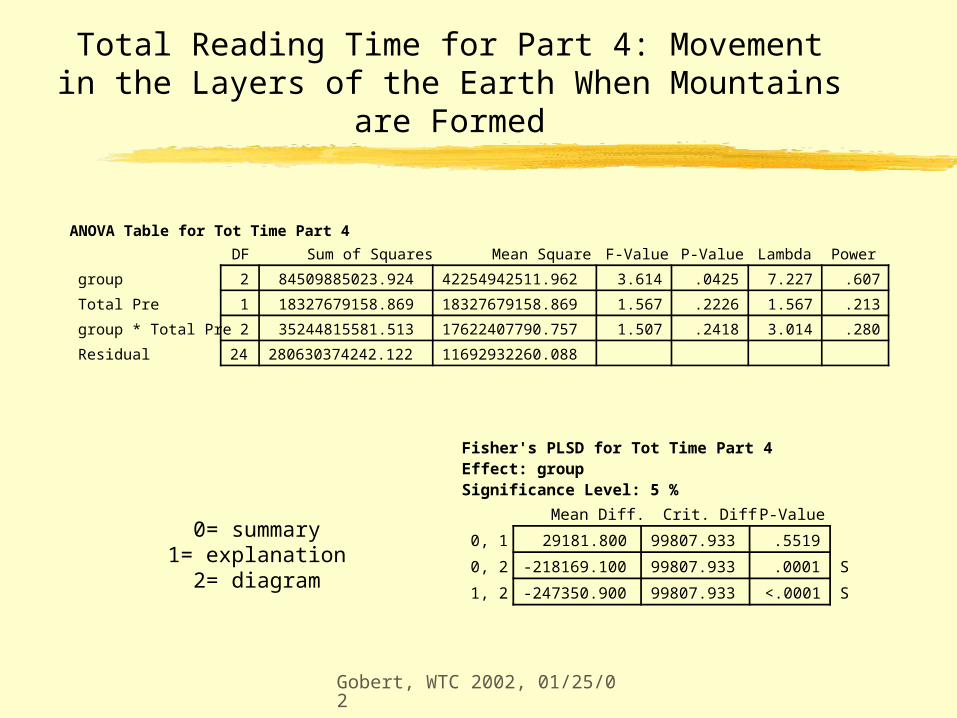
Total Reading Time for Part 4: Movement in the Layers of the Earth When Mountains are Formed
2 84509885023.924 42254942511.962 3.614 .0425 7.227 .607
1 18327679158.869 18327679158.869 1.567 .2226 1.567 .213
2 35244815581.513 17622407790.757 1.507 .2418 3.014 .280
24 280630374242.122 11692932260.088
DF Sum of Squares Mean Square F-Value P-Value Lambda Power
group
Total Pre
group * Total Pre
Residual
ANOVA Table for Tot Time Part 4
29181.800 99807.933 .5519
-218169.100 99807.933 .0001 S
-247350.900 99807.933 <.0001 S
Mean Diff. Crit. Diff. P-Value
0, 1
0, 2
1, 2
Fisher's PLSD for Tot Time Part 4Effect: groupSignificance Level: 5 %
0= summary1= explanation
2= diagram
Gobert, WTC 2002, 01/25/02
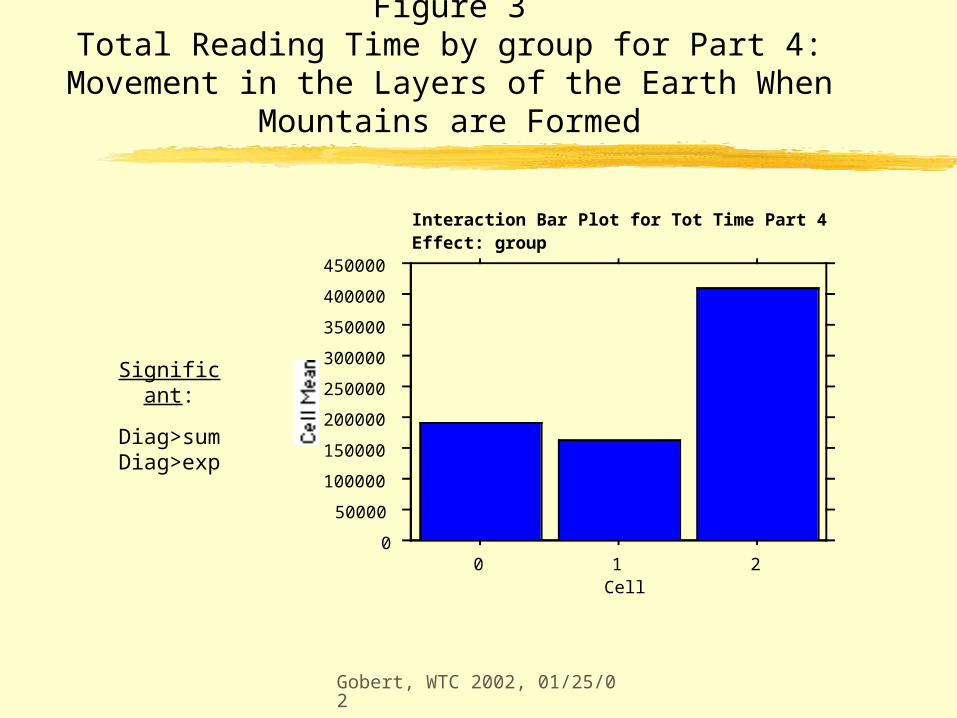
Figure 3Total Reading Time by group for Part 4: Movement in the
Layers of the Earth When Mountains are Formed
0
50000
100000
150000
200000
250000
300000
350000
400000
450000
Cell Mean
0 1 2Cell
Interaction Bar Plot for Tot Time Part 4Effect: group
Significant:
Diag>sumDiag>exp
Gobert, WTC 2002, 01/25/02
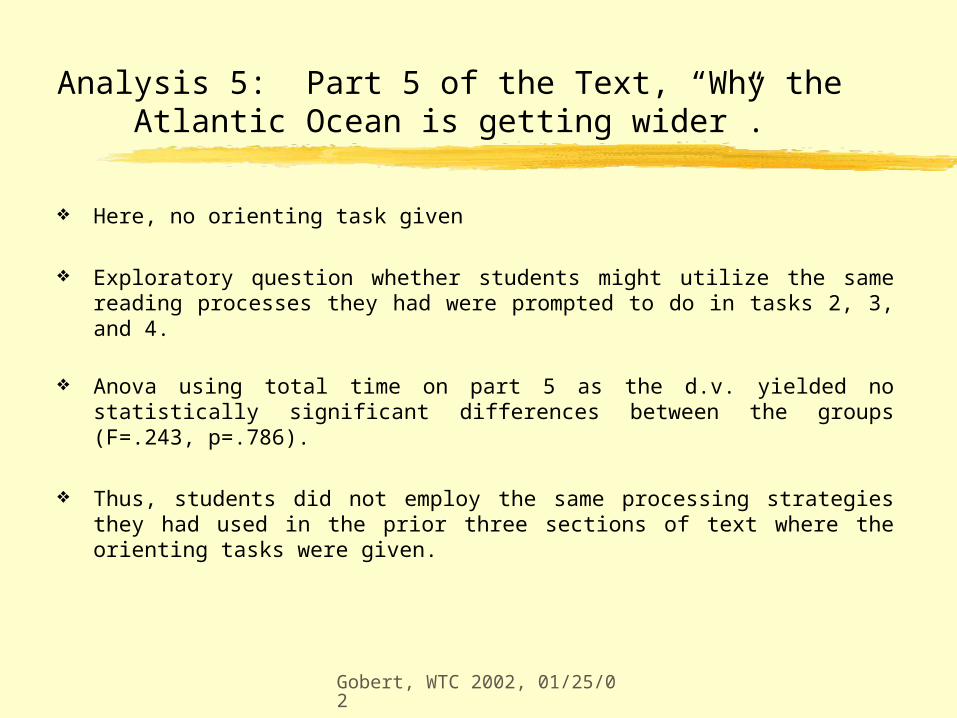
Analysis 5: Part 5 of the Text, “Why the Atlantic Ocean is getting wider”.
Here, no orienting task given
Exploratory question whether students might utilize the same reading processes they had were prompted to do in tasks 2, 3, and 4.
Anova using total time on part 5 as the d.v. yielded no statistically significant differences between the groups (F=.243, p=.786).
Thus, students did not employ the same processing strategies they had used in the prior three sections of text where the orienting tasks were given.
Gobert, WTC 2002, 01/25/02
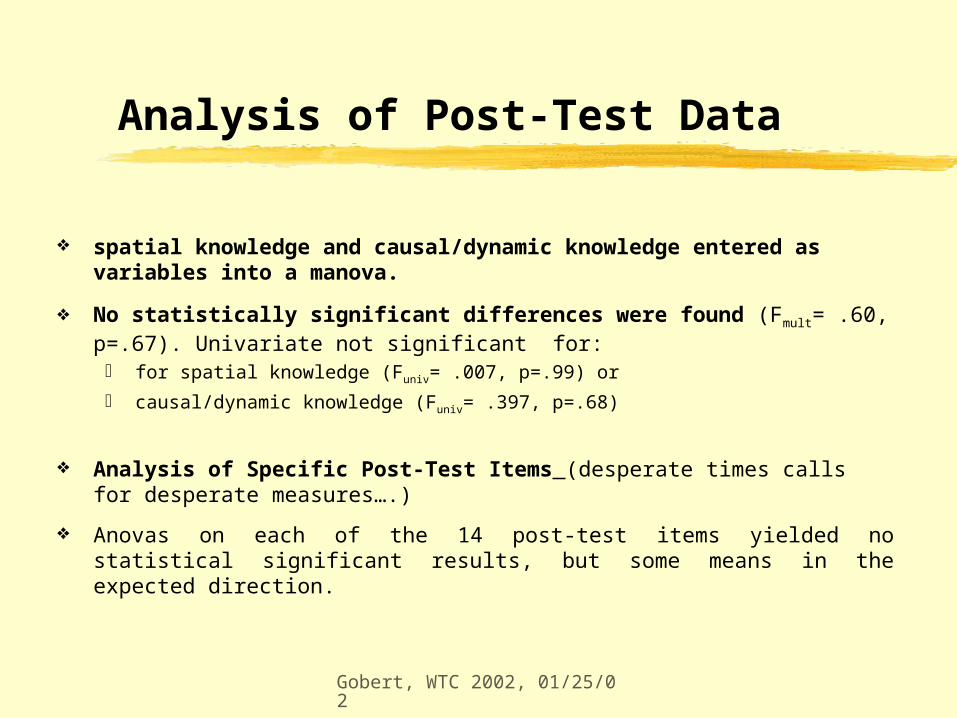
Analysis of Post-Test Data
spatial knowledge and causal/dynamic knowledge entered as variables into a manova.
No statistically significant differences were found (Fmult= .60, p=.67). Univariate not significant for:
for spatial knowledge (Funiv= .007, p=.99) or
causal/dynamic knowledge (Funiv= .397, p=.68)
Analysis of Specific Post-Test Items (desperate times calls for desperate measures….)
Anovas on each of the 14 post-test items yielded no statistical significant results, but some means in the expected direction.
Gobert, WTC 2002, 01/25/02
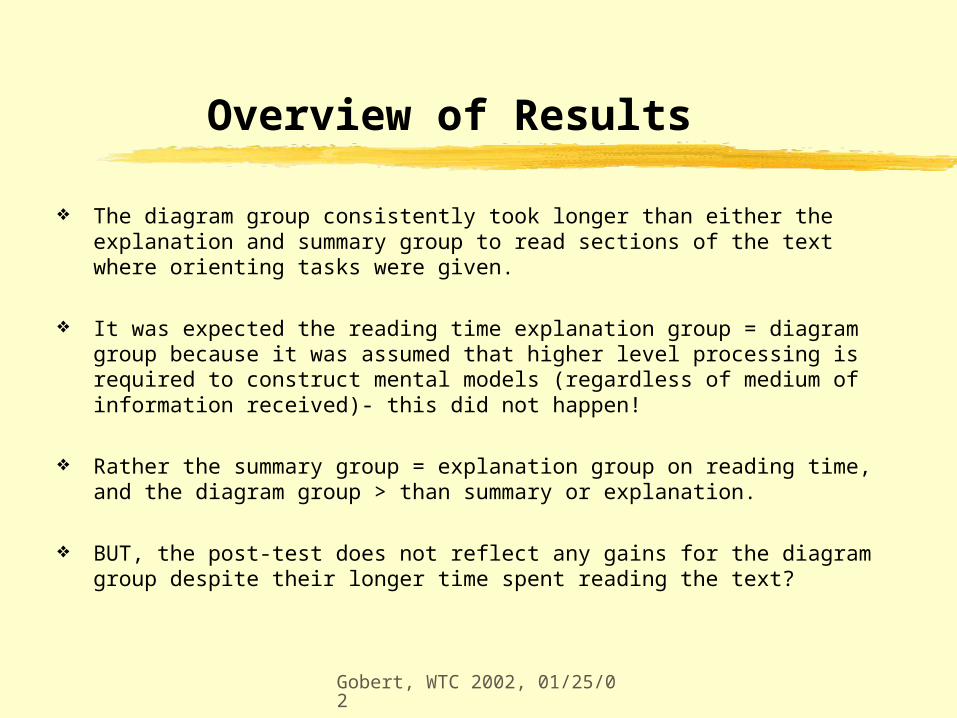
Overview of Results
The diagram group consistently took longer than either the explanation and summary group to read sections of the text where orienting tasks were given.
It was expected the reading time explanation group = diagram group because it was assumed that higher level processing is required to construct mental models (regardless of medium of information received)- this did not happen!
Rather the summary group = explanation group on reading time, and the diagram group > than summary or explanation.
BUT, the post-test does not reflect any gains for the diagram group despite their longer time spent reading the text?
Gobert, WTC 2002, 01/25/02
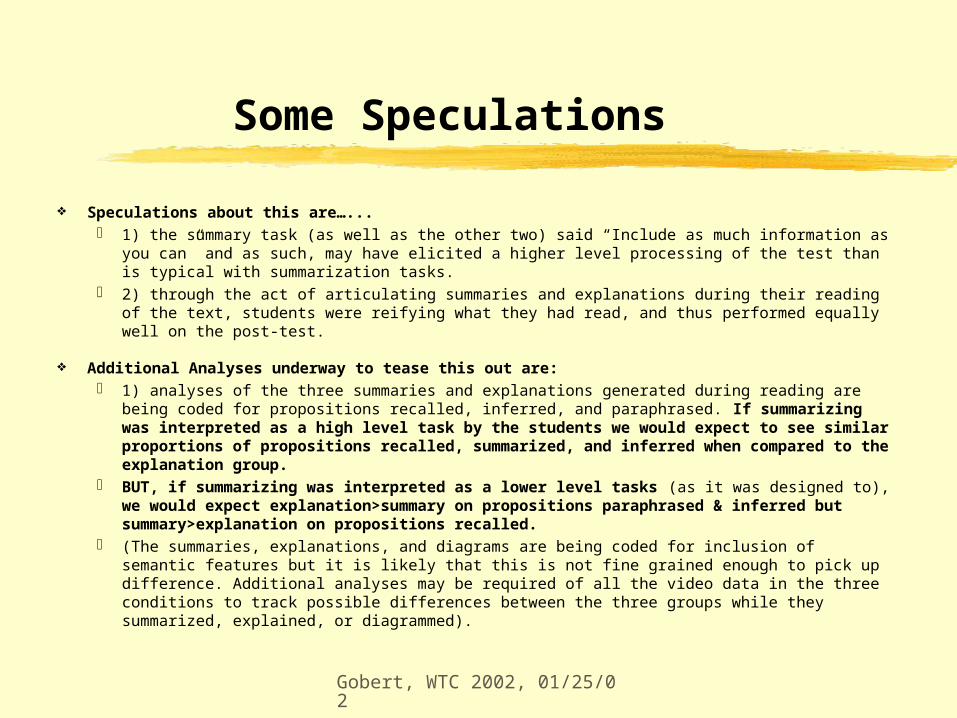
Some Speculations
Speculations about this are…... 1) the summary task (as well as the other two) said “Include as much information as you can” and as
such, may have elicited a higher level processing of the test than is typical with summarization tasks. 2) through the act of articulating summaries and explanations during their reading of the text,
students were reifying what they had read, and thus performed equally well on the post-test.
Additional Analyses underway to tease this out are: 1) analyses of the three summaries and explanations generated during reading are being coded for
propositions recalled, inferred, and paraphrased. If summarizing was interpreted as a high level task by the students we would expect to see similar proportions of propositions recalled, summarized, and inferred when compared to the explanation group.
BUT, if summarizing was interpreted as a lower level tasks (as it was designed to), we would expect explanation>summary on propositions paraphrased & inferred but summary>explanation on propositions recalled.
(The summaries, explanations, and diagrams are being coded for inclusion of semantic features but it is likely that this is not fine grained enough to pick up difference. Additional analyses may be required of all the video data in the three conditions to track possible differences between the three groups while they summarized, explained, or diagrammed).
Gobert, WTC 2002, 01/25/02
Conclusions
These data are consistent with other studies on self-explanations (Cote & Goldman, 1998; Cote, et al, 1998) in which it was found that the relationship between self-explanations and learning are not simple and linear.
Cote et al speculate that differences might be due to the types of self-explanations that are generated. In terms of the present study, a fine grained analysis of the propositions recalled and inferred across the summary and explanation groups may yield important information about what features students are attending to in constructing these representations.
Further research needs to be conducted with texts that are specifically designed to tease out potential group differences. The text used here had many sentences which contained multiple types of information, i.e., spatial, causal, and dynamic, and combinations of the three, thus sentence by sentence reading time comparisons would not be fruitful. The domain, being highly spatial, causal, and dynamic may not be conducive to designing “natural” texts for this purpose.
Regarding “Summarizing, Explaining, and Diagramming”, there are differential effects on reading times, there may be differences in Text-Base Representations and there are no tractable differences in mental models of science text.
![Diagramming Review II - WCUSD15 · about sentence diagramming. classes are excited ... -ed, -d, -t, or ... Diagramming Review II [Compatibility Mode]](https://img.pdfslide.us/doc/110x75/5af7254d7f8b9a9271913b29/diagramming-review-ii-sentence-diagramming-classes-are-excited-ed-d-t.jpg)