Embed Size (px)
Citation preview

Introduction S1
Introduction ■ GOALS OF THE LABORATORY INVESTIGATIONSKnowing a collection of facts about biology is bene!cial only if you can use that information to understand and investigate a particular aspect of the natural world. AP® Biology lab investigations allow you to explore the natural world, and provide opportunities for you to choose to study what interests you most about each concept. Science is about the process of investigating, and should be a central part of your experience in AP Biology. Performing labs also gives you insight into the nature of science, and helps you appreciate the investigations and processes that result in the collection of facts that your textbook and your teacher o"en present to you.
#is suite of AP Biology laboratory investigations helps you gain enduring understandings of biological concepts and the scienti!c evidence that supports them. #e investigations allow you to develop and apply practices and skills used by scientists. You make observations, ask questions, and then design plans for experiments, data collection, application of mathematical routines, and re!nement of testable explanations and predictions. As you work through your experiments, your teacher will ask follow-up questions to assess how well you understand key concepts. Finally, you will communicate your !ndings and your interpretation of them to your classmates and instructor(s).
For each investigation in this manual, you will !nd the following:• Background information and clear learning objectives for each investigation• Prelab questions, activities, so"ware simulations, and other supplemental resources• “Checklists” of prior skills and skills that will be developed• Tips for designing and conducting investigations• Safety concerns• Lists of materials and supplies • Methods of analyzing and evaluating results• Means of communicating results and conclusions• Postlab questions and activities• Suggestions for extending the investigation(s)

This page is intentionally left blank.
Chapter 1 S3
CHAPTER 1:
What Is Inquiry?How do we know what we know? Inquiry begins with observations you make about the natural world — a bare spot under a tree, a bird chirping repeatedly, or an unusual spot on your skin. If you follow such observations by a question, such as What is causing that?, you have begun an inquiry. Inquiry-based laboratory investigations allow you to discover information for yourself, and model the behavior of scientists as you observe and explore. !rough inquiry, you use a variety of methods to answer questions you raise. !ese methods include laboratory and "eld investigations; manipulation of so#ware simulations, models, and data sets; and meaningful online research. By designing experiments to test hypotheses, analyze data, and communicate results and conclusions, you appreciate that a scienti"c method of investigation is cyclic, not linear; each observation or experimental result raises new questions about how the world works, thus leading to open-ended investigations.
!ere are four levels of inquiry that lead to the student question. It is not reasonable to think that every part of a particular lab in AP Biology will be completely student directed. However, as written, the labs lead to a student-directed, inquiry-based investigation(s). !e four levels of inquiry are as follows:• Con!rmation. At this level, you con"rm a principle through an activity in which the
results are known in advance. • Structured Inquiry. At this level, you investigate a teacher-presented question
through a prescribed procedure.• Guided Inquiry. At this level, you investigate a teacher-presented question using
procedures that you design/select.• Open Inquiry. At this level, you investigate topic-related questions that are
formulated through procedures that you design/select.
As you work on your investigations, your teacher may walk around the room and ask probing questions to provoke your thinking (e.g., How are you changing the temperature? How are you recording the temperature?). Your teacher may also ask about data and evidence (e.g., Is there an alternative way to organize the data? Is there some reason the data may not be accurate? What data are important to collect? What are you hoping to !nd out? How will you communicate your results?). !is strategy will allow your teacher to diagnose and address any misconceptions immediately.

This page is intentionally left blank.
Chapter 2 S5
CHAPTER 2:
Written, Verbal, and Graphic Communication
Experimental results must be communicated to peers to have value. To understand the relationship among your hypothesis, procedures, and results, you should "rst take part in an informal small-group or class discussion of the experiment, including possible errors, changes in procedures, and alternative explanations for your data. Since many of the laboratory experiences described in this manual contain suggestions for further investigation, discussion of a given experiment can be a launching pad for independent work, culminating in a formal written report, poster, or oral presentation. Some possibilities for more permanent presentations are described below.
■ Mini-Posters and Presentations At scienti"c conferences, many experiments are presented orally or via posters. Posters provide the advantage of clarity and brevity that articulate the essential elements of the research. In a class, an alternative to the standard oral presentation or a full-sized poster is a mini-poster session, which requires fewer materials and less time than a formal presentation. You can include the most important elements of a full-sized poster, present your work, and get feedback from your classmates in an informal setting. !e essential elements of a mini-poster are as follows:• Title• Abstract• Introduction with primary question, background context, and hypothesis • Methodology• Results, including graphs, tables, charts, and statistical analyses• Conclusions, or your interpretation of your results based on your hypothesis• Literature cited
An example of a mini-poster session can be found at KWWS���ZZZ�QDEW�RUJ�EORJ������������PLQL�SRVWHUV�DXWKHQWLF�SHHU�UHYLHZ�LQ�WKH�FODVVURRP. Such a session allows you to evaluate information on your own, and then discuss it with other students, mimicking authentic presentations and peer review.
S6 Chapter 2
■ Lab Notebooks/PortfoliosA lab notebook allows you to organize your work so that you have the information for a more formal report. Your lab notebook should contain the information necessary for making a formal report, which may include a prelab experimental outline with the following information:• Members of work group• Primary question for investigation• Background observations and contextual information• Hypothesis and rationale for the investigation• Experimental design — strategies for testing hypothesis, using appropriate controls
and variables• Materials required• Safety issues• Procedure in su$cient detail so that someone could replicate your results
In addition, your lab notebook should contain the following:• Results, including graphs, tables, drawings or diagrams, and statistical analysis• Conclusion and discussion — Was the hypothesis supported? What additional
questions remain for further investigation?• References
A lab portfolio might contain "nished lab reports, notes on individual projects, library research, re%ections on particular lab experiences, and connections with other parts of the course, or a combination of these elements as requested by your teacher.
■ Lab Reports/PapersA formal report or paper provides an e&ective method for you to organize your work, and mimics papers in scienti"c journals. Your teacher might provide a rubric for what information should be included. !is type of report gives you writing experience and opportunities to re%ect on your work. (Refer to page 10 for tips on constructing informative graphs to include in your report.) !e writing center at the University of North Carolina has published an excellent guide for writing lab reports. Find it at KWWS���ZZZ�XQF�HGX�GHSWV�ZFZHE�KDQGRXWV�ODEBUHSRUWBFRPSOHWH�KWPO.
You also can see a good example of a descriptive lab report, “Examination of Protozoan Cultures to Determine Cellular Structure and Motion Pattern,” at KWWS���ZZZ�QFVX�HGX�ODEZULWH�UHV�ODEUHSRUW�VDPSOHGHVFULSWODE�KWPO.
Chapter 3 S7
■ Technology!ere are numerous websites for posting class data, which can then provide a larger sample for analysis, comparison of di&erent conditions in the experiment, or collaboration between students in di&erent class sections and di&erent schools. Your school’s technology or media center personnel may recommend appropriate Web-based options.
■ GraphsA graph is a visual representation of your data, and you want your graph to be as clear as possible to the reader for interpretation. First, you have to decide whether to use a scatter plot in order to draw a “best "t” line through data points, a bar graph, or some other representation with appropriate units. Use a line graph if your data are continuous (e.g., the appearance of product over time in an enzyme reaction). If your data are discontinuous (e.g., the amount of water consumption in di&erent high schools), use a bar graph. Your teacher might have other suggestions.
A graph must have a title that informs the reader about the experiment. Labeling a graph as simply “Graph Number Four” doesn’t tell the reader anything about the experiment, or the results. In comparison, the title “!e E&ect of Di&erent Concentrations of Auxin on Root Growth” tells the reader exactly what was being measured. Make sure each line or bar on your graph is easily identi"able by the reader.
Axes must be clearly labeled with units. • !e x-axis shows the independent variable. Time is an example of an independent
variable. Other possibilities for an independent variable might be light intensity, or the concentration of a hormone or nutrient.
• !e y-axis denotes the dependent variable, or what is being a&ected by the condition (independent variable) shown on the x-axis.
• Intervals must be uniform. For example, if one square on the x-axis equals "ve minutes, each interval must be the same and not change to ten minutes or one minute. If there is a break in the graph, such as a time course over which little happens for an extended period, note this with a break in the axis and a corresponding break in the data line.
• For clarity, you do not have to label each interval. You can label every "ve or ten intervals, or whatever is appropriate.
• Label the x-axis and y-axis so that a reader can easily see the information.

S8 Chapter 2
More than one condition of an experiment may be shown on a graph using di&erent lines. For example, you can compare the appearance of a product in an enzyme reaction at di&erent temperatures on the same graph. In this case, each line must be clearly di&erentiated from the others — by a label, a di&erent style, or color indicated by a key. !ese techniques provide an easy way to compare the results of your experiments.
Be clear as to whether your data start at the origin (0,0) or not. Do not extend your line to the origin if your data do not start there. In addition, do not extend your line beyond your last data point (extrapolation) unless you clearly indicate by a dashed line (or some other demarcation) that this is your prediction about what may happen.
For more detailed information about graphs, see Appendix B: Constructing Line Graphs.
Chapter 3 S9
CHAPTER 3:
Quantitative Reasoning in AP® Biology
Which would you choose? A brain biopsy or a CAT/MRI scan? A vaccine for 90%+ of the population with a risk of 0.001% su&ering from side e&ects, or no vaccine at all? Fresh vegetables sprayed with competing bacteria, or vegetables sprayed with sterilants that are hazardous to ecosystems? To risk conviction of a crime based on a detective’s hunch, or to be acquitted based on evidence provided by DNA markers? !ese are routine questions a&ected by the use of mathematics in science, including biology, medicine, public health, and agriculture.
To have a rich foundation in biology, you need to include and apply quantitative methods to the study of biology. !is is particularly true for a laboratory experience. Quantitative reasoning is an essential part of inquiry in biology. Many mathematical tools (e.g., statistical tests) were developed originally to work out biological problems.
Mathematics can help biologists (and biology students) grasp and work out problems that are otherwise:• Too big (such as the biosphere)• Too slow (macroevolution)• Too remote in time (early extinctions)• Too complex (human brain)• Too small (molecular structures and interactions)• Too fast (photosynthesis)• Too remote in space (life in extreme environments)• Too dangerous or unethical (how infectious agents interact with human populations)
!e laboratory investigations in this manual were chosen to provide you with an opportunity to do biology — to explore your own questions and try to "nd answers to those questions. Many of the investigations provide a preliminary, guided exploration to introduce you to a way of looking at a biology problem, or method for studying it, providing just enough familiarity with the topics so that you can begin asking your own questions and investigating them. An essential part of that exploration includes an introduction to various quantitative skills — mathematical routines, concepts, methods, or operations used to interpret information, solve problems, and make decisions — that you will need in order to explore the investigative topic adequately.
!e quantitative skills you’ll apply as you carry out the investigations in this lab manual are for the most part the same skills you have been acquiring in your mathematics courses. For many of the skills required in these labs, you already understand how to do the math, and these investigations simply extend the application of those math skills. Your teacher can help to guide you as you supplement and review the quantitative skills required for the various laboratory investigations in this manual.
S10 Chapter 3
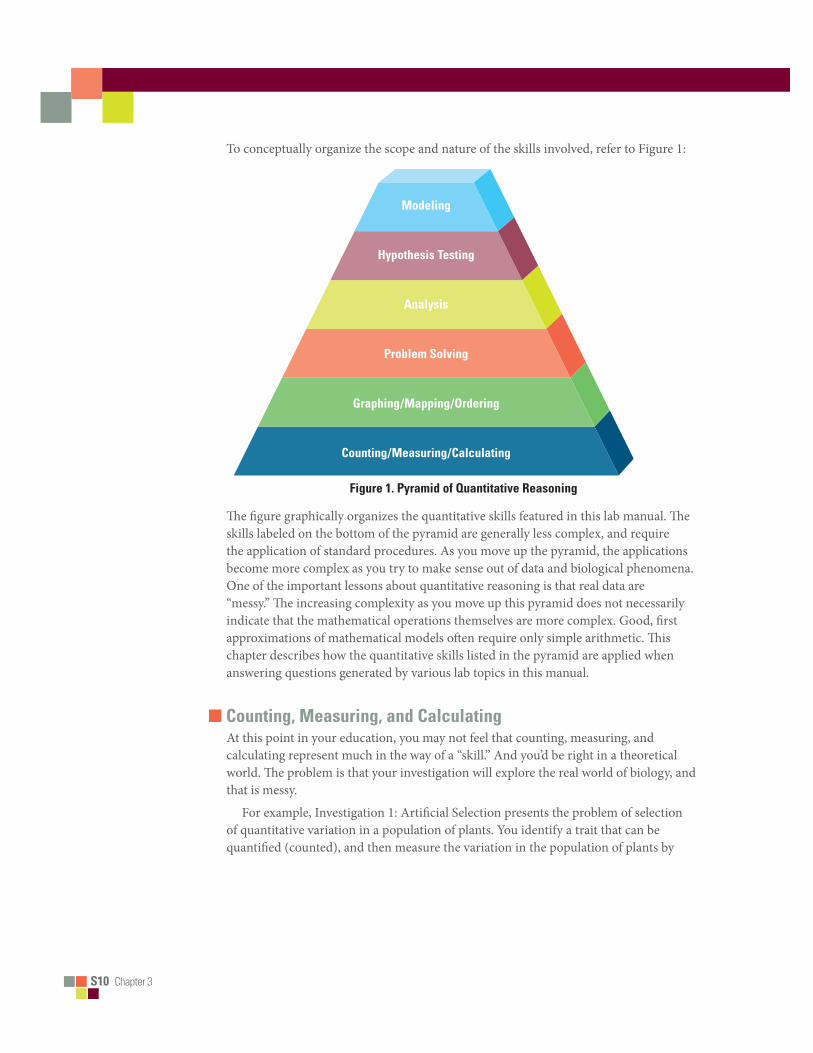
To conceptually organize the scope and nature of the skills involved, refer to Figure 1:
Bio_Intro_Lab01_01
Counting/Measuring/Calculating
Graphing/Mapping/Ordering
Problem Solving
Analysis
Hypothesis Testing
Modeling
Figure 1. Pyramid of Quantitative Reasoning
!e "gure graphically organizes the quantitative skills featured in this lab manual. !e skills labeled on the bottom of the pyramid are generally less complex, and require the application of standard procedures. As you move up the pyramid, the applications become more complex as you try to make sense out of data and biological phenomena. One of the important lessons about quantitative reasoning is that real data are “messy.” !e increasing complexity as you move up this pyramid does not necessarily indicate that the mathematical operations themselves are more complex. Good, "rst approximations of mathematical models o#en require only simple arithmetic. !is chapter describes how the quantitative skills listed in the pyramid are applied when answering questions generated by various lab topics in this manual.
■ Counting, Measuring, and CalculatingAt this point in your education, you may not feel that counting, measuring, and calculating represent much in the way of a “skill.” And you’d be right in a theoretical world. !e problem is that your investigation will explore the real world of biology, and that is messy.
For example, Investigation 1: Arti"cial Selection presents the problem of selection of quantitative variation in a population of plants. You identify a trait that can be quanti"ed (counted), and then measure the variation in the population of plants by
Chapter 3 S11
counting. !is is not always as easy as it sounds. You will notice that some of the plants in your population are more hairy than others, so this is the trait you select. What do you count? All the hairs? Some of the hairs on speci"c parts of the plant? On how many plants? A#er observing one of your plants more closely, you see that it has very few (if any) hairs, but another plant has hundreds. !ese hairs are small. You have a limited amount of time to make your counts. How do you sample the population? A#er discussion with your lab partner(s), you and your class decide to count just the hairs on the "rst true leaf ’s petiole (stalk attaching the blade to the stem) — a much smaller and more reasonable amount to count, but you’ll still need to work out whether or not it is a representative sample.
Measuring phenomena in the real world presents similar challenges. Investigation 10: Energy Dynamics introduces you to energy dynamics by measuring the biomass of growing organisms. How do you measure the mass of a small caterpillar? What about the water in the organism? Is water included in “biomass”? It is your challenge to come up with solutions to these problems, and to de"ne all measurements carefully so that someone could measure in the same way you did and replicate the experiment. Perhaps you could measure a quantity of caterpillars and sacri"ce a few caterpillars to estimate how much the “wet mass” of a caterpillar is biomass, and how much is water. You will have to perform relatively simple calculations, including percentages, ratios, averages, and means.
Nearly every lab investigation requires these kinds of operations and decisions. What is di&erent about this manual is that the decisions are up to you. !e manual doesn’t make the decisions for you. !ere are almost always a number of reasonable, productive solutions to such problems. Make sure that your decisions are reasonable and provide a good solution to the problem you are studying.
Precision needed in the experiment is also a consideration and a decision you have to make. Increasing precision requires more time and resources. How precise do your data need to be for you to support or reject your hypothesis?
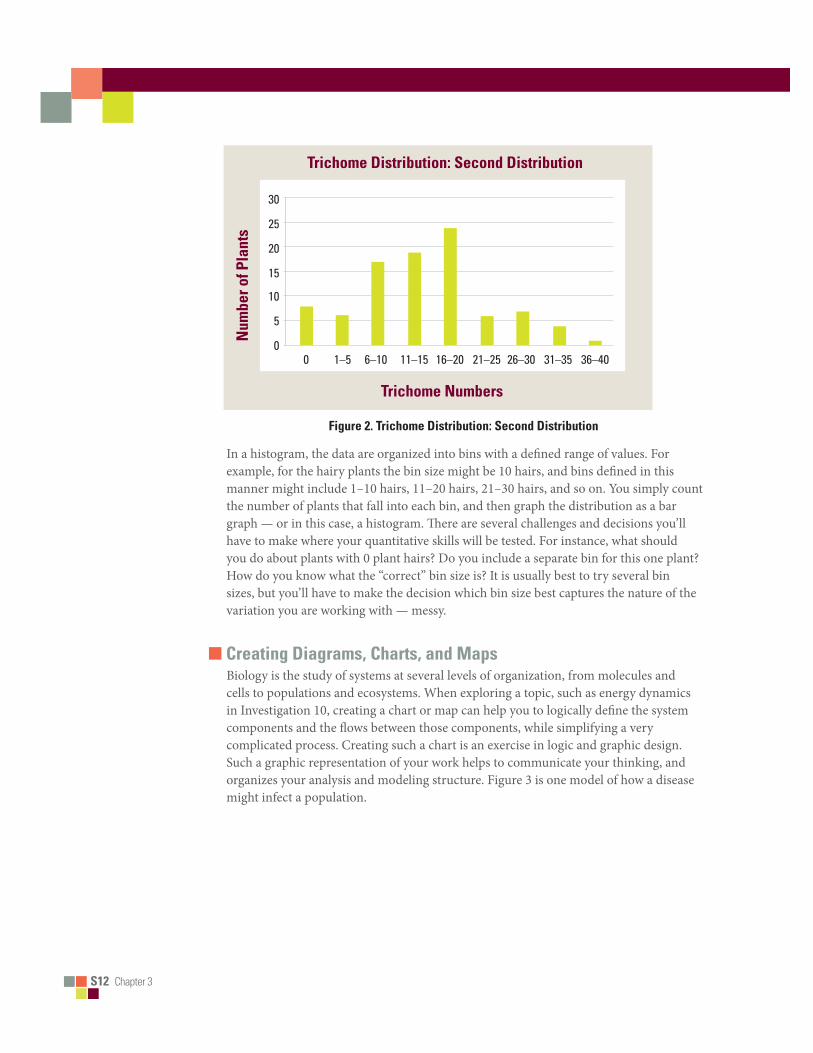
■ Graphing, Mapping, and Ordering: Histograms of Variation and/or Energy Flow DiagramsTo build on the previous two examples, consider how the data counted and measured should be represented — not numerically, but with graphs or diagrams. For example, consider the examination of the variation of a quantitative trait in a population of plants. How do you best represent these data? If you count the hairs (trichomes) in a population of 150 plants, do you present each data point on a graph, or do you compile the data into an overall picture? If all data points are the same, then there would be no need to present data graphically, but the messy reality is that the counts likely could vary from 0 to more than 50 hairs per plant. For this reason, a histogram (see Figure 2) is o#en used to represent the variability and distribution of population data.
S12 Chapter 3
Trichome Numbers
Trichome Distribution: Second Distribution
Num
ber o
f Pla
nts
0 1–5 6–10 11–15 16–20 21–25 26–30 31–35 36–40
30
25
20
15
10
5
0
Figure 2. Trichome Distribution: Second Distribution
In a histogram, the data are organized into bins with a de"ned range of values. For example, for the hairy plants the bin size might be 10 hairs, and bins de"ned in this manner might include 1–10 hairs, 11–20 hairs, 21–30 hairs, and so on. You simply count the number of plants that fall into each bin, and then graph the distribution as a bar graph — or in this case, a histogram. !ere are several challenges and decisions you’ll have to make where your quantitative skills will be tested. For instance, what should you do about plants with 0 plant hairs? Do you include a separate bin for this one plant? How do you know what the “correct” bin size is? It is usually best to try several bin sizes, but you’ll have to make the decision which bin size best captures the nature of the variation you are working with — messy.
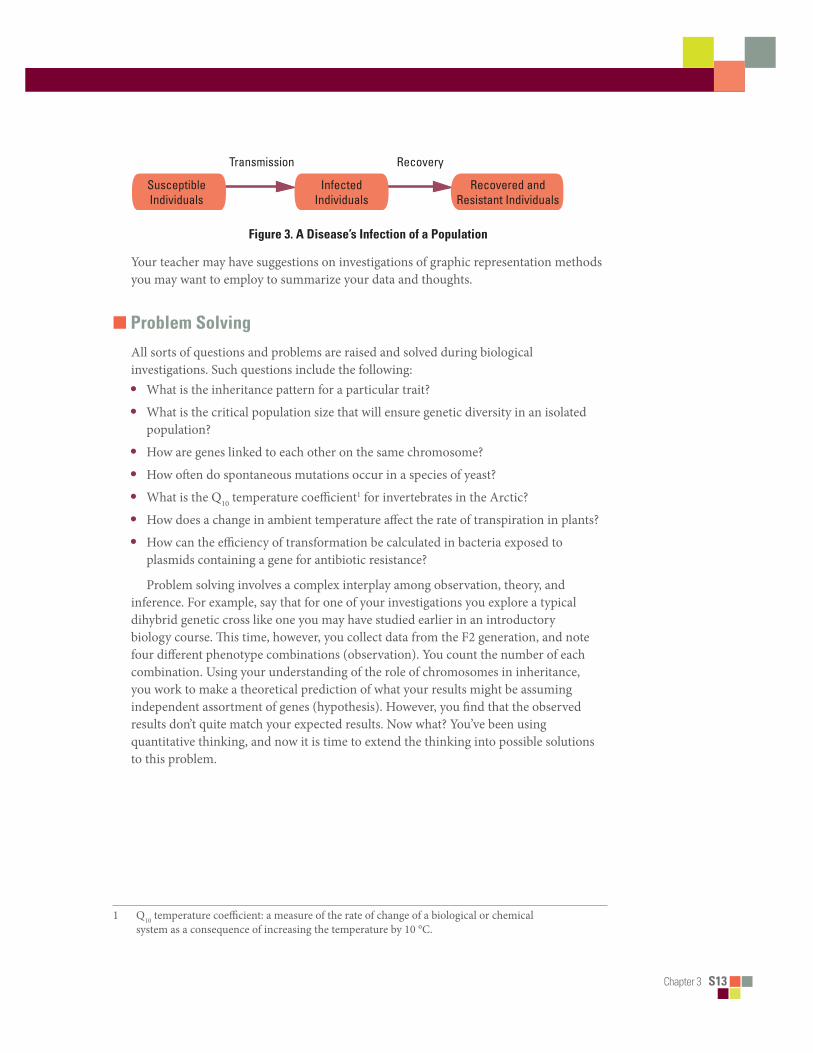
■ Creating Diagrams, Charts, and MapsBiology is the study of systems at several levels of organization, from molecules and cells to populations and ecosystems. When exploring a topic, such as energy dynamics in Investigation 10, creating a chart or map can help you to logically de"ne the system components and the %ows between those components, while simplifying a very complicated process. Creating such a chart is an exercise in logic and graphic design. Such a graphic representation of your work helps to communicate your thinking, and organizes your analysis and modeling structure. Figure 3 is one model of how a disease might infect a population.
Chapter 3 S13
Transmission Recovery
Recovered andResistant Individuals
InfectedIndividuals
SusceptibleIndividuals
Figure 3. A Disease’s Infection of a Population
Your teacher may have suggestions on investigations of graphic representation methods you may want to employ to summarize your data and thoughts.
■ Problem SolvingAll sorts of questions and problems are raised and solved during biological investigations. Such questions include the following: • What is the inheritance pattern for a particular trait? • What is the critical population size that will ensure genetic diversity in an isolated
population?• How are genes linked to each other on the same chromosome?• How o#en do spontaneous mutations occur in a species of yeast?• What is the Q10 temperature coe$cient1 for invertebrates in the Arctic?• How does a change in ambient temperature a&ect the rate of transpiration in plants?• How can the e$ciency of transformation be calculated in bacteria exposed to
plasmids containing a gene for antibiotic resistance?
Problem solving involves a complex interplay among observation, theory, and inference. For example, say that for one of your investigations you explore a typical dihybrid genetic cross like one you may have studied earlier in an introductory biology course. !is time, however, you collect data from the F2 generation, and note four di&erent phenotype combinations (observation). You count the number of each combination. Using your understanding of the role of chromosomes in inheritance, you work to make a theoretical prediction of what your results might be assuming independent assortment of genes (hypothesis). However, you "nd that the observed results don’t quite match your expected results. Now what? You’ve been using quantitative thinking, and now it is time to extend the thinking into possible solutions to this problem.
1 Q10 temperature coe$cient: a measure of the rate of change of a biological or chemical system as a consequence of increasing the temperature by 10 °C.
S14 Chapter 3
In this case, the deviation from expected may be due to random chance, or it may be due to a phenomenon known as linkage, where two genes are located close together on the same chromosome instead of on separate chromosomes. !ere is not enough space here to fully explore the strategies for solving such a problem, but realize that the challenge requires a di&erent level of commitment on your part to work through the problem and solve it. Instead of the instructions for each lab investigation walking you through such problems step by step, this manual provides you with opportunities to explore problems you can solve on your own, which will give you a deeper learning experience.
■ Analysis When you start to design your own investigations to answer your own questions, you may "nd that appropriate and adequate data analysis is a challenge. !is is the result of having done too many investigations that have the analysis scripted for you. From the very "rst inkling of the question that you plan to investigate, you also should consider how you plan to analyze your data. Data analysis describes your data quantitatively. Descriptive statistics help to paint the picture of the variation in your data; the central tendencies, standard error, best-"t functions, and the con"dence that you have collected enough data. Analysis helps you to make your case when arguing for your conclusion that your data meet accepted standards for reliability and validity. Data analysis is complex. Obviously, there is not enough space in this overview to do the topic justice, but do not let this deter you. Data analysis is an essential component of each investigation in this manual, and is integral to the communication process. Your teacher will be a valuable guide in this process.
■ Hypothesis TestingIn the investigations in this manual, you are asked to modify your question into an appropriate hypothesis. Your experimental design should provide evidence that will help you to conclude whether or not your hypothesis should be accepted. Part of the evidence needed to produce such a conclusion is based on a number of statistical tests that are designed for speci"c situations. You may be familiar with a statistical hypothesis test, such as a chi-square test or a T-test. !ese tests can help you to determine probability that the data you have sampled are signi"cantly di&erent from a theoretical population. You’ve undoubtedly read about such tests, as they are applied when testing new drug treatments or medical procedures. Your teacher can help guide you as you select the methods appropriate to your study. Deciding on the appropriate methods for hypothesis testing (statistical tests) before you carry out your experiment will greatly facilitate your experimental design.
Chapter 3 S15
■ ModelingNot all biological research involves wet lab investigations2. Investigations also can involve a quantitative model. Quantitative models are o#en computer based. !inking about and developing computer models may seem to be a new way of thinking and doing biology, but actually you’ve been constructing mental models of biological phenomena since you "rst began your study of biology. Models are simpli"cations of complex phenomena, and are important tools to help drive prediction and identify the important factors that are largely responsible for particular phenomena.
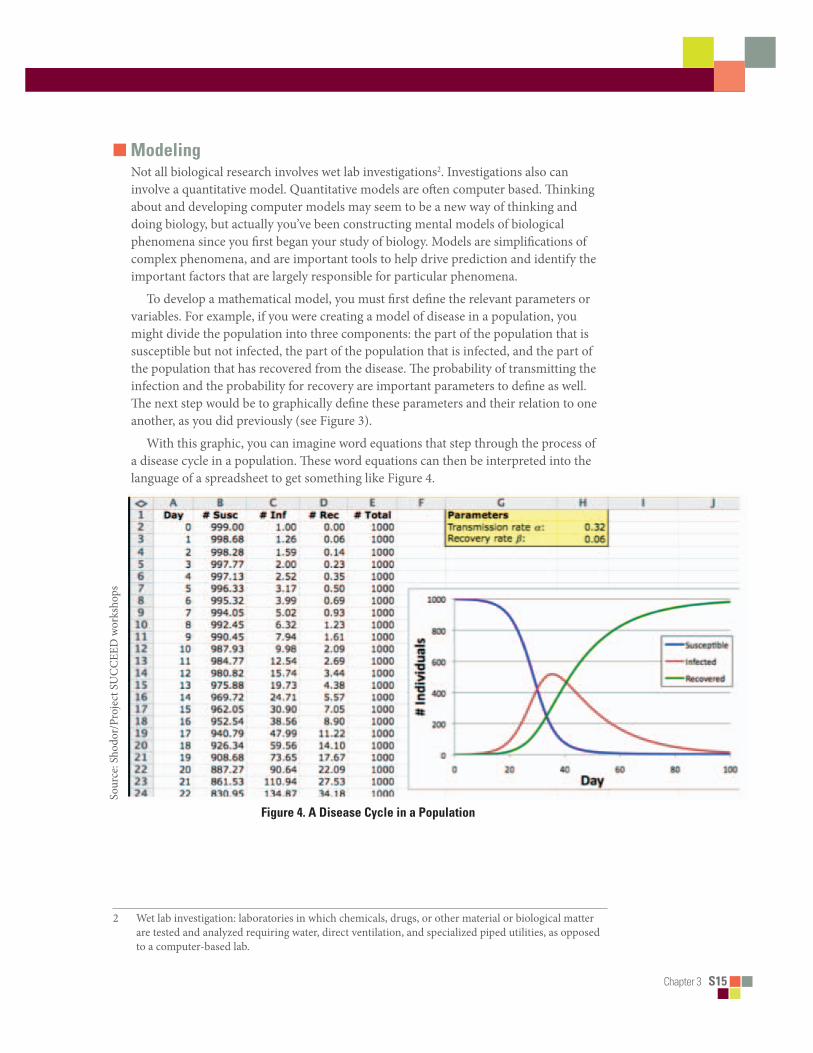
To develop a mathematical model, you must "rst de"ne the relevant parameters or variables. For example, if you were creating a model of disease in a population, you might divide the population into three components: the part of the population that is susceptible but not infected, the part of the population that is infected, and the part of the population that has recovered from the disease. !e probability of transmitting the infection and the probability for recovery are important parameters to de"ne as well. !e next step would be to graphically de"ne these parameters and their relation to one another, as you did previously (see Figure 3).
With this graphic, you can imagine word equations that step through the process of a disease cycle in a population. !ese word equations can then be interpreted into the language of a spreadsheet to get something like Figure 4.
Figure 4. A Disease Cycle in a Population
Sour
ce: S
hodo
r/Pro
ject S
UCC
EED
wor
ksho
ps
2 Wet lab investigation: laboratories in which chemicals, drugs, or other material or biological matter are tested and analyzed requiring water, direct ventilation, and specialized piped utilities, as opposed to a computer-based lab.

S16 Chapter 3
Models help to provide insight and guidance for an investigation. !ey help to focus the investigation on parameters that are most in%uential. Models have to be checked against real data. !e assumptions and the limitations of any model should be explicitly articulated. Building models is a challenge, but it is a challenge that, when met, pays very large dividends in learning.
■ REFERENCESJohnson, A.D. 2009. 40 Inquiry Exercises for the College Biology Lab. Arlington, VA:
NSTA Press.KWWS���VKRGRU�RUJ�VXFFHHG�FXUULFXOXP�DSSUHQWLFHVKLS�0RGHOLQJ�([FHO�/HVVRQ3ODQ���
Microso# Excell II activity, Project Succeed workshops, Shodor.Waterman, M., and E. Stanley. 2008. Biological Inquiry: A Workbook of Investigative
Cases for Campbell and Reece Biology. 8th ed. San Francisco, CA: Pearson/Benjamin Cummings.