Embed Size (px)
Citation preview
PERFORMANCE DETAILS
GOAL 3: Ensure the Accessibility, Affordability, and Accountability of Higher Education and Better Prepare
Students and Adults for Employment and Future Learning
Overview
Goal 3 Resources Strategic Objectives: ($ in thousands)
• Increase success in and completion of quality postsecondary education
$26,268,750
$29,173,803
$0
$5,000,000
$10,000,000
$15,000,000
$20,000,000
$25,000,000
$30,000,000
$35,000,000
FY 2009 FY 2008
(Requested)
• Deliver student financial aid to students and parents effectively and efficiently
• Prepare adult learners and individuals with disabilities for higher education, employment, and productive lives
Goal 3 PART Ratings by
Program*
Effective2%
Moderately Effective
7%
Adequate39%
Ineffective5%
Results Not Demonstrated
46%
* Detail may not total to 100% due to rounding.
Met/Exceeded23%
Not Met28%
Without Data49%
Goal 3 FY 2007 Percent of Targets Note: Each year the Department analyzes the percentage of program performance targets that were met or exceeded, not met but improved over time, not met, or for which data are not yet available. Since the Department has a lag in the time data are received for the established targets, the FY 2007 target results are presented here. For more information on PART Ratings by Programs and Percent of Targets Met and Not Met, see Program Performance Summary at the end of this goal.
FY 2008 Performance and Accountability Report—U.S. Department of Education 81

PERFORMANCE DETAILS GOAL 3: ENSURE THE ACCESSIBILITY, AFFORDABILITY, AND ACCOUNTABILITY OF HIGHER EDUCATION
Key Measures
During FY 2008, the Department monitored progress on the new measures and goals established in 2007, which are aligned with the recommendations of the Commission on Higher Education, the Academic Competitiveness Council and the Secretary’s Action Plan for Higher Education. These strategies focus on ensuring the accessibility, affordability and accountability of higher education institutions, and better preparing students for employment and future learning. In order to remain competitive in the dynamic global economy, and to meet America’s current and future needs, higher education must continue to be innovative, use technology effectively, measure student outcomes, and conduct rigorous evaluations of its own performance.
The data presented here show the progress that the Department has made to date and provide the starting point for forward movement to meet the challenges faced by adult learners, postsecondary students, their families and institutions of higher education. According to data from the Bureau of the Census, only 36 percent of Americans over the age of 25 have an associate’s degree or higher. As a nation, more individuals must enroll in and complete a postsecondary education program. Institutions of higher education must become more transparent in providing relevant information to the public and more attuned to trends in global economic development.
See page 46 for an explanation of the documentation fields for key measures.
Strategic Goal 3, Objective 1: Increase success in and completion of quality postsecondary education
Affordability is fundamental for promoting access to higher education, and academic preparation is also fundamental for access and critical for success once students are enrolled. Grants and loans are the largest source of federal financial support to postsecondary students. In FY 2008, the Department delivered or supported the delivery of approximately $96 billion in grant, work-study and loan assistance federal aid to almost 11 million postsecondary students and their families throughout America. These students attend approximately 6,200 institutions of higher education accredited by dozens of accrediting agencies. Many of these students receive loans from approximately 3,100 lenders with 35 guaranty agencies guaranteeing those loans.
In September 2007 President Bush signed the College Cost Reduction and Access Act (CCRAA), providing the largest increase in student aid funding in a generation. This landmark legislation, which was to an extent based on proposals advanced in the 2008 President's Budget, invested over $15 billion in new mandatory funds over 5 years to raise the maximum Federal Pell Grant to $5,400 by award year 2012-2013.
The federal TRIO programs continue to help low-income, first generation students, who are traditionally underrepresented in higher education, prepare for, enroll in and succeed in college. TRIO Upward Bound and Talent Search programs help low-income, first generation students prepare for college. TRIO Educational Opportunity Centers (EOC) help adults enroll in college. Student Support Services fosters retention and graduation support to students who are enrolled in postsecondary schools and the McNair Post-Baccalaureate Achievement prepares undergraduate students who are underrepresented in graduate education for doctoral study. With a focus on student outcomes, the Department measured TRIO program performance by assessing the percentage of Upward Bound, EOC and Talent Search students enrolling in college and college completion rates for
FY 2008 Performance and Accountability Report—U.S. Department of Education 82

PERFORMANCE DETAILS GOAL 3: ENSURE THE ACCESSIBILITY, AFFORDABILITY, AND ACCOUNTABILITY OF HIGHER EDUCATION
FY 2008 Performance and Accountability Report—U.S. Department of Education 83
Student Support Services students and the percentage of McNair participants enrolling and persisting in graduate school.
The Academic Competitiveness Grant Program, which first awarded grants to nearly 300,000 students during the 2006-07 academic year, encourages students to take more challenging courses in high school.
The National SMART Grant Program, which awarded the first grants to nearly 61,000 students during the 2006-07 academic year, encourages students to pursue college majors in high demand in the global economy, such as science, mathematics, technology, engineering, and critical foreign languages.
In addition, the Department will design criteria for identifying successful community colleges. Possible indicators of success include dual enrollment/early college programs; meaningful partnerships with four-year institutions or industry; developmental education programs that work for students; high transfer rates to four-year institutions; career pathways that are well-articulated and meaningful for high school-to-college and adult education-to-career; and the use of data to drive institutional decision-making. The Department will broadly disseminate innovative practices and program details and will fund colleges to replicate successful programs and initiatives in other locations.
Measures for Objective 1 2005 2006 2007 2008 Postsecondary Enrollment Target Actual Target Actual Target Actual Target Actual 3.1.A. Percentage of high school graduates aged 16–24 enrolling immediately in college (89a0ri)
* 68.6 68 66 68 Dec. 2008
* New measure in 2006, so no target. The 2006 actual served as the baseline.
Source: U.S. Department of Commerce, Bureau of the Census, Current Population Survey.
Analysis of Progress. The enrollment rate declined slightly from 2006 to 2007.
Data Quality and Timeliness. The Strategic Plan for Fiscal Years 2007-2012, published in May 2007 included measures developed in 2006. Data for the 2007-2008 school year (column “2008” in the table) are expected for release December 2008.
Target Context. We did not meet our 2007 target of 68 percent.
Report Explanation. Although overall enrollment declined from 2006 to 2007, the gap between enrollment of white and Hispanic students narrowed dramatically from 19.2 to 10.6 percent and the gap between white and black students narrowed from 17.5 to 13.0 percent. Since 2002, the percentage of high school graduates enrolling immediately in college has fluctuated between 64 and 69 percent.

PERFORMANCE DETAILS GOAL 3: ENSURE THE ACCESSIBILITY, AFFORDABILITY, AND ACCOUNTABILITY OF HIGHER EDUCATION
Figure 14. Percentage of Upward Bound Participants Enrolling in College
65 65 65 65 657069.3 74.2
78.4
0102030405060708090
2003 2004 2005 2006 2007 2008
Target Actual
Source: U.S. Department of Education, Office of Postsecondary Education, Upward Bound Program Annual Performance Report.
2005 2006 2007 2008 Measures for Objective 1 Postsecondary Enrollment Target Actual Target Actual Target Actual Target Actual 3.1.B. Percentage of Upward Bound participants enrolling in college (1627)
65 78.4 65 Dec. 2008
Dec. 2009
Dec. 2010 65 70
Source: U.S. Department of Education, Office of Postsecondary Education; Upward Bound Program Annual Performance Report.
Analysis of Progress. Based on actual data significantly increasing over recent years, targets beyond 2008 have been increased.
Data Quality and Timeliness. The annual performance report comprises self-reported data; a variety of data quality checks are used to assess the completeness and reasonableness of the data submitted.
Target Context. Based on consecutive years of performance exceeding targets, the targets were increased to 70 percent for 2008 and 75 percent for 2009. The target for FY 2008 was increased to 70 percent as part of the fall 2006 PART update and to 75 percent for 2009 in the spring 2007 PART update.
Report Explanation. The percentage is the percent of “college ready” participants who enroll in a postsecondary institution.
Note: The 78.3 percent enrollment rate previously reported for FY 2006 was reported in error.
Additional Information. The Upward Bound Program Web site may be accessed at: http://www.ed.gov/programs/trioupbound/index.html
FY 2008 Performance and Accountability Report—U.S. Department of Education 84

PERFORMANCE DETAILS GOAL 3: ENSURE THE ACCESSIBILITY, AFFORDABILITY, AND ACCOUNTABILITY OF HIGHER EDUCATION
FY 2008 Performance and Accountability Report—U.S. Department of Education 85
Measures for Objective 1 2005 2006 2007 2008 Postsecondary Enrollment Target Actual Target Actual Target Actual Target Actual 3.1.C. Percentage of career and technical education students who have transitioned to postsecondary education or employment by December of the year of graduation (89a0rj)
* 87 88 87 89 86 90 May 2009
* New measure in 2005. The 2005 actual served as the baseline.
Source. Career and Technical Education Annual Performance Report and Grantee Performance Reports.
Analysis of Progress.
Data Quality and Timeliness. Actual data are entered through FY 2007. Data for 2008 are expected in May 2009, and a new baseline will be established under Carl D. Perkins Career and Technical Education Act of 2006 (Perkins IV) guidance. States submit their reports to the Department each year through an electronic system. At that time, each grant recipient must attest to the accuracy and completeness of their submission by entering an Electronic Personal Identification Number that is supplied to them by the Department. The Office of Vocational and Adult Education staff then completes a check on the accuracy and completeness of the data and follows up with states as necessary.
Target Context. We met our 2005 target of setting the baseline. The 2008 and 2009 targets are based on state-adjusted performance levels that were negotiated with and approved by the Department.
Report Explanation. The Secretary used the transition authority in section 4 of Perkins IV to allow states to develop and put in place new measurement approaches for the Perkins IV indicators. As a result, states are not required to report data on this indicator until 2009.
Measures for Objective 1 Postsecondary Persistence
2005 2006 2007 2008 Target Actual Target Actual Target Actual Target Actual
3.1.D. Percentage of full-time degree-seeking undergraduate students at Title IV institutions who were in their first year of postsecondary enrollment in the previous year and are enrolled in the current year at the same institution (89a0ry)
* 70 71 70 71 Dec. 2008
3.1.E. Percentage of first time full-time degree-seeking undergraduate students at Historically Black Colleges and Universities who were in their first year of postsecondary enrollment in the previous year and are enrolled in the current year at the same institution (1587)
N/A 65 65 64 66 62 66 Dec. 2008

PERFORMANCE DETAILS GOAL 3: ENSURE THE ACCESSIBILITY, AFFORDABILITY, AND ACCOUNTABILITY OF HIGHER EDUCATION
Measures for Objective 1 2005 2006 2007 2008 Postsecondary Persistence Target Actual Target Actual Target Actual Target Actual 3.1.F. Percentage of first time full-time degree-seeking undergraduate students at Hispanic-Serving Institutions who were in their first year of postsecondary enrollment in the previous year and are enrolled in the current year at the same institution (1601)
N/A 66 67 64 68 63.5 68 May 2008
* New measure in 2006. The 2006 actual served as the baseline.
Source: U.S. Department of Education, National Center for Education Statistics, Integrated Postsecondary Education Data System (IPEDS). Web site: http://nces.ed.gov/ipedspas.
Analysis of Progress. For 3.1.E and 3.1.F the rates declined slightly between FY 2006 and FY 2007. Data Quality and Timeliness. Data are provided by institutions and are subject to a rigorous review process by NCES. Beginning with FY 2008, persistence will be reported for the first time along with the numerator and denominator generating the percentage. Therefore, the rate established for any program can be aggregated as a mean instead of a median rate – increasing the accuracy of the measurement. Target Context.
3.1.D: We met our 2006 target of setting the baseline. We did not meet the 2007 national target of 71 percent.
3.1.E: Institutions report a persistence rate, not the numerator and denominator. As a result, the persistence rate for the HBCU program is calculated as a median. The target is derived by applying the difference between regression-based predicted values from Title IV institutions and actual grantee values for school year 2003-04, which was 3.6 percent. The reason for decline in persistence is unknown. The Department is beginning to analyze grantee performance for this program which may provide some insight into factors behind this decline.
3.1.F: The HBCU program actual persistence rate of 64 percent in FY 2004 was multiplied by 1.0363 to generate the long-term target (for 2009) of 66 percent. Annual increases are estimated to be 0.6 percent each year through 2009 and 0.3 percent beginning in 2010.
Report Explanation. 3.1.D: Persistence measures the percentage of full-time degree-seeking undergraduate students at
Title IV institutions who were in their first year of postsecondary enrollment in the previous year and are enrolled in the current year at the same institution.
3.1.F: Institutions report a persistence rate, not the numerator and denominator. As a result, the persistence rate for the HSI program is calculated as a median. The target is derived by applying the difference between regression-based predicted values from Title IV institutions and actual grantee values for school year 2003-04 which was 1.12 percent. Therefore, the HSI program actual persistence rate of 66.5 percent in FY 2004 was multiplied by 1.0112 to generate the long-term target (for 2009) of 68 percent. Annual increases are estimated to be 0.2 percent each year through 2009 and 0.1 percent beginning in 2010.
FY 2008 Performance and Accountability Report—U.S. Department of Education 86

PERFORMANCE DETAILS GOAL 3: ENSURE THE ACCESSIBILITY, AFFORDABILITY, AND ACCOUNTABILITY OF HIGHER EDUCATION
Additional Information. The Historically Black Colleges and Universities Program Web site may be accessed at http://www.ed.gov/programs/iduestitle3b/index.html. The Hispanic-Serving Institutions Program Web site may be accessed at http://www.ed.gov/programs/idueshsi/index.html.
2005 2006 2007 2008 Measures for Objective 1 Postsecondary Completion Target Actual Target Actual Target Actual Target Actual 3.1.G. Percentage of students enrolled at all Title IV institutions completing a four-year degree within six years of enrollment (89a0rz)
* 57.1 56 57.5 57 Jan. 2009
Jul. 2009 57
3.1.H. Percentage of freshmen participating in Student Support Services who complete an associate’s degree at original institution or transfer to a four-year institution within three years (1618)
* 24.5 27 24.6 27.5 Dec. 2008
Dec. 2009 27.5
3.1.I. Percentage of students enrolled at 4-year Historically Black Colleges and Universities graduating within six years of enrollment (1589)
* 38 37 38 39 Dec. 2008
Dec. 2009 39
3.1.J. Percentage of students enrolled at 4-year Hispanic-Serving Institutions graduating within six years of enrollment (1603)
* 35 34 35 37 Dec. 2008
Dec. 2009 37
3.1.K. Percentage of postsecondary career and technical education students who have completed a postsecondary degree or certification (89a0s0)
* 42 45 47 46 40 47 May 2009
* New measure in 2005. The 2005 actual served as the baseline.
Source:
3.1.G: U.S. Department of Education, NCES. Integrated Postsecondary Education Data System, Graduation Rate Survey
3.1.H: U.S. Department of Education, TRIO Annual Performance Report
3.1.I: U.S. Department of Education, NCES. Integrated Postsecondary Education Data System, Graduation Rate Survey
3.1.J: U.S. Department of Education, NCES. Integrated Postsecondary Education Data System, Graduation Rate Survey
3.1.K: Career and Technical Education Annual Performance Report; Grantee Performance Reports
Analysis of Progress.
3.1.G: Met our 2005 target of setting the baseline. We exceeded our 2006 target of 56 percent. The percentage of bachelor’s degree-seeking students completing a four-year degree within six years of enrollment also improved, increasing to 57.5 percent in FY 2006 from 57.1 percent in FY 2005.
FY 2008 Performance and Accountability Report—U.S. Department of Education 87

PERFORMANCE DETAILS GOAL 3: ENSURE THE ACCESSIBILITY, AFFORDABILITY, AND ACCOUNTABILITY OF HIGHER EDUCATION
3.1.H: Made progress from the prior year but did not meet our 2006 target of 27. The percentage of Student Support Service participants completing an Associates degree at original institution or transferring to a four-year institution increased slightly from 2005 to 2006, the first increase since 2003.
3.1.I: Exceeded our 2006 target of 37. The percentage of students enrolled at four-year Historically Black Colleges and Universities graduating within six years of enrollment remained unchanged in 2006.
3.1.J: Exceeded our 2006 target of 34. The percentage of students enrolled at four year Hispanic-Serving Institutions graduating within six years of enrollment remained unchanged in 2006.
3.1.K: We met our 2005 target of setting the baseline. We exceeded our 2006 target of 45 but did not meet our 2007 target of 46.
Report Explanation. 3.1.G: The data for FY 2005, 56.4 percent, was previously reported incorrectly.
3.1.H: Data reporting has recently been improved to report completion of associate's and bachelor's degrees separately.
3.1.I: The 2006 target for the four-year graduation rate was derived by applying the difference between regression-based predicted values from Title IV institutions and actual grantee values for a school year. Beginning with the FY 2007 target, values were established based on program experience.
3.1.J: Data for FY 2003 were recalculated and are now more accurate than previously reported. The target for the four-year graduation rate is derived by applying the difference between regression-based predicted values from Title IV institutions and actual grantee values for school year 2002-03, which was 3.54 percent. Annual increases are estimated to be 0.6 percent through 2009 and 0.3 percent beginning in 2010. The HSI program actual four-year graduation rate of 36 percent in FY 2004 was multiplied by 1.0354 (times 5/6) to generate the long-term target (for 2009) of 37 percent.
3.1.K The 2009 target is substantially lower that the 2007 target as many of the states have moved to more rigorous student definitions and measurement approaches for the Perkins IV core indicators. The Secretary used the transition authority in section 4 of Perkins IV to allow states to develop and put into place new measurement approaches for the Perkins IV indicators. As a result, states are not required to report data on this indicator until 2009.
Strategic Goal 3, Objective 2: Deliver student financial aid to students and parents effectively and efficiently
Federal Student Aid, an office of the U.S. Department of Education, ensures that all eligible individuals can benefit from federally funded or federally guaranteed financial assistance for education beyond high school.
The Federal Pell Grant Program helps ensure financial access to postsecondary education by providing grant aid to low- and middle-income undergraduate students. The most need-based of the Department’s student aid programs, Pell Grant awards vary according to the financial circumstances of students and their families. For the 2007–2008 award year, the Department disbursed $14.6 billion in Pell Grants averaging approximately $2,643 to 5.5 million students. The maximum Pell Grant award was $4,310 for the 2007–2008 award year. The maximum Pell Grant award increased to $4,731 for the 2008-2009 award year.
FY 2008 Performance and Accountability Report—U.S. Department of Education 88

PERFORMANCE DETAILS GOAL 3: ENSURE THE ACCESSIBILITY, AFFORDABILITY, AND ACCOUNTABILITY OF HIGHER EDUCATION
FY 2008 Performance and Accountability Report—U.S. Department of Education 89
In FY 2008, Federal Student Aid directly managed or oversaw almost $556 billion in outstanding loans—representing almost 95 million student loans to more than 30 million borrowers.
The Direct Loan Program lends funds directly to students and parents through participating schools. This program is funded by borrowings from the U.S. Department of the Treasury as well as an appropriation for subsidy costs. In FY 2008, the Department made $21.8 billion1 in net loans to 2.9 million recipients. Under the Federal Family Education Loan (FFEL) Program, students and parents can obtain loans through private lenders. Loan guaranty agencies insure these funds, and they are, in turn, reinsured by the federal government. During FY 2008, Federal Student Aid supported the delivery of $52.9 billion2 in net loans to 6.0 million FFEL recipients.
Measures for Objective 2 2005 2006 2007 2008
Target Actual Target Actual Target Actual Target Actual 3.2.A. Direct administrative unit costs for origination and disbursement of student aid (total cost per transaction) (1919)
* $4.24 $4.25 $4.03 $4.15 $3.65
Source: Federal Student Aid unit costs are derived from the Department’s Activity-Based Management program using direct administrative costs.
Analysis of Progress. Federal Student Aid has made significant progress in its efforts to reduce the administrative unit costs. The actual unit cost for origination and disbursement is significantly lower than the baseline amount set in FY 2006.
Data Quality and Timeliness. Actuals are the data reported as final in the current fiscal year. Because it takes some time after the closeout of the fiscal year to receive completed data and to validate results, the data lag by one year.
Target Context. Targets for this measure will decline slightly in 2009 from the 2008 target and are expected to remain flat in subsequent years. 1 Excludes consolidation loans of $5.8 billion. 2 Excludes consolidation loans of $9.3 billion.

PERFORMANCE DETAILS GOAL 3: ENSURE THE ACCESSIBILITY, AFFORDABILITY, AND ACCOUNTABILITY OF HIGHER EDUCATION
FY 2008 Performance and Accountability Report—U.S. Department of Education 90
Figure 15. Customer Service Level on the American Customer Satisfaction Index for the Free Application for Federal Student Aid on the Web
8281 81 80 80
N/A N/A
8683 83
8386
0102030405060708090
100
2003 2004 2005 2006 2007 2008
Target Actual
Source: Based on annual American Customer Satisfaction Index scores obtained through the Claes Fornell International Group
Measures for Objective 2 2005 2006 2007 2008
Target Actual Target Actual Target Actual Target Actual 3.2.B. Customer service level on the American Customer Satisfaction Index for the Free Application for Federal Student Aid (FAFSA) on the Web (2207)
86 81 83 80 82 80 83 83
Source: Annual American Customer Satisfaction Index scores obtained through the Claes Fornell International Group
Analysis of Progress. The target was met for 2008. With an American Customer Satisfaction Index score of 83 (on a 1-100 scale), Free Application for Federal Student Aid on the Web scores in the "Excellent" range in comparison to other entities that appear in the index. This category includes such high-performing companies as UPS, Amazon and Mercedes.
Data Quality and Timeliness. In 2008, the student aid applicants were asked through an electronic surveying capability their opinions about the experience directly after completing the online aid application. This new capability allowed us to obtain opinions directly after the experience rather than a month or more down the road and allowed us to expand the sample universe, yielding more accurate results.
Target Context. Targets are based upon ACSI customer satisfaction scores and we expect to show slight improvement in the out years.

PERFORMANCE DETAILS GOAL 3: ENSURE THE ACCESSIBILITY, AFFORDABILITY, AND ACCOUNTABILITY OF HIGHER EDUCATION
FY 2008 Performance and Accountability Report—U.S. Department of Education 91
Measures for Objective 2 2005 2006 2007 2008
Target Actual Target Actual Target Actual Target Actual 3.2.C. Pell Grant improper payments rate (89a0s2) * 3.48% 3.48% 4.11% 3.48% 3.69%**
* New measure in 2006. The 2006 actual served as the baseline. **FY 2008 data are draft based upon preliminary results.
Source: Free Application Federal Student Aid/IRS Data Statistical Study 2006-2007 Award Cycle Baseline Analysis Report
Analysis of Progress. We did not make our goal. The improper payment rate that results from the IRS study is based on a randomly selected group of applicants each year. As such, the rate is subject to arbitrary fluctuations that reflect the randomness of the sample for any given year. We continue to make refinements to the application process that, based on the results of the study, will ultimately lead to a lower level of improper payments.
Data Quality and Timeliness. FY 2008 data will be finalized sometime during the early part of FY 2009.
Target Context. Target remains the same from 2006 to 2008. Targets projected between 2009 and 2012 are predicted on a robust data match between IRS and the Department of Education. Currently the improper payment rate is based upon statistical averages.
Related Information. These data for FY 2007 and FY 2008 are estimated from a sampling of records from the Department's aid applicant file compared against statistical averages from the IRS. The improper payment rate has two parts, an over-award and under-award component, which are added together to estimate the overall rate. These over- and under-award components are stated as a proportion of the overall Pell Grant program awards.
Measures for Objective 2 2005 2006 2007 2008
Target Actual Target Actual Target Actual Target Actual 3.2.D. Direct Loan recovery rate (89a0s3) * 19% 19.5% 20.8% 19.75% 21%
* New measure in 2006. The 2006 actual served as the baseline.
Source: Debt Management Collection System
Analysis of Progress. The FY08 target of 19.75% was exceeded by one-and-a-quarter percentage points. Translated into dollars, approximately $2.244 billion or 21% of the $10.688 billion outstanding in the Direct Loan Program default portfolio was collected in the current fiscal year. One of the primary reasons FSA greatly exceeded the target was the economic stimulus payments, which led to a significant increase in Treasury Program Offsets.
Data Quality and Timeliness. Data are through the end of FY08.
Target Context. The recovery rate equals the sum of collections on defaulted loans divided by the outstanding default portfolio at the end of the previous year. Targeted recoveries for the out years are expected to increase slightly.

PERFORMANCE DETAILS GOAL 3: ENSURE THE ACCESSIBILITY, AFFORDABILITY, AND ACCOUNTABILITY OF HIGHER EDUCATION
Measures for Objective 2 2005 2006 2007 2008
Target Actual Target Actual Target Actual Target Actual 3.2.E. Federal Family Education Loan recovery rate (89a0s4) * 19.3% 19.5% 19.6% 19.5% 23.6%
* New measure in 2006. The 2006 actual served as the baseline.
Source: Debt Management Collection System
Analysis of Progress. The FY 2008 target of 19.50% was exceeded by slightly more than four percentage points. Translated into dollars, approximately $6.250 billion or 23.6% of the $26.470 billion in the outstanding Federal Family Education Loan Program default portfolio was collected in the current fiscal year. One of the primary reasons FSA greatly exceeded the target was the economic stimulus payments, which led to a significant increase in Treasury Program Offsets. Data Quality and Timeliness. Data are through the end of FY08.
Target Context. The recovery rate equals the sum of collections on defaulted loans divided by the outstanding default portfolio at the end of the previous year. Targeted recoveries for the out years are expected to increase slightly.
Strategic Goal 3, Objective 3: Prepare adult learners and individuals with disabilities for higher education, employment, and productive lives
Bureau of Labor Statistics projections indicate that 90 percent of the fastest-growing jobs will require education beyond high school and 40 percent of all new jobs will require at least an associate’s degree. As new jobs require increasing levels of proficiency in reading and mathematics, problem solving, teamwork, and communication skills, more adults without a bachelor’s degree will need both access to basic education programs and admission to community college certificate and degree programs. The role of adult education as a bridge to further education and training is central to the Department's vision. As part of the Secretary's higher education initiatives, the Department will work to transform adult education programs to include transition services that enable graduates to prepare for, enter, and succeed in postsecondary education. This ongoing process will require new forms of instruction, improved services, and collaborative relationships with other agencies and organizations.
Individuals with disabilities continue to experience high rates of unemployment and underemployment. Vocational rehabilitation plays a key role in helping these individuals prepare for, obtain, and maintain employment and lead productive lives. The Department will continue to support and monitor research leading to the development of interventions that support health and physical function, participation in and integration into the community, and employment of individuals with disabilities. The Department will work with states to identify practices that improve outcomes, to provide resources and technical assistance to enhance service effectiveness, and to increase the economic self-sufficiency of individuals with disabilities. Complementing the work of state vocational rehabilitation agencies, the Department will increase access to new and recycled assistive technology that gives students and employees with disabilities a greater competitive edge in a knowledge-based economy. Furthermore, the Department will work toward increasingly successful transitions of students with disabilities to employment and higher education.
Adult education and vocational rehabilitation programs must provide increasingly effective services to improve the skills and employment prospects of those they serve. The Department’s vocational rehabilitation programs help individuals with physical or mental
FY 2008 Performance and Accountability Report—U.S. Department of Education 92

PERFORMANCE DETAILS GOAL 3: ENSURE THE ACCESSIBILITY, AFFORDABILITY, AND ACCOUNTABILITY OF HIGHER EDUCATION
disabilities obtain employment and live more independently by providing grants that support job training and placement, medical and psychological services, and other individualized services. Annually, the Vocational Rehabilitation State Grants program helps more than 200,000 individuals with disabilities obtain employment.
The Department measures the progress of state vocational rehabilitation agencies by monitoring the percentage of individuals receiving services that achieve employment. The Department supports diploma equivalency and college readiness programs, rigorous academic and technical course work leading to an associate’s degree and certification programs, and expansion of the quality and timeliness of technical assistance in partnership with employers and other organizations.
Measures for Objective 3 2005 2006 2007 2008
Target Actual Target Actual Target Actual Target Actual 3.3.A. Percentage of state vocational rehabilitation agencies that meet the employment outcome standard for the Vocational Rehabilitation State Grants program (1681)
75 71 70 82 71 82 76 April 2009
Source: State agency data submitted to the Department’s Rehabilitation Services Administration (RSA); Case Service Report (RSA-911).
Analysis of Progress. In fiscal year 2006, the percentage of general and combined State Vocational Rehabilitation agencies that met the performance criterion increased significantly as compared to previous years. The percentage of general and combined vocational rehabilitation agencies that met the employment outcome standard in 2007 was the same as it was in 2006 at 82 percent. Of the 46 agencies meeting the standard, three met the standard in 2007 that had not met it in 2006, and three did not meet the standard that had met it in 2006.
Data Quality and Timeliness. State vocational rehabilitation agencies are required to submit their RSA-911 data by November 30 for the previous fiscal year. The data are considered very reliable because of the rigorous RSA editing process to which agency data are submitted. Data quality and timeliness have improved significantly in recent years. The RSA-911 database for fiscal years 2005 and 2006 was complete within 5 months of the close of fiscal year. Completion of the 2007 database was delayed because of late data submissions. However, RSA is working to ensure that the 2008 database is complete by February 2009 and available for timely analysis of performance data.
Target Context. Performance targets for this measure were initially established based on 2001 data. However, a change in program regulations and in labor market conditions led to declines in the percentage of individuals who achieved an employment outcome. As a result, the baseline was recalculated based on 2003 and 2004 data and targets for 2006 and 2007 were adjusted. The decline in employment outcomes stabilized in 2005 with improving economic conditions and performance targets for 2008 and future years were raised to reflect anticipated improvements in performance on this measure.
Report Explanation. This indicator is derived from State Vocational Rehabilitation Services program performance standards and indicators defined in the program regulations. For each Vocational Rehabilitation agency, RSA examines the percentage of individuals who achieve an employment outcome compared to all individuals whose cases were closed after receiving services. To achieve an employment outcome under this program, an individual must be employed in an integrated setting as a result of receiving Vocational Rehabilitation services and have maintained employment for a period of at least 90 days. To pass this indicator, a general or combined agency must achieve a rate of 55.8 percent.
FY 2008 Performance and Accountability Report—U.S. Department of Education 93

PERFORMANCE DETAILS GOAL 3: ENSURE THE ACCESSIBILITY, AFFORDABILITY, AND ACCOUNTABILITY OF HIGHER EDUCATION
FY 2008 Performance and Accountability Report—U.S. Department of Education 94
Figure 16. Percentage of Adults Served by the Adult Education State Grants Program With a High School Completion Goal Who Earn a High School Diploma or Recognized Equivalent
41 4246 46
52 53
44 45
51 49
59
0
10
20
30
40
50
60
70
2003 2004 2005 2006 2007 2008
Target Actual
Source: U.S. Department of Education, Office of Vocational and Adult Education, Adult Education Annual Program Performance Report.
Measures for Objective 3 2005 2006 2007 2008
Target Actual Target Actual Target Actual Target Actual 3.3.B. Percentage of adults served by the Adult Education State Grants program with a high school completion goal who earn a high school diploma or recognized equivalent (1386)
46 51 46 49 52 59 53 Dec. 2008
Source: U.S. Department of Education, Office of Vocational and Adult Education, Adult Education Annual Program Performance Report.
Analysis of Progress. The 2007 target was exceeded. Part of the explanation for the increase may stem from improved data collection methods used by the states to collect and report on this measure.
Data Quality and Timeliness. As a third-tier recipient of this data, the Office of Vocational and Adult Education must rely on the states and local programs to collect and report data within published guidelines. The Office of Vocational and Adult Education has developed a data quality review process for states based on the Department's Standards for Evaluating Program Performance Data.
Target Context. The Department negotiated approved targets with OMB for a 15-year period.

PERFORMANCE DETAILS GOAL 3: ENSURE THE ACCESSIBILITY, AFFORDABILITY, AND ACCOUNTABILITY OF HIGHER EDUCATION
FY 2008 Performance and Accountability Report—U.S. Department of Education 95
Figure 17. Percentage of Adults Served by the Adult Education State Grants Program With a Goal To Enter Postsecondary Education or Training Who Enroll in a Postsecondary Education or Training Program
26 2730
33 3739
30 3034 35
55
0
10
20
30
40
50
60
2003 2004 2005 2006 2007 2008
Target Actual
Source: U.S. Department of Education, Office of Vocational and Adult Education, Adult Education Annual Program Performance Report.
Measures for Objective 3 2005 2006 2007 2008
Target Actual Target Actual Target Actual Target Actual 3.3.C. Percentage of adults served by the Adult Education State Grants program with a goal to enter postsecondary education or training who enroll in a postsecondary education or training program (1387)
30 34 33 35 37 55 39 Dec. 2008
Source: U.S. Department of Education, Office of Vocational and Adult Education, Adult Education Annual Program Performance Report.
Analysis of Progress. There was a spike in the 2007 actual data because of improved follow-up methodologies implemented by the states and training and technical assistance, provided by the Office of Vocational and Adult Education in transitioning adult students into postsecondary education and training opportunities.
Data Quality and Timeliness. As a third-tier recipient of these data, the Office of Vocational and Adult Education must rely on the states and local programs to collect and report data within published guidelines. The Office of Vocational and Adult Education has developed a data quality review process for states based on the Department's Standards for Evaluating Program Performance Data.
Target Context. The Department negotiated approved targets with OMB for a 15-year period.

PERFORMANCE DETAILS GOAL 3: ENSURE THE ACCESSIBILITY, AFFORDABILITY, AND ACCOUNTABILITY OF HIGHER EDUCATION
FY 2008 Performance and Accountability Report—U.S. Department of Education
Figure 18. Percentage of Adults Served by the Adult Education State Grants Program With an Employment Goal Who Obtain a Job by the End of the First Quarter After Their Program Exit Quarter
37 38 40 40 41 4137 36 37
48
61
0
10
20
30
40
50
60
70
2003 2004 2005 2006 2007 2008
Target Actual
Source: U.S. Department of Education, Office of Vocational and Adult Education, Adult Education Annual Program Performance Report.
Measures for Objective 3 2005 2006 2007 2008
Target Actual Target Actual Target Actual Target Actual 3.3.D. Percentage of adults served by the Adult Education State Grants program with an employment goal who obtain a job by the end of the first quarter after their program exit quarter (1388)
40 37 40 48 41 61 41 Dec. 2008
96
Source: U.S. Department of Education, Office of Vocational and Adult Education, Adult Education Annual Program Performance Report.
Analysis of Progress. The program exceeded its 2007 target. Exceeding the performance target for 2007 resulted from improved follow-up methodologies implemented by the states to collect and report employment. Previously, the performance data reflected the percentage of adult learners with an employment goal who, upon exit from an adult education program, obtain a job.
Data Quality and Timeliness. As a third-tier recipient of these data, the Office of Vocational and Adult Education must rely on the states and local programs to collect and report data within published guidelines. The Office of Vocational and Adult Education has developed a data quality review process for states based on the Department's Standards for Evaluating Program Performance Data.

FY 2008 Performance and Accountability Report—
U.S. Department of Education 97
PE
RFO
RM
AN
CE
DE
TAILS
Goal 3: Ensure the Accessibility, Affordability, and Accountability of Higher Education
Program Performance Summary
GO
AL 3: E
NS
UR
E TH
E A
CC
ES
SIB
ILITY, AFFO
RD
AB
ILITY, AN
D A
CC
OU
NTA
BILITY
OF H
IGH
ER
ED
UC
ATIO
N
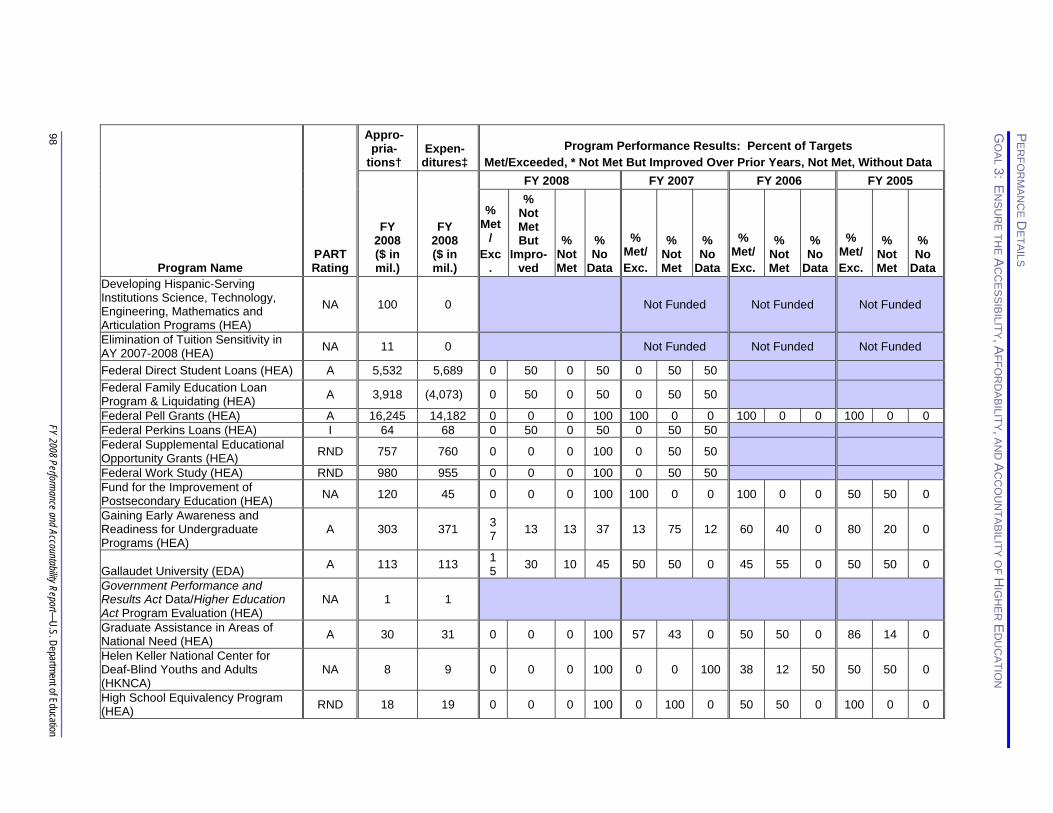
Eighty-four of our programs most directly support Goal 3. These programs are listed below. In the table, an overview is provided for the results of each program on its program performance measures. (See page 46 for the methodology of calculating the percentage of targets met, not met, and without data.) Individual program performance reports are available at http://www.ed.gov/about/reports/annual/2008report/program.html. Appropriation and expenditure data for FY 2008 are included for each of these programs.
Program Name PART Rating
Appro- pria-
tions† Expen-
ditures‡ Program Performance Results: Percent of Targets
Met/Exceeded, * Not Met But Improved Over Prior Years, Not Met, Without Data
FY 2008 ($ in mil.)
FY 2008 ($ in mil.)
FY 2008 FY 2007 FY 2006 FY 2005
% Met
/ Exc
.
% Not Met But
Impro-ved
% Not Met
% No
Data
% Met/ Exc.
% Not Met
% No
Data
% Met/ Exc.
% Not Met
% No
Data
% Met/ Exc.
% Not Met
% No
Data Adult Basic and Literacy Education State Grants (AEFLA) E 554 476 0 0 0 100 67 33 0 50 50 0 40 60 0
Adult Education National Leadership Activities (AEFLA) NA 7 7 0 0 0 100 0 100 0 0 100 0 0 100 0
Assistive Technology Programs (ATA) NA 30 32 0 100 0 0 100 0
B.J. Stupak Olympic Scholarships (HEA) RND 1 1 0 0 0 100 0 100 0 33 67 0
Byrd Honors Scholarships (HEA) RND 40 40 0 0 0 100 0 0 100 100 0 0 0 100 0 Child Care Access Means Parents in School (HEA) A 16 15 1
7 33 0 50 33 33 34 50 50 0
Client Assistance State Grants (RA) NA 12 11 0 0 0 100 100 0 0 100 0 0 100 0 0 College Access Challenge Grant Program (HEA) NA 66 0 Not Funded Not Funded Not Funded
College Assistance Migrant Program (HEA) RND 15 15 0 0 0 100 50 50 0 100 0 0 100 0 0
Demonstration Projects to Ensure Quality Higher Education for Students with Disabilities (HEA)
NA 7 6 0 0 0 100 0 0 100 100 0 0
Developing Hispanic-Serving Institutions (HEA) RND 93 95 0 0 0 100 0 25 75 50 50 0
PE
RFO
RM
AN
CE
DE
TAILS
GO
AL 3: E
NS
UR
E TH
E A
CC
ES
SIB
ILITY, AFFO
RD
AB
ILITY, AN
D A
CC
OU
NTA
BILITY
OF H
IGH
ER
ED
UC
ATIO
N 98
FY 2008 Performance and Accountability Report—
U.S. Department of Education
Appro- pria- Expen- Program Performance Results: Percent of Targets
tions† ditures‡ Met/Exceeded, * Not Met But Improved Over Prior Years, Not Met, Without Data FY 2008 FY 2007 FY 2006 FY 2005 %
% Not FY FY Met Met
2008 2008 / But % % % % % % % % % % % PART ($ in ($ in Exc Impro- Not No Met/ Not No Met/ Not No Met/ Not No
Program Name Rating mil.) mil.) . ved Met Data Exc. Met Data Exc. Met Data Exc. Met Data
Developing Hispanic-Serving Institutions Science, Technology, Engineering, Mathematics and Articulation Programs (HEA)
NA 100 0 Not Funded Not Funded Not Funded
Elimination of Tuition Sensitivity in AY 2007-2008 (HEA) NA 11 0 Not Funded Not Funded Not Funded
Federal Direct Student Loans (HEA) A 5,532 5,689 0 50 0 50 0 50 50 Federal Family Education Loan Program & Liquidating (HEA) A 3,918 (4,073) 0 50 0 50 0 50 50
Federal Pell Grants (HEA) A 16,245 14,182 0 0 0 100 100 0 0 100 0 0 100 0 0 Federal Perkins Loans (HEA) I 64 68 0 50 0 50 0 50 50 Federal Supplemental Educational Opportunity Grants (HEA) RND 757 760 0 0 0 100 0 50 50
Federal Work Study (HEA) RND 980 955 0 0 0 100 0 50 50 Fund for the Improvement of Postsecondary Education (HEA) NA 120 45 0 0 0 100 100 0 0 100 0 0 50 50 0
Gaining Early Awareness and Readiness for Undergraduate Programs (HEA)
A 303 371 37 13 13 37 13 75 12 60 40 0 80 20 0
Gallaudet University (EDA) A 113 113 15 30 10 45 50 50 0 45 55 0 50 50 0
Government Performance and Results Act Data/Higher Education Act Program Evaluation (HEA)
NA 1 1
Graduate Assistance in Areas of National Need (HEA) A 30 31 0 0 0 100 57 43 0 50 50 0 86 14 0
Helen Keller National Center for Deaf-Blind Youths and Adults (HKNCA)
NA 8 9 0 0 0 100 0 0 100 38 12 50 50 50 0
High School Equivalency Program (HEA) RND 18 19 0 0 0 100 0 100 0 50 50 0 100 0 0

FY 2008 Performance and Accountability Report—
U.S. Department of Education 99
PE
RFO
RM
AN
CE
DE
TAILS
GO
AL 3: E
NS
UR
E TH
E A
CC
ES
SIB
ILITY, AFFO
RD
AB
ILITY, AN
D A
CC
OU
NTA
BILITY
OF H
IGH
ER
ED
UC
ATIO
N
Appro- pria- Expen- Program Performance Results: Percent of Targets
tions† ditures‡ Met/Exceeded, * Not Met But Improved Over Prior Years, Not Met, Without Data FY 2008 FY 2007 FY 2006 FY 2005 %
% Not FY FY Met Met
2008 2008 / But % % % % % % % % % % % PART ($ in ($ in Exc Impro- Not No Met/ Not No Met/ Not No Met/ Not No
Program Name Rating mil.) mil.) . ved Met Data Exc. Met Data Exc. Met Data Exc. Met Data Historically Black Colleges and Universities Capital Financing (FCRA)
RND 18 12
Howard Un iversity (USC) A 233 233 0 0 0 100 0 33 67 100 0 0 0 100 0 Independent Living Services for Older Blind Individuals (RA) NA 32 33 0 0 0 100 0 0 100 0 0 100 67 0 33
Independent Living State Grants and Centers for Independent Living (RA) RND 96 95 0 0 0 100 0 0 100 60 0 40 0 0 100
International Education—Domestic (HEA) RND 94 92 0 0 0 100 0 0 100 5 25 70 33 0 67
International Education—Institute for Public Policy (HEA) NA 2 2 0 0 0 100 0 0 100 0 0 100
International Education—Overseas (MECEA) NA 13 12 0 0 0 100 0 0 100 9 0 91
Javits Fellowships (HEA) A 10 9 0 0 0 100 67 33 0 67 33 0 100 0 0 Leveraging Educational Assistance Partnership (HEA) RND 64 68 0 100 0
Migrant and Seasonal Farmworkers (RA) RND 2 2 0 0 0 100 0 0 100 0 0 100 100 0 0
Minority Science and Engineering Improvement (HEA) NA 9 8 0 0 0 100 0 0 100 0 0 100
Preparing Tomorrow’s Teachers to use Technology NA 0 1
National Institute for Literacy (AEFLA) RND 6 (560) 0 25 0 75 0 67 33 0 100 0
National Institute on Disability and Rehabilitation Research (RA) A 106 107 0 25 0 75 78 22 0 50 50 0 50 50 0
National Technical Institute for the Deaf (EDA) A 60 58 6
9 6 0 25 67 33 0 67 33 0 43 57 0
Projects With Industry (RA) A 19 17 0 0 0 100 0 0 100 75 25 0 50 50 0 Protection and Advocacy of Individual Rights (RA) NA 16 15 0 0 0 100 100 0 0 100 0 0 100 0 0

PE
RFO
RM
AN
CE
DE
TAILS
GO
AL 3: E
NS
UR
E TH
E A
CC
ES
SIB
ILITY, AFFO
RD
AB
ILITY, AN
D A
CC
OU
NTA
BILITY
OF H
IGH
ER
ED
UC
ATIO
N 100
FY 2008 Performance and Accountability Report—
U.S. Department of Education
Appro- pria- Expen- Program Performance Results: Percent of Targets
tions† ditures‡ Met/Exceeded, * Not Met But Improved Over Prior Years, Not Met, Without Data FY 2008 FY 2007 FY 2006 FY 2005 %
% Not FY FY Met Met
2008 2008 / But % % % % % % % % % % % PART ($ in ($ in Exc Impro- Not No Met/ Not No Met/ Not No Met/ Not No
Program Name Rating mil.) mil.) . ved Met Data Exc. Met Data Exc. Met Data Exc. Met Data
RSA Fld Rdr & Min Outrch Prorate Across Account NA 0 3
Strengthening Alaska Native and Native Hawaiian-Serving Institutions (HEA)
NA 27 11 0 0 0 100 0 25 75 67 0 33
Strengthening Asian American and Native American Pacific Islander-Serving Institutions (HEA)
NA 5 0 Not Funded Not Funded Not Funded
Strengthening Historically Black Colleges and Universities (HEA) RND 323 248 0 0 0 100 0 33 67 50 50 0
Strengthening Historically Black Graduate Institutions (HEA) RND 57 69 0 0 0 100 0 0 100 50 50 0
Strengthening Institutions (HEA) RND 78 80 0 0 0 100 0 25 75 0 50 50 Strengthening Native American-Serving Non-Tribal Institutions (HEA) NA 5 0 Not Funded Not Funded Not Funded
Strengthening Predominantly Black Institutions (HEA) NA 15 0 Not Funded Not Funded Not Funded
Strengthening TribaColleges and Unive
lly Controlled rsities (HEA) NA 53 27 0 0 0 100 25 0 75 67 33 0
Student Aid Administration (HEA) A 696 711 0 0 0 100 0 100 0 100 0 0 Supported Employment State Grants (RA) RND 29 28 0 0 0 100 100 0 0 100 0 0 0 100 0
Teacher Education Assistance for College and Higher Education Grants (CCRAA)
NA 7 1 Not Funded Not Funded Not Funded
Teachers for a Competitive Tomorrow—Baccalaureate (ACA) NA 1 0 Not Funded Not Funded Not Funded
Teachers for a Competitive Tomorrow—Masters (ACA) NA 1 0 Not Funded Not Funded Not Funded
Thurgood Marshall Legal Educational Opportunity Program (HEA)
NA 3 3 Not Funded

FY 2008 Performance and Accountability Report—
U.S. Department of Education 101
PE
RFO
RM
AN
CE
DE
TAILS
GO
AL 3: E
NS
UR
E TH
E A
CC
ES
SIB
ILITY, AFFO
RD
AB
ILITY, AN
D A
CC
OU
NTA
BILITY
OF H
IGH
ER
ED
UC
ATIO
N
Appro- pria- Expen- Program Performance Results: Percent of Targets
tions† ditures‡ Met/Exceeded, * Not Met But Improved Over Prior Years, Not Met, Without Data FY 2008 FY 2007 FY 2006 FY 2005 %
% Not FY FY Met Met
2008 2008 / But % % % % % % % % % % % PART ($ in ($ in Exc Impro- Not No Met/ Not No Met/ Not No Met/ Not No
Program Name Rating mil.) mil.) . ved Met Data Exc. Met Data Exc. Met Data Exc. Met Data Tribally Controlled Postsecondary Career and Technical Institutions (CTEA)
RND 8 8 0 0 0 100 0 0 100 100 0 0 0 100 0
TRIO** Educational Opportunity Centers (HEA) RND 47 47 0 0 0 100 0 0 100 100 0 0 0 100 0
TRIO** McNair Postbaccalaureate Achievement (HEA) ME 44 42 0 0 0 100 0 0 100 100 0 0 100 0 0
TRIO** Student Support Services (HEA) ME 281 186 0 0 0 100 0 0 100 67 33 0 50 50 0
TRIO** Talent Search (HEA) ME 143 144 0 0 0 100 0 0 100 0 100 0 100 0 0 T UpRIO** ward Bound (HEA) I 360 335 0 0 0 100 0 0 100 0 50 50 50 50 0 Underground Railroad Program NA 2 1 0 0 0 100 0 0 100 100 0 0 0 100 0 Aid for Institutions of Higher Education (HERA) NA 0 53
Vocational Rehabilitation Demonstration and Training Programs (RA)
RND 10 10 0 0 0 100 0 0 100 67 33 0 67 33 0
Vocational Rehabilitation Evaluation (RA) NA 1 2
Vocational Rehabilitation Grants for Indians (RA) A 35 35 0 0 0 100 100 0 0 100 0 0 100 0 0
Vocational Rehabilitation Program Improvement (RA) NA 1 1
Vocational Rehabilitation Recreational Programs (RA) NA 2 2 0 0 0 100 100 0 0 0 100 0 100 0 0
Vocational Rehabilitation State Grants (RA) A 2,839 2,454 0 0 0 100 33 67 0 80 20 0 50 50 0
Vocational Rehabilitation Training (RA) A 38 37 0 0 0 100 50 50 0 100 0 0 100 0 0
Administrative and Support Programs for Goal 3 (5,766) (1)
TOTAL 29,174 ^23,609
PE
RFO
RM
AN
CE
DE
TAILS
GO
AL 3: E
NS
UR
E TH
E A
CC
ES
SIB
ILITY, AFFO
RD
AB
ILITY, AN
D A
CC
OU
NTA
BILITY
OF H
IGH
ER
ED
UC
ATIO
N 102
FY 2008 Performance and Accountability Report—
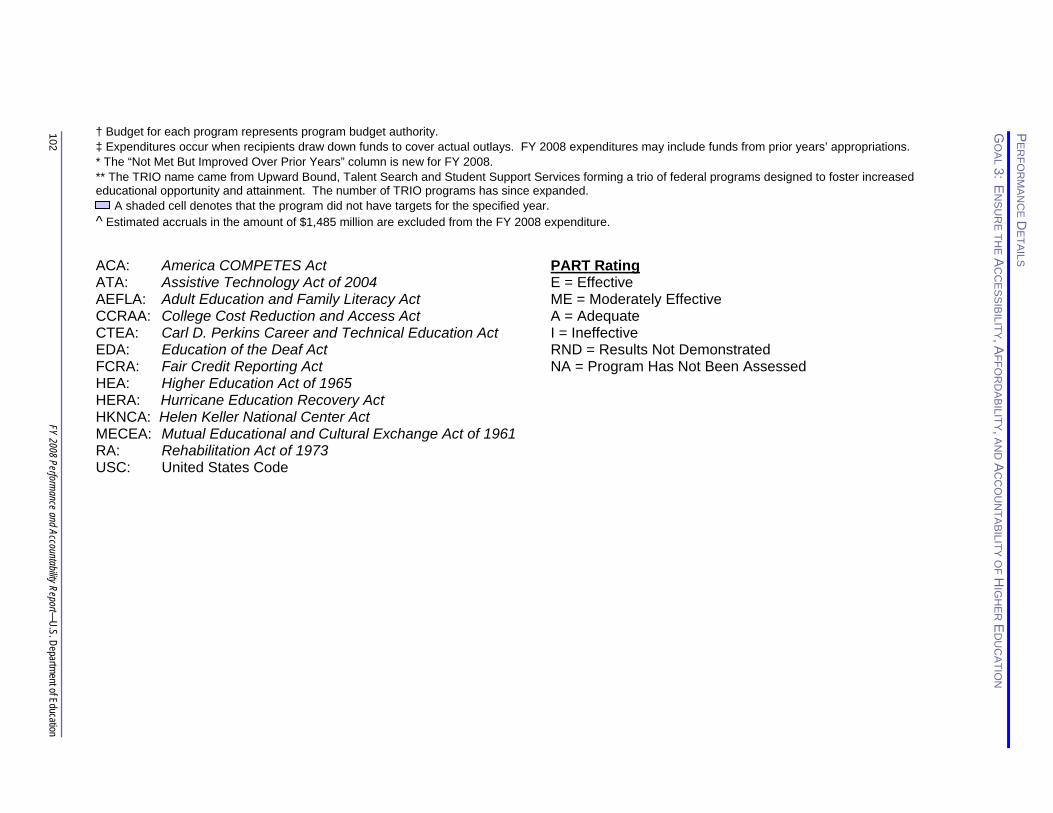
U.S. Department of Education † Budget for each program represents program budget authority.
‡ Expenditures occur when recipients draw down funds to cover actual outlays. FY 2008 expenditures may include funds from prior years’ appropriations. * The “Not Met But Improved Over Prior Years” column is new for FY 2008. ** The TRIO name came from Upward Bound, Talent Search and Student Support Services forming a trio of federal programs designed to foster increased educational opportunity and attainment. The number of TRIO programs has since expanded.
A shaded cell denotes that the program did not have targets for the specified year. ^ Estimated accruals in the amount of $1,485 million are excluded from the FY 2008 expenditure. ACA: America COMPETES Act ATA: Assistive Technology Act of 2004 AEFLA: Adult Education and Family Literacy Act CCRAA: College Cost Reduction and Access Act CTEA: Carl D. Perkins Career and Technical Education Act EDA: Education of the Deaf Act FCRA: Fair Credit Reporting Act HEA: Higher Education Act of 1965 HERA: Hurricane Education Recovery Act HKNCA: Helen Keller National Center Act MECEA: Mutual Educational and Cultural Exchange Act of 1961 RA: Rehabilitation Act of 1973 USC: United States Code
PART Rating E = Effective ME = Moderately Effective A = Adequate I = Ineffective RND = Results Not Demonstrated NA = Program Has Not Been Assessed