Embed Size (px)
Citation preview

GO / NO-GO REPORT
DEMONSTRATION OF AN ULTRASONIC METHOD FOR 3-D VISUALIZATION OF SHALLOW BURIED
UNDERWATER OBJECTS
ESTCP Project Number: MM-1006
Version 1.1 July 2011
SUBMITTED BY:
MIKE PUTNAM – LEAD INVESTIGATOR
SPAWAR SYSTEMS CENTER PACIFIC; CODE 71750 53475 STROTHE ROAD SAN DIEGO, CA 92152
ESTCP Go/No-go Report: MR-201006 1 July 2011
Report Documentation Page Form ApprovedOMB No. 0704-0188
Public reporting burden for the collection of information is estimated to average 1 hour per response, including the time for reviewing instructions, searching existing data sources, gathering andmaintaining the data needed, and completing and reviewing the collection of information. Send comments regarding this burden estimate or any other aspect of this collection of information,including suggestions for reducing this burden, to Washington Headquarters Services, Directorate for Information Operations and Reports, 1215 Jefferson Davis Highway, Suite 1204, ArlingtonVA 22202-4302. Respondents should be aware that notwithstanding any other provision of law, no person shall be subject to a penalty for failing to comply with a collection of information if itdoes not display a currently valid OMB control number.
1. REPORT DATE JUL 2011 2. REPORT TYPE
3. DATES COVERED 00-00-2011 to 00-00-2011
4. TITLE AND SUBTITLE Demonstration of an Ultrasonic Method for 3-D Visualization of ShallowBuried Underwater Objects
5a. CONTRACT NUMBER
5b. GRANT NUMBER
5c. PROGRAM ELEMENT NUMBER
6. AUTHOR(S) 5d. PROJECT NUMBER
5e. TASK NUMBER
5f. WORK UNIT NUMBER
7. PERFORMING ORGANIZATION NAME(S) AND ADDRESS(ES) SPAWAR Systems Center, Pacfic,Code 71752,53475 Strothe Road,San Diego,CA,92152
8. PERFORMING ORGANIZATIONREPORT NUMBER
9. SPONSORING/MONITORING AGENCY NAME(S) AND ADDRESS(ES) 10. SPONSOR/MONITOR’S ACRONYM(S)
11. SPONSOR/MONITOR’S REPORT NUMBER(S)
12. DISTRIBUTION/AVAILABILITY STATEMENT Approved for public release; distribution unlimited
13. SUPPLEMENTARY NOTES
14. ABSTRACT
15. SUBJECT TERMS
16. SECURITY CLASSIFICATION OF: 17. LIMITATION OF ABSTRACT Same as
Report (SAR)
18. NUMBEROF PAGES
19
19a. NAME OFRESPONSIBLE PERSON
a. REPORT unclassified
b. ABSTRACT unclassified
c. THIS PAGE unclassified
Standard Form 298 (Rev. 8-98) Prescribed by ANSI Std Z39-18

TABLE OF CONTENTS
Page
LIST OF FIGURES 3
LIST OF TABLES 4
LIST OF APPENDICES 5
LIST OF ACRONYMS AND ABBREVIATIONS 6
1.0 INTRODUCTION 7
1.1 BACKGROUND 7
1.2 OBJECTIVES OF THE GO/NO-GO 7
1.3 REGULATORY DRIVERS 8
2.0 TECHNOLOGY 8
2.1 TECHNOLOGY DESCRIPTION 8
3.0 PERFORMANCE OBJECTIVES 9
3.1 OBJECTIVE: DETECTION DEPTH 10
3.2 OBJECTIVE: SCAN TIME 12
3.3 OBJECTIVE: RENDER TIME 12
3.4 OBJECTIVE: SOFTWARE USER INTERFACE BUGS 13
3.5 OBJECTIVE: OBJECT RECOGNITION 14
4.0 CONCLUSION 15
ESTCP Go/No-go Report: MR-201006 2 July 2011

LIST OF FIGURES Figure 1. Hardware Schematic of the 3-D Ultrasonic System Figure 2. BFSD Vehicle, on the left shown with detachable wheels for maneuvering on
land, on the right is a test deployment off a pier. The vehicle contains lights and a video camera for accurate positioning underwater.
Figure 3. Target depth testing was done with the transducers placed over buckets filled with
each of the four sediment types (top picture). Ping returns were noted on the user interface oscilloscope screen (bottom picture) at the appropriate signal travel time (X axis) for that depth.
Figure 4. Water tank testing for software scan time and render time checkout. Bricks at
known depths and shapes were used to thoroughly check the control and acquisition software. The photo on the right is one of the operator windows showing the oscilloscope ping return and system status indicators. The left photo shows the water filled test tank.
ESTCP Go/No-go Report: MR-201006 3 July 2011

LIST OF TABLES Table 1. Performance Objectives
ESTCP Go/No-go Report: MR-201006 4 July 2011

LIST OF APPENDICES Appendix A. Output of the Object Recognition Test Appendix B. Points of Contact
ESTCP Go/No-go Report: MR-201006 5 July 2011

LIST OF ACRONYMS AND ABBREVIATIONS BFSD Benthic Flux Sampling Device BRAC Base Realignment and Closure CERCLA Comprehensive Environmental Response, Compensation, and Liability Act DoD Department of Defense EOD Explosive Ordnance Disposal ERDC Engineer Research and Development Center ESRI Environmental Systems Research Institute ESTCP Environmental Security Technology Certification Program FUDS Formerly Used Defense Sites MEC Munitions and Explosives of Concern RMS Root Mean Square ROV Remotely Operated Vehicles SERDP Strategic Environmental Research and Development Program SPAWAR Space and Naval Warfare Systems Command UCLA University of California Los Angles UXO Unexploded Ordnance
ESTCP Go/No-go Report: MR-201006 6 July 2011

1.0 INTRODUCTION
1.1 BACKGROUND
Many former and active DoD ranges and installations have MEC in the underwater environment posing a potential, current, or future hazard. The Army Corps of Engineers has evaluated formerly used defense sites and found that there are more than 10 million acres potentially containing MEC in underwater environments, at approximately 400 sites, and the U.S. Navy and Marine Corps have identified 20 offshore range sites containing MEC. Relatively little is known about underwater sites which cover a broad spectrum of environments including estuarine, near-coastal and offshore, as well as freshwater. Virtually any munitions in the historical inventory may be found at these sites. The development of technologies to address detection and identification of MEC in underwater environments is significantly behind those used at terrestrial sites. There have been a number of technologies developed and tested for underwater MEC wide-area detection, including some 15 projects under the SERDP and ESTCP programs. However, the wide-area assessment of underwater MEC continues to be hampered by the lack of technology which can readily discriminate MEC from clutter or non-MEC items which have become buried and are not readily visible. While side scan sonar, laser line scanners, and magnetometry can provide wide-area coverage, the data does not provide sufficient diagnostic information for MEC identification among the significant amount of buried clutter. Before remediation planning can begin debris fields must be classified as hazardous (MEC containing) or non-hazardous (debris only). This is traditionally done by examining historic data, visual identification of objects sitting proud of the sediment, and by digging up shallow buried potential munitions/MEC at spot locations identified as high probability within the wide-area surveillance field. Often after wide-area underwater surveys debris fields are identified and several high potential objects pinpointed within the field, video spot surveys can provide local imagery for positive “heads-up” identification of high potential objects, but shallow buried or partially buried objects are difficult to assess. Currently, spot surveys of these buried objects must be treated as assumed MEC and require expensive, hazardous removal, identification, and disposal by Navy trained and certified underwater EOD teams. Traditional removal and identification of buried objects by trained EOD disposal teams is slow, expensive, and for benign objects unnecessary. Undisturbed identification of these buried objects either by a single diver using a hand held sensor, in shallow water by pole, or by ROV would greatly speed up spot identification, paving the way for more cost effective remediation and cleanup planning. The proposed use of an ultrasonic 3-D visualization system for the undisturbed characterization and identification of submerged shallow buried objects will serve to eliminate the costly digging and removal of objects for spot identification.
1.2 OBJECTIVE OF THE GO/NO-GO
This go/no-go test will examine the capability of an ultrasonic 3-D visualization system to provide the undisturbed characterization and identification of submerged shallow-buried objects.
ESTCP Go/No-go Report: MR-201006 7 July 2011

Analysis of a location by this system would provide a visual image of individual buried UXO not visible on the surface.
1.3 REGULATORY DRIVERS
The regulatory issues affecting the MEC problem are most frequently associated with the BRAC and FUDS processes involving the transfer of DoD property to other government agencies or to the civilian sector. When the transfer of responsibility to other government agencies or to the civilian sector takes place, the DoD lands fall under the compliance requirements of the Superfund statutes. Section 2908 of the 1993 Public Law 103-160 requires adherence to CERCLA provisions. The basic issues center upon the assumption of liability for ordnance contamination on the previously DoD-controlled sites. 2.0 TECHNOLOGY
2.1 TECHNOLOGY DESCRIPTION
The 3-D Ultrasonic system was originally developed at UCLA’s School of Civil and Environmental Engineering by Dr. Scott Brandenberg. The goal was to study the potential of using p-wave reflection imaging for geotechnical engineering. The demonstration system was adapted for underwater use by SPAWAR Systems Center, Pacific.
Figure 1. Hardware Schematic of the 3-D Ultrasonic System.
ESTCP Go/No-go Report: MR-201006 8 July 2011

The ultrasonic system components are off-the-shelf hardware consisting of two ultrasonic transducers, source pulser, receiver amplifier, receiver analog filter, terminal block, data acquisition cards mounded in a PXI chassis, a laptop computer running the control and data processing software, and the underwater delivery vehicle with the X-Y positioning system. The vehicle is the BFSD with the X-Y positioning system attached. It is composed of an X-Y gantry system operated by underwater servo motors controlled by the operator’s computer. The BFSD vehicle was originally developed under ESTCP project ER-9712 a complete description of the vehicle can be found in the January 2008 ESTCP final report for that project. For this project the flux sampling equipment was removed and replaced by the X-Y positioning system.
Figure 2 BFSD Vehicle, on the left shown with detachable wheels for maneuvering on land, on the right is a test deployment off a pier. The vehicle contains lights and a video camera for accurate positioning underwater.
3.0 PERFORMANCE OBJECTIVES
There are five performance objectives for this go/no-go test they are listed in Table 1.
ESTCP Go/No-go Report: MR-201006 9 July 2011
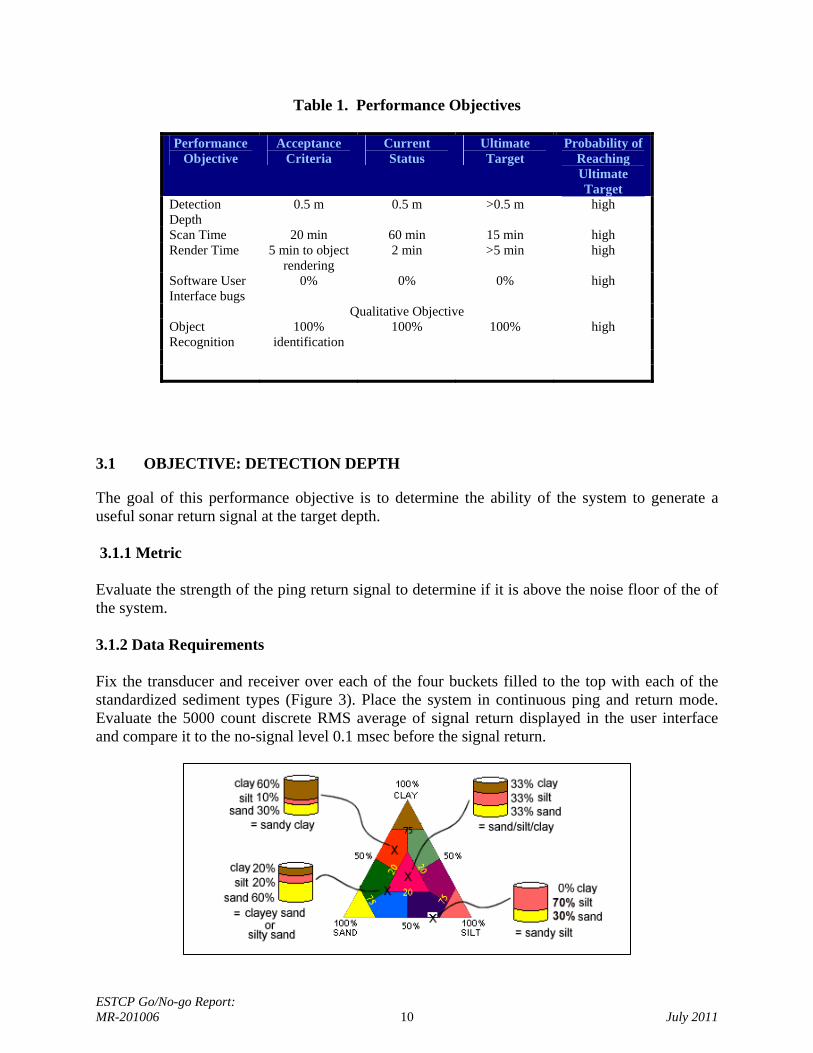
Table 1. Performance Objectives
Performance Objective
Acceptance Criteria
Current Status
Ultimate Target
Probability of Reaching Ultimate Target
Detection Depth
0.5 m 0.5 m >0.5 m high
Scan Time 20 min 60 min 15 min high Render Time 5 min to object
rendering 2 min >5 min high
Software User Interface bugs
0% 0% 0% high
Qualitative Objective Object Recognition
100% identification
100% 100% high
3.1 OBJECTIVE: DETECTION DEPTH
The goal of this performance objective is to determine the ability of the system to generate a useful sonar return signal at the target depth. 3.1.1 Metric Evaluate the strength of the ping return signal to determine if it is above the noise floor of the of the system. 3.1.2 Data Requirements Fix the transducer and receiver over each of the four buckets filled to the top with each of the standardized sediment types (Figure 3). Place the system in continuous ping and return mode. Evaluate the 5000 count discrete RMS average of signal return displayed in the user interface and compare it to the no-signal level 0.1 msec before the signal return.
ESTCP Go/No-go Report: MR-201006 10 July 2011

Figure 3. Target depth testing was done with the transducers placed over buckets filled with each of the four sediment types (top picture). Ping returns were noted on the user interface oscilloscope screen (bottom picture) at the appropriate signal travel time (X axis) for that depth.
3.1.3 Success Criteria The objective will be met if the signal-to-noise ratio is above 0.1. Where the signal-to-noise is the square of the root mean square of the signal amplitude (A signal) divided by root mean square of the noise amplitude (A noise).
3.1.4 Performance Assessment The signal-to-noise ratio was above 0.1 for all four sediment types at a depth of 0.5 m.
ESTCP Go/No-go Report: MR-201006 11 July 2011

3.2 OBJECTIVE: SCAN TIME This objective will evaluate the length of time of time it takes the system to cover a 1m2 area. The test was setup by placing the system over a tank of water containing know objects (Figure 4). The system was set to scan a full 1m2 area and the render times were noted and recorded.
Figure 4. Water tank testing for software scan time and render time checkout. Bricks at known depths and shapes were used to thoroughly check the control and acquisition software. The photo on the right is one of the operator windows showing the oscilloscope ping return and system status indicators. The left photo shows the water filled test tank.
3.2.1 Metric The metric is the length of time it takes the system to cover 1m2 using a scanning step size of 3 mm. 3.2.2 Data Requirements Length of time required for the scan as recorded in the data log. 3.2.3 Success Criteria A scan time of 20 minutes or less. 3.2.4 Performance Assessment Scan time for a 1m2 area was 19.3 minutes. 3.3 OBJECTIVE: RENDER TIME
ESTCP Go/No-go Report: MR-201006 12 July 2011

This objective will evaluate the length of time it takes the software to process the data once the surface scan is complete. The test was setup by placing the system over a tank of water containing known objects (Figure 4). The system was set to scan a full 1m2 area and the start and stop times were noted and recorded. 3.3.1 Metric The metric is the length of time it takes to process a 1m2 area data set. 3.3.2 Data Requirements The data required is the length of time to process the data as measured by a digital watch. 3.3.3 Success Criteria A rendering time of 5 minutes or less will be considered a success. 3.3.4 Performance Assessment The rendering time for a 1m2 area data set using a PC with a dual core processor and 8 GB of RAM averages 2.2 minutes. 3.4 OBJECTIVE: SOFTWARE USER INTERFACE BUGS This objective will evaluate the number of user interface errors there are in the software. The test was setup by placing the system over a tank of water containing know objects (Figure 4). The system was set to scan a full 1m2 area. Software bugs were noted by the test team and corrected by the software development team. 3.4.1 Metric The metric is the number of software bugs identified and not corrected during the QA/QC of the software before delivery to the users. 3.4.2 Data Requirements Evaluation of all the user interface controls and outputs 3.4.3 Success Criteria 100% error free, all identified bugs have been corrected. 3.4.4 Performance Assessment
ESTCP Go/No-go Report: MR-201006 13 July 2011

Three software bugs were identified during the QA/QC of the software. Software modifications were completed to address these errors and the new version of software passed QA/QC without any errors. 3.5 OBJECTIVE: OBJECT RECOGNITION This objective will evaluate the ability of the system to create identifiable three dimensional models of objects buried in the sample sediment as seen in Figure 5.
Figure 5. Object recognition testing. Left, the test tank filled with sandy clay to a total depth of 1.2m. the Danforth anchor was placed at a depth of 0.5m and the 60mm mortar was placed at a depth of 0.25m. Left, photo showing the transducers submerged in the water traversing the sediment surface.
3.5.1 Metric This metric is the identification of a 60mm mortar round and 5 lb Danforth anchor scanned at an average depth of 0.5m in sandy clay and a 60mm mortar buried in sandy clay at a depth of 0.25m. 3.5.2 Data Requirements U3D format data file of the object. 3.5.3 Success Criteria The data model looks like the object. 3.5.4 Performance Assessment
ESTCP Go/No-go Report: MR-201006 14 July 2011

The two items were rendered and identified. All users were able to correctly identify the objects from the 3D Adobe Acrobat Reader files created by the software. The results can be seen in Appendix A. 4.0 CONCLUSION The go/no-go milestone has been met. The system has exceeded all five of the go/no-go criteria. It is recommended that the project proceed to bench scale testing.
ESTCP Go/No-go Report: MR-201006 15 July 2011

APPENDICES
Appendix A: Output of the Object Recognition Test
The software produces a 3D object file (U3D format) that is readable by Adobe Acrobat’s 3D viewer. The following two pages contain the files.
ESTCP Go/No-go Report: MR-201006 16 July 2011


ESTCP Go/No-go Report: MR-201006 17 July 2011
Appendix B: Points of Contact
POINT OF CONTACT
Name
ORGANIZATION Name
Address
Phone Fax
E-mail Role in Project
Mike Putnam SPAWAR Systems Center, Pacfic Code 71752
San Diego, CA 92152
[email protected] 619-553-2926
Project Manager
Greg Anderson SPAWAR Systems Center, Pacfic Code 71753
San Diego, CA 92152
[email protected] 619-553-1618
Lead Engineer
Scott Brandenberg UCLA 5731D Boelter Hall
Department of Civil and Environmental
Engineering University of California Los Angeles, CA 90095
[email protected] 310-825-9891
System Provider