Embed Size (px)
Citation preview
Go High-Viz!
Educating Riders about Conspicuity
Minnesota Motorcycle Safety Center

Overview
1. Goals
2. Objectives
3. Target audience
4. Key messages
5. Strategies
6. Tactics
7. Partners
8. Budget (timeline)
9. Evaluation
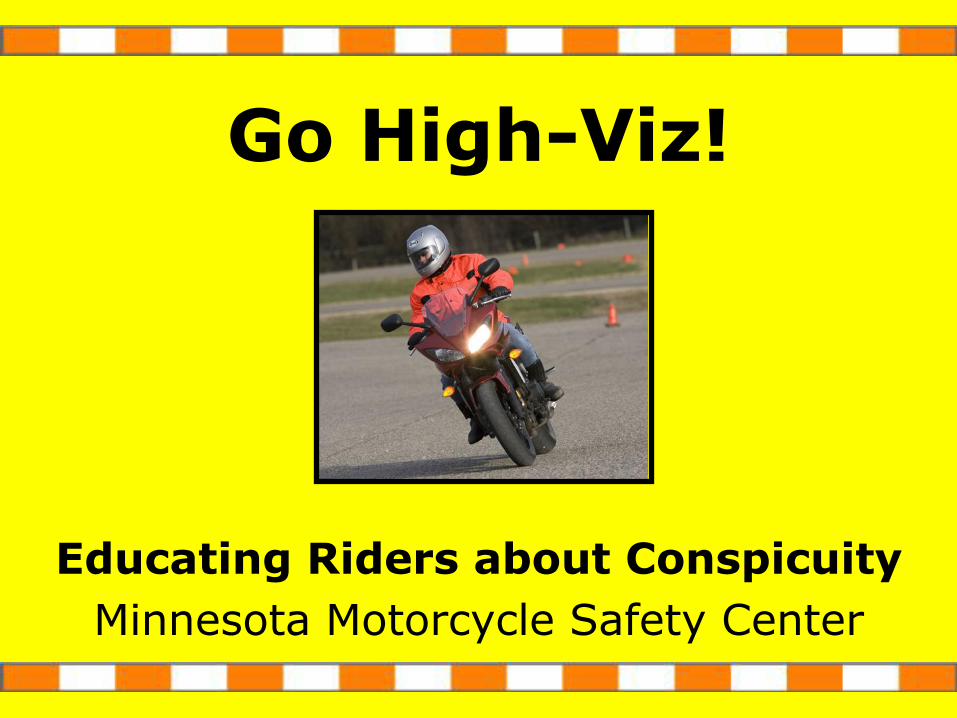
Why conspicuity?
Rider responsibility
– Half of motorcycle crashes are multi-vehicle
– Riders and other drivers share responsibility
– Riders must make effort to be seen
NHTSA motorcycle countermeasures
– Conspicuity integral to motorcycle safety programs
National Agenda for Motorcycle Safety (NAMS)
– “Encourage motorcyclists to enhance their conspicuity” (essential recommendation)
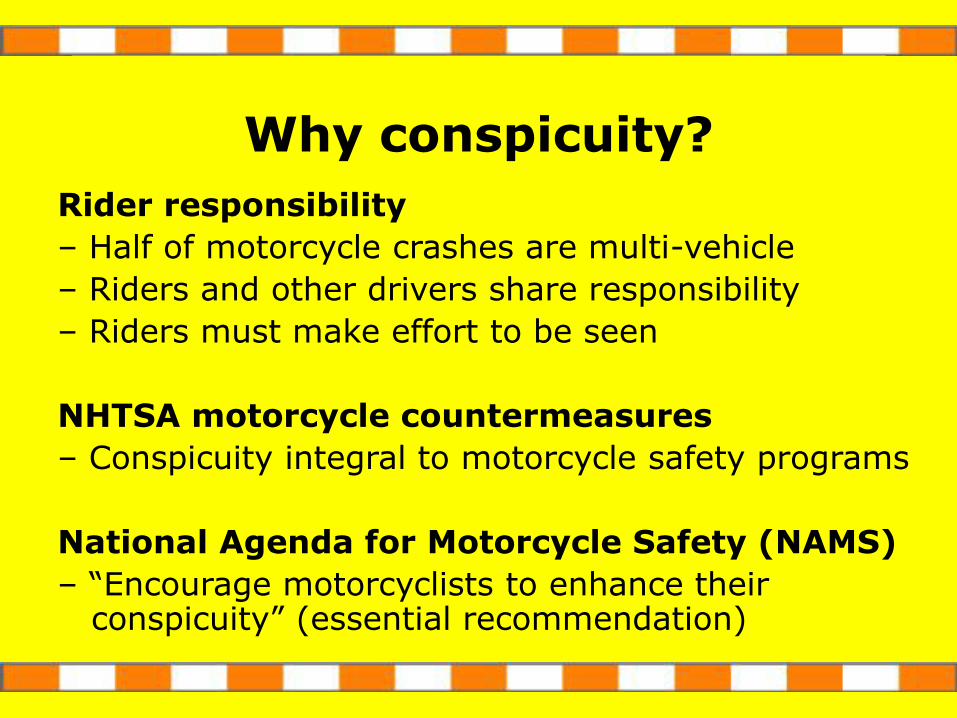
Goals
1: Educate motorcycle riders in conspicuity products, techniques, strategies
2: Increase motorcyclists’ use of high-visibility clothing, conspicuity products
3: Reduce multi-vehicle crashes, injuries, fatalities
Objectives
1: Design, build, promote Web page with conspicuity information, strategies
2: Increase motorcyclists’ use of reflective vests, white helmets, brightly colored clothing, motorcycle modifications 10 percent in 2009
3: Reduce multi-vehicle crashes in which other drivers “don’t see” motorcycle riders 10 percent in 2009
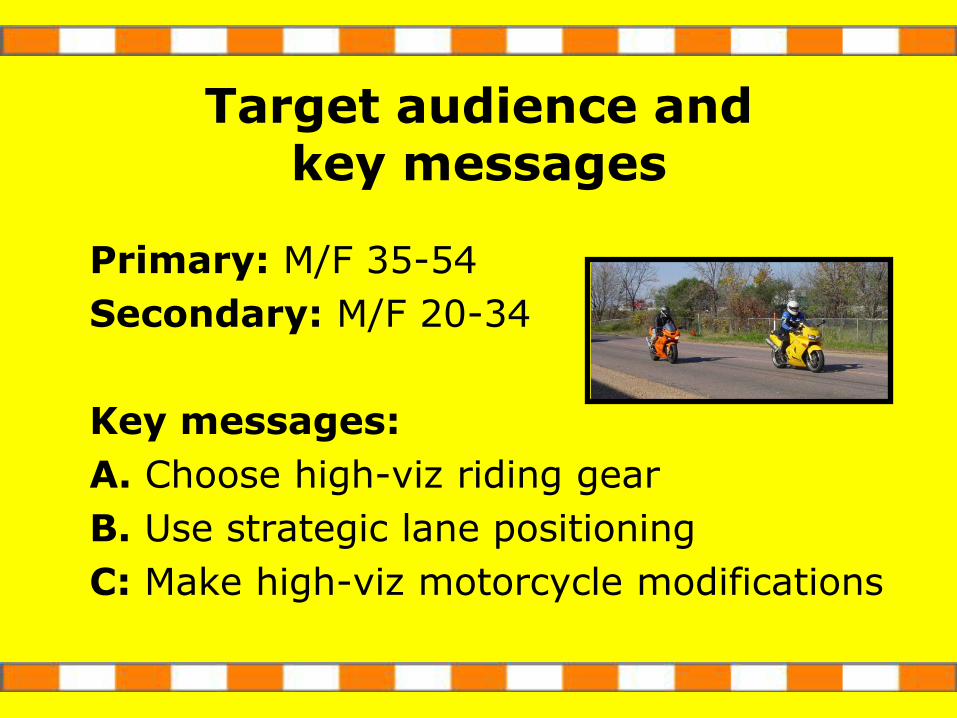
Target audience and key messages
Primary: M/F 35-54
Secondary: M/F 20-34
Key messages:
A. Choose high-viz riding gear
B. Use strategic lane positioning
C: Make high-viz motorcycle modifications
Strategies
1: Educate riders why conspicuity is important
2: Provide a tool to ”measure” conspicuity
3: Provide numerous options to improve conspicuity
4: Provide conspicuity resources
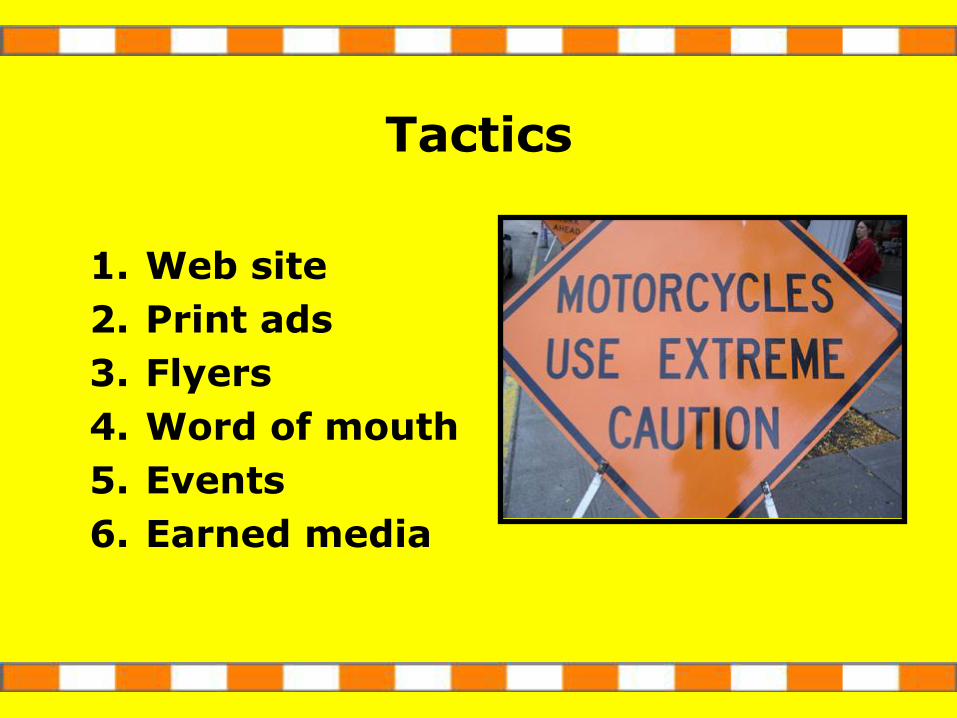
Tactics
1. Web site
2. Print ads
3. Flyers
4. Word of mouth
5. Events
6. Earned media
Web site: www.highviz.org
1. “Be a Perfect 10” interactive quiz
2. Top 10 Tips
3. 10 more Tips
4. Free reflective decals
5. High-viz resources
6. Reflective sticker contest
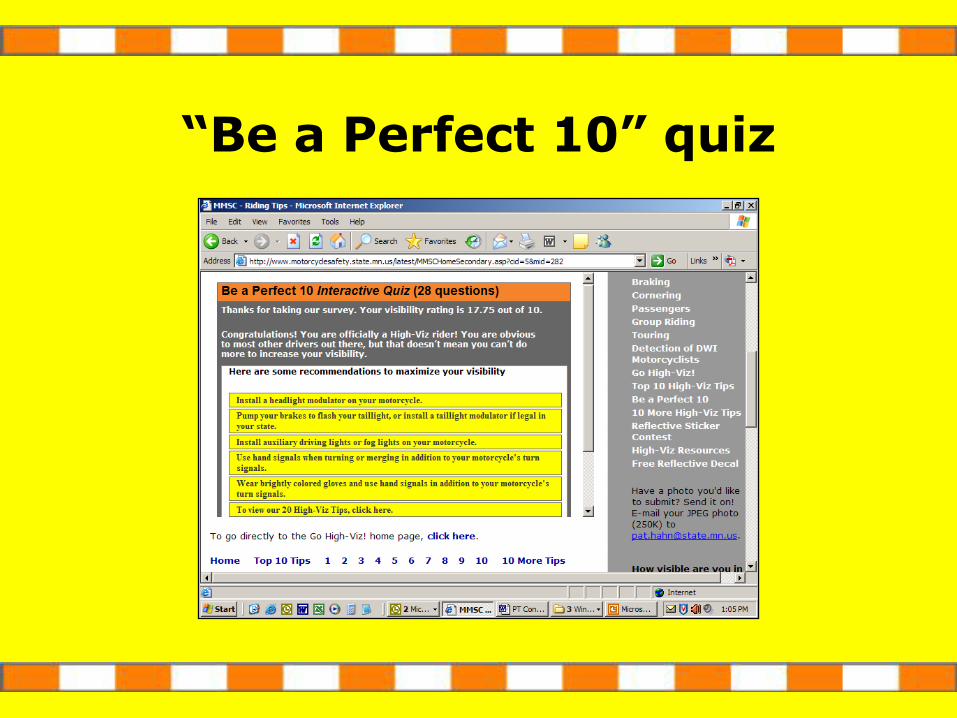
“Be a Perfect 10” quiz
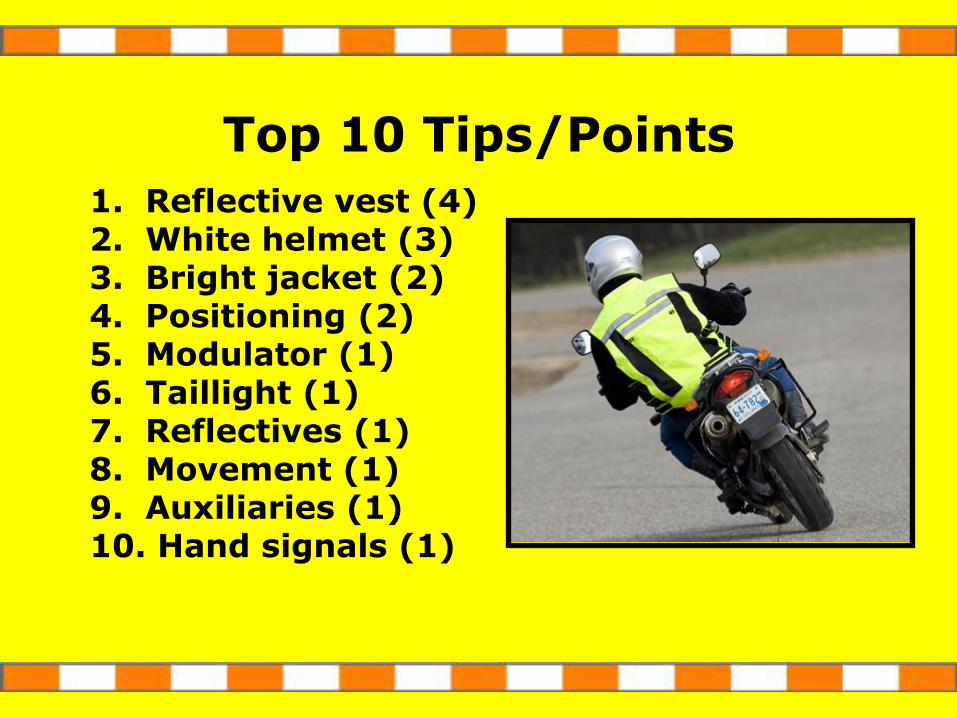
Top 10 Tips/Points
1. Reflective vest (4)2. White helmet (3)3. Bright jacket (2)4. Positioning (2)5. Modulator (1)6. Taillight (1)7. Reflectives (1)8. Movement (1)9. Auxiliaries (1)10. Hand signals (1)
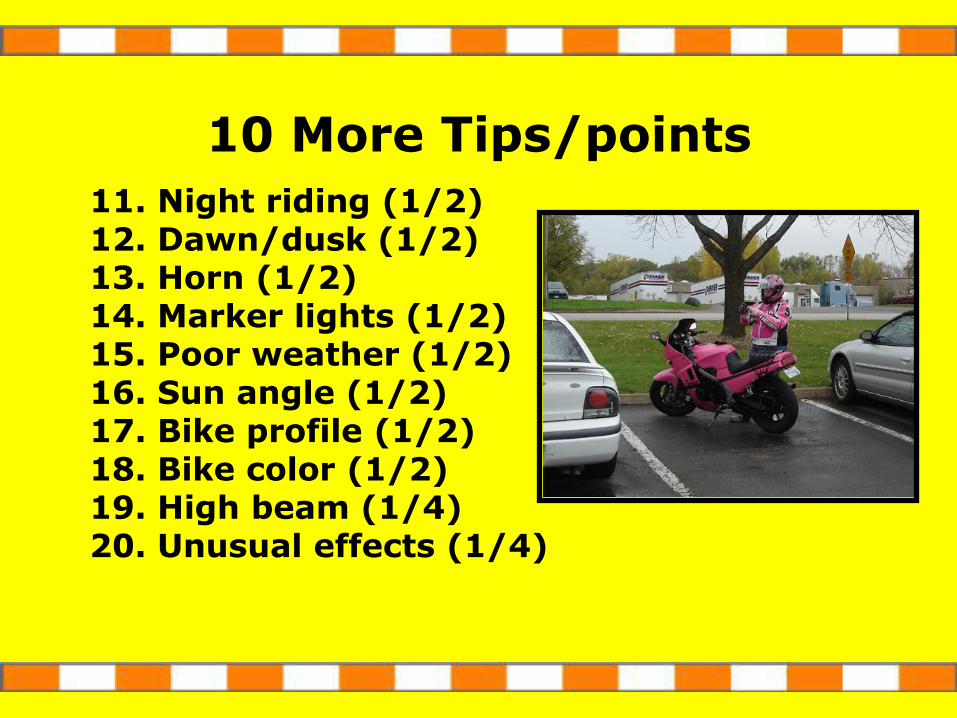
10 More Tips/points
11. Night riding (1/2)12. Dawn/dusk (1/2)13. Horn (1/2)14. Marker lights (1/2)15. Poor weather (1/2)16. Sun angle (1/2)17. Bike profile (1/2)18. Bike color (1/2)19. High beam (1/4)20. Unusual effects (1/4)
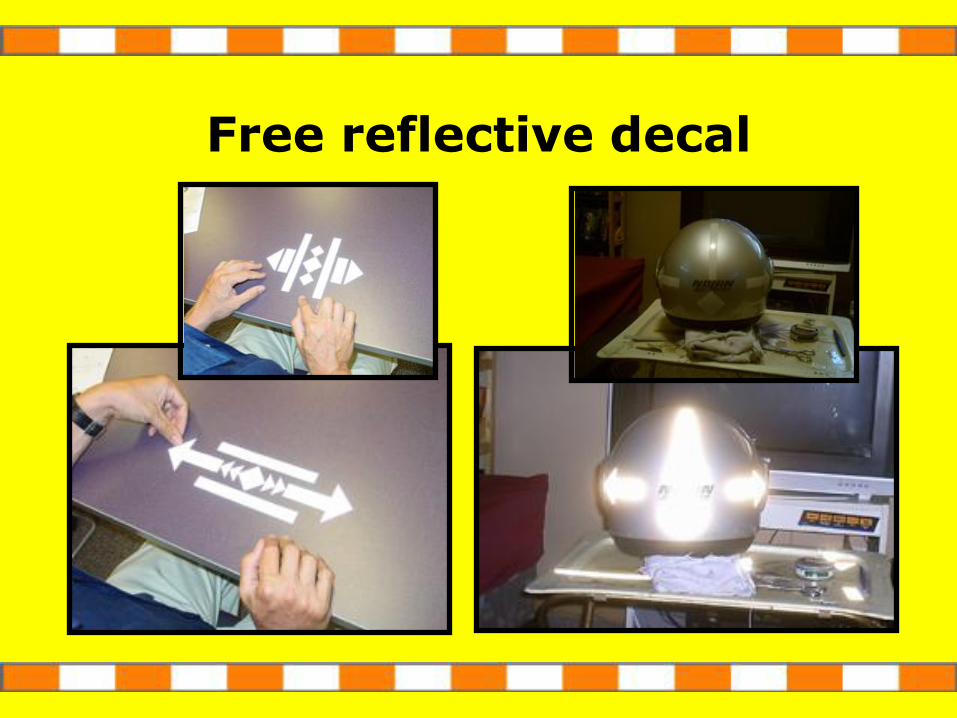
Free reflective decal
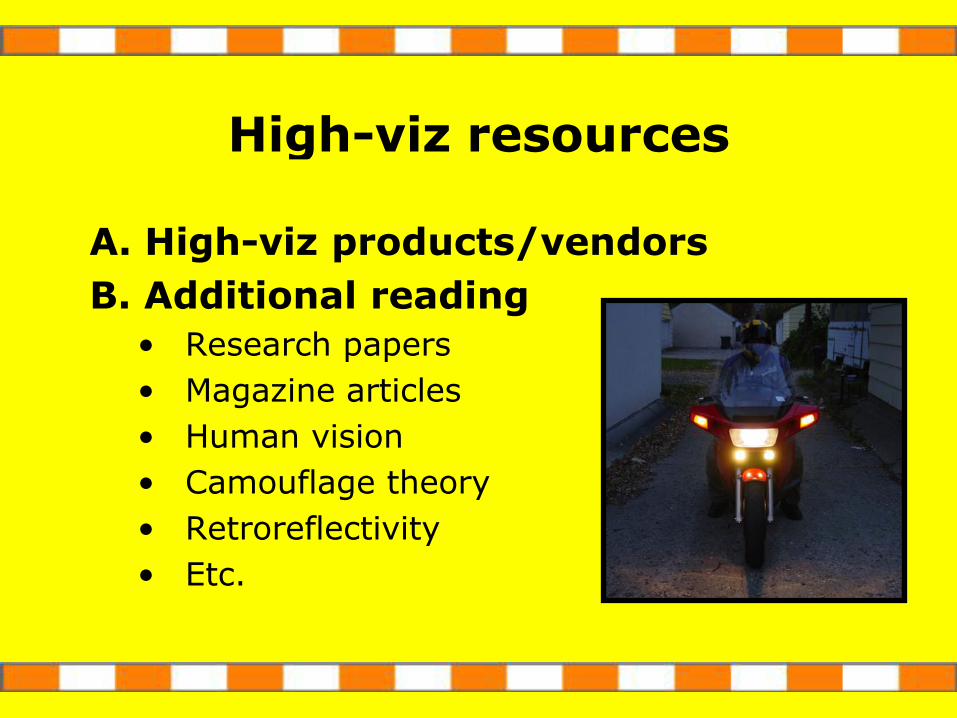
High-viz resources
A. High-viz products/vendors
B. Additional reading
• Research papers
• Magazine articles
• Human vision
• Camouflage theory
• Retroreflectivity
• Etc.
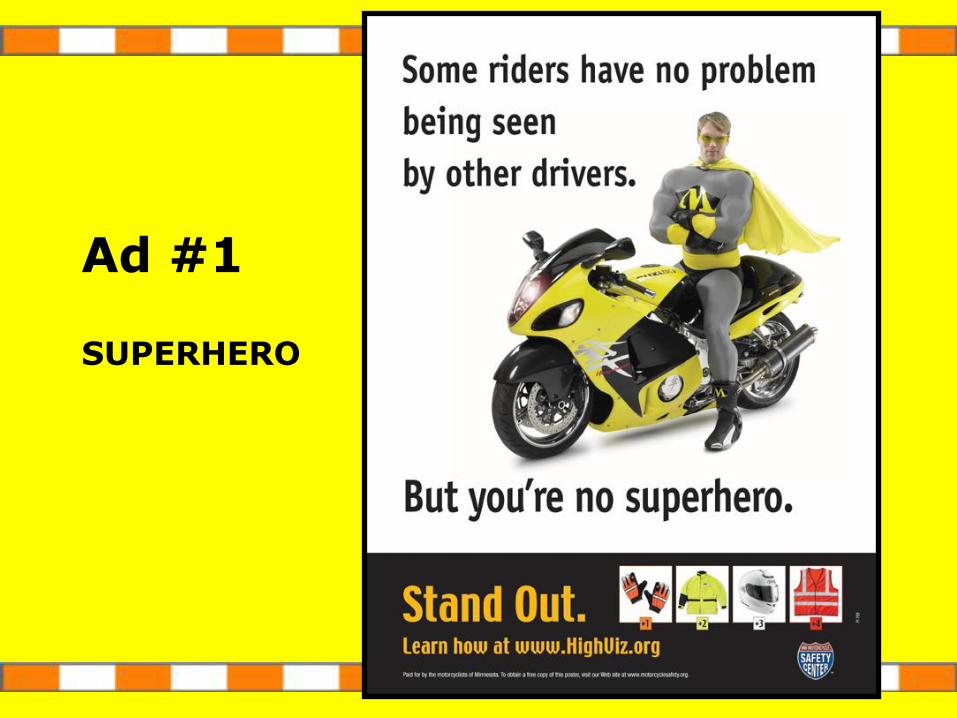
Ad #1
SUPERHERO
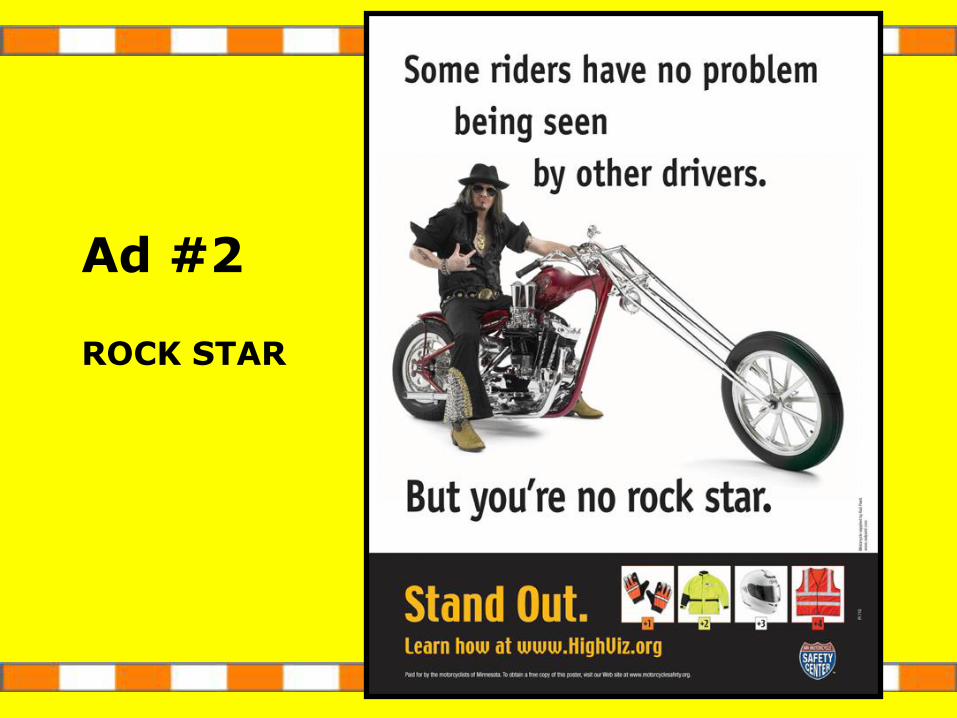
Ad #2
ROCK STAR
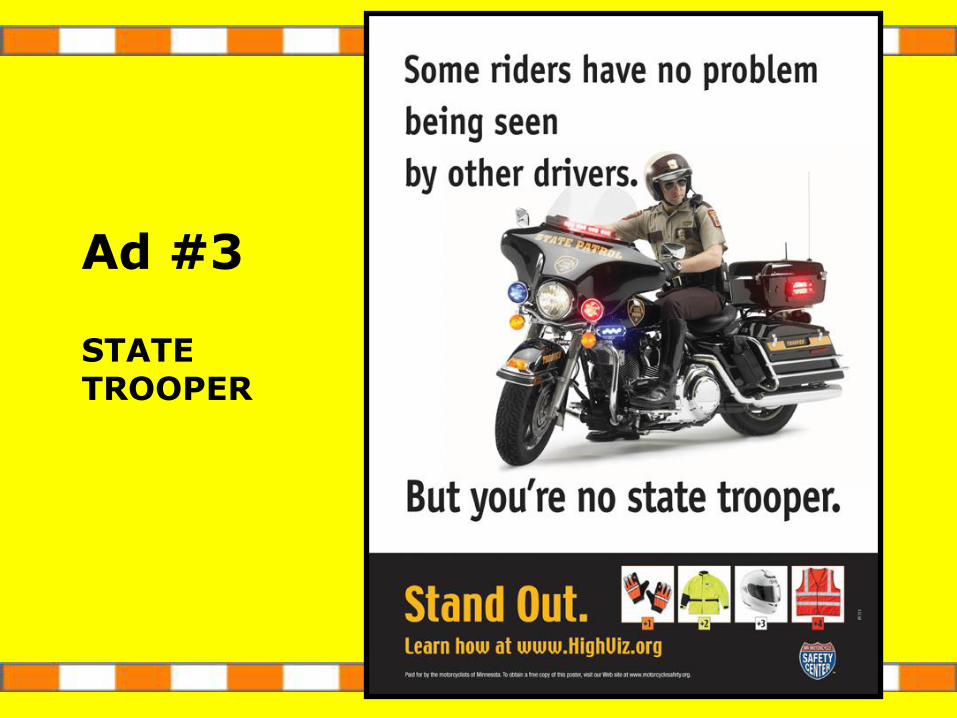
Ad #3
STATE TROOPER
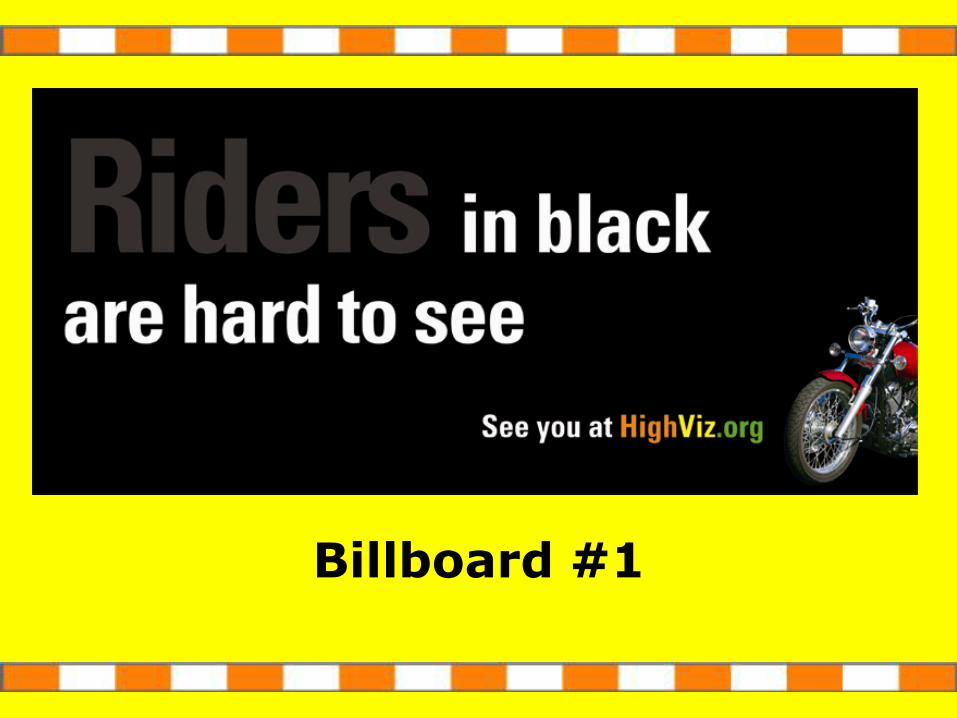
Billboard #1
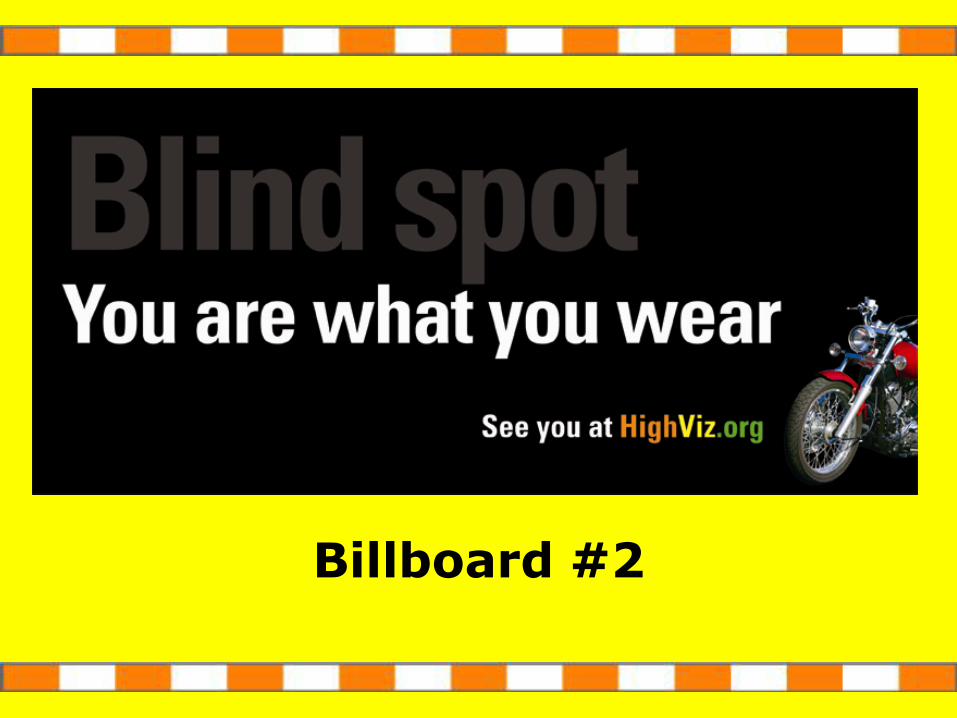
Billboard #2
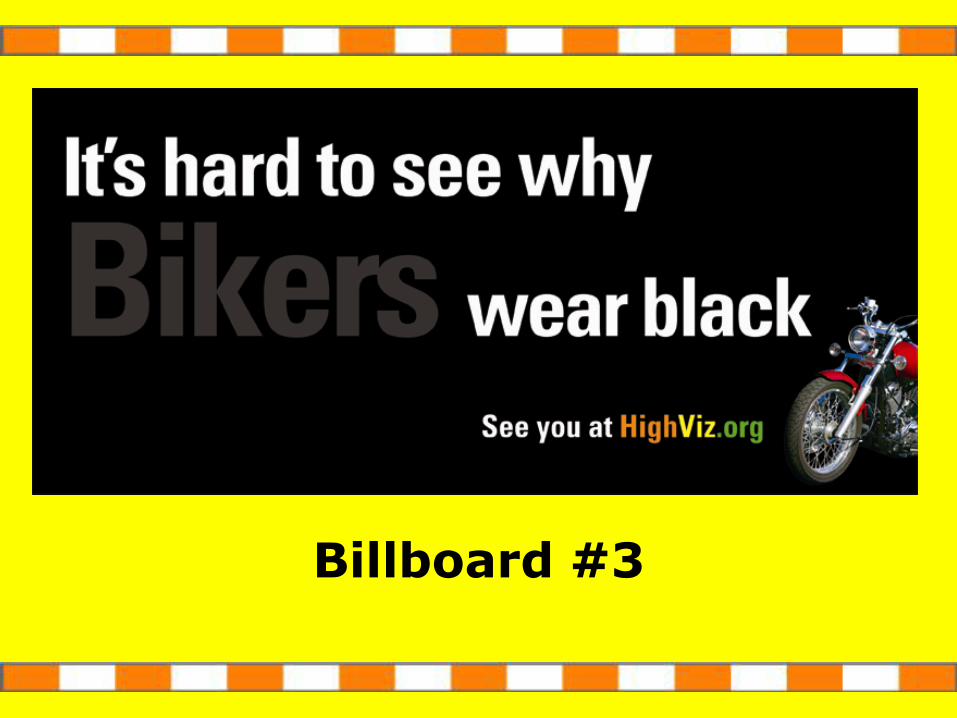
Billboard #3

Billboard #4
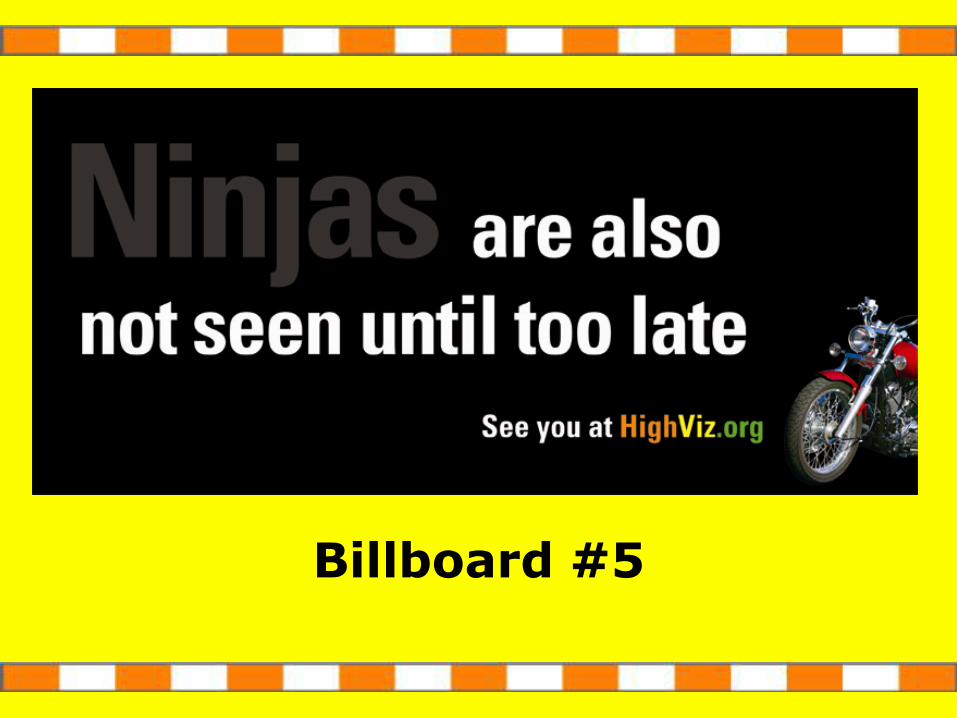
Billboard #5
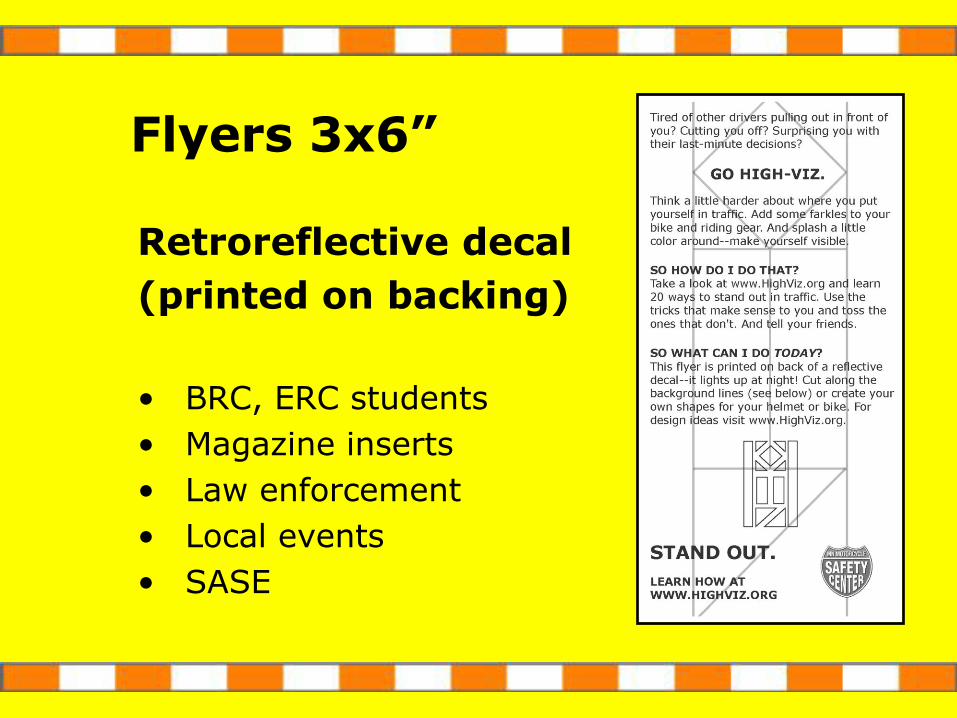
Flyers 3x6”
Retroreflective decal
(printed on backing)
• BRC, ERC students
• Magazine inserts
• Law enforcement
• Local events
• SASE
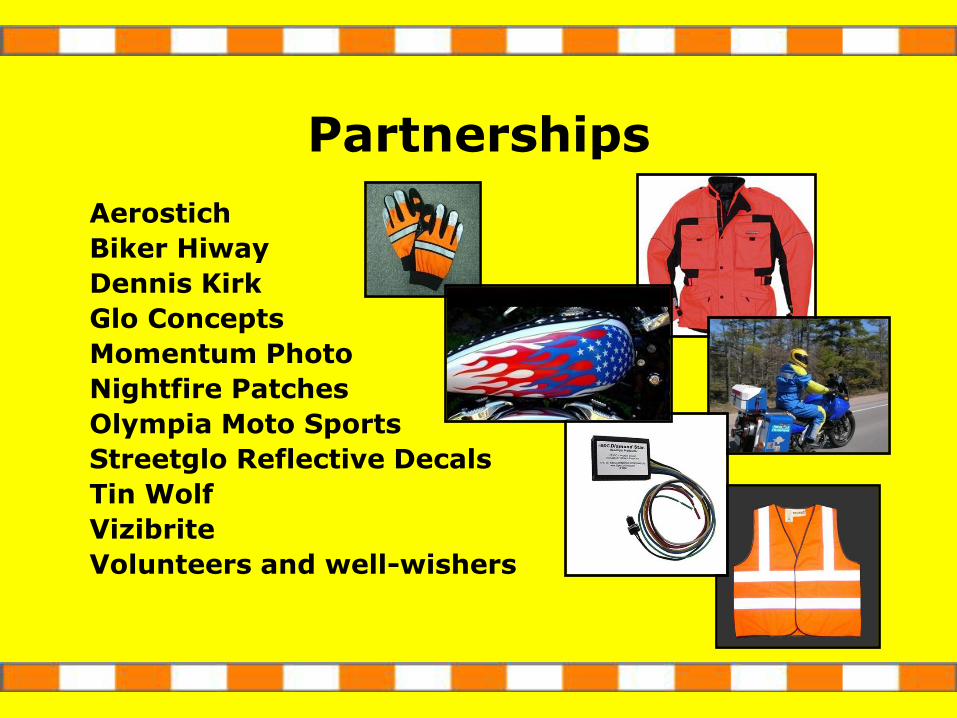
Partnerships
Aerostich
Biker Hiway
Dennis Kirk
Glo Concepts
Momentum Photo
Nightfire Patches
Olympia Moto Sports
Streetglo Reflective Decals
Tin Wolf
Vizibrite
Volunteers and well-wishers
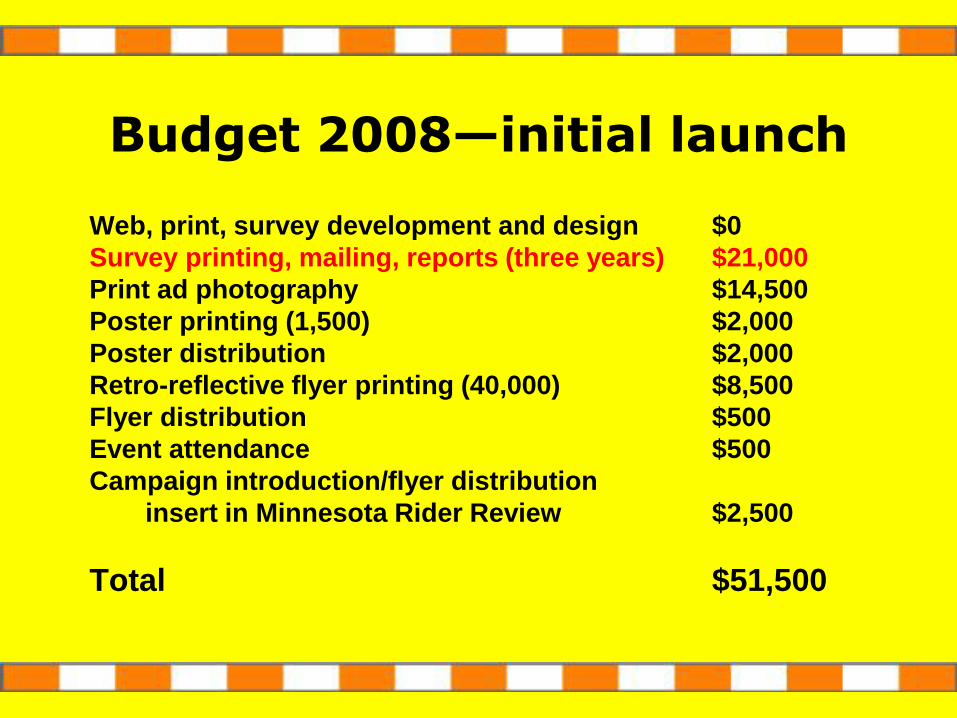
Budget 2008—initial launch
Web, print, survey development and design $0
Survey printing, mailing, reports (three years) $21,000
Print ad photography $14,500
Poster printing (1,500) $2,000
Poster distribution $2,000
Retro-reflective flyer printing (40,000) $8,500
Flyer distribution $500
Event attendance $500
Campaign introduction/flyer distribution
insert in Minnesota Rider Review $2,500
Total $51,500
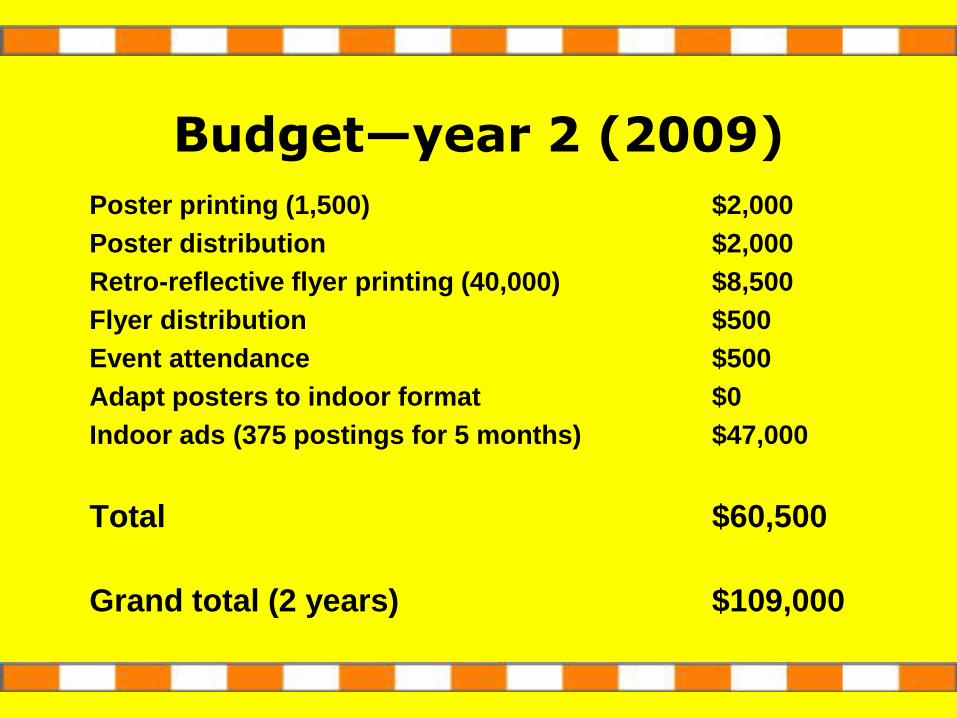
Budget—year 2 (2009)
Poster printing (1,500) $2,000
Poster distribution $2,000
Retro-reflective flyer printing (40,000) $8,500
Flyer distribution $500
Event attendance $500
Adapt posters to indoor format $0
Indoor ads (375 postings for 5 months) $47,000
Total $60,500
Grand total (2 years) $109,000
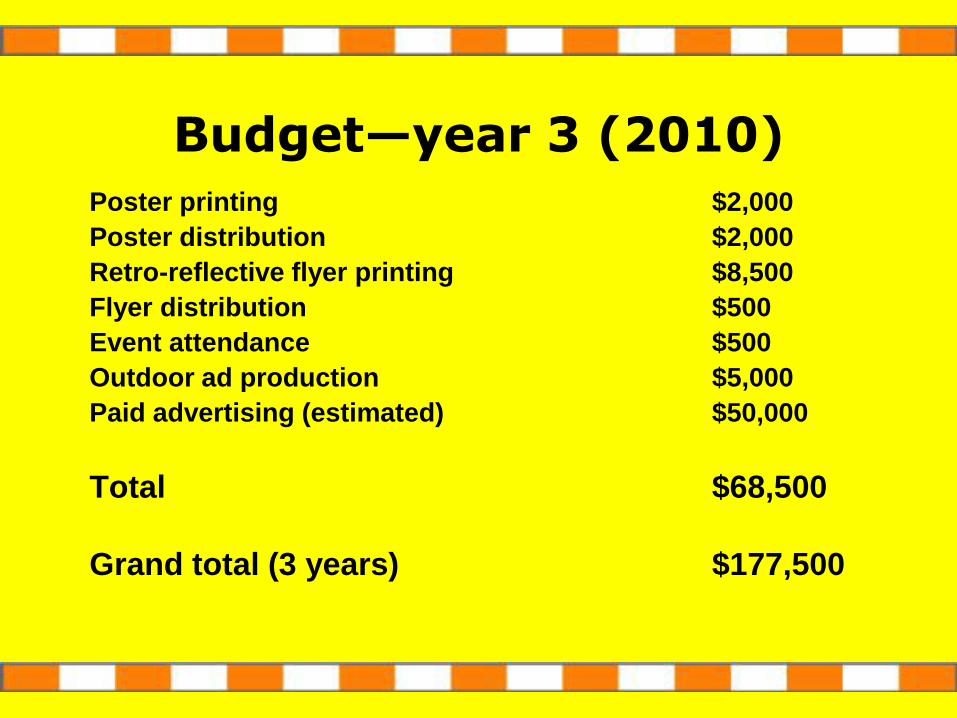
Budget—year 3 (2010)
Poster printing $2,000
Poster distribution $2,000
Retro-reflective flyer printing $8,500
Flyer distribution $500
Event attendance $500
Outdoor ad production $5,000
Paid advertising (estimated) $50,000
Total $68,500
Grand total (3 years) $177,500
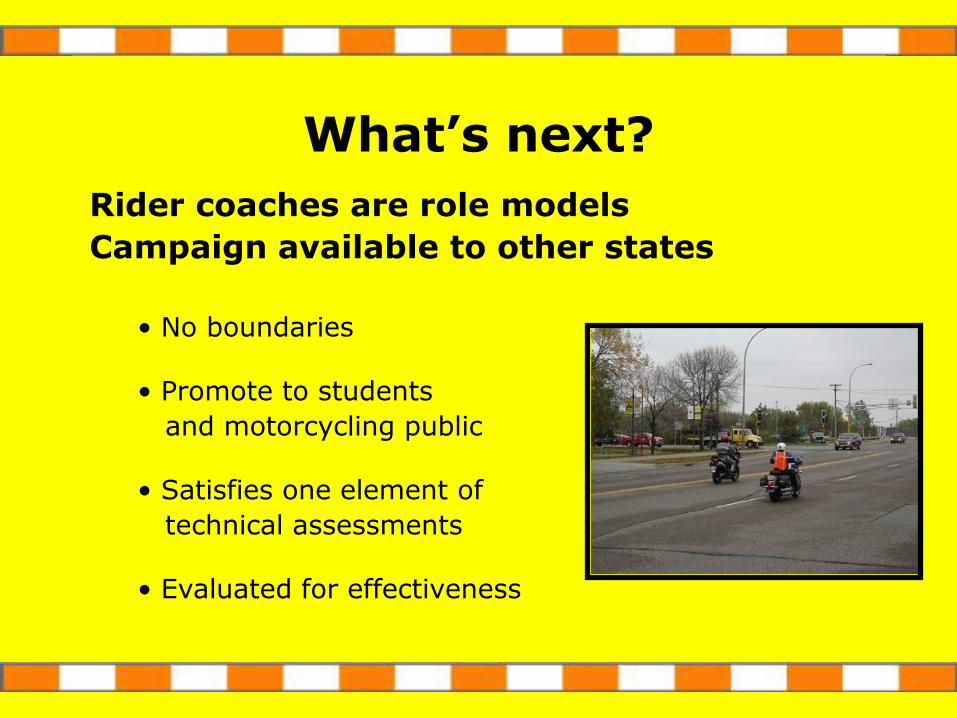
What’s next?
Rider coaches are role models
Campaign available to other states
• No boundaries
• Promote to students
and motorcycling public
• Satisfies one element of
technical assessments
• Evaluated for effectiveness
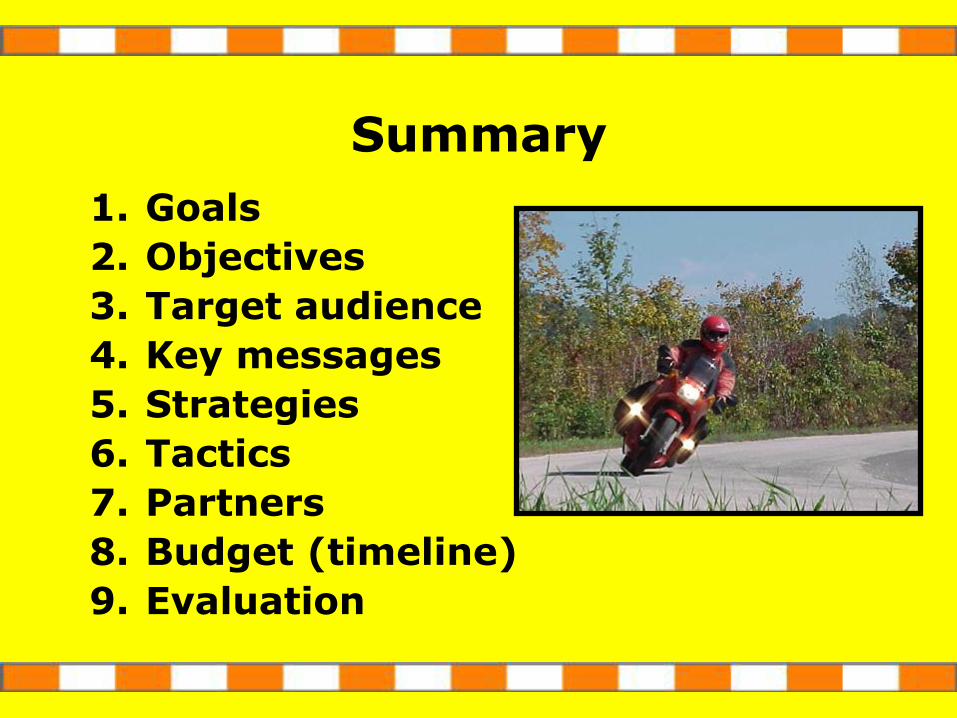
Summary
1. Goals
2. Objectives
3. Target audience
4. Key messages
5. Strategies
6. Tactics
7. Partners
8. Budget (timeline)
9. Evaluation
Evaluating the Conspicuity Campaign
Campaign evaluation
Survey
Web visitors/page views
Crash data
Advantages of mail survey
• Less expensive
• Better response rate
• Easier to reach target audience
Statewide survey
Minnesota motorcyclists
Three waves
Pre–campaign baseline (Jan 2008)
Mid–campaign (Oct 2008)
Post–campaign (Jan 2011)
Designing the survey
Objectives:
Measure behavior change
Obtain demographic and exposure data
Designing the survey
Areas of interest:
1. Campaign awareness; use of high-viz gear, strategies, products
2. Demographic data
3. Experience and exposure
4. Perception of risk
5. Perception of safety messaging
Designing the survey
Develop questions that respondents:
1. Will interpret the same way
2. Will respond to accurately
3. Will be willing to respond to
4. Limit requests for personal information
Constructing the survey
Survey questions:
1. Should be easy to maneuver and complete
2. Should appear interesting and important
3. Wording and visual appearance should be uncomplicated
4. Group topics from most salient to least
Pre-test the surveyUse co-workers, friends, family
Pilot the survey
Small random sample
Constructing the survey
List from which names will be drawn
• Should hit entire target population
• Should be current
• No repeated names or addresses
Determine the sampling frame
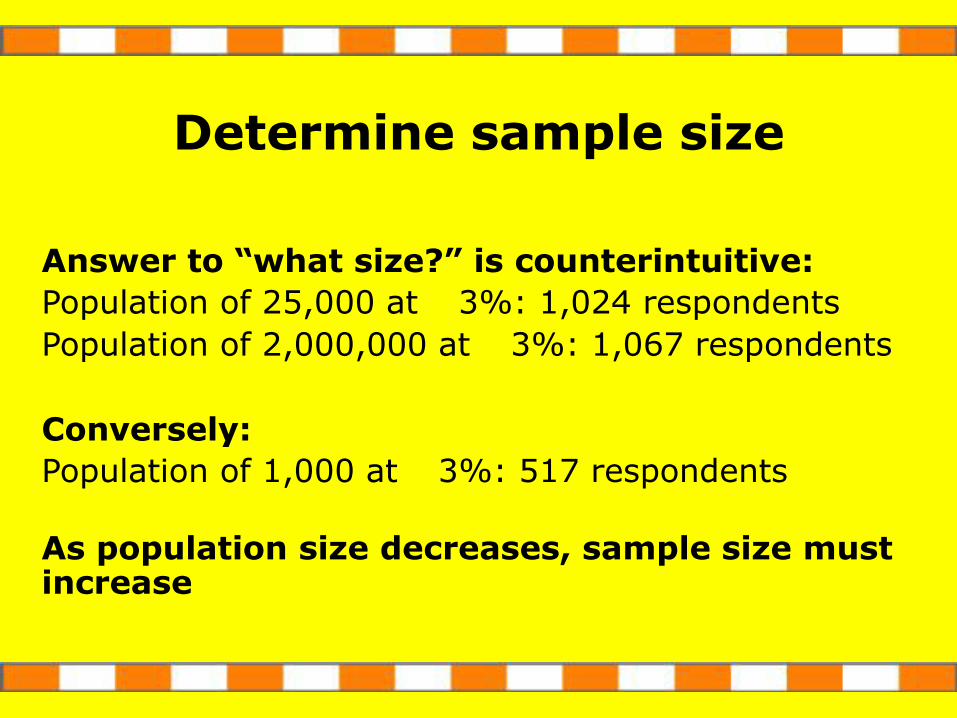
Answer to “what size?” is counterintuitive:
Population of 25,000 at 3%: 1,024 respondents
Population of 2,000,000 at 3%: 1,067 respondents
Conversely:
Population of 1,000 at 3%: 517 respondents
As population size decreases, sample size must increase
Determine sample size
• Avoid inconvenience
• Include SASE (real stamp)
• Cover letter explaining nature of survey
• Follow up with reminder (postcard)
Strategies to increase response rate
Include a “reward” if possible
Strategies to increase response rate
Resource: Questionnaire design and survey implementation
Dillman, D.A. (2007).
Internet, Mail and Mixed-Mode Surveys: The Tailored Design Method, 3rd ed.
New York: Wiley & Sons, Inc.
Minnesota Motorcycle
Rider Survey
2008
Methods
All registered motorcycle owners, duplicates removed
Random sample of 3,000 from group
Embroidered patch included
Reminder mailed to entire sample
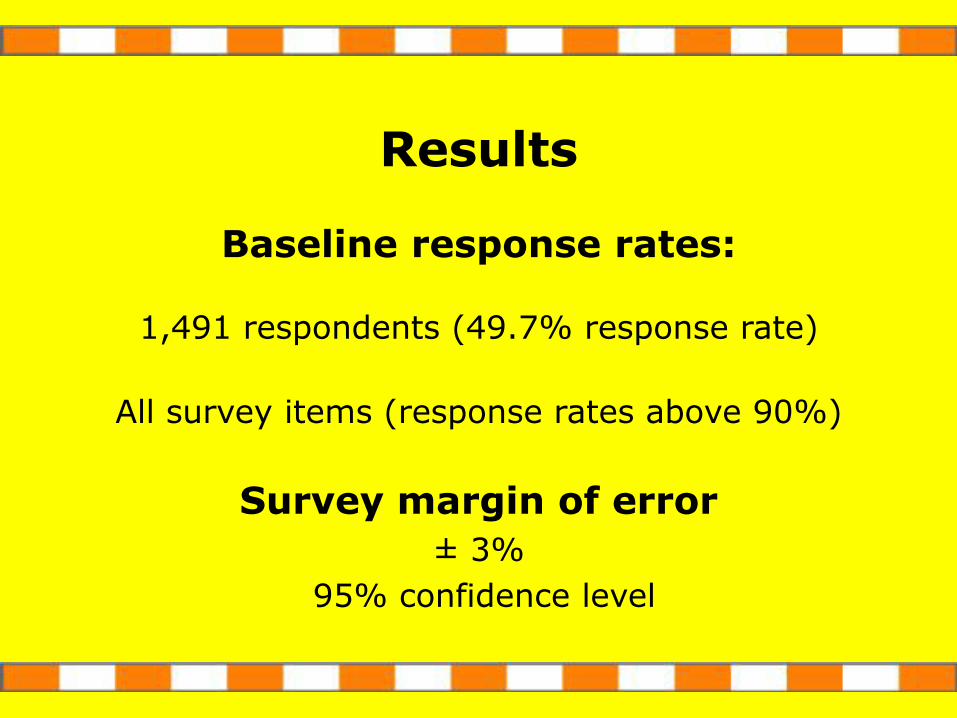
Results
Baseline response rates:
1,491 respondents (49.7% response rate)
All survey items (response rates above 90%)
Survey margin of error
± 3%
95% confidence level
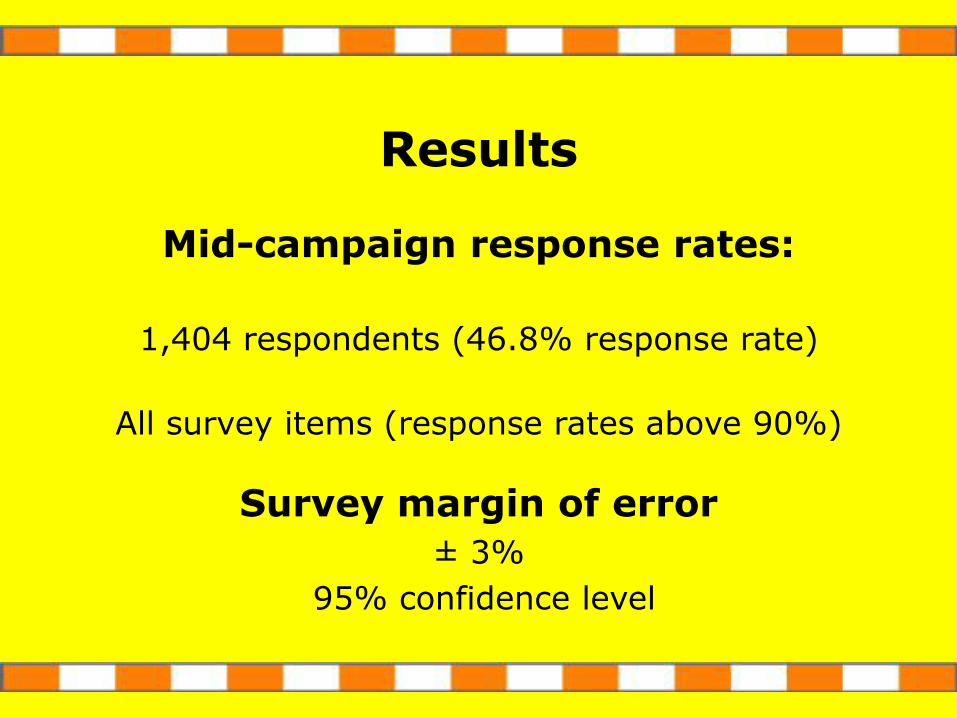
Results
Mid-campaign response rates:
1,404 respondents (46.8% response rate)
All survey items (response rates above 90%)
Survey margin of error
± 3%
95% confidence level
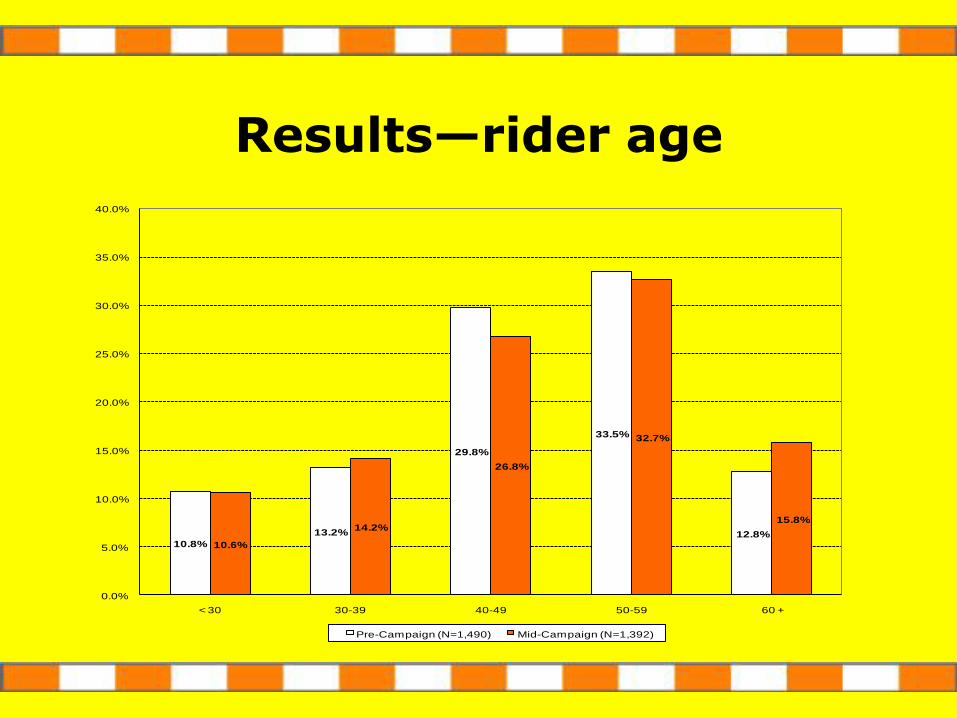
Results—rider age
10.8%
13.2%
29.8%
33.5%
12.8%
10.6%
14.2%
26.8%
32.7%
15.8%
0.0%
5.0%
10.0%
15.0%
20.0%
25.0%
30.0%
35.0%
40.0%
< 30 30-39 40-49 50-59 60 +
Pre-Campaign (N=1,490) Mid-Campaign (N=1,392)
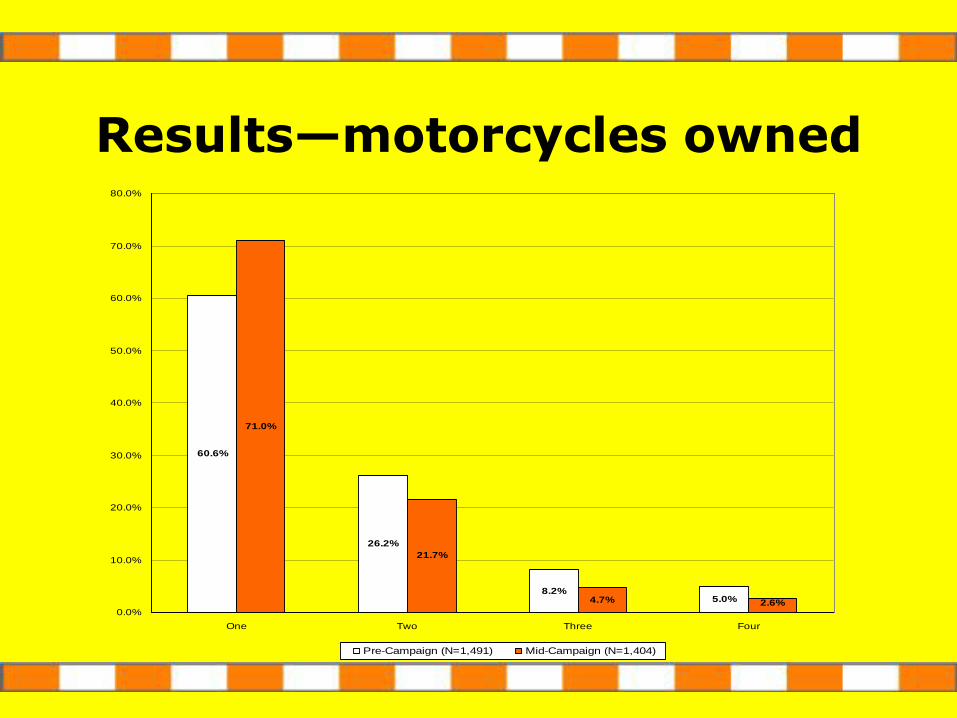
60.6%
26.2%
5.0%
71.0%
21.7%
4.7% 2.6%
8.2%
0.0%
10.0%
20.0%
30.0%
40.0%
50.0%
60.0%
70.0%
80.0%
One Two Three Four
Pre-Campaign (N=1,491) Mid-Campaign (N=1,404)
Results—motorcycles owned
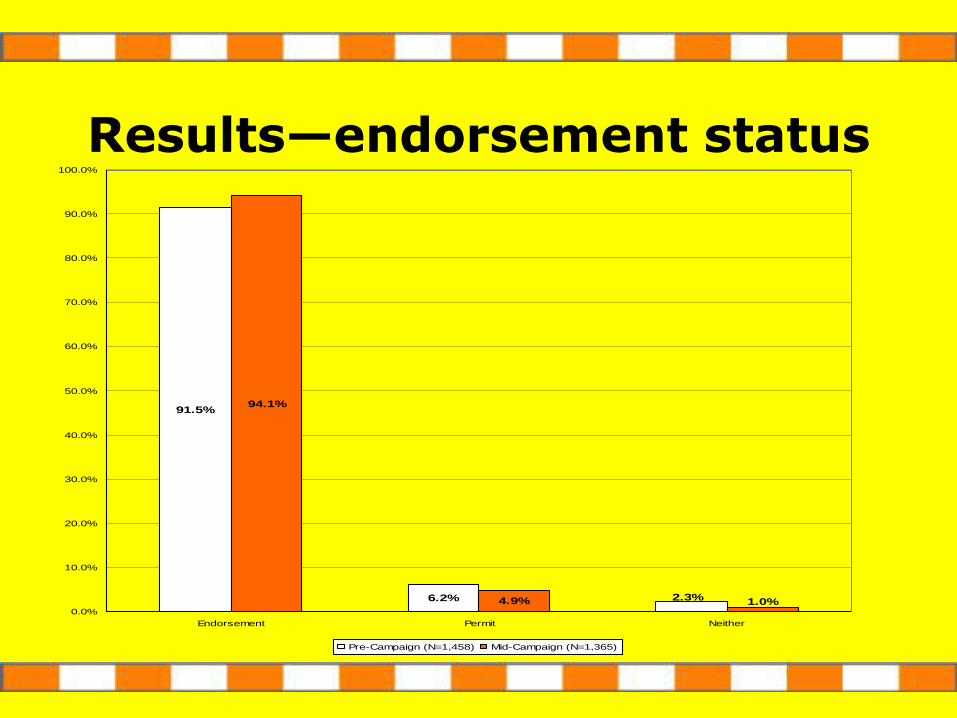
6.2%
94.1%
4.9% 1.0%2.3%
91.5%
0.0%
10.0%
20.0%
30.0%
40.0%
50.0%
60.0%
70.0%
80.0%
90.0%
100.0%
Endorsement Permit Neither
Pre-Campaign (N=1,458) Mid-Campaign (N=1,365)
Results—endorsement status
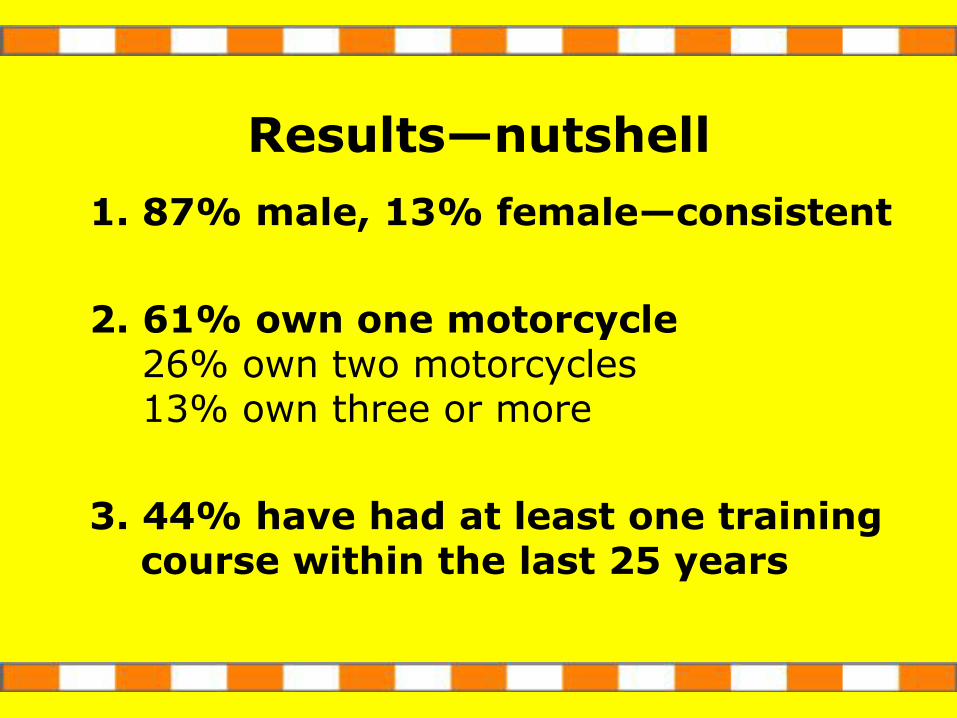
Results—nutshell
1. 87% male, 13% female—consistent
2. 61% own one motorcycle26% own two motorcycles13% own three or more
3. 44% have had at least one trainingcourse within the last 25 years
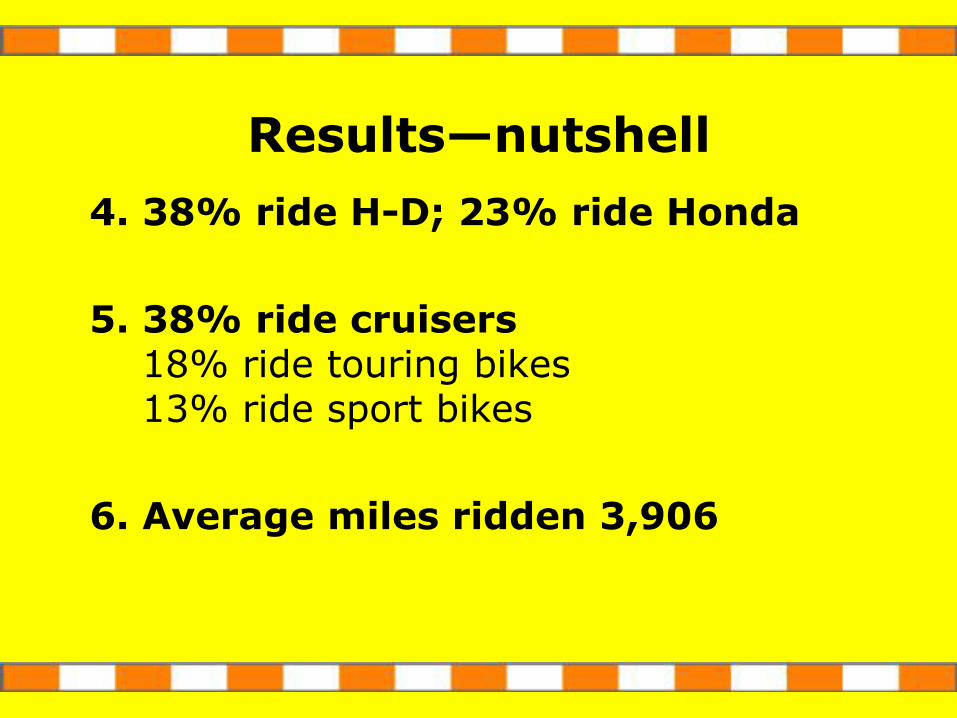
Results—nutshell
4. 38% ride H-D; 23% ride Honda
5. 38% ride cruisers18% ride touring bikes13% ride sport bikes
6. Average miles ridden 3,906
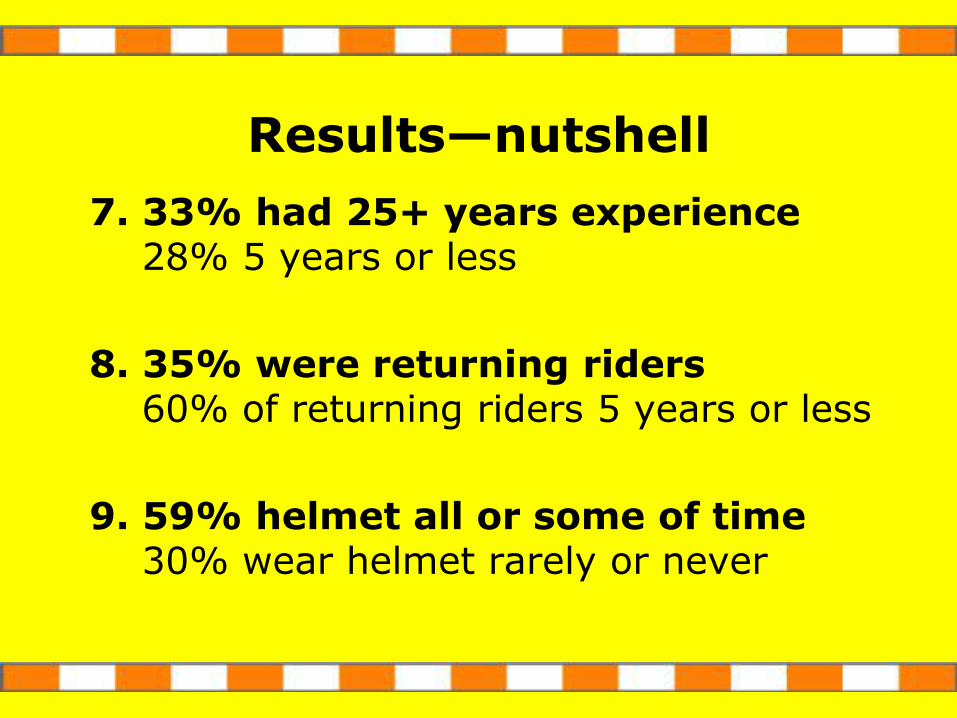
Results—nutshell
7. 33% had 25+ years experience28% 5 years or less
8. 35% were returning riders60% of returning riders 5 years or less
9. 59% helmet all or some of time30% wear helmet rarely or never
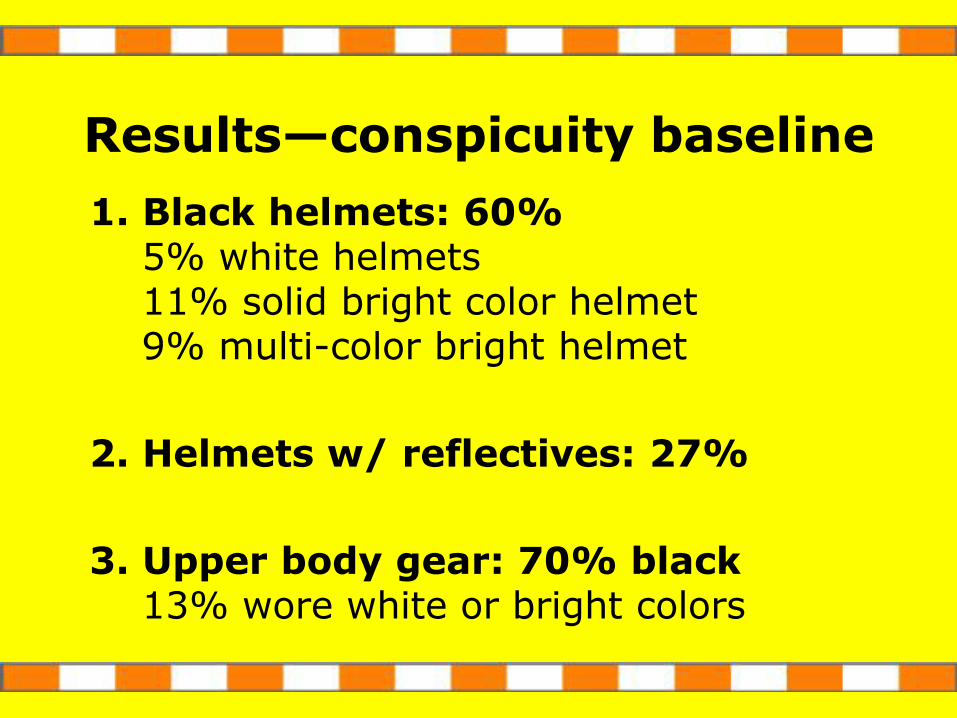
Results—conspicuity baseline
1. Black helmets: 60% 5% white helmets 11% solid bright color helmet9% multi-color bright helmet
2. Helmets w/ reflectives: 27%
3. Upper body gear: 70% black13% wore white or bright colors
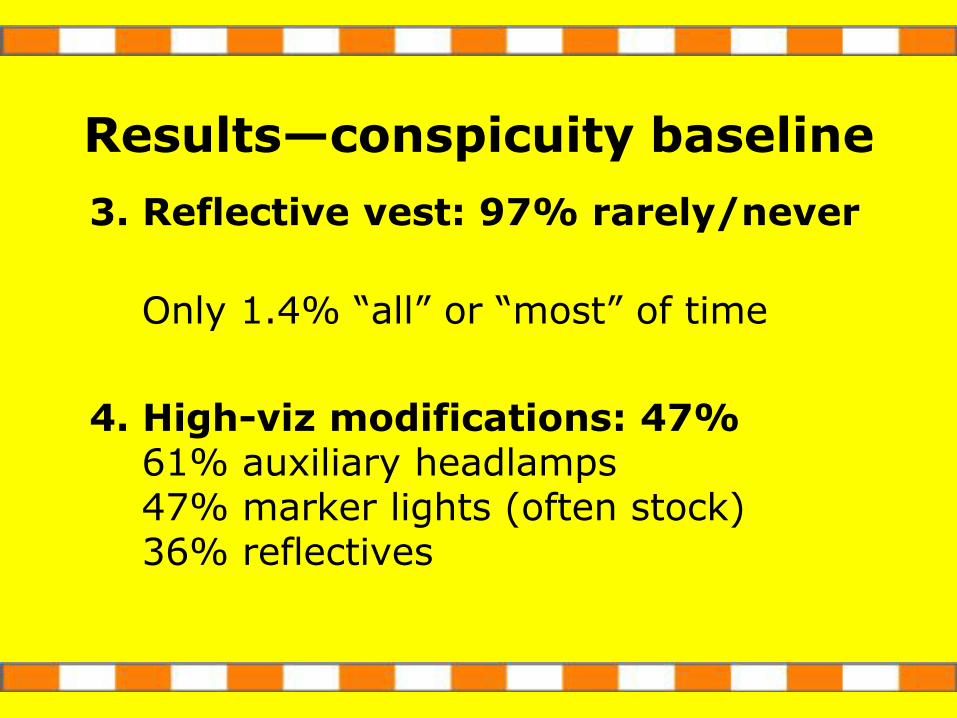
Results—conspicuity baseline
3. Reflective vest: 97% rarely/never
Only 1.4% “all” or “most” of time
4. High-viz modifications: 47% 61% auxiliary headlamps47% marker lights (often stock)36% reflectives
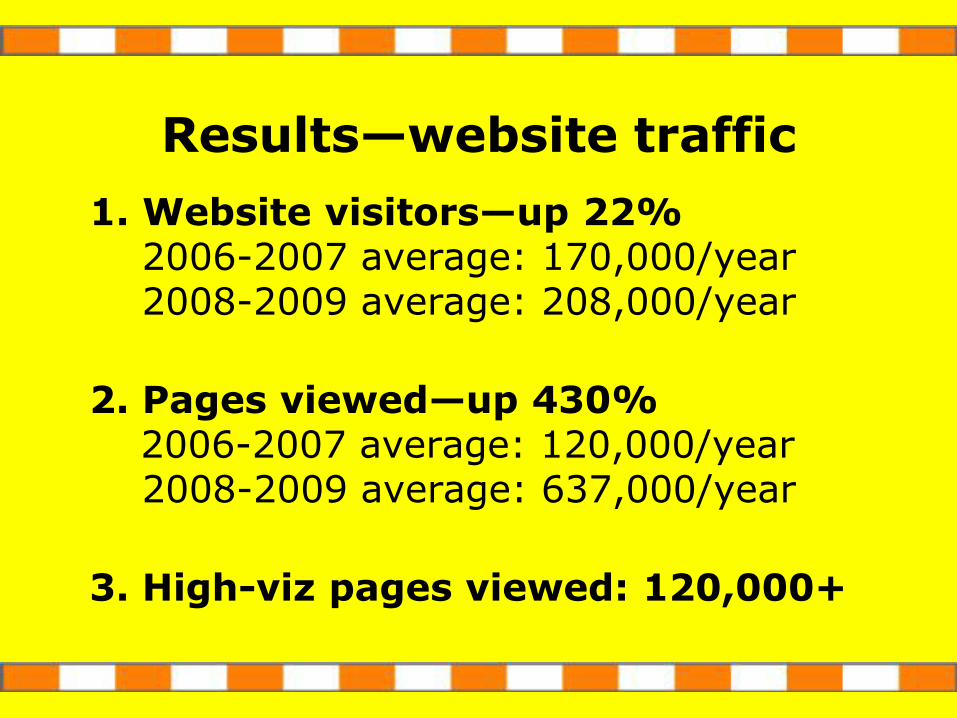
Results—website traffic
1. Website visitors—up 22%2006-2007 average: 170,000/year2008-2009 average: 208,000/year
2. Pages viewed—up 430%2006-2007 average: 120,000/year2008-2009 average: 637,000/year
3. High-viz pages viewed: 120,000+
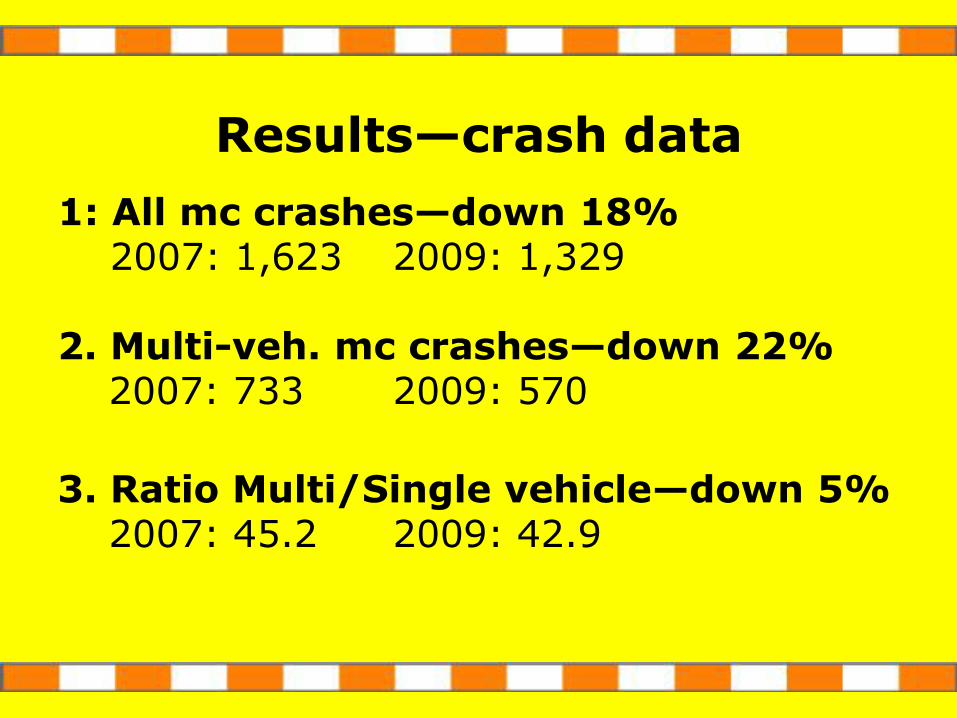
Results—crash data
1: All mc crashes—down 18%2007: 1,623 2009: 1,329
2. Multi-veh. mc crashes—down 22%2007: 733 2009: 570
3. Ratio Multi/Single vehicle—down 5%2007: 45.2 2009: 42.9
Results—crash data
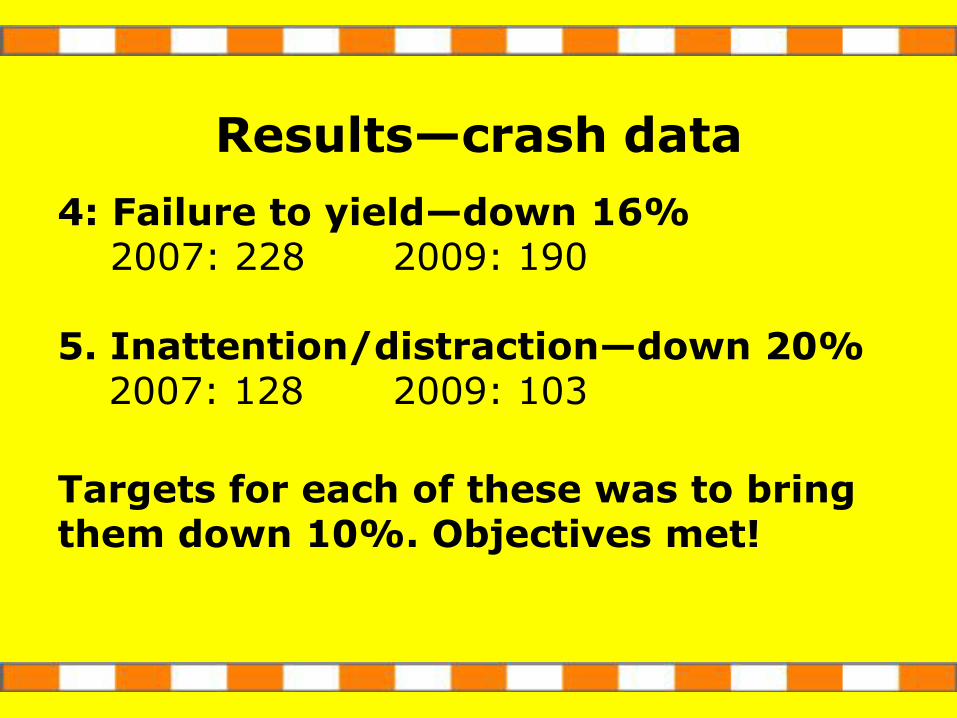
4: Failure to yield—down 16%2007: 228 2009: 190
5. Inattention/distraction—down 20%2007: 128 2009: 103
Targets for each of these was to bring them down 10%. Objectives met!
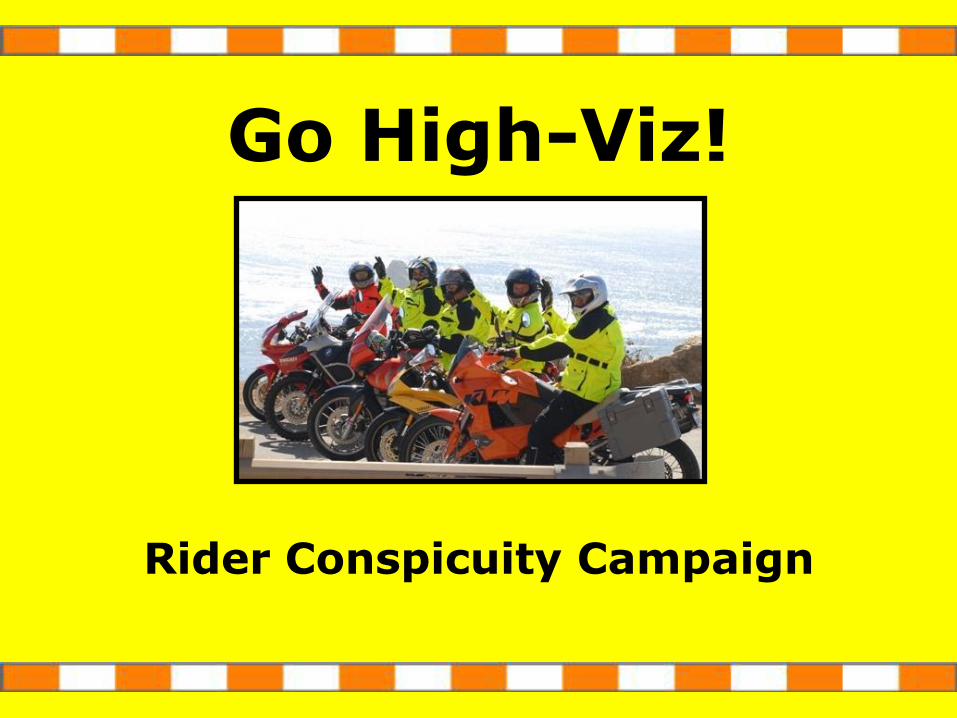
Go High-Viz!
Rider Conspicuity Campaign