Embed Size (px)
Citation preview
To view this email online, click here.
USFunds.com • August 12, 2016
Table of ContentsIndex Summary • Domestic Equity Market • Economy and Bond Market • Gold Market
Energy and Natural Resources Market • Emerging Europe • China Region • Leaders and Laggards
Press Release: U.S. Global Investors Continues GROW Dividends in August
Go Gold!By Frank HolmesCEO and Chief Investment Officer U.S. Global Investors
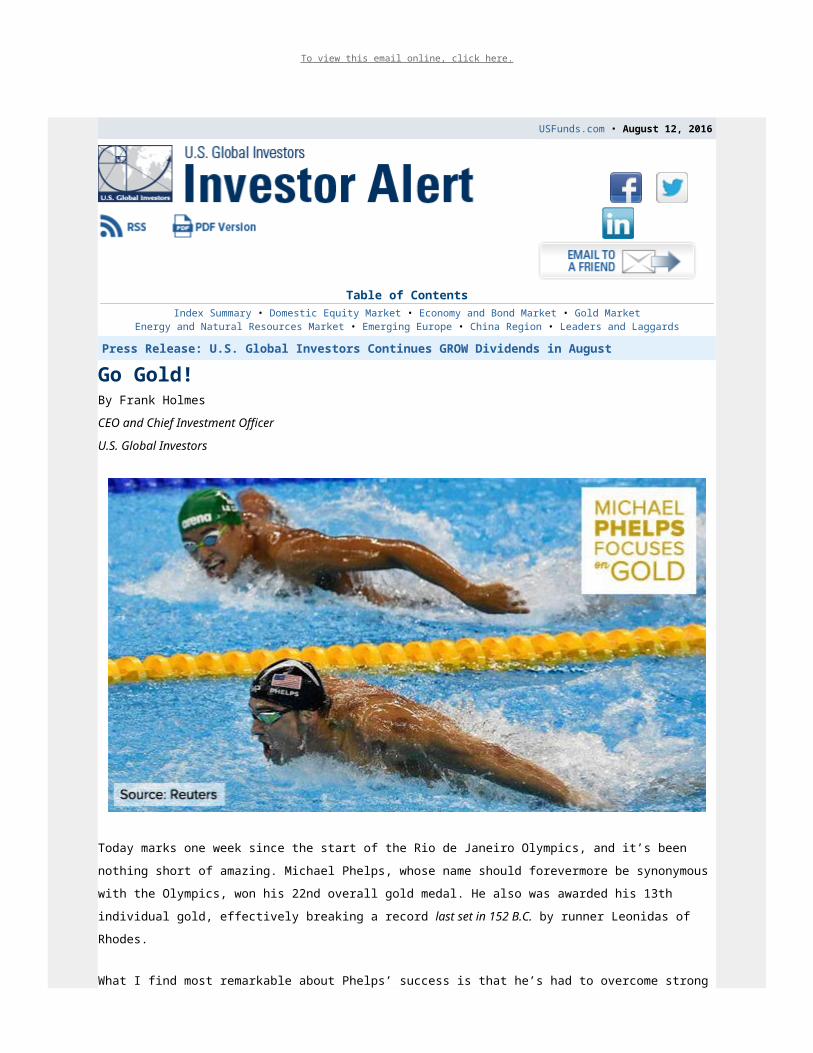
Today marks one week since the start of the Rio de Janeiro Olympics, and it’s been nothing short of amazing. Michael Phelps, whose name should forevermore be synonymous with the Olympics, won his 22nd overall gold medal. He also was awarded his 13th individual gold, effectively breaking a record last set in 152 B.C. by runner Leonidas of Rhodes.
What I find most remarkable about Phelps’ success is that he’s had to overcome strong personal challenges to reach the level he’s at. He was diagnosed with attention deficit hyperactivity disorder (ADHD) at a young age, and when he chose to get off his medication, he turned to swimming. More recently, he’s dealt with alcoholism, which landed him a DUI in 2014. His is a quintessentially American story of otherworldly success born out of failure, of meeting the obstacles that block his path to his goals head on.

When Phelps made the decision to compete again, he reteamed with his longtime swim coach Bob Bowman and set his mind to training harder than he ever had before—which, at his “advanced” age of 31, would be necessary if he hoped to have a shot at winning the gold.
The most decorated Olympian in history, Phelps, like all winners, focuses on winning. Losers, on the other hand, focus not on winning but on the winners in front of them. They’re more concerned about the short-term noise, at the expense of their long-term goal. The image above is a perfect illustration of this.
But many investors, I’ve found, are the same way. Today there’s a lot of noise and distraction. Much of it is coming from the presidential election, which is already turning out to be one of the most negative and highly contentious in American history.
Trump Self-SabotagesSomeone who could benefit from Phelps’ steadfastness and commitment to his craft is the Republican presidential candidate, Donald Trump, who all too often sabotages his own campaign with controversial and incendiary remarks.

We saw this happen this week. While speaking to the Detroit Economic Club on Monday, Trump promised that, if elected, he would place a “temporary moratorium” on any new financial regulation. Further, he would repeal the Dodd-Frank Act and reform the tax code to include only three income-tax brackets, down from the current seven.
These are solid proposals, appealing to not only everyday taxpayers but also many of the CEOs I speak with on a regular basis. After all, they’re the ones who must deal with regulations on a daily basis.
The problem, though, is that Trump can’t stay on message. In the opening image, Trump is more like the guy who’s distracted by Phelps rather than Phelps himself. Trump invariably will say something inflammatory soon after making a sensible remark on policy, thereby effectively resetting the news cycle. In this week’s case, it was his comment on “Second Amendment people”—a veiled threat against Hillary Clinton, some interpreted—that dominated the headlines, taking all attention away from the moratorium on financial regulations.
Research Firm: Get Ready for Madam President ClintonThe cover of TIME’s August 22 edition displays a striking likeness of Trump melting like an Air Wick candle. A single word punctuates the stark image: “Meltdown.” Whether or not you support the New York billionaire, you must admit that the “Trump train” has repeatedly jumped the track since the Republican convention just three weeks ago. What’s more, we just learned that GOP Chairman Reince Priebus is being pressured by dozens of insider Republicans to withdraw all party support, including campaign financing, from Trump’s candidacy.
Things aren’t looking good. Even regression analysis now appears to show that Trump’s chances are retreating.
In a new report, investment research firm Ned Davis makes the case that, based on historical precedent, economic as well as stock and bond market performance so far this year is pointing to an incumbent party victory in November. The chart below shows that the upward trajectory of the Dow Jones Industrial Average in 2016 more closely resembles the average performance seen in all years when the incumbent party—Republican or Democrat—held on to office.

click to enlarge
According to Ned Davis strategists Ed Clissold and Victor Jessup, “When the economy has not been in a recession, the odds of the incumbent party retaining control of the White House has jumped to 71 percent.” Since 1900, presidential elections have landed during recessions five times. In four of these instances (1920, 1932, 1960 and 2008), the incumbent party lost. The exception was 1948 when Harry Truman won—just barely, if you remember your history—but the recession began the same month as the election.
The group points out, however, that it’s extremely rare for a two-term Democrat to pass the baton to a new Democrat via election. How rare? The last time this happened was in 1836, when Andrew Jackson—the very first Democratic president—was succeeded by Martin Van Buren.
Hillary for Precious MetalsI’m very often asked which candidate will be better for gold: Trump or Clinton? The honest truth is that the answer changes week-to-week. Sometimes it’s Trump because he has demonstrated recklessness and unpreparedness. Other times, it’s Hillary because she has proposed policies that were clearly inspired by the socialism of Bernie Sanders. In her economic address this week, she laid out her plan to make college “debt-free” and tuition absolutely “free” to children from families who earn less than $125,000 a year.
To make this plan happen, income taxes will most likely need to be hiked. And if history tells us anything, it’s that gold demand has increased when socialist policies threatened economic growth. The price of gold is inversely correlated with the five-year and 10-year Treasury yields, which fall

when the economy is floundering. This makes the yellow metal all the more attractive to investors.
That’s why I always recommend a 10 percent weighting in bullion and gold stocks, in both good and bad times. Gold has a history of holding its value even during economic turmoil, which is why it’s prudent to maintain an allocation in your portfolio.
Alibaba Beats Expectations. Is China Next?Yesterday, giant Chinese ecommerce site Alibaba posted spectacular numbers, suggesting a turnaround for the world’s second biggest economy possibly isn’t too far behind. Alibaba—whose 2014 IPO stands as the largest in U.S. history, according to Renaissance Capital—posted quarterly revenues of $4.8 billion, a whopping 60 percent increase from the same time last year, and the biggest ever since before the company went public.
This is constructive news for China. Alibaba works with a reported 8.5 million sellers, from mom-and-pop-type shops to multibillion-dollar, international corporations, making for a good cross-section of the Chinese economy. (You could argue the same of Amazon and the U.S. economy.) That Alibaba’s sales are up indicates that consumption in China is stronger than perhaps analysts anticipated. Indeed, Beijing reported that retail sales grew nearly 11 percent in the second quarter year-over-year, beating estimates of 9.9 percent.

Index Summary The major market indices finished mixed this week. The Dow Jones Industrial Average
gained 0.18 percent. The S&P 500 Stock Index rose 0.05 percent, while the Nasdaq Composite climbed 0.23 percent. The Russell 2000 small capitalization index lost 0.12 percent this week.
The Hang Seng Composite gained 2.91 percent this week; while Taiwan was up 0.64 percent and the KOSPI rose 1.61 percent.
The 10-year Treasury bond yield rose 8 basis points to 1.51 percent.
Domestic Equity Market

click to enlarge
Strengths
Energy was the best performing sector for the week, increasing by 1.24 percent versus an overall increase of 0.05 percent for the S&P 500.
Endo International was the best performing stock for the week, increasing 33.81 percent.
Randstad Holding NV will acquire Monster Worldwide, the online recruitment business. Randstad is the world’s second-largest human resources services provider.
Weaknesses
Materials was the worst performing sector for the week, falling by -0.88 percent versus an overall increase of 0.05 percent for the S&P 500
First Solar was the worst performing stock for the week, falling -12.06 percent.
Delta Air Lines flights were grounded on Monday due to a nationwide system failure. The outage led to 1,800 canceled flights over two days. Business Insider's Myles Udland argues that this reflects an issue much bigger than the airline industry: Capital investment is a problem for all of corporate America.
Opportunities
Walmart is buying Jet.com. The deal will be worth about $3 billion, according to Recode's Jason Del Rey, citing anonymous sources. Walmart hopes the acquisition will help jump-start its struggling online business, which is just a fraction of the size of Amazon's. Walmart generates about $14 billion in annual e-commerce sales, compared with about $99 billion from Amazon.
Disney topped estimates. The entertainment giant earned an adjusted $1.62 a share on

revenue of $14.3 billion. Disney announced it bought a $1 billion minority stake in BAMTech, a video-streaming company previously formed by Major League Baseball. CEO Bob Iger says the acquisition will help bring the sports network's content over the top on the Internet.
Retail drug stores have been undermined by concerns about the opaque pricing structure of the pharmacy benefits management arms, which has pushed relative valuations to extremely attractive levels. While it is difficult to forecast whether any major concessions will be made to appease health insurers, this focus is masking an increasingly upbeat picture for the rest of the core business.
Threats
The strong July employment report may tempt investors to lean into bank stocks relative performance weakness under the assumption that signs of solid domestic growth will finally lead to higher rates. However, it is important to keep in mind that the bulk of the deflation impacting the U.S. is being transmitted through a strong U.S. dollar, which acts as an overall corporate profit drag. Thus, to the extent that the currency continues to appreciate, it will be difficult for inflation expectations to recover from depressed levels or allow the long end of the yield curve to rise.
A bearish outlook for refiners is becoming a more mainstream thesis. Refined product consumption has been solid for much of the past year but as a result, refiners have operated at full capacity in order to produce enough gasoline to meet demand. However, overproduction has occurred and that is being compounded by accelerating refinery production outside the U.S. Increased import competition is a serious threat.
With the major indices at all-time highs and the economy still muddling along, it seems like there could be a disconnect between the two. Any sign of weakness could cause major turmoil in the markets.

The Economy and Bond MarketStrengths
The number of foreclosures in America is at an all-time low. "Mortgage originations grew to $427 billion. About 83,000 individuals had a new foreclosure notation added to their credit reports between April 1 and June 30, a new low in the 18-year history of the data," according to the Federal Reserve Bank of New York.
Consumer sentiment edged up to 90.4 in August from 90.0. Long-run inflation expectations were unchanged at 2.6 percent.
The impressive gain in the quit rate is indicative of greater job switching and stronger wage pressure. Still, wage rigidity remains elevated, which should limit the speed by which wages accelerate. Overall, the path likely remains higher for wage inflation, but it will continue to be gradual.

Weaknesses
U.S. retail sales were unchanged in July, a worrisome sign for an economy being held aloft solely by consumer consumption. A 0.4 percent drop in the Producer Price Index reinforces the notion that despite robust labor markets, the U.S. Federal Reserve will stay on the monetary sidelines for some time to come.
Productivity has fallen for three straight quarters, the U.S. Department of Labor reported this week. That’s the longest slump in output per worker since 1979. Falling productivity is raising concerns about corporate profits and the pace of future hiring.
Job openings rose less than expected in June. The number of jobs open in the U.S. in July hit 5.624 million, less than expected, but up from May's reading of 5.5 million, according to the latest Job Openings and Labor Turnover Survey (JOLTS) report.
Opportunities
The minutes of the U.S. Federal Reserve’s Federal Open Market Committee meeting will be released on Wednesday, August 17. The commentary will likely reflect a patient stance, which should buffer market volatility.
Arizona and Tennessee have received credit rating increases from S&P this year. In contrast to many states that have been downgraded or are dealing with issues such as severely underfunded pensions or budget shortfalls, the stability in these states could be a boon to their municipal bonds.
With some global growth indicators starting to pick up and deflationary pressures easing along with highly accommodative central bank liquidity, this “sweet spot” could allow non-government bonds to outperform government bonds in the near term.
Threats
Credit ratings have been cut on six states by S&P Global Ratings this year, already the second-highest amount for a year during the past three decades. The three-to-one ratio of state rating downgrades to upgrades has only been met or exceeded four other times since 1986. While the economy is expanding, the slow pace is adversely impacting state budgets and credit quality as increases in tax revenue at the state level have failed to keep pace.

click to enlarge
Saudi Arabia is pumping out more oil than ever before. Saudi Arabia increased its oil production by another 123,000 barrels a day to 10.67 million, the most on record. The record production is evidence that Saudi Arabia doesn't care so much about the oil price and would rather wipe out its competition.
The trade balance and the first estimate of Japan's second-quarter GDP will be released next week. If the data releases are weak, it will place more pressure on officials to provide additional policy stimulus.
Gold MarketThis week spot gold closed at $1,335.40, down $0.15 per ounce, or 0.01 percent. Gold stocks, as measured by the NYSE Arca Gold Miners Index, rose 2.09 percent. Junior miners outperformed seniors for the week, as the S&P/TSX Venture Index traded up 3.30 percent. The U.S. Trade-Weighted Dollar Index slipped 0.48 percent.
Date Event Survey Actual Prior
Aug-11 U.S. Initial Jobless Claims 265k 266K 267k
Aug-11 U.S. Retail Sales YoY 10.5% 10.2% 10.6%
Aug-12 Germany CPI YoY 0.4% 0.4% 0.4%
Aug-12 U.S. PPI Final Demand YoY 0.2% -0.2% 0.3%
Aug-11 Germany ZEW Survey Current Situation 50.2 -- 49.8
Aug-11 Germany ZEW Survey Expectations 2.0 -- -6.8

Date Event Survey Actual Prior
Aug-11 U.S. Housing Starts 1180k -- 1189k
Aug-11 U.S. CPI YoY 0.9% -- 1.0%
Aug-12 U.S. CPI Core YoY 0.9% -- 0.9%
Aug-12 U.S. Initial Jobless Claims 265k -- 266k
Strengths
The best performing precious metal for the week was gold, holding in with a 1 basis point drop. According to the World Gold Council, global gold demand in the second quarter increased 15 percent due to a 141 percent rise in investment demand. The Royal Mint also commented on a “surge” in demand, specifically when the Bank of England cut rates – during that week the Mint saw a 25-percent increase in transactions on its bullion website, reports BBC. The Mint’s “signature gold” has also allowed buyers to purchase fractions of gold bars, causing sales to jump 140 percent.
Japan is the “star performer” among smaller gold consumers, reports Bloomberg, with four straight quarters of positive net investment into bars and coins. Demand expanded to 5.8 metric tonnes in the second quarter. The World Gold Council cites distrust of Abenomics, negative interest rates and a rising yen for the investment boost. In China, vehicle sales in July gained the most in 17 months, sending palladium to touch a one-year high. Speculation is that supply won’t be enough to meet demand, reports Bloomberg, as the metal is used in the making of car parts.
Gold prices jumped this week as investors reevaluated the likelihood that the Fed will raise rates this year, reports Investing.com. The Labor Department said nonfarm business sector labor productivity fell 0.5 percent in the second quarter (extending the longest decline since 1979). According to BMO Private Bank, economists surveyed expected a 0.4 percent gain for the three months ended June.
Weaknesses
The worst performing precious metal for the week was platinum losing 2.03 percent, on what may have been profit taking following the very strong rally in the platinum group metal prices over the last two weeks.
According to BCA Research, the U.S. labor market strength is a “conundrum.” Last week’s jobs report came in strong and although U.S. real GDP is up only 1.2 percent year-over-year, employment has grown by a stronger 1.9 percent year-over-year, the group points out. It is uncommon for GDP growth to be weaker than employment growth, and such a gap is “unsustainable as businesses will experience continued erosion in profit margins.”
Following the U.K.’s vote to leave the European Union, gold prices soared to the highest level since 2014. The higher price is one reason that China, the world’s biggest producer and consumer of gold, cut purchases in July, reports Bloomberg. The People’s Bank of China

increased its gold holdings by the smallest amount since it began disclosing purchases about a year ago.
Opportunities
David Haughton of CIBC says the gold rally we’ve experienced so far this year is sustainable. He points to three key factors: 1) Comparing this rally to five others over the past 40 years shows gold equities are still 40-50 percent off the previous high, while historical cycles reached around 20 percent of old highs in the same time frame. 2) Most companies are now demonstrating fiscal discipline that could support outperformance ahead. 3) Investors are mostly underweight gold equities and macro factors appear supportive.
click to enlarge
In its Gold Sector Review report, Credit Suisse points to several demand trend updates for the second quarter of 2016. The group explains that mine supply was flat year-over-year, as production from new streams was offset by declines in existing assets. They forecast mine supply to fall 7 percent by 2018 versus the 2015 level driven primarily by declining grades and a lack of new projects coming on-stream due to industry capex cuts since 2013.
In the Financial Times this week, investment expert and precious metals analyst Diego Parrilla writes that the gains seen this year in gold are just the beginning of a new gold bull market. “My view that there is a perfect storm for gold is based on three closely interrelated dynamics, whereby central banks and global markets are both testing the limits of monetary policy and credit markets as well as the boundaries of fiat currencies.”
Threats
Andrew Garthwaite of Credit Suisse published his opinion on gold and gold mining stocks Friday, pointing to three tactical concerns he has with the metal: 1) Gold moves inversely with real bond yields, and he thinks real rates will rise. 2) Gold moves inversely with banks,

and he thinks financials will outperform if bond yields rise. 3) Gold is overvalued base on his model.
With the probability of three rate hikes from the Fed through to the end of 2017, Picet Wealth Management believes that gold may have met its match after a stellar start to the year, reports Bloomberg. “With the dollar in a long-term uptrend, bullion isn’t likely to break the $1,430 an ounce level,” said Luc Luyet, a currencies strategist at the Picet.
With a rally in gold prices so far this year, purchases in India (the world’s second-biggest consumer) will be reduced, reports Bloomberg, trimming import prospects amid high inventories. Historically, the second half of the year is normally better for gold demand from Indian brides, but so far this year a “rally of 25 percent in the first six months has hit the buffers,” continues Bloomberg, with higher costs deterring jewelry buyers.
Energy and Natural Resources Market

Strengths
Global demand for gold tops records in the first half of 2016, says the World Gold Council. Gold demand reached 2,335 tonnes in the first half of 2016, a 16-percent leap above the previous record set in the first half of 2009. Investment demand was the growth driver as investors sought risk diversification and a safe store of value in the face of continued political, economic and social instability, according to precious metals’ reporter Lawrie Williams.
The best performing sector for the week was the S&P 500 Oil & Gas Exploration and Production Index. The index of major U.S. oil producers rose on the back of strong crude prices, which rebounded on speculation that OPEC may hold an extemporary meeting (again) to address the global supply glut.
Parex Resources Inc., a Canadian junior oil and gas producer was the best performing stock in the broader natural resource space for the week. The stock outperformed after it reported a second quarter beat on cash flow, together with positive drilling results at its Jacana field, which according to Haywood analysts, continues to look more promising than previously expected.
Weaknesses
Crude oil supply was sharply higher in July, slamming the brakes on the price recovery. The IEA estimated an 800,000 barrel per day increase in global oil supply in July, with both OPEC and non-OPEC increasing output. Total OPEC output of 33.2 million barrels per day was the highest since 1997, and Saudi production reached a record monthly high of 10.62 million barrels per day.
click to enlarge
The worst performing sector for the week was the NASDAQ Clean Edge U.S. Index. The index of renewable energy companies dropped following disappointing earnings reports by

its member stocks. Sunpower Corporation was the worst performing member after it reported a larger-than-forecast, second quarter loss, and issued a downbeat full-year outlook.
The worst performing stock for the week in the broader natural resource space was First Solar Inc. The manufacturer of solar energy modules slumped after receiving price-target cuts from Mizuho and Barclays, citing a challenging competitive environment and lower growth for renewable energy adoption.
Opportunities
Crude prices got a boost as Venezuela hints OPEC may hold an extemporary meeting to cap output. According to Venezuelan sources, later validated by Saudi’s oil minister, an informal OPEC meeting may be held in late September on the sidelines of an International Energy Forum conference in Algeria. As VTB reports, the meeting will likely serve to discuss the potential for a production freeze, however, the speculation of a freeze alone may support prices until then.
China’s property sector should continue to recover, according to JP Morgan. Despite a strong first half of 2016 for property prices, investors continue to hold a negative view on the sector, with concerns that policy tightening may derail the recovery. However, the bank cites two reasons to remain optimistic: 1) Cities with policy tightening are a small part of overall property sales, and 2) Even after tightening, property sales have been very strong. Developers’ sales went up 55 percent year-on-year for the first half of 2016, and in July, sales were still up 80 percent year-on-year.
Platinum and palladium may be up for a catch-up trade as open interest lags its precious metals peers. The “fear trade” has a 36 percent increase in outstanding gold ETF holdings this year. Silver ETF holdings have recently begun to catch up, rising 9 percent to reflect part of gold’s strength. However, platinum and palladium ETF holdings year-to-date are tracking 5 percent and 8 percent lower, suggesting there may be a catch-up opportunity as investors look for value in other precious metals.
Threats
China published disappointing trade figures for July, with both exports and imports falling sharply. Customs authorities reported the Asian nation's imports plunged by 12.5 percent in July year-on-year, while exports also dropped by 4.4 percent over the same period. The data suggests that the world's second-largest economy is struggling with lackluster domestic demand and mounting debt. In addition, experts at Capital Economics concluded that "signs of stronger manufacturing activity among many of China's key trading partners have so far failed to lift export growth."
The global crude oil glut may be here for longer as OPEC upgrades supply forecasts. Not only did OPEC increase its monthly supply to a 20-year high in July, it also raised its forecast for non-OPEC oil supply in 2016. According to the organization, supply from non-members is now expected to contract only by 0.79 million barrels per day in 2016. This number reflects an upward revision of 0.09 million barrels per day since the previous report, driven by higher-than-expected output in the U.S. and the U.K.

Crude demand growth forecasts continue to slide. The IEA estimated that global demand growth eased by a rate of 200,000 barrels per day in the second quarter, as India and China slowed. Despite the drop, the IEA left its forecasts for demand growth in 2016 unchanged, suggesting a downward revision is possible. In addition, the EIA downgraded its 2017 demand growth forecast by 100,000 barrels per day, undermining the case for a quick market rebalancing.
China RegionStrengths
The Hang Seng Composite Index had another strong week, closing at its highest levels year-to-date and leaving the index up more than 1.6 percent in 2016 and about 23.8 percent from its February lows.
click to enlarge
Alibaba Group, the Chinese e-commerce giant founded by Jack Ma, soared more than 16 percent this week to new 52-week highs after reporting strong earnings beats on both top and bottom lines and receiving numerous broker upgrades. Notably, gross merchandise volume climbed, as did mobile active monthly users, and the company stressed a firm commitment to its rapidly-expanding cloud computing business. While investors may still harbor some doubts about the overall health of the Chinese economy—China did release several data that missed expectations this week—if Alibaba is any proxy for China’s growing middle class, then China looks pretty darn good.
Thailand’s SET Index jumped 2.34 percent this week, gapping up to new 52 week highs on Monday after the country’s citizens approved a new constitution last weekend.
Weaknesses
Singapore GDP came in at a 2.1 percent year-over-year growth rate, slightly below expectations for a 2.2 percent print, while quarter-over-quarter growth missed expectations

for 0.8 percent, coming in instead at 0.3 percent.
While Chinese foreign exchange reserves did come in at a stable $3.2 trillion, most other data were weak. Exports and imports, Producer Price Index (PPI), industrial production, retail Sales, fixed assets investment, M2 money supply, new yuan loans, aggregate financing and foreign direct investments (FDI) all came in weaker than expected this week for China.
Hua Han Health Industry tumbled almost 33 percent for the week after it was placed on review for a cut by Moody’s.
Opportunities
Hong Kong Exchanges & Clearing CEO Charles Li explained this week that a Hong Kong-Shenzhen trading link is “imminent.” The HK-Shenzhen stock connect program will constitute an expansion of the existing program between Hong Kong and Shanghai.
Thailand’s new constitution should allow for elections to be held sometime in 2017.
Dedicated Emerging Markets equity funds recorded a sixth straight week of inflows, notching up an additional $1.64 billion this week, Morgan Stanley reported in a note.
Threats
Reuters cited President Rodrigo Duterte of the Philippines as suggesting this week that the country may be just fine without the $850 million in state revenues brought in by mining companies. The tough-talking populist politician, who was sworn in in June, has left the 2012 moratorium on new mining licenses in place and Secretary of the Environment and Natural Resources Gina Lopez continues to call for a full ban on open-pit mining.
Thailand—which was closed on Friday in a Queen’s Birthday holiday celebration—was rocked by a wave of coordinated bombings that appears to have targeted prime tourist destinations and left four dead and dozens wounded. The explosions were the first of this sort since an attack in Bangkok about a year ago, and could threaten tourism.
Emerging Europe

click to enlarge
Strengths
Turkey was the best performing country this week, gaining 2.8 percent. The Borsa Istanbul stock exchange has been volatile as the chart below illustrates. More than 1 million people gathered in Istanbul last weekend to support the Turkish president, Recep Erdogan, and to celebrate the country’s resilience after the failed coup attempt that took place last month.
click to enlarge
The Turkish lira was the best currency this week, gaining 1.3 percent against the dollar. The rebound in currency was supported by Moody’s decision not to announce the country’s credit rating late last Friday. Moody’s put Turkey under review for potential downgrade after the failed coup attempt and has 90 days to complete the review.
The industrial sector was the best performing sector among Eastern European markets this

week.
Weaknesses Ukraine was the worst relative performing market this week, gaining 16 basis points. The
latest consumer price index (CPI) reading showed a slight pickup in inflation, up 7.9 percent from 6.9 percent a year ago. At the beginning on this year, the government set target inflation for this year at 12 percent. Inflation peaked in April of 2015 at 60.9 percent.
The Ukrainian hryvnia was the worst performing currency this week, losing 92 basis points against the dollar. Currency weakened to a two-month low amid Crimean tension. Further confrontation with Russia could worsen the already weak budget situation in Ukraine.
The utility sector was the worst performing sector among Eastern European markets this week.
Opportunities
Russian GDP was reported at -0.6 percent year-over-year in the second quarter of this year, while the market was expecting a contraction of 0.8 percent. Oleg Kouzmin from Renaissance Capital expects GDP growth to remain slightly negative in the third quarter in year-over-year terms and record a marginally positive print in the last quarter of this year. Russia should come back to growth in 2017 when consumer and investment demand will finally pick up after two consecutive years of contraction.
Romania led the five former communist countries reporting preliminary estimates of economic growth on Friday, with annual expansion jumping to 6 percent from 4.3 percent in the previous three months. Growth in Bulgaria, Hungary, Slovakia and Poland, the region’s biggest economy, also accelerated from the first quarter. The euro area GDP expanded at an annual rate of 1.6 percent.
Emerging Markets appreciated more than 17 percent year to date, supported by global easing and low rates. Investors may find further opportunites in countries with higher-yielding bonds and in which inflation dynamics are improving.
Threats
President Erdogan of Turkey urged Turkish banks to cut rates they charge customers. He said that “I would consider it as treason if the banks don’t open the way for investors.” Some banks already decreased home loan rates especially with the short maturities and more banks may do the same. Banks with a larger mortgage loan books could witness the biggest hits to their profitability.
Erdogan and Russian president Vladimir Putin met in the Constantine Palace near St. Petersburg on Tuesday, and many predict an end to the sour relationship that developed between both leaders after the Russian war plane was shot down by Turks on a mission in Syria. The two leaders discussed the resumption of economic cooperation, but the Syrian situation may present a bigger challenge for them to overcome. Erdogan’s interests are not aligned with Putin’s in Syria. Putin supports Bashar al-Assad of Syria and recognizes him as a valid leader of the country while Erdogan supports the rebels who fight against Assad’s

regime.
Increased fighting in the region of eastern Ukraine has been reported and President of Ukraine, Petro Poroshenko, has put his troops on the border with Russian held Crimea on a high alert. Western countries have refused to recognize Russia’s takeover of Crimea and have imposed sanctions that put Russia into a recession. Increasing geopolitical tension in the region may add pressure on the ruble, which has been looking strong relative to oil in the last few weeks.
Leaders and LaggardsWeekly Performance
Index CloseWeekly
Change($)Weekly
Change(%)
DJIA 18,576.47 +32.94 +0.18%

Weekly Performance
Index CloseWeekly
Change($)Weekly
Change(%)
S&P 500 2,184.05 +1.18 +0.05%
S&P Energy 508.16 +6.24 +1.24%
S&P Basic Materials 302.87 -2.68 -0.88%
Nasdaq 5,232.90 +11.77 +0.23%
Russell 2000 1,229.82 -1.48 -0.12%
Hang Seng Composite Index 3,070.16 +86.84 +2.91%
Korean KOSPI Index 2,050.47 +32.53 +1.61%
S&P/TSX Global Gold Index 275.57 +2.51 +0.92%
XAU 111.73 +2.12 +1.93%
Gold Futures 1,340.80 -3.60 -0.27%
Oil Futures 44.66 +2.86 +6.84%
Natural Gas Futures 2.59 -0.18 -6.57%
10-Yr Treasury Bond 1.51 -0.08 -5.10%
Monthly Performance
Index CloseMonthly
Change($)Monthly
Change(%)
DJIA 18,576.47 +204.35 +1.11%
S&P 500 2,184.05 +31.62 +1.47%
S&P Energy 508.16 -9.47 -1.83%
S&P Basic Materials 302.87 +0.82 +0.27%
Nasdaq 5,232.90 +227.17 +4.54%
Russell 2000 1,229.82 +28.66 +2.39%
Hang Seng Composite Index 3,070.16 +184.46 +6.39%
Korean KOSPI Index 2,050.47 +44.92 +2.24%
S&P/TSX Global Gold Index 275.57 +4.83 +1.78%
XAU 111.73 +3.27 +3.01%
Gold Futures 1,340.80 -10.40 -0.77%
Oil Futures 44.66 -0.09 -0.20%
Natural Gas Futures 2.59 -0.15 -5.37%
10-Yr Treasury Bond 1.51 +0.03 +2.24%
Quarterly Performance
Index CloseQuarterly
Change($)Quarterly
Change(%)
DJIA 18,576.47 +1,041.15 +5.94%
S&P 500 2,184.05 +137.44 +6.72%
S&P Energy 508.16 +23.01 +4.74%
S&P Basic Materials 302.87 +14.83 +5.15%
Nasdaq 5,232.90 +515.22 +10.92%
Russell 2000 1,229.82 +127.38 +11.55%
Hang Seng Composite Index 3,070.16 +376.88 +13.99%
Korean KOSPI Index 2,050.47 +83.48 +4.24%
S&P/TSX Global Gold Index 275.57 +51.14 +22.79%

Quarterly Performance
Index CloseQuarterly
Change($)Quarterly
Change(%)
XAU 111.73 +24.75 +28.45%
Gold Futures 1,340.80 +61.50 +4.81%
Oil Futures 44.66 -1.55 -3.35%
Natural Gas Futures 2.59 +0.49 +23.57%
10-Yr Treasury Bond 1.51 -0.19 -11.35%
U.S. Global Investors, Inc. is an investment adviser registered with the Securities and Exchange Commission ("SEC"). This does not mean that we are sponsored, recommended, or approved by the SEC, or that our abilities or qualifications in any respect have been passed upon by the SEC or any officer of the SEC.
This commentary should not be considered a solicitation or offering of any investment product.
Certain materials in this commentary may contain dated information. The information provided was current at the time of publication.
Some links above may be directed to third-party websites. U.S. Global Investors does not endorse all information supplied by these websites and is not responsible for their content.
All opinions expressed and data provided are subject to change without notice. Some of these opinions may not be appropriate to every investor.
Holdings may change daily. Holdings are reported as of the most recent quarter-end. The following securities mentioned in the article were held by one or more accounts managed by U.S. Global Investors as of 06/30/2016:Delta Air LinesFirst Solar Inc.Parex Resources Inc.
The Dow Jones Industrial Average is a price-weighted average of 30 blue chip stocks that are generally leaders in their industry.The S&P 500 Stock Index is a widely recognized capitalization-weighted index of 500 common stock prices in U.S. companies.The Nasdaq Composite Index is a capitalization-weighted index of all Nasdaq National Market and SmallCap stocks.The Russell 2000 Index® is a U.S. equity index measuring the performance of the 2,000 smallest companies in the Russell 3000®, a widely recognized small-cap index.The Hang Seng Composite Index is a market capitalization-weighted index that comprises the top 200 companies listed on Stock Exchange of Hong Kong, based on average market cap for the 12 months.The Taiwan Stock Exchange Index is a capitalization-weighted index of all listed common shares traded on the Taiwan Stock Exchange.The Korea Stock Price Index is a capitalization-weighted index of all common shares and preferred shares on the Korean Stock Exchanges. The Philadelphia Stock Exchange Gold and Silver Index (XAU) is a capitalization-weighted index that includes the leading companies involved in the mining of gold and silver. The U.S. Trade Weighted Dollar Index provides a general indication of the international value of the U.S. dollar.The S&P/TSX Canadian Gold Capped Sector Index is a modified capitalization-weighted index, whose equity weights are capped 25 percent and index constituents are derived from a subset stock pool of S&P/TSX Composite Index stocks.The S&P 500 Energy Index is a capitalization-weighted index that tracks the companies in the energy sector as a subset of the S&P 500.The S&P 500 Materials Index is a capitalization-weighted index that tracks the companies in the material sector as a subset of the S&P 500.The S&P 500 Financials Index is a capitalization-weighted index. The index was developed with a base level of 10 for the 1941-43 base period.The S&P 500 Industrials Index is a Materials Index is a capitalization-weighted index that tracks the companies in the industrial sector as a subset of the S&P 500.The S&P 500 Consumer Discretionary Index is a capitalization-weighted index that tracks the companies in the consumer discretionary sector as a subset of the S&P 500.The S&P 500 Information Technology Index is a capitalization-weighted index that tracks the companies in the information technology sector as a subset of the S&P 500.The S&P 500 Consumer Staples Index is a Materials Index is a capitalization-weighted index that tracks the companies in the consumer staples sector as a subset of the S&P 500.The S&P 500 Utilities Index is a capitalization-weighted index that tracks the companies in the utilities sector as a subset of the S&P 500.The S&P 500 Healthcare Index is a capitalization-weighted index that tracks the companies in the healthcare sector as a subset of the S&P 500.The S&P 500 Telecom Index is a Materials Index is a capitalization-weighted index that tracks the companies in the telecom sector as a subset of the S&P 500.The NYSE Arca Gold Miners Index is a modified market capitalization weighted index comprised of publicly traded companies involved primarily in the mining for gold and silver. The Consumer Price Index (CPI) is one of the most widely recognized price measures for tracking the price of a market basket of goods and services purchased by individuals. The weights of components are based on consumer spending patterns.

The Purchasing Manager’s Index is an indicator of the economic health of the manufacturing sector. The PMI index is based on five major indicators: new orders, inventory levels, production, supplier deliveries and the employment environment.The S&P/TSX Venture Composite Index is a broad market indicator for the Canadian venture capital market. The index is market capitalization weighted and, at its inception, included 531 companies. A quarterly revision process is used to remove companies that comprise less than 0.05% of the weight of the index, and add companies whose weight, when included, will be greater than 0.05% of the index.
The Borsa Istanbul 100 Index is a capitalization-weighted index composed of National Market companies except investment trusts. The constituents of the BIST National 100 Index are selected on the basis of pre-determined criteria directed for the companies to be included in the indices.The Philadelphia Gold and Silver Index (XAU) is a capitalization-weighted index that includes the leading companies involved in the mining of gold and silver.The S&P Oil and Gas Exploration and Production Index is comprised of stocks in the S&P Total Market Index that are classified in the GICS oil & gas exploration & production sub-industry.The NASDAQ Clean Edge Green Energy Index (CELS) is a modified market capitalization-weighted index designed to track the performance of companies that are primarily manufacturers, developers, distributors, or installers of clean-energy technologies. The Bangkok SET Index is a capitalization-weighted index of all the stocks traded on the Stock Exchange of Thailand.The Producer Price Index (PPI) measures prices received by producers at the first commercial sale. The index measures goods at three stages of production: finished, intermediate and crude.M2 Money Supply is a broad measure of money supply that includes M1 in addition to all time-related deposits, savings deposits, and non-institutional money-market funds.