Embed Size (px)
Citation preview
‘Go Forth and Multiply’The Politics of Religious Demography
Eric Kaufmann and Vegard Skirbekk
Outline
Religion determined by demography
Fertility
Migration
Cohort variation in affiliation/intensity
Implications
Religion and politics
Conclusion
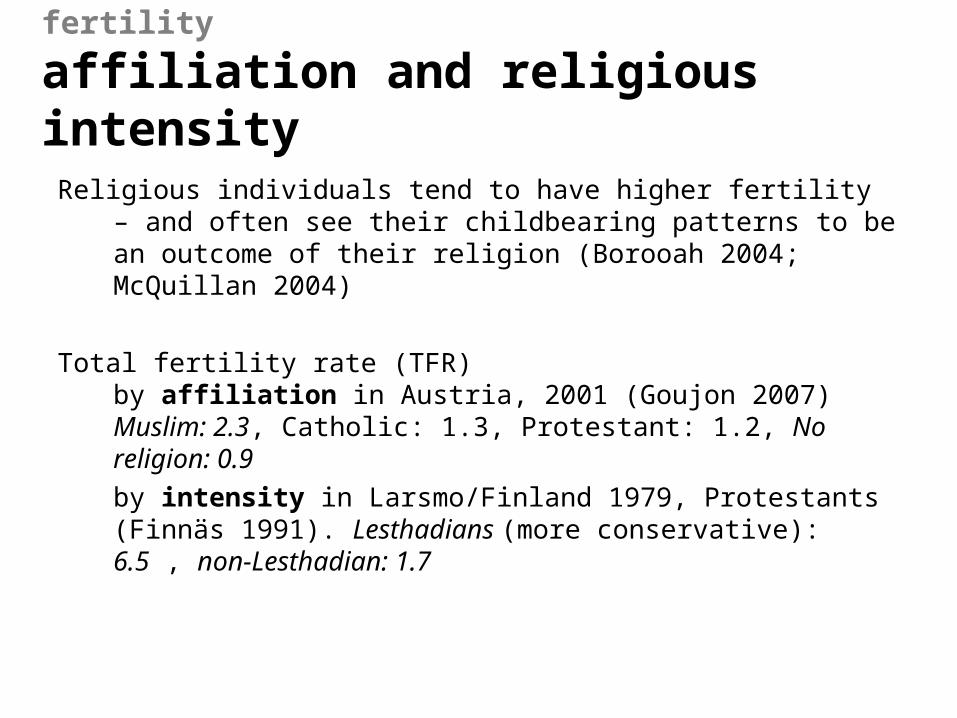
Religious individuals tend to have higher fertility – and often see their childbearing patterns to be an outcome of their religion (Borooah 2004; McQuillan 2004)
Total fertility rate (TFR) by affiliation in Austria, 2001 (Goujon 2007)Muslim: 2.3, Catholic: 1.3, Protestant: 1.2, No religion: 0.9
by intensity in Larsmo/Finland 1979, Protestants (Finnäs 1991). Lesthadians (more conservative): 6.5 , non-Lesthadian: 1.7
fertility
affiliation and religious intensity
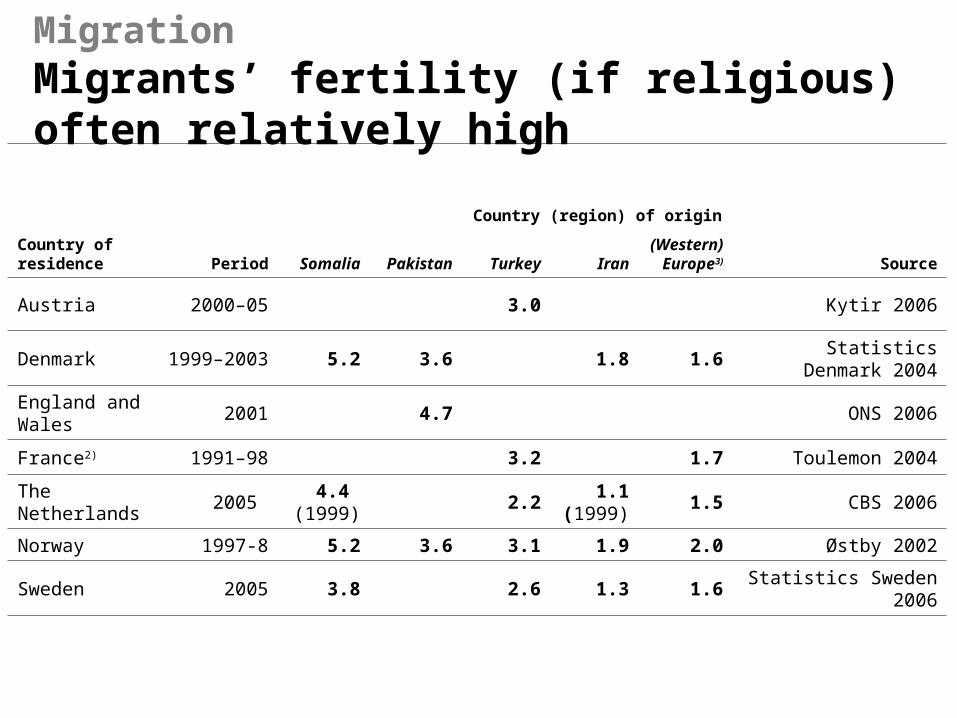
Country (region) of origin
Country of residence Period Somalia Pakistan Turkey Iran
(Western) Europe3) Source
Austria 2000–05 3.0 Kytir 2006
Denmark 1999–2003 5.2 3.6 1.8 1.6Statistics Denmark
2004
England and Wales
2001 4.7 ONS 2006
France2) 1991–98 3.2 1.7 Toulemon 2004
The Netherlands
2005 4.4
(1999)2.2
1.1(1999)
1.5 CBS 2006
Norway 1997-8 5.2 3.6 3.1 1.9 2.0 Østby 2002
Sweden 2005 3.8 2.6 1.3 1.6 Statistics Sweden 2006
Migration Migrants’ fertility (if religious) often relatively high
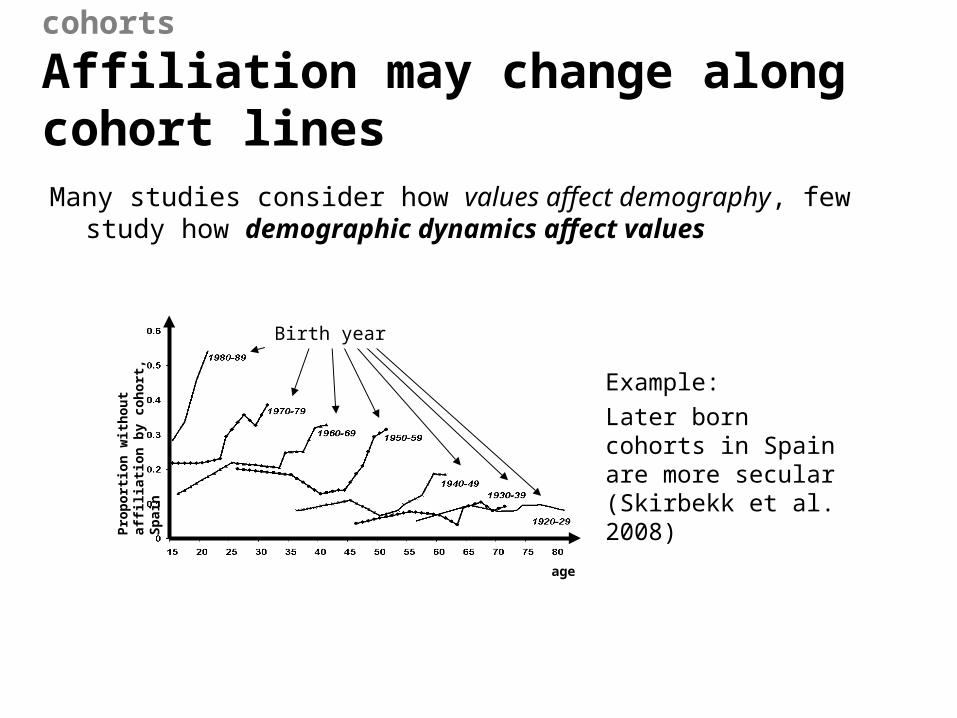
Many studies consider how values affect demography, few study how demographic dynamics affect values
cohorts
Affiliation may change along cohort lines
age
Pro
po
rtio
n w
ith
ou
t af
filia
tio
n b
y co
ho
rt, S
pai
n
Birth year
Example: Later born cohorts in Spain are more secular (Skirbekk et al. 2008)

projection methodology
Multi-state cohort-component projection
Time t + xTime t
A B AB
Male Female Male Female
age
Ageing A B AB
Mortality by status
Migration by status
Transitions by status
A B AB
Fertility differentials by status
Intergenerational transmission of status
A B AB
a
a + x

projecting beliefs European identityIn Science (2006) Lutz, Kritzinger and Skirbekk estimated and projected European identity as a function of cohort and age
Survey question: Do you see yourself as having some degree of European identity – as opposed to only national identity?
Data: Eurobarometer surveys for EU 15.
20
30
40
50
60
70
80
90
15-1
9
20-2
4
25-2
9
30-3
4
35-3
9
40-4
4
45-4
9
50-5
4
55-5
9
60-6
4
65-6
9
70-7
4
75-7
9
Age
Per
cen
t with
som
e de
gree
of E
urop
ean
Iden
tity
1996
2004
2030
Survey question: Do you see yourself as having some degree of European identity – as opposed to only national identity? Survey question: Do you see yourself as having some degree of European identity – as opposed to only national identity?
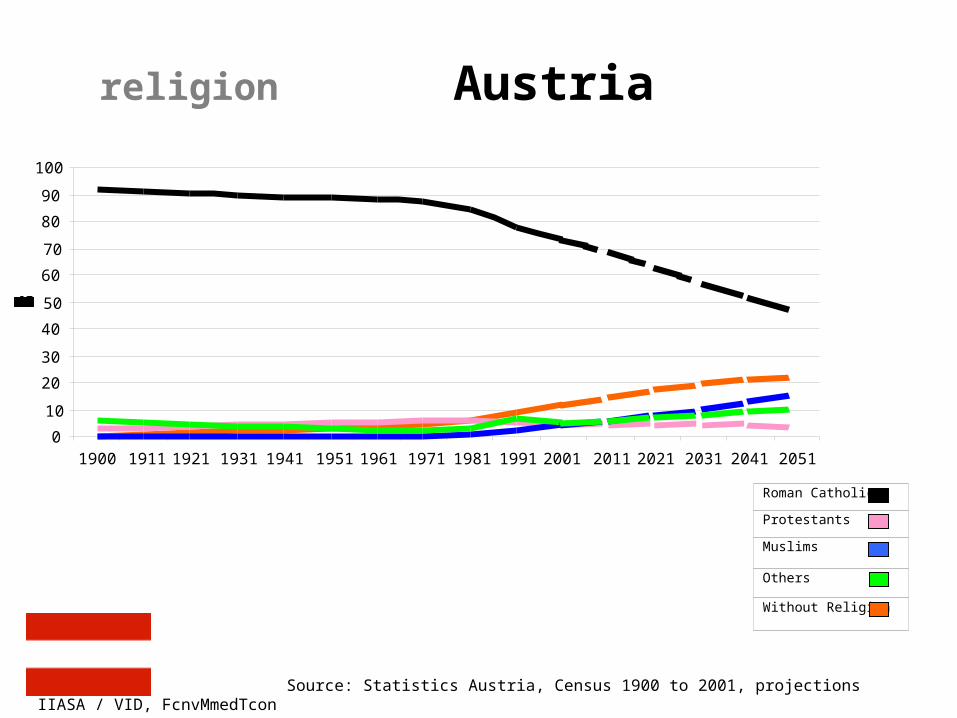
Source: Statistics Austria, Census 1900 to 2001, projections IIASA / VID, FcnvMmedTcon
Roman Catholics
Protestants
Muslims
Others
Without Religion
0
10
20
30
40
50
60
70
80
90
100
1900 1911 1921 1931 1941 1951 1961 1971 1981 1991 2001 2011 2021 2031 2041 2051
religion Austria
Religion and politics directly entwined through establishment or religious regulation (Iran)
But even if not, religion bears on politics through:• Electoral cleavages• Domestic policy (alcohol, school prayer, abortion, religious law)• Foreign Policy (alliances, conflict sacralization, missionary unilateralism)• Nongovernment actors (such as terrorism)
Near-majority of civil wars and terrorism now involves religion (Toft 2007; Philpott 2007)
religion Politics

Political Demography of ReligionShifts in Groups by Religious Tradition• Civilizational (i.e. Christianity, Islam, Hindu, Judaic)– affects IR and
can form the basis of domestic conflicts• Church/Sect (i.e. Lutheran, Shia, Pentecostal)– affects domestic
politics, but often has transnational effects
Shifts in Groups by Religious Intensity• Attendance, belief/theology (i.e. conservative/Orthodox vs.
liberal/modernist; regular v occasional attenders)
Why Now?A Demographic Revolution• Global demographic disparities + globalization = migration from
religious to secular regions• In developed world, values increasingly drive fertility
Sociological Change• Democratization makes population size important• Secularization in West, but:
– ‘Strict churches’: revival of conservative Islam, Pentecostalism
Net effect: direct & indirect conservative religious growth
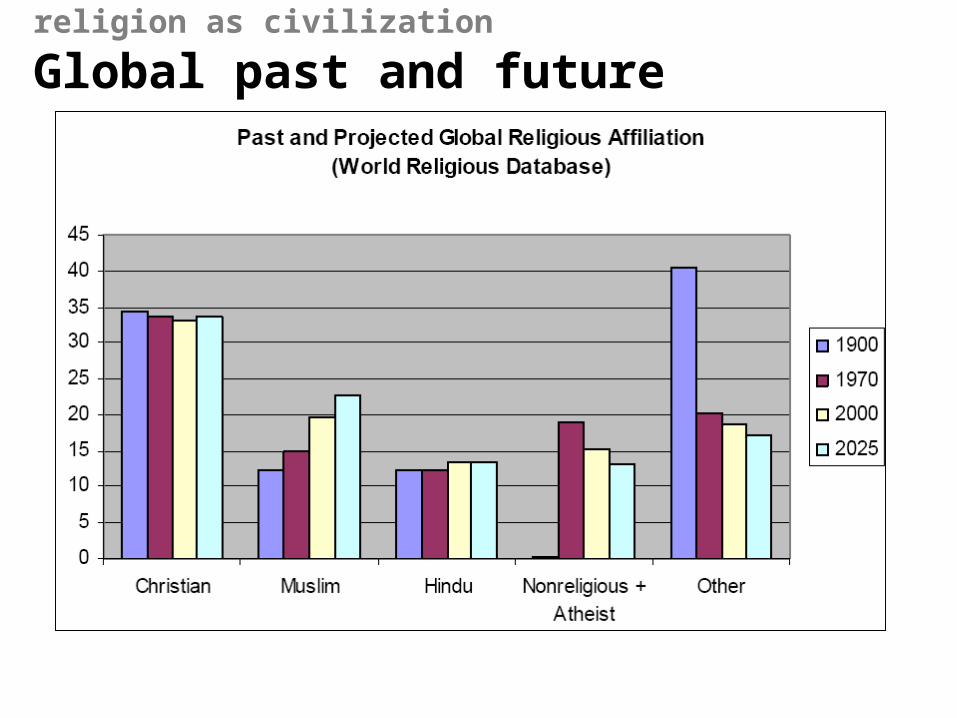
religion as civilization
Global past and future

Domestic religious affiliation
Catholic non-Hispanic
Catholic Hispanic
Hindu/Buddhist
Jewish
Muslim
No Religion
Other
Protestant Black
Protestant Funda-
mentalist
Protestant Liberal
Protestant Moderate
0%
2%
4%
6%
8%
10%
12%
14%
16%
18%
20%
2003 2008 2013 2018 2023 2028 2033 2038 2043
`

religious intensity
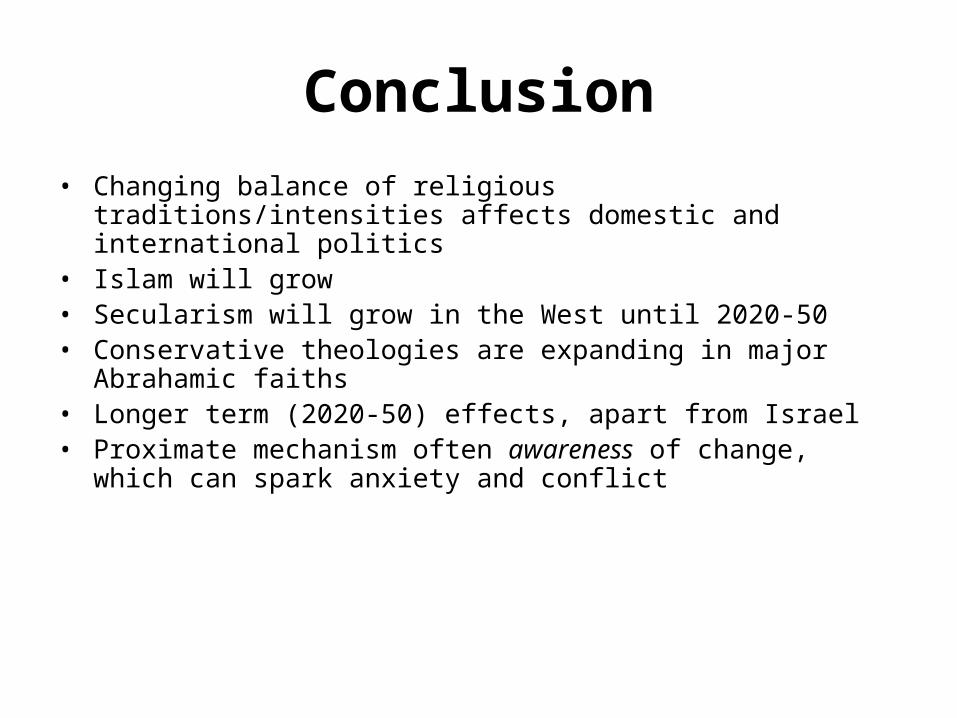
Conclusion
• Changing balance of religious traditions/intensities affects domestic and international politics
• Islam will grow• Secularism will grow in the West until 2020-50• Conservative theologies are expanding in major Abrahamic faiths• Longer term (2020-50) effects, apart from Israel• Proximate mechanism often awareness of change, which can spark
anxiety and conflict
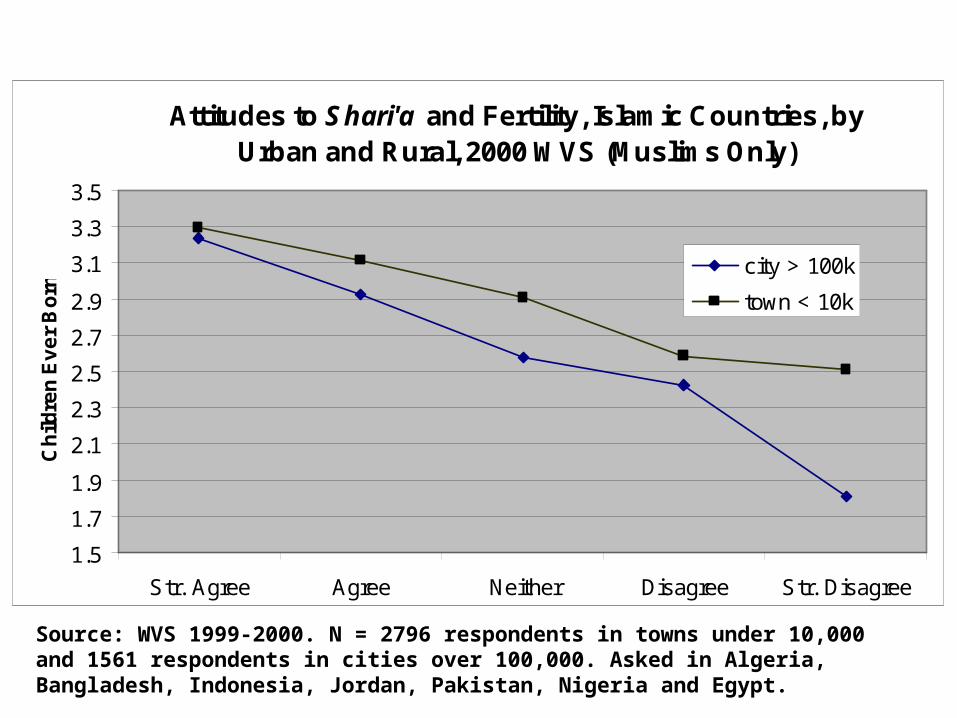
Attitudes to Shari'a and Fertility, Islamic Countries, by Urban and Rural, 2000 WVS (Muslims Only)
1.5
1.7
1.9
2.1
2.3
2.5
2.7
2.9
3.1
3.3
3.5
Str. Agree Agree Neither Disagree Str. Disagree
Ch
ildre
n E
ve
r B
orn
city > 100k
town < 10k
Source: WVS 1999-2000. N = 2796 respondents in towns under 10,000 and 1561 respondents in cities over 100,000. Asked in Algeria, Bangladesh, Indonesia, Jordan, Pakistan, Nigeria and Egypt.

coun
try
relig
tot fertility rate1.4048 7.1
.592294
.98574
Source: 2000 WVS and World Bank.
Religiosity and Fertility in Muslim Countries, 2000
Tanzania
Jordan
Egypt
Algeria
Bosnia
Iran
Azerbaijan
'95-97
Bangladesh
Albania 2000
Turkey
Indonesia
Pakistan
Morocco
Nigeria
Uganda
Albania '95-97

Thank you

Resident population
Protestant Fundamentalist
20.6%
Catholic non-Hispanic19.5%
Catholic Hispanic
8.1%
No Religion15.0%Protestant Black
9.7%
Muslim0.4%
Other4.1%
Hindu/Buddhist 0.9%
Protestant Moderate
9.5%
Protestant Liberal10.4%
Jewish1.7%
Net migrants
ProtestantFunda-
mentalist5%
Catholic non-
Hispanic10.3%
Catholic Hispanic34.8%
No Religion16.8%
Protestant Black0.8%
Muslim8.4%
Other12.9%
Hindu/Buddhist
9.6%
Protestant Moderate
0.7%
ProtestantLiberal0.7%
Jewish0.01%