Embed Size (px)
Citation preview
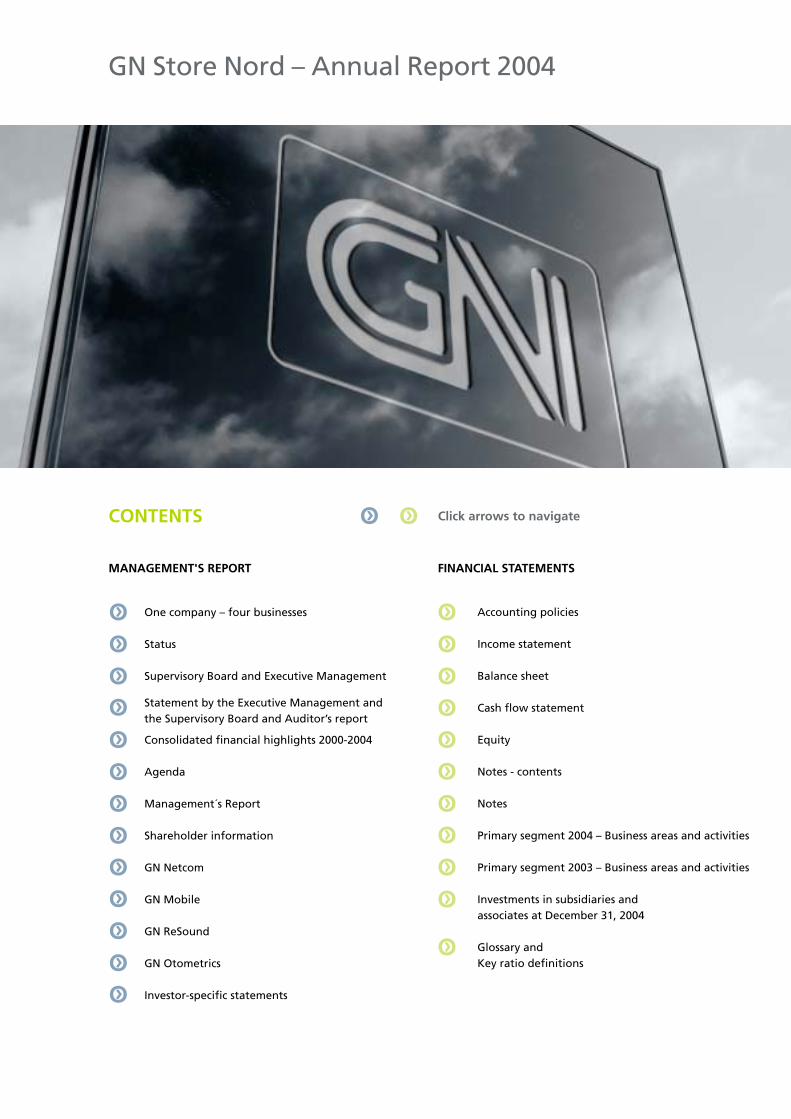
GN Store Nord – Annual Report 2004
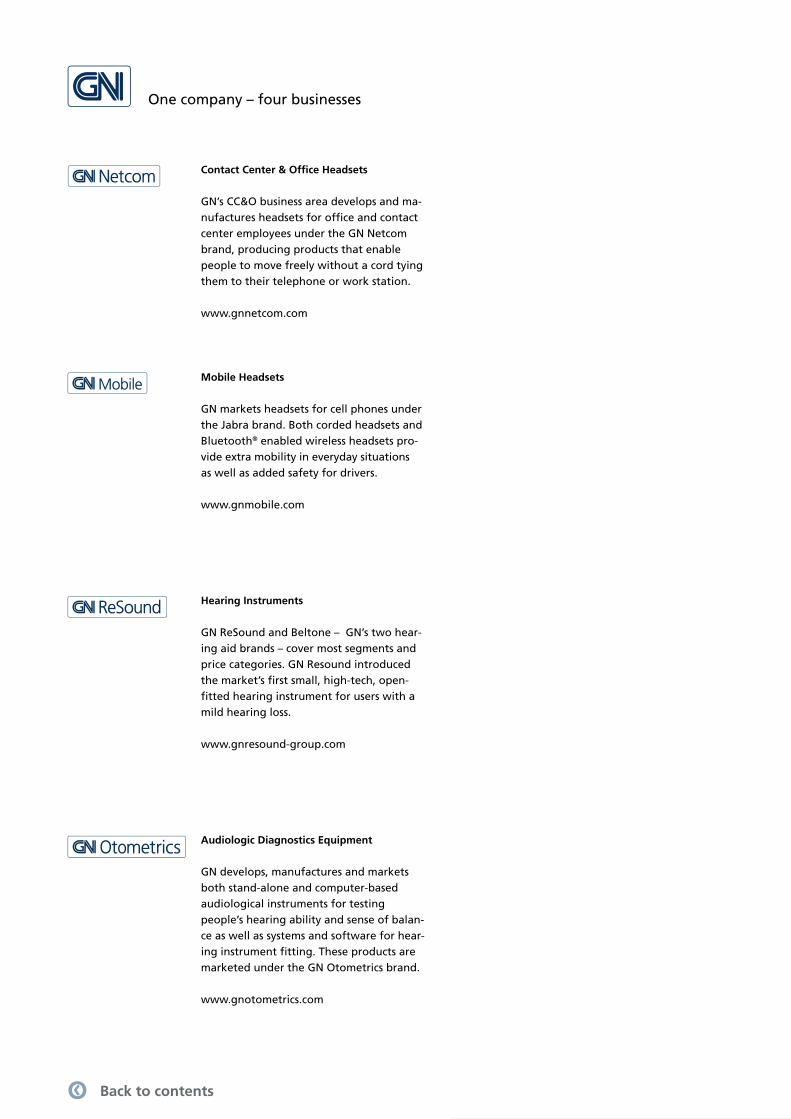
One company – four businesses
Status
Supervisory Board and Executive Management
Statement by the Executive Management and the Supervisory Board and Auditor’s report
Consolidated fi nancial highlights 2000-2004
Agenda
Management´s Report
Shareholder information
GN Netcom
GN Mobile GN ReSound GN Otometrics Investor-specifi c statements
Accounting policies
Income statement
Balance sheet Cash fl ow statement Equity
Notes - contents
Notes
Primary segment 2004 – Business areas and activities Primary segment 2003 – Business areas and activities Investments in subsidiaries andassociates at December 31, 2004
Glossary and Key ratio defi nitions
CONTENTS
MANAGEMENT'S REPORT FINANCIAL STATEMENTS
QQ Click arrows to navigateQQ
2 GN Store Nord – Annual Report 2004
One company – four businesses
Audiologic Diagnostics Equipment
GN develops, manufactures and markets both stand-alone and computer-based audio logical instruments for testing people’s hearing ability and sense of balan-ce as well as systems and software for hear-ing instrument fi tting. These products are marketed under the GN Otometrics brand.
www.gnotometrics.com
Contact Center & Offi ce Headsets
GN’s CC&O business area develops and ma-nufactures headsets for offi ce and contact center employees under the GN Netcom brand, producing products that enable people to move freely without a cord tying them to their telephone or work station.
www.gnnetcom.com
Mobile Headsets
GN markets headsets for cell phones under the Jabra brand. Both corded headsets and Bluetooth® enabled wireless headsets pro-vide extra mobility in everyday situations as well as added safety for drivers.
www.gnmobile.com
Hearing Instruments
GN ReSound and Beltone – GN’s two hear-ing aid brands – cover most segments and price categories. GN Resound introduced the market’s fi rst small, high-tech, open-fi tted hearing instrument for users with a mild hearing loss. www.gnresound-group.com
3 Status
4 Supervisory Board and Executive Management
5 Statement by the Executive Management and the Supervisory Board and Auditor’s report
6 Consolidated fi nancial highlights 2000-2004
7 Agenda
8 Management´s Report
11 GN 360º – operations and risk
17 Shareholder information
18 GN Netcom
19 GN Mobile
20 GN ReSound
21 GN Otometrics
22 Investor-specifi c statements
28 Accounting policies
33 Income statement
34 Balance sheet
36 Cash fl ow statement
37 Equity
38 Notes - contents
39 Notes
54 Primary segment 2004 – Business areas and activities
56 Primary segment 2003 – Business areas and activities
58 Investments in subsidiaries and associates at December 31, 2004
Contents
qq Back to contents
3
GN achieved many of the goals set for 2004. Having completed the extensive restructurings of production, distribution and local sales companies, GN now has a young product portfolio, an effi cient manufacturing setup, competitive innovation environments as well as sales and marketing departments all showing strong progress and a share price that has more than doubled over the past two years. GN resumed dividend payments after they had been suspended for two years.
Sales of wireless headsets continue to improve, and the offi ce segment has now outgrown GN’s original contact center market. At the same time, the performance in CC&O headsets has improved to such an extent that establishing strong distribution through the retail segment has now become a top priority. A stronger position in the retail segment combined with the launch of innovative headsets will give GN the best position from which to leverage on the growth in the offi ce market, as the growing proliferation of IP telephony is one of the factors driving demand for headsets.
Revenues in GN’s fastest growing business area, mobile headsets, have more than doubled in just one year, driven by large OEM orders from several of the world’s largest cell phone manufacturers and powerful Jabra products that have also been launched on selected Asian markets. GN remains the leading provider on the market, and has recently expanded into the mobile gaming business.
The overall profi tability of GN’s hearing instrument and audiologic diagnostics equipment businesses is now in line with the industry average, and the new open hearing instruments have also attracted younger users. Backed by ground-breaking new products, GN has deferred its innovative leadership, expanded the market for hearing instruments and won new market shares.
The relocation of parts of GN Otometrics’ production to China got off to a good start, and it will contribute to substantially stronger earnings from audiologic diagnostics equipment.
Stronger earnings and increasingly streamlined supply chains have strengthened the cash fl ow generation signifi cantly. The improvement has reduced net interest-bearing debt by more than two-thirds in less than 12 months. As a result, the Supervisory Board proposes to set up a share buy-back program in addition to paying dividends.
Investments in development and sales and marketing activities will increase substantially in order to gene-rate higher growth rates longer term. These investments will slow down the earnings growth in the short term, and in 2005 they will move earnings towards the second half-year.
As a result of the growth achieved, the greater number of employees working in development and the greater volume of headsets produced in-house, GN now employs more than 4,500 people. In line with the “one company – four businesses” approach, the Danish business units will relocate to a single new GN loca-tion. This will fuel knowledge sharing between business areas and provide further support for the positive development of GN.
The improvements in revenue and earnings are set to continue in 2005. GN is entering a new phase under the maxim of “Profi table Growth” and will strengthen the position in the markets for hearing instruments and headsets for contact centers and offi ces through new products and expanded marketing efforts on both existing and new markets.
Status
qq Back to contents
4 GN Store Nord – Annual Report 2004
SUPERVISORY BOARD AND EXECUTIVE MANAGEMENT
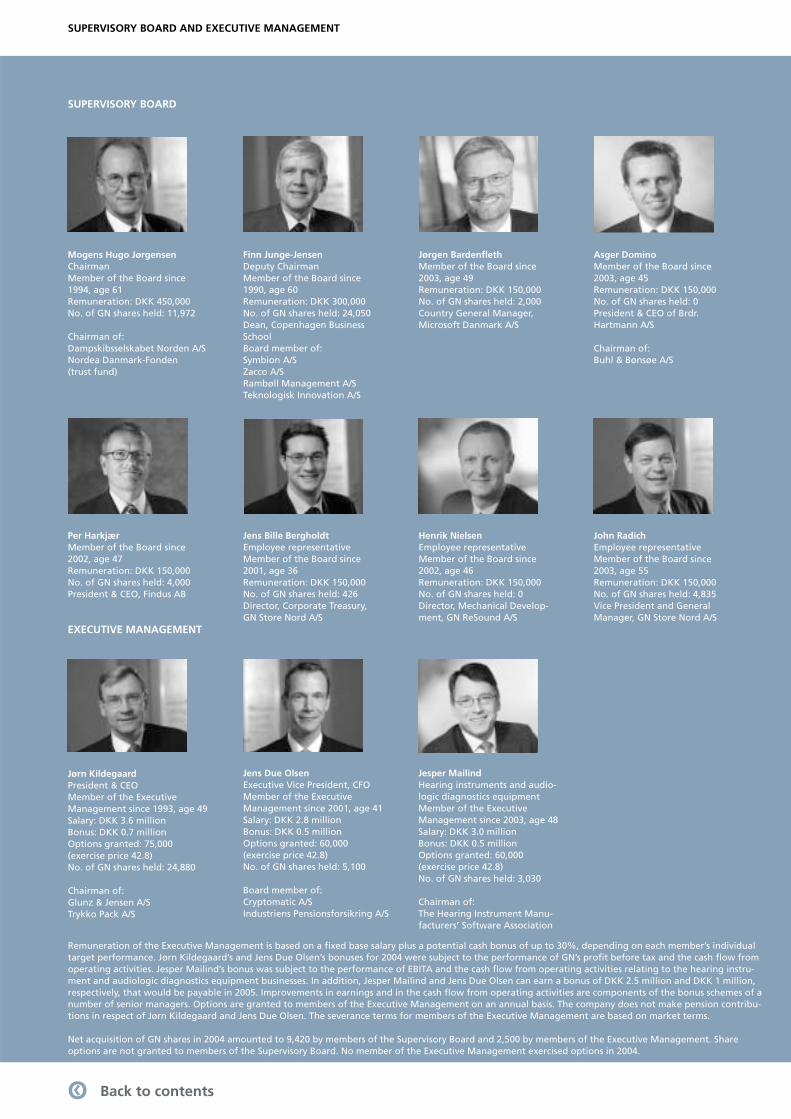
Jørn KildegaardPresident & CEOMember of the Executive Management since 1993, age 49Salary: DKK 3.6 millionBonus: DKK 0.7 millionOptions granted: 75,000 (exercise price 42.8)No. of GN shares held: 24,880
Chairman of:Glunz & Jensen A/STrykko Pack A/S
EXECUTIVE MANAGEMENT
Jens Due OlsenExecutive Vice President, CFOMember of the Executive Management since 2001, age 41Salary: DKK 2.8 millionBonus: DKK 0.5 millionOptions granted: 60,000 (exercise price 42.8)No. of GN shares held: 5,100
Board member of:Cryptomatic A/SIndustriens Pensionsforsikring A/S
Jesper MailindHearing instruments and audio-logic diagnostics equipmentMember of the Executive Management since 2003, age 48Salary: DKK 3.0 millionBonus: DKK 0.5 millionOptions granted: 60,000 (exercise price 42.8)No. of GN shares held: 3,030
Chairman of:The Hearing Instrument Manu-facturers’ Software Association
Remuneration of the Executive Management is based on a fi xed base salary plus a potential cash bonus of up to 30%, depending on each member’s individual target performance. Jørn Kildegaard’s and Jens Due Olsen’s bonuses for 2004 were subject to the performance of GN’s profi t before tax and the cash fl ow from operating activities. Jesper Mailind’s bonus was subject to the performance of EBITA and the cash fl ow from operating activities relating to the hearing instru-ment and audiologic diagnostics equipment businesses. In addition, Jesper Mailind and Jens Due Olsen can earn a bonus of DKK 2.5 million and DKK 1 million, respectively, that would be payable in 2005. Improvements in earnings and in the cash fl ow from operating activities are components of the bonus schemes of a number of senior managers. Options are granted to members of the Executive Management on an annual basis. The company does not make pension contribu-tions in respect of Jørn Kildegaard and Jens Due Olsen. The severance terms for members of the Executive Management are based on market terms.
Net acquisition of GN shares in 2004 amounted to 9,420 by members of the Supervisory Board and 2,500 by members of the Executive Management. Share options are not granted to members of the Supervisory Board. No member of the Executive Management exercised options in 2004.
SUPERVISORY BOARD
Mogens Hugo JørgensenChairmanMember of the Board since 1994, age 61Remuneration: DKK 450,000No. of GN shares held: 11,972
Chairman of:Dampskibsselskabet Norden A/SNordea Danmark-Fonden (trust fund)
Per HarkjærMember of the Board since 2002, age 47Remuneration: DKK 150,000No. of GN shares held: 4,000President & CEO, Findus AB
Asger DominoMember of the Board since 2003, age 45Remuneration: DKK 150,000No. of GN shares held: 0President & CEO of Brdr. Hartmann A/S
Chairman of:Buhl & Bønsøe A/S
John RadichEmployee representativeMember of the Board since 2003, age 55Remuneration: DKK 150,000No. of GN shares held: 4,835Vice President and General Manager, GN Store Nord A/S
Finn Junge-JensenDeputy ChairmanMember of the Board since 1990, age 60Remuneration: DKK 300,000No. of GN shares held: 24,050Dean, Copenhagen Business SchoolBoard member of:Symbion A/SZacco A/SRambøll Management A/STeknologisk Innovation A/S
Jens Bille BergholdtEmployee representativeMember of the Board since 2001, age 36Remuneration: DKK 150,000No. of GN shares held: 426Director, Corporate Treasury,GN Store Nord A/S
Jørgen Bardenfl ethMember of the Board since 2003, age 49Remuneration: DKK 150,000No. of GN shares held: 2,000Country General Manager, Microsoft Danmark A/S
Henrik NielsenEmployee representativeMember of the Board since 2002, age 46Remuneration: DKK 150,000No. of GN shares held: 0Director, Mechanical Develop-ment, GN ReSound A/S
qq Back to contents
5GN Store Nord – Annual Report 2004
STATEMENT BY THE EXECUTIVE MANAGEMENT AND THE SUPERVISORY BOARD
The Executive Management and the Supervisory Board have today discussed and adopted the annual report for 2004 of GN Store Nord A/S. The annual report has been prepared in accordance with International Financial Reporting Standards (IFRS) and additional Danish fi nancial re-porting requirements for listed companies. We consider the accounting policies used to be appropriate. Accordingly, the annual report gives a true and fair view of the Group’s and the parent company’s financial position at December 31, 2004 as well as of the results of the Group’s and the parent company’s operations and cash flows for 2004.
We recommend that the annual report be approved at the annual general meeting.
Høje-Taastrup, February 21, 2005
Executive Management:
Jørn Kildegaard Jens Due Olsen Jesper MailindPresident & CEO
Supervisory Board
Mogens Hugo Jørgensen Finn Junge-Jensen Jørgen Bardenfl eth Asger Domino Chairman Deputy Chairman Per Harkjær Jens Bille Bergholdt Henrik Nielsen John Radich
AUDITORS’ REPORT
To the shareholders of GN Store Nord A/S
We audited the annual report of GN Store Nord A/S for the financial year January 1-December 31, 2004, prepared in accordance with Inter-national Financial Reporting Standards (IFRS) and additional Danish fi nancial reporting requirements for listed companies. The annual report is the responsibility of the Company’s Executive Management and the Supervisory Board. Our responsibility is on the basis of our audit to express an opinion on the annual report.
Basis of opinion
We conducted our audit in accordance with Danish Auditing Standards. Those standards require that we plan and perform the audit to obtain reasonable assurance that the annual report is free of material misstatement. An audit includes examining, on a test basis, evidence supporting the amounts and disclosures in the annual report. An audit also includes assessing the accounting policies used and signifi cant estimates made by the Executive Management and the Supervisory Board, as well as evaluating the overall annual report presentation. We believe that our au-dit provides a reasonable basis for our opinion. Our audit did not result in any qualification.
Opinion
In our opinion, the annual report gives a true and fair view of the Group’s and the parent company’s financial position at December 31, 2004 and of the results of the Group’s and the parent company’s operations and cash flows for the financial year January 1-December 31, 2004 in accordance with International Financial Reporting Standards (IFRS) and additional Danish fi nancial reporting requirements for listed companies.
Copenhagen, February 21, 2005
KPMG C.Jespersen Deloitte
Statsautoriseret Revisionsinteressentskab Statsautoriseret Revisionsaktieselskab
Kurt Gimsing Michael Sten Larsen Erik Holst Jørgensen Jørgen Holm AndersenState Authorised State Authorised State Authorised State AuthorisedPublic Accountant Public Accountant Public Accountant Public Accountant
STATEMENT BY THE EXECUTIVE MANAGEMENT AND THE SUPERVISORY BOARD AND AUDITORS’ REPORT
qq Back to contents
6 GN Store Nord – Annual Report 2004
Earnings – Income statement in accordance with International Financial Reporting Standards (IFRS)Revenue 7,003 7,319 5,512 4,742 5,548 Operating profi t (loss) before share of profi t (loss) in subsidiaries and associates 144 (9,619) (4,714) 90 502 Operating profi t (loss) 138 (9,624) (4,747) 86 530 Profi t (loss) from ordinary activities before tax 13,004 (9,642) (5,289) 263 532 Profi t (loss) for the year 12,697 (9,176) (5,114) 250 504 Profi t (loss) for the year excluding amortization and impairment of goodwill and other intangible assets acquired in company acquisitions 13,212 137 (2,194) 569 729 Earnings – Investor-specifi c highlights Earnings before depreciation, amortization, impairment and restructurings and items of a non-recurring nature (EBITDA) 1,076 420 (997) 670 861 Earnings before amortization and impairment of goodwill and other intangible assets acquired in company acquisitions and restructurings and items of a non-recurring nature (EBITA) 795 198 (1,204) 549 727 Balance sheet Share capital (GN Store Nord A/S) 879 879 879 879 879 Equity 19,698 10,708 4,789 4,473 4,627 Total assets 23,809 15,023 7,938 6,597 6,106 Net interest bearing debt 488 (817) (1,243) (784) (245) Cash fl ows Cash fl ows from operating activities 41 (65) 241 827 959 Cash fl ows from investing activities (741) (1,065) (704) (358) (273)Total cash fl ows from operating and investing activities (700) (1,130) (463) 469 686 Development costs Development costs incurred for the period 536 696 625 264 306 Restructuring costs Restructuring recognised in income statement 89 393 374 140 - Restructurings, paid 192 184 321 147 40 Investments Plant and machinery etc. 265 267 147 105 121 Real property including leasehold improvements 44 137 50 47 99 Development projects, developed in-house 291 443 377 132 142 Other intangible assets excluding goodwill 45 92 67 38 41 Total (excluding company acquisitions) 645 939 641 322 403 Company acquisitions 14,258 184 21 - - Acquisition of associates 77 147 21 26 - Total investments 14,980 1,270 683 348 403 Depreciation and impairment of property, plant and equipment and amortization of intangible assets 792 1,264 987 565 473 Impairment of intangible assets 124 8,509 2,991 - - Key ratios Parent company pay-out ratio 15.0 % 0.0 % 0.0 % 15.0 % 15.0 %Dividend per DKK 4 share (in Danish kroner) 0.60 0.00 0.00 0.60 0.60EBITA margin 11.4 % 2.7 % (21.8)% 11.6 % 13.1 %Return on invested capital (EBITA) 5.5 % 1.1 % (11.9)% 8.5 % 12.8 %Return on equity 111.4 % (60.4)% (66.0)% 5.4 % 11.1 %Equity ratio 82.7 % 71.3 % 60.3 % 67.8 % 75.8 % Key ratios per share Earnings per share (EPS) 65.85 (43.47) (24.20) 1.19 2.38 Earnings per share. fully diluted (EPS) 65.85 (43.47) (24.20) 1.18 2.36 Earnings per share excluding amortization and impairment of intangible assets and restructurings. etc. (EPS) 69.29 3.04 (7.59) 3.36 3.45 Earnings per share excluding amortization and impairment of intangible assets and restructurings. etc.. fully diluted (EPS) 69.29 3.04 (7.59) 3.35 3.42 Cash fl ow from operating activities per share (CFPS) 0.21 (0.31) 1.14 3.90 4.50 Net asset value per DKK 4 share 93 51 23 21 22 Share price at the end of the period 141 50 21 38 59 Employees Average number 5,162 6,213 5,475 4,343 4,640
*) Including NetTest
CONSOLIDATED FINANCIAL HIGHLIGHTS 2000-2004
DKK millions 2000* 2001* 2002* 2003 2004
qq Back to contents
7GN Store Nord – Annual Report 2004
GN Store Nord has been helping people connect since 1869. Initially as a telegraph company and now as a manufacturer of headsets, hearing instruments and audiologic diagnostics equipment providing users with increased mobility and quality of life. GN products are marketed globally.
GN markets its headsets for the contact center and offi ce (CC&O) market under the GN Netcom brand, and headsets for cell phones under the Jabra brand. GN hearing aids are sold under the GN ReSound and the Beltone brands. GN Otometrics is GN’s brand for audiologic diagnostics equipment.
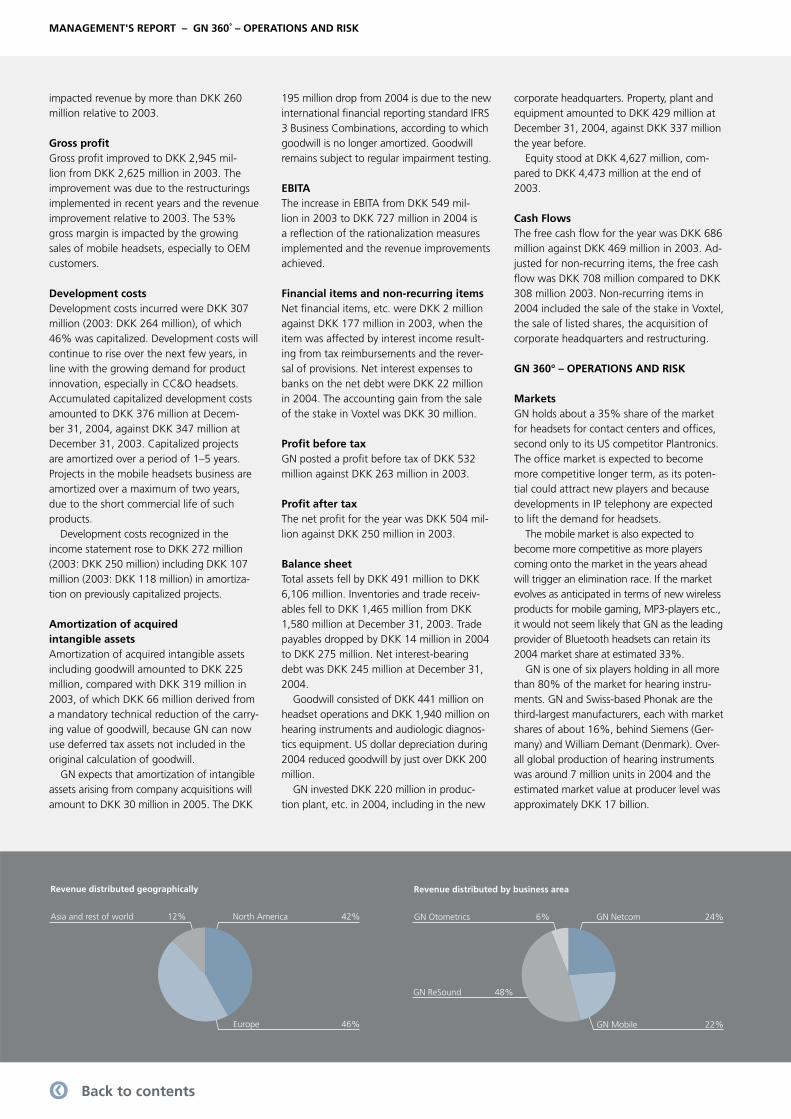
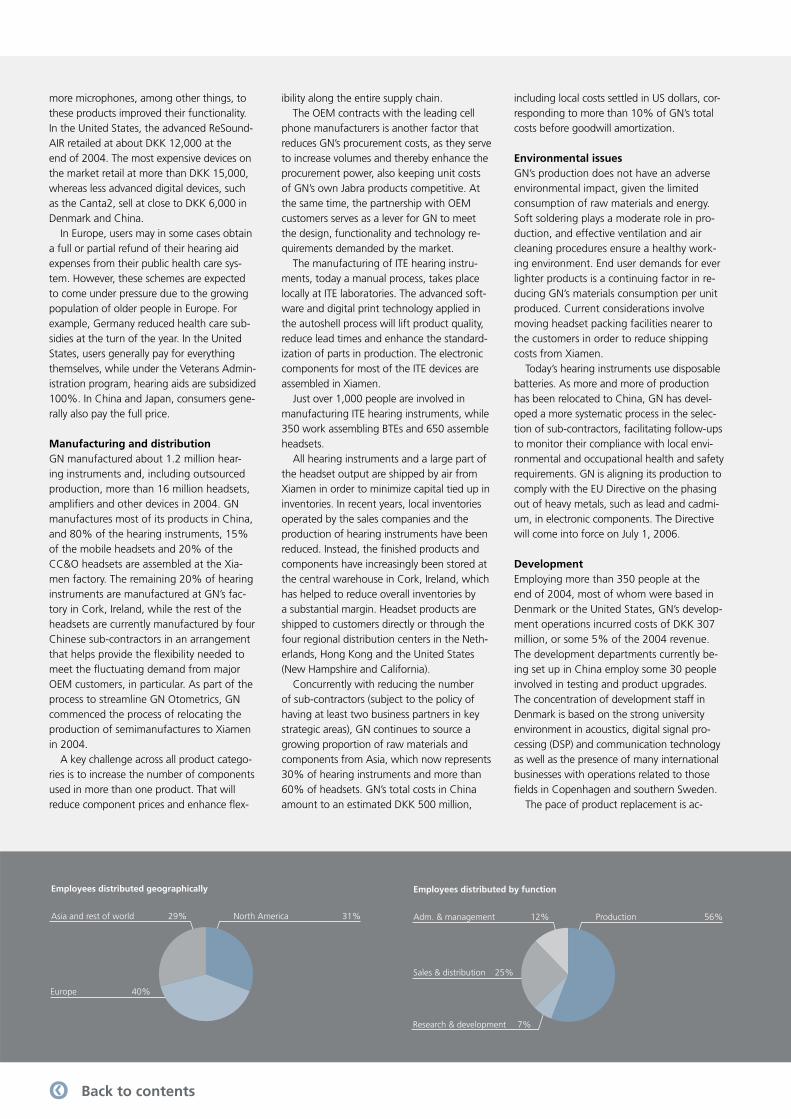
GN’s manufacturing is based mainly in China, and revenues are generated almost exclusively outside Denmark. North America is the largest single market. Of GN’s more than 4,500 employees, 3,700 are employ ed outside Denmark, and China is the largest country of operation.
GN is listed on the Copenhagen Stock Exchange and is a component of the KFX-index. The company has some 40,000 registered shareholders, who hold 70% of the share capital, and foreign ownership in the company is estimated at more than 50%.
Mission
As an international market leader, GN aims to generate a competitive return for its shareholders by developing, manufacturing and marketing innovative solutions for personal communication, offering users increased mobility and quality of life, and helping our employees respond to challenges and develop responsibility in an environment that combines advanced technology with global sales.
Goals
GN’s goals for the 2005-2007 period are• to expand the position as a leading manufacturer of headsets for offi ces• to remain the leading provider of wireless products for cell phones and similar products • to consolidate our position among the most profi table hearing instrument manufacturers• to generate satisfactory earnings from audiologic diagnostics equipment• to retain our innovative leadership• to ensure that the GN share price refl ects truly and fairly the company’s results and strategic potential.
Means
In the 2005-2007 period, GN plans• to increase the volume of offi ce headsets sold through the retail segment• to strengthen the Jabra brand and build a substantial position in mobile gaming• to expand GN ReSound’s and Beltone’s market shares• to expand the Beltone dispenser network in the United States• to launch new products and solutions at short intervals• to improve in-house processes and utilize the new shared IT platform for greater effi ciencies• achieve synergies, improve supply chains and keep working capital at a minimum• to provide performance-related compensation and to help employees and the management develop their potential.
Agenda
AGENDA
qq Back to contents
8 GN Store Nord – Annual Report 2004
Profi t before tax doubled to DKK 532 million
Q4 2004Revenue was DKK 1,477 million against DKK 1,311 million in Q4 2003. The Q4 per-formance was driven by underlying growth, but also by weaker-than-expected headset sales during the Christmas season on several core markets. OEM revenue dropped in line with expectations. On the other hand, sales of CC&O headsets and hearing instruments outperformed expectations for the quarter, and GN generated more than 17% organic growth overall relative to Q4 2003.
The fi nancial performance of the audio-logic diagnostics equipment business was impacted by the consolidation of the develop-ment activities in Denmark and the United States, which was one of a number of steps taken to achieve the necessary earnings im-provement in GN Otometrics.
As part of the efforts to create one GN and reap the resulting organizational and fi nancial benefi ts, GN acquired a property in the Co-penhagen suburb of Ballerup in December at a price of DKK 75 million. After the building has been renovated, the company expects to begin relocating close to 750 people from the current sites in Taastrup and Ballerup to the new facilities in the second half of 2005. The move is expected to be fi nished in 2006. A DKK 30 million provision has been made for rental obligations for leases being vacated.
GN sold its ownership interest in Moldovan mobile operator Voxtel in the fourth quarter at a price of DKK 78 million plus earn-out payments of up to DKK 48 million. The sale produced an accounting gain of DKK 30 mil-lion. The stake was divested as part of GN’s strategy to focus on headsets, hearing instru-ments and audiologic diagnostics equipment.
The combined EBITA margin from hearing instruments and audiologic diagnostics equip-ment was 20.3%, which means that GN has successfully eliminated the margin gap to the competition. Since 1999/2000, when GN acquired four hearing instrument businesses
and four audiologic diagnostics equipment manufacturers, the company has lifted the EBITA margin of these businesses by almost 11 percentage points from 6.5% for the full year 2000.
EBITA was DKK 193 million (EBITA margin of 13.1%) against DKK 186 million (14.2%) in Q4 2003, which was boosted by new product launches.
Inventories and trade receivables fell by DKK 241 million during the quarter to DKK 1,465 million from DKK 1,580 million at De-cember 31, 2003. Trade payables were DKK 275 million, as compared to DKK 343 million at September 30, 2004 and DKK 289 million at December 31, 2003.
The Q4 cash fl ows from operating activities improved to DKK 113 million in the CC&O and mobile headsets businesses from DKK 33 million in Q4 2003, and to DKK 244 million in the hearing instruments and audiologic di-agnostics equipment businesses from DKK 83 million in Q4 2003.
Overall cash fl ows from operating activi-ties were DKK 357 million against DKK 477 million in Q4 2003. Adjusted for non-recur-ring items, the free cash fl ow was DKK 275 million, an increase of DKK 174 million from Q4 2003.
Full year 2004EBITA for the year was DKK 727 million, in line with the guidance provided on Decem-ber 21, 2004, and ahead of the original forecast for the year of an EBITA increase of at least 20% from DKK 549 million in 2003. The DKK 178 million improvement relative to 2003 makes a satisfactory performance. The improvement includes provisions for rental obligations of DKK 30 million related to the consolidation of the four Danish operating units.
The revenue for the year of DKK 5,548 mil-lion was some DKK 800 million ahead of the original forecast, due to the surge in the sale
MANAGEMENT'S REPORT – FULL YEAR 2004
of mobile headsets to OEM customers. De-mand from this customer group is extremely diffi cult to predict.
New products and product variants launched in 2003 and 2004 accounted for about 60% of revenue, supported by several successful product launches and the growing contribution from mobile headsets.
Profi t before tax was DKK 532 million (2003: DKK 263 million), DKK 150 million higher than the guidance provided on Febru-ary 26, 2004, and lifted by the extra earnings from greater-than-expected revenue and the gain from the sale of the stake in Voxtel.
GN posted a profi t after tax of DKK 504 million, compared to DKK 250 million in 2003.
At December 31, 2004, net interest-bearing debt was DKK 245 million against DKK 784 million a year earlier.
Cash fl ows from operating activities im-proved to DKK 310 million in the headsets businesses from DKK 72 million in 2003, and to DKK 615 million in the hearing instruments and audiologic diagnostics equipment busi-nesses from DKK 377 million in 2003.
Overall cash fl ows from operating activities rose to DKK 959 million from DKK 827 mil-lion in 2003. When adjusted for non-recurring items, especially those recognized in 2003, this marks a substantial improvement of DKK 359 million. The free cash fl ow adjusted for non-recurring items rose by DKK 400 million to DKK 708 million.
The profi t enhancement, the anticipated improvement of GN’s cash fl ow generation and the forecast for 2005 have motivated the Supervisory Board to propose a DKK 400 mil-lion market value share buy-back program in addition to declaring a dividend of DKK 0.6 per share in respect of the fi nancial year.
CC&O boosting earnings by a wide marginIn 2004, headsets for the offi ce segment are estimated to have outsold headsets for the contact center market for the fi rst time ever.
qq Back to contents
9GN Store Nord – Annual Report 2004
tion of ITE production based on digital print technology will among other initiatives con-stitute the foundation for improved hearing instrument profi tability in the years ahead. Backed by the improved performance and the completed restructuring, GN is now gradually refocusing on growth by once more expanding the sales force and moving onto new markets.
The rationalization of the North American ITE production completes an extensive four-year restructuring of GN’s entire manufactur-ing setup. The process involved more than 2,000 jobs, which have been closed down and moved elsewhere; many of them to an-other country or another continent.
GN won market share in the fi rst half of the year, thanks to the successful 2003 launches of the ReSoundAIR and the Canta7/Open, but product launches from the competition affect-ed the second-half year performance. The new open solutions have strengthened GN’s position in the high-end segment. In the sec-ond half of the year, GN escalated the market-ing efforts of less advanced, low-priced hear-ing instruments, which attract the strongest demand in terms of units sold.
The EBITA margin was 19.8% in 2004.
Streamlining audiologic diagnostics equipmentThe improved profi tability from hearing instru-ments and the new management appointed to GN Otometrics has freed resources that have been reallocated towards achieving the earnings improvement needed in the audio-logic diagnostics equipment business. The company’s new management has launched a number of initiatives that combined with a less comprehensive product portfolio and the relocation to China of part of the produc-tion will make the business less complex and reduce cost levels. The MADSEN OTOfl ex 100, the fi rst advanced product based on the new technology platform, has now been launched on all major markets.
GN Otometrics generated a small EBITA loss in 2004.
The performance was driven by the develop-ment of dedicated wireless headset solutions such as the GN 9120, which has become GN’s best-selling CC&O product ever since it was launched in February 2003. Wireless products and the growing interest for IP tele-phony are expected to be the key drivers, as a substantial market for headsets for offi ces unfolds. Revenue from wireless headsets amounted to DKK 408 million (2003: DKK 358 million).
Demand for CC&O headsets gained mo-mentum as the year progressed; initially in Europe, then in the US and then in Europe once more towards the end of the year. In the United States, demand is increasingly focused on offi ce products sold through retail chains, and GN is now building a position in this seg-ment through new partnerships and products designed for the offi ce market.
The CC&O headsets business generated an EBITA margin of 19.5% in 2004.
Jabra launched in Asia and Bluetooth position maintainedGN’s entire 2004 headset output was manu-factured in China, with a growing in-house contribution from the Xiamen factory, whose some 1,000 employees make it GN’s largest workplace.
The global market for wireless headsets for cell phones expanded by almost 400% relative to 2003 to an estimated 15-18 mil-lion units in 2004. As expected the strong growth continued to attract new players, and the market became more competitive during the year.
The mobile headsets business boosted rev-enue by almost 150%, driven by strong de-mand for both Jabra and OEM headsets, with the latter category contributing more than 40% of revenue, as had been expected. Sales to OEM customers are extremely diffi cult to predict and they fl uctuate widely during the year. The revenue improvement was also due to strong demand for the new corded headsets launched towards the end of 2003. GN further expanded the headset platform
in February 2005, concluding an agreement with yet another signifi cant cell phone manu-facturer and developing new products for an existing OEM customer.
In order to consolidate the position as the leading international provider of Bluetooth headsets, GN initiated the plans to establish the brand in China, Singapore, South Korea and Japan at the start of the year. However, these markets proved to be less mature than initially expected, and revenue generated was only DKK 20 million. However, once consumer interest for headsets takes off, sales are expected to reach signifi cant proportions, as Asia currently is one of the world’s largest markets for cell phones. It appears that none of the competitors have gained an early lead on GN in the Asian markets.
In early 2005, GN signed an agreement to develop accessories for Nokia’s N-Gage Divi-sion. The agreement marks GN’s fi rst venture onto the mobile gaming market, which is ex-pected to see surging demand for Bluetooth products.
The mobile headsets business generated an EBITA of DKK 20 million, boosted by a sub-stantially higher revenue than was originally expected. Top priority remains to grow revenue and increase the awareness of the Jabra brand: having a strong international presence in the short term is a requirement for generating sat-isfactory earnings in the long term.
Margins on hearing instruments and diagnostics equipment rose to the industry average in the fourth quarterBacked by the completed restructurings, the hearing instruments and audiologic di-agnostics equipment businesses improved their overall profi t margin during the year to 17.3% from 14.7% in 2003.
Hearing instrument operations sharpening the focus on growthBy mid-February 2005, most of the North American digital ITE-device production had been moved to Minneapolis. A narrowed product portfolio and the increased automa-
qq Back to contents
10 GN Store Nord – Annual Report 2004
Higher margins set to improve the cash fl owThe working capital tied up in inventories, trade payables and trade receivables did not increase in 2004 in spite of the higher revenue and the substantially greater vol-umes sold. The improvement was due to the improved interaction between the sales units and production, which led to competitive turnover rates, greater component reuse and the successful running-in of a new headset distribution center in the Netherlands.
The cash fl ow from operating activities im-proved by DKK 359 million to DKK 999 mil-lion when adjusted for non-recurring items.This was highly satisfactory. As the shared IT platform, Navision Attain, is gradually imple-mented, processes and routines will become more effi cient, not least the working capital management.
Expanding the use of share optionsConsidering GN’s international expansion and its many employees based outside Denmark, especially in the United States, the Super-visory Board has resolved in 2005 to increase the use of options by up to 50%. In 2004, 79 individuals were granted options at a total Black-Scholes value of DKK 15 million, equal to about 15% of their aggregate compensa-tion.
OUTLOOK FOR 2005
Improvements set to continue in 2005With the major restructurings of GN’s manu-facturing setup, development activities and sales units now completed, the effects of the ongoing structural improvement on GN’s profi tability will gradually wear off. Going forward, seasonal earnings fl uctuations will become more pronounced, with most of the profi t being generated in the second half of the year.
The effect will grow stronger in 2005, due to strengthened marketing efforts on the markets for offi ce headsets and hearing instruments supporting the greater priority
given to profi table revenue growth. GN plans to increase investment in development opera-tions in order to strengthen long-term growth opportunities. Overall, marketing and devel-opment costs will increase by up to DKK 150 million relative to 2004.
GN expects a revenue increase of 3% to at least DKK 5.7 billion and an EBITA of DKK 800-850 million assuming a Danish kroner/US dollar exchange rate of 5.75.
The CC&O headsets business projects a full-year EBITA margin of 19-21% on rev-enue of at least DKK 1.4 billion, equal to an organic growth of almost 10%. The growth initiatives implemented will dampen earnings growth short term.
The mobile headsets business expects an EBITA margin of 1-3% on revenue of at least DKK 1.3 billion. The extremely-diffi cult-to-predict OEM sales are assumed to account for 25% of revenue. Revenue growth continues to take top priority in the mobile headsets busi-ness. Accordingly, GN will continue to invest globally in improving awareness of the Jabra brand and in expanding the organization.
The hearing instruments business projects an EBITA margin of 20-22% on revenue of approximately DKK 2.7 billion, equal to almost 4% organic growth. In the fi rst half-year, revenue will be affected by new prod-ucts launched by competitors in 2004 and in early 2005.
The audiologic diagnostics equipment business projects a moderate EBITA profi t on revenue of approximately DKK 350 million, corresponding to an unchanged level of busi-ness activity. The rationalization steps taken in respect of GN Otometrics will have a negative impact on 2005 profi ts.
Group functions and GN Great Northern Telegraph Company are expected to impact EBITA by DKK (50) million. In addition, GN will incur non-allocated costs of approximately DKK 20 million in relation to the new corpo-rate headquarters. This amount includes the already announced accelerated DKK 10 mil-lion amortization of leasehold improvements at vacated premises. No decision has yet been
made on the fi nal design of the property or about the renovation and building extension as may prove necessary.
Amortization of intangible assets acquired through company acquisitions is expected to amount to DKK 30 million under the provi-sions of IFRS 3 Business Combinations, which takes effect from the 2005 fi nancial year. Un-der the previous policies, amortization would have amounted to DKK 230 million, includ-ing amortization of acquired goodwill. Net fi nancial expenses are projected to amount to approximately DKK 40 million, including the impact of the share buy-back program planned for the second quarter.
Investments in property, plant and equip-ment and in intangible assets including devel-opment projects are projected to be DKK 375 million, not including additional investment in the new corporate headquarters.
Profi t before tax is expected to improve to DKK 725-775 million from DKK 532 million in 2004.
With approximately half of GN’s revenue and about 60% of costs generated in USD or USD-related currencies, including CNY, GN’s long-term industrial competitiveness and its EBITA are resilient to likely US dollar fl uctuations.
Events after the balance sheet dateGN expanding into mobile gaming (An-nouncement No. 1/2005 of January 17, 2005). GN has signed an agreement with Nokia’s N-Gage Division to develop and mar-ket accessories for N-Gage game decks.
Financial reviewThe items of the investor-specifi c statements are reviewed below.
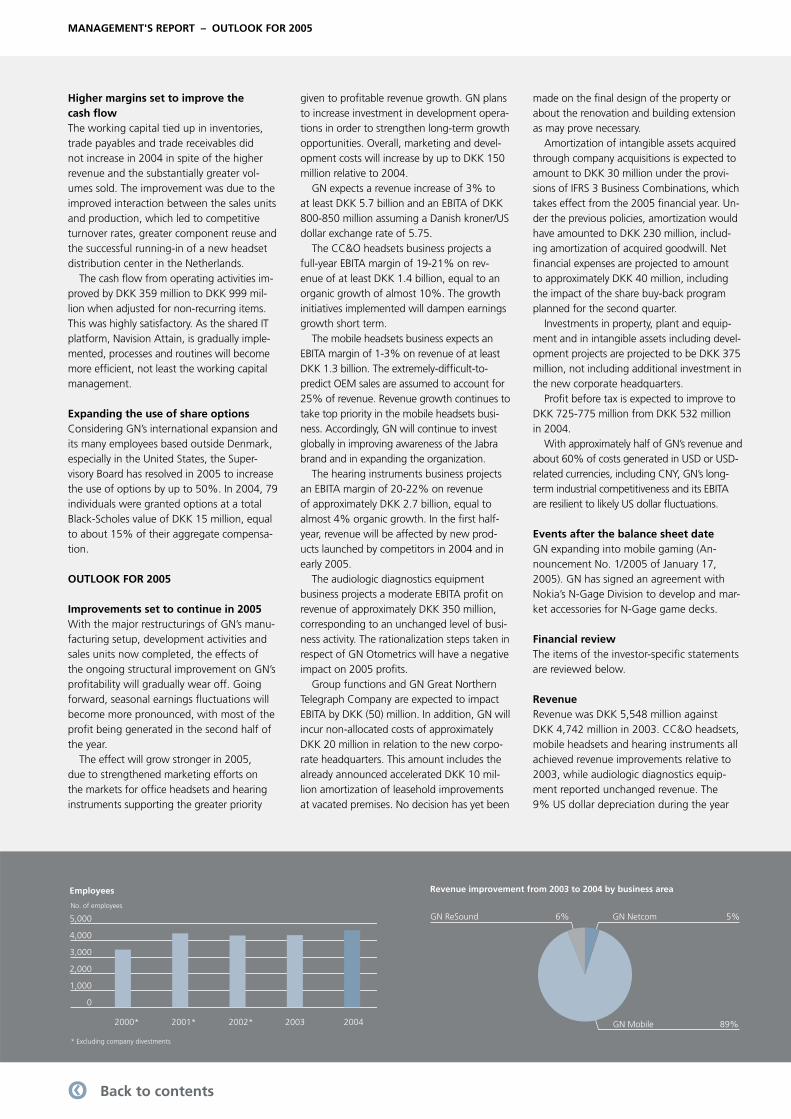
RevenueRevenue was DKK 5,548 million against DKK 4,742 million in 2003. CC&O headsets, mobile headsets and hearing instruments all achieved revenue improvements relative to 2003, while audiologic diagnostics equip-ment reported unchanged revenue. The 9% US dollar depreciation during the year
MANAGEMENT'S REPORT – OUTLOOK FOR 2005
qq Back to contents
11GN Store Nord – Annual Report 2004
MANAGEMENT'S REPORT – GN 360˚ – OPERATIONS AND RISK
corporate headquarters. Property, plant and equipment amounted to DKK 429 million at December 31, 2004, against DKK 337 million the year before.
Equity stood at DKK 4,627 million, com-pared to DKK 4,473 million at the end of 2003.
Cash FlowsThe free cash fl ow for the year was DKK 686 million against DKK 469 million in 2003. Ad-justed for non-recurring items, the free cash fl ow was DKK 708 million compared to DKK 308 million 2003. Non-recurring items in 2004 included the sale of the stake in Voxtel, the sale of listed shares, the acquisition of corporate headquarters and restructuring.
GN 360° – OPERATIONS AND RISK
MarketsGN holds about a 35% share of the market for headsets for contact centers and offi ces, second only to its US competitor Plantronics. The offi ce market is expected to become more competitive longer term, as its poten-tial could attract new players and because developments in IP telephony are expected to lift the demand for headsets.
The mobile market is also expected to become more competitive as more players coming onto the market in the years ahead will trigger an elimination race. If the market evolves as anticipated in terms of new wireless products for mobile gaming, MP3-players etc., it would not seem likely that GN as the leading provider of Bluetooth headsets can retain its 2004 market share at estimated 33%.
GN is one of six players holding in all more than 80% of the market for hearing instru-ments. GN and Swiss-based Phonak are the third-largest manufacturers, each with market shares of about 16%, behind Siemens (Ger-many) and William Demant (Denmark). Over-all global production of hearing instruments was around 7 million units in 2004 and the estimated market value at producer level was approximately DKK 17 billion.
impacted revenue by more than DKK 260 million relative to 2003.
Gross profi tGross profi t improved to DKK 2,945 mil-lion from DKK 2,625 million in 2003. The improvement was due to the restructurings implemented in recent years and the revenue improvement relative to 2003. The 53% gross margin is impacted by the growing sales of mobile headsets, especially to OEM customers.
Development costsDevelopment costs incurred were DKK 307 million (2003: DKK 264 million), of which 46% was capitalized. Development costs will continue to rise over the next few years, in line with the growing demand for product innovation, especially in CC&O headsets. Accumulated capitalized development costs amounted to DKK 376 million at Decem-ber 31, 2004, against DKK 347 million at December 31, 2003. Capitalized projects are amortized over a period of 1–5 years. Pro jects in the mobile headsets business are amor tized over a maximum of two years, due to the short commercial life of such products.
Development costs recognized in the income statement rose to DKK 272 million (2003: DKK 250 million) including DKK 107 million (2003: DKK 118 million) in amortiza-tion on previously capitalized projects.
Amortization of acquired intangible assetsAmortization of acquired intangible assets including goodwill amounted to DKK 225 million, compared with DKK 319 million in 2003, of which DKK 66 million derived from a mandatory technical reduction of the carry-ing value of goodwill, because GN can now use deferred tax assets not included in the original calculation of goodwill.
GN expects that amortization of intangible assets arising from company acquisitions will amount to DKK 30 million in 2005. The DKK
195 million drop from 2004 is due to the new international fi nancial reporting standard IFRS 3 Business Combinations, according to which goodwill is no longer amortized. Goodwill remains subject to regular impairment testing.
EBITAThe increase in EBITA from DKK 549 mil-lion in 2003 to DKK 727 million in 2004 is a refl ection of the rationalization measures implemented and the revenue improvements achieved.
Financial items and non-recurring itemsNet fi nancial items, etc. were DKK 2 million against DKK 177 million in 2003, when the item was affected by interest income result-ing from tax reimbursements and the rever-sal of provisions. Net interest expenses to banks on the net debt were DKK 22 million in 2004. The accounting gain from the sale of the stake in Voxtel was DKK 30 million.
Profi t before taxGN posted a profi t before tax of DKK 532 million against DKK 263 million in 2003.
Profi t after taxThe net profi t for the year was DKK 504 mil-lion against DKK 250 million in 2003.
Balance sheetTotal assets fell by DKK 491 million to DKK 6,106 million. Inventories and trade receiv-ables fell to DKK 1,465 million from DKK 1,580 million at December 31, 2003. Trade payables dropped by DKK 14 million in 2004 to DKK 275 million. Net interest-bearing debt was DKK 245 million at December 31, 2004.
Goodwill consisted of DKK 441 million on headset operations and DKK 1,940 million on hearing instruments and audiologic diagnos-tics equipment. US dollar depreciation during 2004 reduced goodwill by just over DKK 200 million.
GN invested DKK 220 million in produc-tion plant, etc. in 2004, including in the new
qq Back to contents
12 GN Store Nord – Annual Report 2004
The gradual consolidation of the retail seg-ment is expected to continue in the longer term, and manufacturers are expected to continue forging closer ties with end users through added marketing efforts.
GN Otometrics holds a market share of 25% in a number of niche markets, which have an estimated aggregate value of DKK 1.4 billion. William Demant is the other major player in this market. In addition, the industry consists of several small manufacturers.
SalesGN’s businesses sell their products through a number of different sales channels.
Headsets are mainly sold B2B through spe-cialist offi ce product distributors, but going forward, sales are expected to be channeled increasingly through major retail chains.
Sales of headsets for contact centers take place through CC&O product distributors and direct to a few major end users. Hello Direct sells electronic offi ce equipment, mainly headsets, by mail order and over the Internet direct to small businesses in the United States.
Mobile headsets are sold B2B direct to the large OEM customers. Demand in this sales channel varies strongly from quarter to quar-ter. Jabra products, branded direct to con-sumers, are sold to mobile phone retail chains in particular and to some extent to general electronics retail chains.
Hearing instruments are sold B2B to pro-fessional hearing aid dispensers, which are mainly independent hearing clinics or small chains. Also a B2B segment, audiologic diag-nostics equipment is sold to hearing clinics, ear-nose-throat clinics, hospitals and to some extent as OEM products.
GN’s own sales channels or channels in which GN has operational infl uence repre-sented just over 15% of hearing instrument and audiologic diagnostics equipment sales. These channels include the Beltone network in the US, Ultravox Holdings of the UK, in which GN holds a 25% stake, and from GN’s own outlets in Belgium and Brazil together with the partly-owned outlets in Poland. GN
interfaces with headset end users from the sales generated through Hello Direct and direct sales to large contact centers. Revenue from this business amounted to approxim-ately DKK 375 million in 2004.
Customer concentration at GN is low. Only a single customer accounted for more than 5% of revenue in 2004, while sales to the ten largest customers represented about 15% of hearing instrument and audiologic dia gnostics equipment sales. The ten larg-est customers represented almost 25% of CC&O headset revenue and just under 75% of mobile headset revenue, which included substantial OEM contracts.
The average credit period for trade receiv-ables was 61 days, compared with 63 days in 2003. The efforts to reduce the credit period continue. The largest single trade receivable at December 31, 2004, totaled DKK 53 million.
GN plays an increasingly active role in customers’ marketing initiatives, and advises Beltone dispensers in the United States on how to operate and develop their hearing clinics. Joint marketing initiatives with GN and retail chains sharing costs are key to increas-ing the awareness of Jabra.
Demand for headsets for contact centers relies heavily on the state of the economy and on job creation, especially in the United States. The markets in Europe and especially in Asia, where several English-language con-tact centers are being outsourced to, are expected to outgrow the US market, due to the small number of contact centers available in these regions.
In the offi ce market the increased penetra-tion is expected to generate 10–20% annual growth rates, depending on the economic cli-mate. An estimated 100 million offi ce employ-ees in the western world use a telephone daily for two hours or more. Given the estimated penetration rate of less than 10%, this repre-sents an untapped market.
Mobile headset sales are driven by the vol-ume of cell phones sold. In 2004, 600 million units were sold, of which only about 10% had Bluetooth functionality. New commu-
nication products featuring gaming, music, camera and computer functionality are set to drive up demand for headsets. In addition, more and more countries are introducing legislation requiring hands-free telephony while driving, stimulating consumer interest in headsets.
Although as many as an estimated 10% of the population would benefi t from a hearing aid, only one in fi ve in this group actually has one. Today’s fi rst-time buyer is almost 70 years old and the average user age is nearly 75. Long-term market growth in terms of units sold is estimated at 2-4% annually for hearing instruments, assuming the current penetra-tion rate of about 20% does not increase. New products providing better comfort, such as the ReSoundAIR, may boost consumer interest and increase the penetration rate. This is a trend that will likely be supported by the anticipated competition in the market for open hearing instruments.
PricesAs expected, mobile headsets were exposed to severe price competition in 2004, but a re-peat of the more than 50% plunge in prices seen from the spring of 2002 to the fall of 2003 was avoided. Prices fell by 10-15% when the retail chains were planning their 2004 Christmas campaigns. GN’s strategy is to sell Jabra-branded products in all price categories and to be the most effi cient manufacturer of headsets at all times. At the beginning of 2005, the lowest priced and the most advanced GN Bluetooth headsets retailed at about DKK 400 and about DKK 1,200, respectively, in Denmark.
A slight price pressure on headsets for of-fi ces was detected locally in Europe in the second half of the year. Corded headsets generally trade at DKK 600-1,200, while wireless products may cost more than twice that amount.
After several years of rising prices triggered by the shift from analog to digital techno logy, there was some price pressure on the less advanced hearing instruments, as adding
MANAGEMENT'S REPORT – GN 360˚ – OPERATIONS AND RISK
qq Back to contents
13GN Store Nord – Annual Report 2004
more microphones, among other things, to these products improved their functionality. In the United States, the advanced ReSound-AIR retailed at about DKK 12,000 at the end of 2004. The most expensive devices on the market retail at more than DKK 15,000, whereas less advanced digital devices, such as the Canta2, sell at close to DKK 6,000 in Denmark and China.
In Europe, users may in some cases obtain a full or partial refund of their hearing aid expenses from their public health care sys-tem. However, these schemes are expected to come under pressure due to the growing population of older people in Europe. For example, Germany reduced health care sub-sidies at the turn of the year. In the United States, users generally pay for everything themselves, while under the Veterans Admin-istration program, hearing aids are subsidized 100%. In China and Japan, consumers gene-rally also pay the full price.
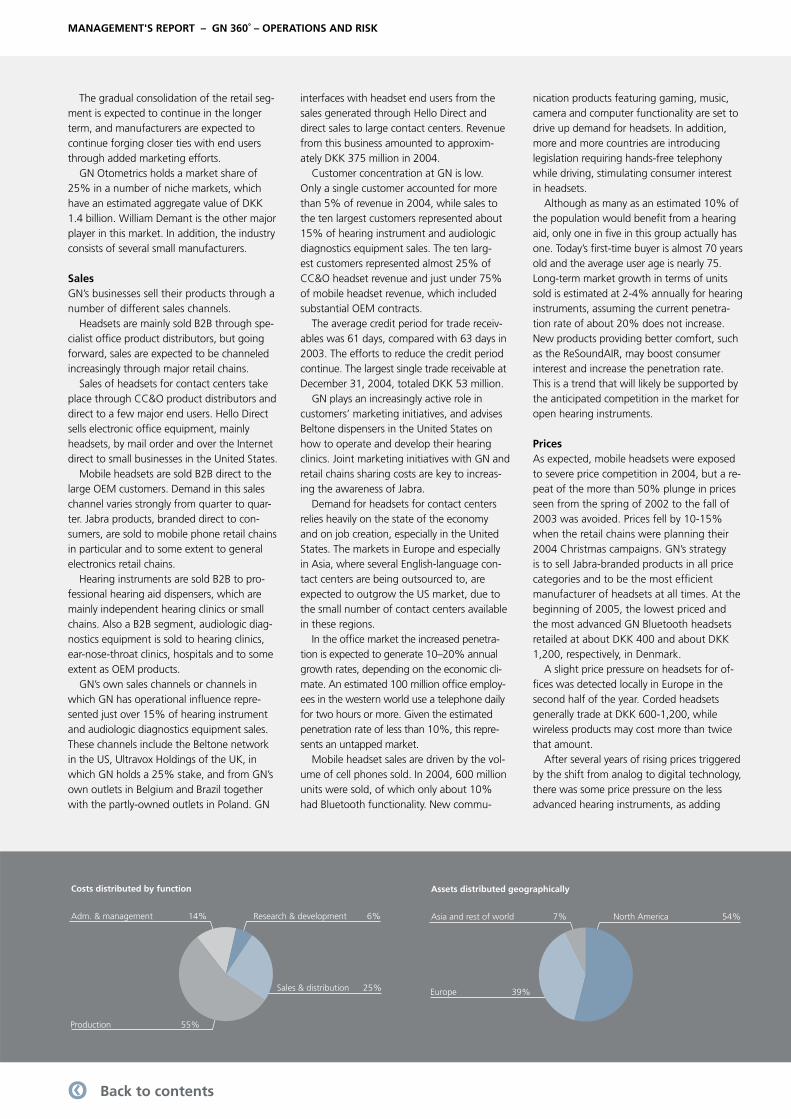
Manufacturing and distributionGN manufactured about 1.2 million hear-ing instruments and, including outsourced production, more than 16 million headsets, amplifi ers and other devices in 2004. GN manufactures most of its products in China, and 80% of the hearing instruments, 15% of the mobile headsets and 20% of the CC&O headsets are assembled at the Xia-men factory. The remaining 20% of hearing instruments are manufactured at GN’s fac-tory in Cork, Ireland, while the rest of the headsets are currently manufactured by four Chinese sub-contractors in an arrangement that helps provide the fl exibility needed to meet the fl uctuating demand from major OEM customers, in particular. As part of the process to streamline GN Otometrics, GN commenced the process of relocating the production of semimanufactures to Xiamen in 2004.
A key challenge across all product catego-ries is to increase the number of components used in more than one product. That will reduce component prices and enhance fl ex-
ibility along the entire supply chain. The OEM contracts with the leading cell
phone manufacturers is another factor that reduces GN’s procurement costs, as they serve to increase volumes and thereby enhance the procurement power, also keeping unit costs of GN’s own Jabra products competitive. At the same time, the partnership with OEM customers serves as a lever for GN to meet the design, functionality and technology re-quirements demanded by the market.
The manufacturing of ITE hearing instru-ments, today a manual process, takes place locally at ITE laboratories. The advanced soft-ware and digital print technology applied in the autoshell process will lift product quality, reduce lead times and enhance the standard-ization of parts in production. The electronic components for most of the ITE devices are assembled in Xiamen.
Just over 1,000 people are involved in manufacturing ITE hearing instruments, while 350 work assembling BTEs and 650 assemble headsets.
All hearing instruments and a large part of the headset output are shipped by air from Xiamen in order to minimize capital tied up in inventories. In recent years, local inventories operated by the sales companies and the production of hearing instruments have been reduced. Instead, the fi nished products and components have increasingly been stored at the central warehouse in Cork, Ireland, which has helped to reduce overall inventories by a substantial margin. Headset products are shipped to customers directly or through the four regional distribution centers in the Neth-erlands, Hong Kong and the United States (New Hampshire and California).
Concurrently with reducing the number of sub-contractors (subject to the policy of having at least two business partners in key strategic areas), GN continues to source a growing proportion of raw materials and components from Asia, which now represents 30% of hearing instruments and more than 60% of headsets. GN’s total costs in China amount to an estimated DKK 500 million,
including local costs settled in US dollars, cor-responding to more than 10% of GN’s total costs before goodwill amortization.
Environmental issuesGN’s production does not have an adverse environmental impact, given the limited consumption of raw materials and energy. Soft soldering plays a moderate role in pro-duction, and effective ventilation and air cleaning procedures ensure a healthy work-ing environment. End user demands for ever lighter products is a continuing factor in re-ducing GN’s materials consumption per unit produced. Current considerations involve moving headset packing facilities nearer to the customers in order to reduce shipping costs from Xiamen.
Today’s hearing instruments use disposable batteries. As more and more of production has been relocated to China, GN has devel-oped a more systematic process in the selec-tion of sub-contractors, facilitating follow-ups to monitor their compliance with local envi-ronmental and occupational health and safety requirements. GN is aligning its production to comply with the EU Directive on the phasing out of heavy metals, such as lead and cadmi-um, in electronic components. The Directive will come into force on July 1, 2006.
DevelopmentEmploying more than 350 people at the end of 2004, most of whom were based in Denmark or the United States, GN’s develop-ment operations incurred costs of DKK 307 million, or some 5% of the 2004 revenue. The development departments currently be-ing set up in China employ some 30 people involved in testing and product upgrades. The concentration of development staff in Denmark is based on the strong university environment in acoustics, digital signal pro-cessing (DSP) and communication technology as well as the presence of many international businesses with operations related to those fi elds in Copenhagen and southern Sweden.
The pace of product replacement is ac-
qq Back to contents
Beltone CORUS CIC
Beltone MIRA BTE
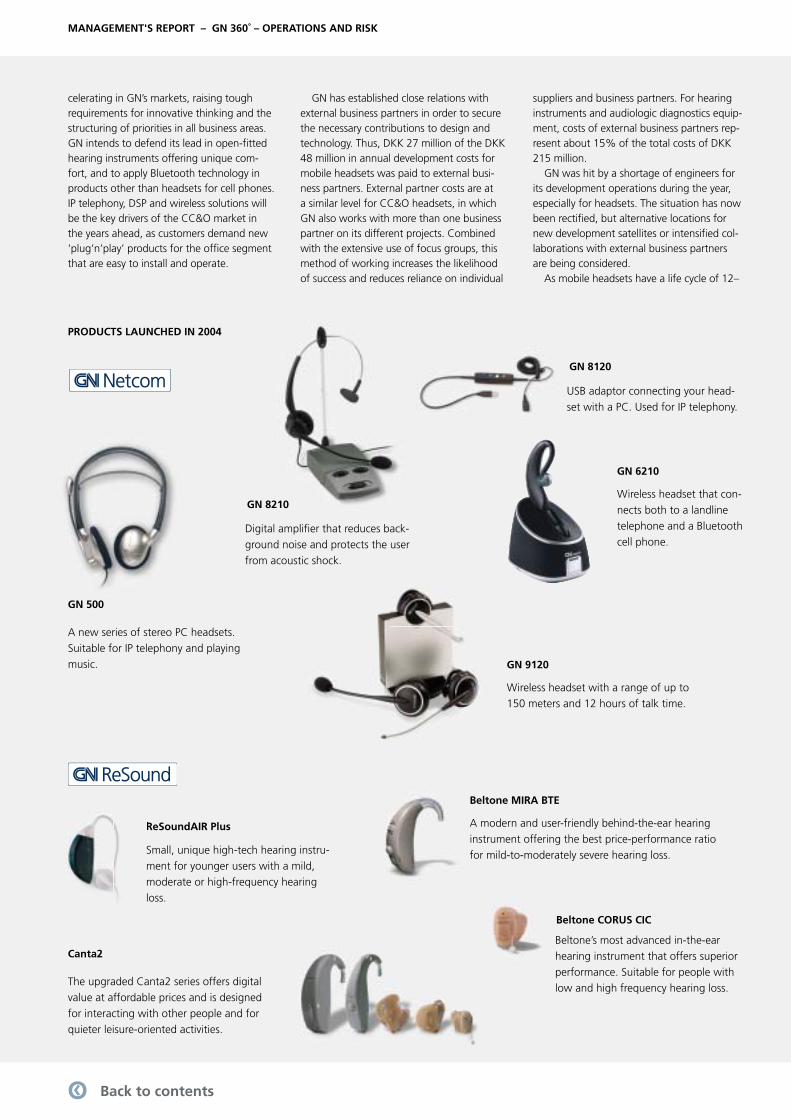
GN 9120
GN 6210
GN 8120
GN 8210
GN 500
ReSoundAIR Plus
Canta2
14 GN Store Nord – Annual Report 2004
celerating in GN’s markets, raising tough requirements for innovative thinking and the structuring of priorities in all business areas. GN intends to defend its lead in open-fi tted hearing instruments offering unique com-fort, and to apply Bluetooth technology in products other than headsets for cell phones. IP telephony, DSP and wireless solutions will be the key drivers of the CC&O market in the years ahead, as customers demand new ‘plug‘n’play’ products for the offi ce segment that are easy to install and operate.
GN has established close relations with external business partners in order to secure the necessary contributions to design and technology. Thus, DKK 27 million of the DKK 48 million in annual development costs for mobile headsets was paid to external busi-ness partners. External partner costs are at a similar level for CC&O headsets, in which GN also works with more than one business partner on its different projects. Combined with the extensive use of focus groups, this method of working increases the likelihood of success and reduces reliance on individual
suppliers and business partners. For hearing instruments and audiologic diagnostics equip-ment, costs of external business partners rep-resent about 15% of the total costs of DKK 215 million.
GN was hit by a shortage of engineers for its development operations during the year, especially for headsets. The situation has now been rectifi ed, but alternative locations for new development satellites or intensifi ed col-laborations with external business partners are being considered.
As mobile headsets have a life cycle of 12–
PRODUCTS LAUNCHED IN 2004
MANAGEMENT'S REPORT – GN 360˚ – OPERATIONS AND RISK
Wireless headset that con-nects both to a landline telephone and a Bluetooth cell phone.
Small, unique high-tech hearing instru-ment for younger users with a mild, moderate or high-frequency hearing loss.
The upgraded Canta2 series offers digital value at affordable prices and is designed for interacting with other people and for quieter leisure-oriented activities.
A modern and user-friendly behind-the-ear hearing instrument offering the best price-performance ratio for mild-to-moderately severe hearing loss.
Beltone’s most advanced in-the-ear hearing instrument that offers superior performance. Suitable for people with low and high frequency hearing loss.
Wireless headset with a range of up to 150 meters and 12 hours of talk time.
A new series of stereo PC headsets. Suitable for IP telephony and playing music.
USB adaptor connecting your head-set with a PC. Used for IP telephony.
Digital amplifi er that reduces back-ground noise and protects the user from acoustic shock.
qq Back to contents
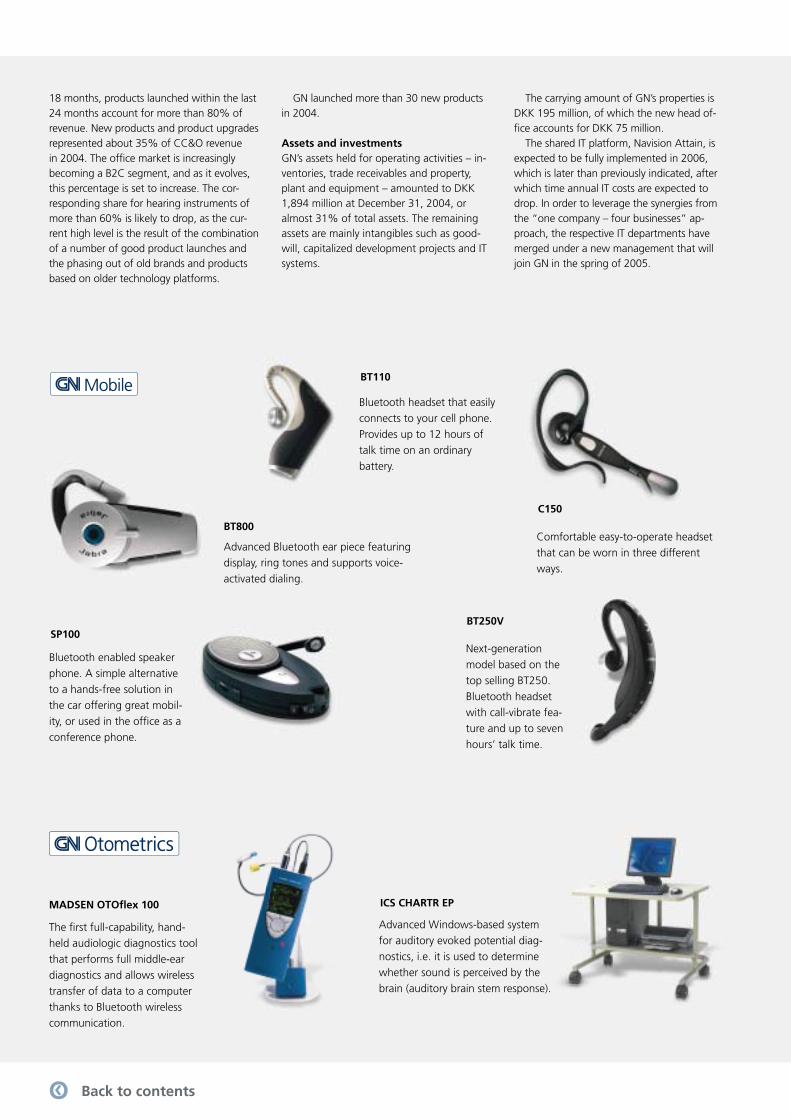
BT800
BT110
SP100
C150
BT250V
MADSEN OTOfl ex 100 ICS CHARTR EP
15GN Store Nord – Annual Report 2004
18 months, products launched within the last 24 months account for more than 80% of revenue. New products and product upgrades represented about 35% of CC&O revenue in 2004. The offi ce market is increasingly becoming a B2C segment, and as it evolves, this percentage is set to increase. The cor-responding share for hearing instruments of more than 60% is likely to drop, as the cur-rent high level is the result of the combination of a number of good product launches and the phasing out of old brands and products based on older technology platforms.
GN launched more than 30 new products in 2004.
Assets and investmentsGN’s assets held for operating activities – in-ventories, trade receivables and property, plant and equipment – amounted to DKK 1,894 million at December 31, 2004, or almost 31% of total assets. The remaining assets are mainly intangibles such as good-will, capitalized development projects and IT systems.
The carrying amount of GN’s properties is DKK 195 million, of which the new head of-fi ce accounts for DKK 75 million.
The shared IT platform, Navision Attain, is expected to be fully implemented in 2006, which is later than previously indicated, after which time annual IT costs are expected to drop. In order to leverage the synergies from the “one company – four businesses” ap-proach, the respective IT departments have merged under a new management that will join GN in the spring of 2005.
Next-generation model based on the top selling BT250. Bluetooth headset with call-vibrate fea-ture and up to seven hours’ talk time.
Comfortable easy-to-operate headset that can be worn in three different ways.
Bluetooth headset that easily connects to your cell phone. Provides up to 12 hours of talk time on an ordinary battery.
Advanced Bluetooth ear piece featuring display, ring tones and supports voice-activated dialing.
Bluetooth enabled speaker phone. A simple alternative to a hands-free solution in the car offering great mobil-ity, or used in the offi ce as a conference phone.
The fi rst full-capability, hand-held audiologic diagnostics tool that performs full middle-ear diagnostics and allows wireless transfer of data to a computer thanks to Bluetooth wireless communication.
Advanced Windows-based system for auditory evoked potential diag-nostics, i.e. it is used to determine whether sound is perceived by the brain (auditory brain stem response).
qq Back to contents
16 GN Store Nord – Annual Report 2004
Human ResourcesWith more than 1,200 employees, the op-erations in China are GN’s largest workplace, followed by operations in the United States.
GN is developing its HR operations in order to retain GN’s employees and managers and to provide the necessary framework they need to handle globalization, the growing competition and the increased focus on sales and marketing.
The efforts to establish a single corporate HR strategy and HR organization for GN have been strengthened and a number of global HR projects are currently being implemented. Receiving special priority is the work to har-monize recruitment and employee develop-ment processes, and GN has also acquired a shared human resources information system. Also, the level of services provided to small subsidiaries has been raised through the dedicated recruitment of international HR ex-pertise that is based in Copenhagen. In order to support a global corporate culture and im-prove international competencies, GN plans to increase the number of foreign employees in key positions in Denmark. At January 1, 2005, more than 50 of GN’s around 800 em-ployees in Denmark were foreign nationals.
In 2004, some 50 managers attended GN’s in-house career development courses, which are intended to enhance international man-agement skills, accelerate the development of GN managers and help them establish networks.
Foreign currencyGN has currency exposure only in connection with commercial transactions. GN does not raise loans or place surplus cash in foreign currency unless doing so reduces a currency exposure.
About 50% of revenues are generated in US dollars or dollar-related currencies. With close to 60% of costs generated in USD or USD-related currencies, GN’s long-term indus-trial competitiveness and its EBITA are resilient to likely US dollar fl uctuations. A 10% depre-ciation of the US dollar against the Danish krone would reduce GN’s revenue by an esti-mated 5% and would only have a limited effect on operating profi t. Short-term fl uctu-ations of the US dollar would impact profi t as and when products manufactured at a given exchange rate are sold at a different exchange rate. Eventually, Asian currencies are expected to take on added importance in terms of both income and costs.
FinancingAt December 31, 2004, GN had an equity ratio of 76% and net interest-bearing debt of DKK 245 million. The interest cover was 40 in 2004.
The debt was mainly DKK-denominated with a duration of less than one year, refl ect-ing the asset composition with few long-term assets when disregarding goodwill. Other things being equal, a one-percentage-point increase in GN’s fi nance costs would increase net interest expenses by less than DKK 3 mil-lion.
GN has suffi cient credit commitments to fi nance growth. GN will continue to apply debt fi nancing in creating an appropriate capital structure that refl ects the cash fl ow generation.
Financial credit risksGN holds most of its cash funds as short-term money market deposits with banks that have a satisfactory rating with Moody’s or Standard & Poor’s. GN’s exposure to any single fi nancial counterparty does not exceed 2.5% of such party’s capital and reserves.
Risk managementAll key GN locations worldwide completed risk assessments in 2004 along with the necessary analysis of the identifi ed risks and their potential impact on GN’s value-creat-ing processes. The results have been used to prepare business continuity plans on how to re-establish certain sites.
The most critical single risks would be break-downs occurring at Xiamen, Cork, Minneapo-lis or Præstø, failure of sub-contractors to supply fi nished products and strategic com-ponents, such as chipsets, microphones or amplifi ers.
GN maintains an insurance program that adequately refl ects the nature, scope and geographical location of its business opera-tions. In order to gradually align the coverage with GN’s needs, especially in light of the ex-tensive restructuring completed in recent years, we analyze and review once a year and in cooperation with local and global advisors the coverage in each of the four business areas and their related exposures. The results of these analyzes are used to determine risk and coverage levels.
GN takes out insurance coverage for li-ability, property damage and business inter-ruption subject to global and local standards. The program covers, when found appropriate and fi nancially feasible, consequential loss. Another part of the program is funding to re-establish manufacturing facilities, supplier risk and reliance on suppliers. The Execu-tive Management ensures that the coverage always complies with GN’s policies, refl ects GN’s exposure and keeps the Supervisory Board updated on the scope and extent of the insurance program.
Generally, GN does not take out insurance against political risk.
In early 2005, GN commenced the imple-mentation of a centrally coordinated risk management system that will be used to re-cord and manage risks globally. The purpose of the system is to effectively identify, assess and evaluate all major risks that may impact GN’s ability to achieve its goals.
All units of GN’s global organization must regularly carry out and document a risk man-agement process identifying, assessing and evaluating relevant risks pertaining to each unit and to GN overall. Based on the results of the process, steps are taken to handle the identifi ed risks. Each unit will then report the results to Corporate Risk Management, which will process and structure reported risks, so as to enable GN’s management to monitor the overall risk position. Reports will be used to prioritize and allocate resources for initiatives to handle major risks in individual units or at corporate level. The risk management system will be assessed and the appropriate adjust-ments made on a regular basis.
Corporate GovernanceGN has a single class of shares, no control-ling shareholders and no takeover defense mechanism. Shareholders at the Annual General Meeting held in March 2004 rep-resented 18% of the share capital either directly or by proxy.
GN generally adheres to the recommen-dations on corporate governance issued by the Copenhagen Stock Exchange, and a structured evaluation of the work performed by the Supervisory Board and its members and its cooperation with the Executive Man-agement will be carried out from 2005 and onwards. Members of the Supervisory Board are up for election each year. Three of the fi ve board members appointed by the sharehold-ers have served on the Board for less than three years. Mr. Peter Foss, who was elected in 1999, resigned from the Supervisory Board at his own request in November 2004.
In early 2005, the Chairman held meet-ings with several of the major shareholders, discussing compensation methods, capital structure, board composition and corporate governance.
MANAGEMENT'S REPORT – GN 360˚ – OPERATIONS AND RISK
qq Back to contents
17GN Store Nord – Annual Report 2004
Adequate, timely and simultaneous communication to all parties
Financial calendar 2005
March 14: Annual General MeetingThe AGM will be held at 3.30 p.m., CET, at Radisson SAS Falconer Center, Falkoner Allé 9, DK-2000 FrederiksbergMay 4: Q1 2005 earnings releaseAugust 18: Q2 2005 earnings releaseNovember 3: Q3 2005 earnings release
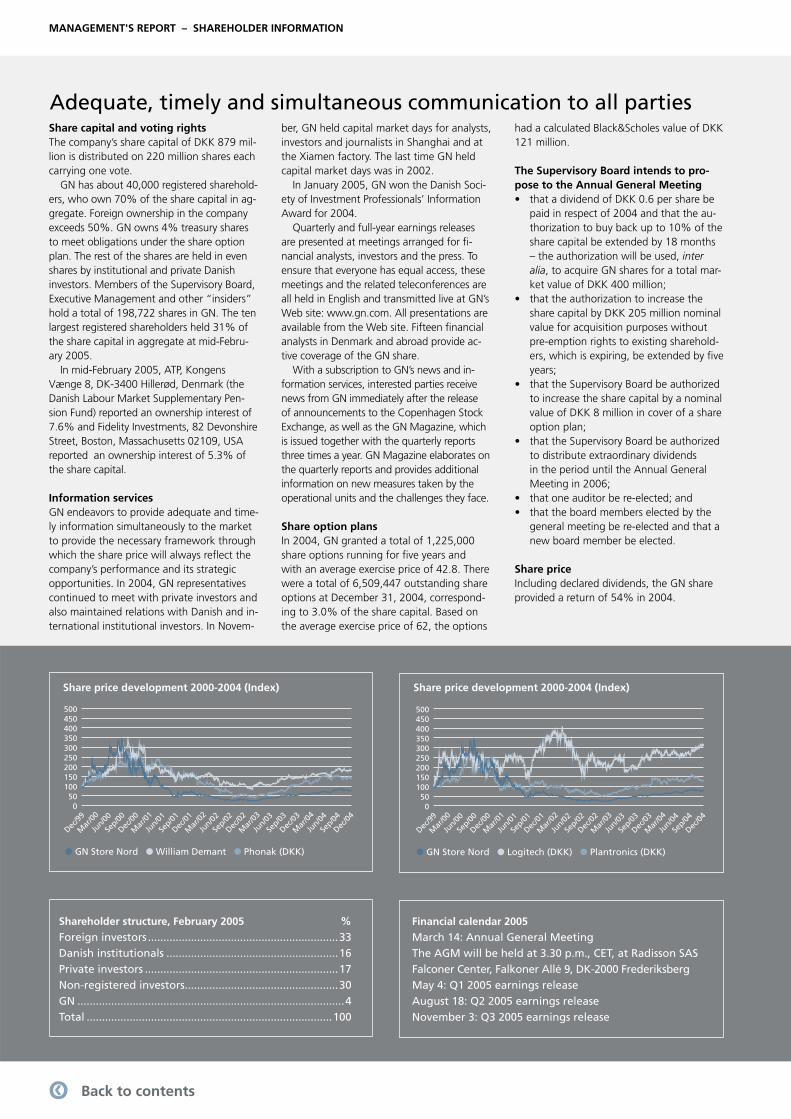
● GN Store Nord ● Logitech (DKK) ● Plantronics (DKK)● GN Store Nord ● William Demant ● Phonak (DKK)
Share capital and voting rightsThe company’s share capital of DKK 879 mil-lion is distributed on 220 million shares each carrying one vote.
GN has about 40,000 registered sharehold-ers, who own 70% of the share capital in ag-gregate. Foreign ownership in the company exceeds 50%. GN owns 4% treasury shares to meet obligations under the share option plan. The rest of the shares are held in even shares by institutional and private Danish investors. Members of the Supervisory Board, Executive Management and other “insiders” hold a total of 198,722 shares in GN. The ten largest registered shareholders held 31% of the share capital in aggregate at mid-Febru-ary 2005.
In mid-February 2005, ATP, Kongens Vænge 8, DK-3400 Hillerød, Denmark (the Danish Labour Market Supplementary Pen-sion Fund) reported an ownership interest of 7.6% and Fidelity Investments, 82 Devonshire Street, Boston, Massachusetts 02109, USA reported an ownership interest of 5.3% of the share capital.
Information servicesGN endeavors to provide adequate and time-ly information simultaneously to the market to provide the necessary framework through which the share price will always refl ect the company’s performance and its strategic opportunities. In 2004, GN representatives continued to meet with private investors and also maintained relations with Danish and in-ternational institutional investors. In Novem-
ber, GN held capital market days for analysts, investors and journalists in Shanghai and at the Xiamen factory. The last time GN held capital market days was in 2002.
In January 2005, GN won the Danish Soci-ety of Investment Professionals’ Information Award for 2004.
Quarterly and full-year earnings releases are presented at meetings arranged for fi -nancial analysts, investors and the press. To ensure that everyone has equal access, these meetings and the related teleconferences are all held in English and transmitted live at GN’s Web site: www.gn.com. All presentations are available from the Web site. Fifteen fi nancial analysts in Denmark and abroad provide ac-tive coverage of the GN share.
With a subscription to GN’s news and in-formation services, interested parties receive news from GN immediately after the release of announcements to the Copenhagen Stock Exchange, as well as the GN Magazine, which is issued together with the quarterly reports three times a year. GN Magazine elaborates on the quarterly reports and provides additional information on new measures taken by the operational units and the challenges they face.
Share option plansIn 2004, GN granted a total of 1,225,000 share options running for fi ve years and with an average exercise price of 42.8. There were a total of 6,509,447 outstanding share options at December 31, 2004, correspond-ing to 3.0% of the share capital. Based on the average exercise price of 62, the options
Share price development 2000-2004 (Index) Share price development 2000-2004 (Index)
Shareholder structure, February 2005 %Foreign investors ..............................................................33 Danish institutionals ........................................................16Private investors ...............................................................17Non-registered investors ..................................................30GN .......................................................................................4Total ................................................................................100
had a calculated Black&Scholes value of DKK 121 million.
The Supervisory Board intends to pro-pose to the Annual General Meeting• that a dividend of DKK 0.6 per share be
paid in respect of 2004 and that the au-thorization to buy back up to 10% of the share capital be extended by 18 months – the authorization will be used, inter alia, to acquire GN shares for a total mar-ket value of DKK 400 million;
• that the authorization to increase the share capital by DKK 205 million nominal value for acquisition purposes without pre-emption rights to existing sharehold-ers, which is expiring, be extended by fi ve years;
• that the Supervisory Board be authorized to increase the share capital by a nominal value of DKK 8 million in cover of a share option plan;
• that the Supervisory Board be authorized to distribute extraordinary dividends in the period until the Annual General Meeting in 2006;
• that one auditor be re-elected; and• that the board members elected by the
general meeting be re-elected and that a new board member be elected.
Share priceIncluding declared dividends, the GN share provided a return of 54% in 2004.
MANAGEMENT'S REPORT – SHAREHOLDER INFORMATION
qq Back to contents
18 GN Store Nord – Annual Report 2004
CC&O headsets investing in the offi ce segment
Q4 2004Revenue from the CC&O headsets business was DKK 340 million against DKK 334 mil-lion in Q4 2003, equal to organic growth of 6%. Providing healthy surprises during the quarter were the sales to contact centers and offi ces in Europe as well as the Hello Direct sales. Reporting revenue of DKK 69 million, Hello Direct again improved its profi ts.
New products launched in 2003 and 2004 accounted for almost 40% of revenue, a slight improvement from the previous quar-ters. Wireless products accounted for 34% of revenue.
EBITA improved to DKK 75 million (a mar-gin of 22.1%) in Q4 from DKK 45 million (14.3%) in Q3 2004, when the fi gure was affected by costs relating to a litigation and weaker sales during the summer months.
2004The CC&O headsets business generated rev-enue of DKK 1,316 million in 2004, against DKK 1,279 million in 2003. Hello Direct gen-erated revenue of DKK 300 million. In spite of the weaker US dollar, the full-year rev-
enue was still some DKK 100 million ahead of the original forecast. Wireless headsets accounted for 31% of revenues.
The improved market conditions that emerged in the second half of 2003 contin-ued in 2004 driven by the offi ce segment. Demand was strongest in Europe during the fi rst part of the year, after which the US offi ce segment in particular began to show strong growth rates.
The relocation of production to China and of Hello Direct from California to New Hamp-shire has made GN much more competitive, and Hello Direct has now begun to add new items to its product assortment. Hello Direct reported an EBITA of DKK 18 million for the year, against an EBITA loss of DKK 18 million in 2003. As part of GN’s overall efforts on the US offi ce market, Hello Direct will be expand-ing its telemarketing services in 2005, aiming to boost sales to the SOHO market.
Aiming to leverage the potential of the of-fi ce market, GN began selling offi ce headsets through a small number of retail chains in Europe and especially in the United States, where the company launched a complete
GN NETCOM – CONTACT CENTER & OFFICE HEADSETS
product family in November. In the United States, GN products are now sold through Offi ce Depot, Fry’s and Offi ce Max, and more agreements are expected to be signed during 2005. Accordingly, the sales and marketing efforts will be stepped up considerably in 2005.
The GN 8210 amplifi er was launched in August 2004. Demand for the product is building extremely well. The GN 8210 is the fi rst product on the market with DSP technol-ogy, which eliminates background noise and reduces the user’s overall sound exposure during a working day. Late in the year, we launched the GN 6210, which connects with a BT250 headset to both cell phones and fi xed network telephones. At the CES trade fair in January, GN launched three new head-sets in the GN 500 series for VoIP users.
EBITA amounted to DKK 257 million (19.5%).
qq Back to contents
19GN Store Nord – Annual Report 2004
GN MOBILE – MOBILE HEADSETS
Q4 2004The mobile headsets business generated revenue of DKK 338 million from Jabra and OEM headsets against DKK 160 million in Q4 2003. The strong organic growth of more than 100% kept the momentum during the fi nal three months of the year, and in spite of the anticipated drop in the sale of OEM products GN expects to have defended its market share of Bluetooth products, which generated revenue of DKK 267 million.
Corded and wireless Jabra products retain-ed the strong organic revenue growth; by more than 50% relative to Q4 2003, in spite of the disappointing Christmas sales.
New products launched in 2003 and 2004 represented almost 90% of Q4 revenue.
EBITA fell to DKK 2 million (a margin of 0.6%) from DKK 13 million (3.1%) in Q3 2004.
2004The full-year revenue of DKK 1,198 million (2003: DKK 481 million) came in well ahead of the forecast of almost DKK 700 million, lifted by surprisingly strong growth in the
sale of wireless headsets to OEM customers and the DKK 279 million revenue improve-ment for Jabra brand products.
At the start of the year, GN projected an overall market of 6-8 million Bluetooth head-sets, which turned out to be almost half of the actual market volume estimated at 15-18 million units.
In order to create the best starting point for the Christmas season, Jabra launched the broadest product line in the industry already in the spring. The low priced BT110 and the SP100 speakerphone were both launched in the third quarter. The promotional campaigns for GN’s new advanced BT800 and BT500 headsets were postponed due to technical diffi culties and for commercial reasons. The BT800 came on the market in January 2005 and the BT500, the successor to the market’s best-selling Bluetooth headset, the BT250, will be released in the spring of 2005.
The strong revenue improvement recorded already in the second quarter coincided with GN insourcing a greater part of its headset production, placing strong demands on the supply chain, as new assembly lines had not
yet been run in at the time. Productivity im-proved gradually as the year progressed and has now reached a satisfactory level.
The surging growth also placed heavy de-mands on recruitment, both at the Copenha-gen head offi ce and in several regional mar-kets. Staff numbers rose by more than 100 to over 200 during 2004, leading to higher fi xed costs. The shortage of engineers in the devel-opment department, which slowed down a number of projects in the middle of the year, has now been rectifi ed.
In January 2005, GN signed an agreement with Nokia’s N-Gage Division, a manufacturer of game decks, among other things. GN will be developing accessories for the game decks and will have the opportunity to market the N-Gage products as part of the Jabra family of products.
EBITA amounted to DKK 20 million (1.7%).
Growth sustained in mobile headsets
qq Back to contents
20 GN Store Nord – Annual Report 2004
Hearing instruments lifting earnings
Q4 2004GN generated hearing instrument revenue of DKK 698 million against DKK 706 million in Q4 2003. At almost 4% relative to Q4 2003, organic growth came in ahead of our origi-nal revenue forecast for the fourth quarter, driven by the continued sales improvements for especially ReSoundAIR and Canta2. The slowdown in growth relative to the fi rst two quarters of the year was due to generally weaker growth in the United States and Germany, new product launches by the competition and the loss of shipments to the National Health Service in the UK.
EBITA improved to DKK 164 million (a mar-gin of 23.5%) from DKK 135 million (21.0%) in Q3 2004.
2004Revenue improved to DKK 2,670 million from DKK 2,617 million in 2003. Quality and effi ciency of a number of administrative processes will be improved as the compre-hensive structural changes in manufacturing, logistics and the development departments are completed, and revenue growth will be given higher priority through stronger mar-keting efforts.
GN RESOUND – HEARING INSTRUMENTS
Using the new digital print technology to manufacture ITE hearing instruments will enable GN to move part of this production to regional sites. For example, Denmark is increasingly serving the Swedish market in addition to already providing products for Norway.
At the EUHA-fair in Germany last October, GN launched the ReSoundAIR Plus providing an open solution for people with hearing loss of up to 80 dB. This device is the next genera-tion of GN’s fi rst open and innovative prod-ucts launched in the spring of 2003. ReSound-AIR sales continue to rise on the markets where the product was fi rst introduced. Open hearing instruments are sold to users aged just over 60 on average, or 7–8 years younger than normal fi rst-time buyers of conventional solutions.
Over the past two years, the open devices have boosted the share of overall revenue of BTE devices to about 60% from just over 50%. There was a signifi cant change in the sales composition on the US market, where cosmetic factors traditionally take high prior-ity.
At the EUHA fair, GN also launched the ReSoundViking for people with severe hear-
ing loss. This is the fi rst super-powered hearing instrument GN has introduced since merging the fi ve original companies. The product portfolio is now almost complete, and focus is now on developing the next all-new generation of hearing instruments that will replace the Canta series.
The efforts to streamline all parts of the hearing instrument operations will continue in the years ahead. At the turn of the year, GN discontinued the sale of Philips branded products, which combined with the Danavox and the Viennatone hearing instruments to contribute 6% of 2004 revenue. Involving very mature products sold in small volumes, the brands being phased out represent a rela-tively higher share of costs than of revenue.
The Beltone brand was strengthened in 2004, and Beltone now has a fully upgraded product portfolio. The open hearing instru-ment EDGE was launched in selected markets during the summer and contributed to lifting the sale of Beltone products.
EBITA amounted to DKK 528 million (19.8%).
qq Back to contents
21GN Store Nord – Annual Report 2004
GN OTOMETRICS – AUDIOLOGIC DIAGNOSTICS EQUIPMENT
Streamlining the audiologic diagnostics equipment business
Q4 2004Revenue from audiologic diagnostics equip-ment was DKK 97 million against DKK 106 million in Q4 2003, equal to negative or-ganic growth of 6%. The improvements on the US market were replaced by better-than-expected sales in Europe.
EBITA improved to a loss of DKK 3 million (a margin of minus 3.1%) from a loss of DKK 6 million (minus 7.7%) in Q3 2004. Reasons for the loss included costs relating to the closure of the development department in Germany.
2004Revenue for 2004 was DKK 348 million, in line with the fi gure for 2003 and equal to organic growth of 2%. The weaker organic growth relative to 2003 is the result of the discontinued shipments to the National Health Service in the UK. The stronger sales of GN Otometrics’ diagnostics equipment on the North American market were based on the hearing instrument dispensers’ improved market conditions and improved fi nancial strength relative to mid-2003, enabling them to invest in new test equipment.
Since taking over on October 1, the new management team has worked to identify steps to enhance profi tability. Relocating part of the production to China, streamlining the product portfolio and a stronger customer focus are all things intended to make the operations more competitive and to enhance earnings.
Launched in the spring of 2004, the MADSEN OTOfl ex 100, a device to test middle-ear functions, was the fi rst device based on the new technological platform, whose lightweight modular handheld prod-ucts improves user mobility for performing hearing tests outside hearing clinics. The MADSEN OTOfl ex 100 enables wireless trans-fer of the test results to a personal computer with software developed by GN effi ciently updating patient journals and performing the subsequent administrative procedures. The MADSEN OTOfl ex 100 has given GN a tech-nological edge that can be used to upgrade other parts of the product portfolio.
EBITA was a loss of DKK 7 million (negative EBITA margin of 2.0%).
Other business activitiesThe GN Great Nordic Telegraph Company reported revenues of DKK 16 million against DKK 14 million in 2003. EBITA was a loss of DKK 2 million against a loss of DKK 4 million in 2003.
The stake in Voxtel, Moldova’s largest mobile operator, was divested in December.
Through the 75% ownership inter-est in DPTG I/S, GN is still a party to arbitration proceedings against Teleko-munikacja Polska S.A.
qq Back to contents
22 GN Store Nord – Annual Report 2004
These standards, regulations and guidelines do not consider the concepts of EBITDA and EBITA, which are often applied in a valua-tion of a company’s profitability and in com-parisons of GN with its competi tors or other comparable companies.
GN defines EBITA as the operating profit before amortization of goodwill and other in-tangible assets acquired in company acquisi-tions and before restructuring costs originat-ing from significant business restructurings, etc. and items of a non-recurring nature such as excep tional write-downs on non-current assets, etc.
EBITDA is defined as EBITA before depre-ciation of property, plant and equipment.
Amortization of development projects developed in-house, etc., is included in both EBITDA and EBITA.
The International Financial Reporting Stan-dards and the Danish Financial State ments Act require that impairment of property, plant and equipment, internally generated intangible assets and items of a non-recur-ring na ture are treated as ordinary items and, to the extent possible, included under the respective functions in the income statement as “Production costs”, “Development costs”, “Selling and distribution costs” and “Man-agement and administrative expenses” etc.
For the purpose of calculating EBITA and EBITDA operating profit is adjusted for the following:
• Amortization and impairment of good-will and other intangibles acquired in company acquisitions, as these are not recognized in EBITA cf. the Group’s definition.
• Write-downs on other non-current as-sets, which according to the IFRS income statement classified by function are rec-ognized in the costs of individual func-tions, including manufacturing, selling and distribution costs, and management and administrative expenses, but which are considered to be non-recurring items in an investor- specific income statement.
• Restructuring costs related to significant business restructurings, etc., which in an IFRS income statement are deducted from “Op erating profit”, but which are considered non-recurring items and thus should not be charged against EBITA.
• The share of profit from associates which is not considered a part of EBITA.
The EBITA figure is then adjusted for or-dinary depreciation of prop erty, plant and equipment, resulting in the EBITDA figure.
Business area operations
The statements contain earnings of each business area, GN Netcom (Contact Center & Offi ce Headset and Mobile Headset), GN ReSound (Hearing Instruments and Audio-logic Diagnostics Equipment) and other, for the last eight quarters.
The presentation also centers on the earn-ings concepts of EBITDA and EBITA, and performance is shown through changes in revenue, gross profit, overheads excluding developments costs, depreciation and amor-tization and expensed development costs.
Cash flow statement by quarterly period
and by business area
The statements also provide, for the past eight quarters, changes in cash flows from operating activities before changes in work-ing capi tal, changes in working capital, cash flows from operating activities before inter-est income and expense and similar items, taxes paid and restructuring costs, cash flows from operating activities, cash flows from investing activities and cash flows from financing activities.
The presentation and the method of calcu-lation applied are identical to what is used in an IFRS cash flow statement.
Investor-specific statements
Earnings, cash flows and selected balance sheet items by business area.
GN Store Nord A/S’ consolidated and parent company financial statements are presented in accordance with the provisions of the
International Financial Reporting Standards (IFRS) and additional Danish fi nancial reporting requirements for listed companies.
INVESTOR-SPECIFIC STATEMENTS
qq Back to contents
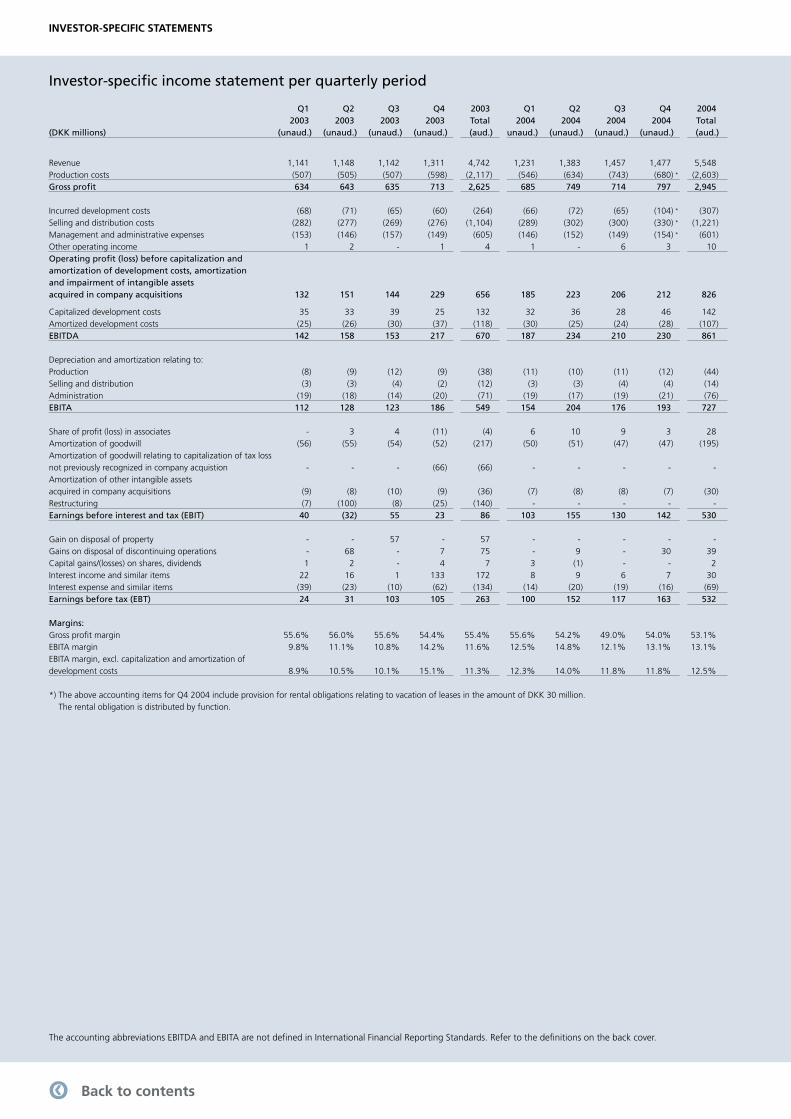
23GN Store Nord – Annual Report 2004
The accounting abbreviations EBITDA and EBITA are not defi ned in International Financial Reporting Standards. Refer to the defi nitions on the back cover.
INVESTOR-SPECIFIC STATEMENTS
Q1 Q2 Q3 Q4 2003 Q1 Q2 Q3 Q4 2004 2003 2003 2003 2003 Total 2004 2004 2004 2004 Total(DKK millions) (unaud.) (unaud.) (unaud.) (unaud.) (aud.) (unaud.) (unaud.) (unaud.) (unaud.) (aud.)
Revenue 1,141 1,148 1,142 1,311 4,742 1,231 1,383 1,457 1,477 5,548 Production costs (507) (505) (507) (598) (2,117) (546) (634) (743) (680) * (2,603)Gross profi t 634 643 635 713 2,625 685 749 714 797 2,945 Incurred development costs (68) (71) (65) (60) (264) (66) (72) (65) (104) * (307)Selling and distribution costs (282) (277) (269) (276) (1,104) (289) (302) (300) (330) * (1,221)Management and administrative expenses (153) (146) (157) (149) (605) (146) (152) (149) (154) * (601)Other operating income 1 2 - 1 4 1 - 6 3 10 Operating profi t (loss) before capitalization and amortization of development costs, amortization and impairment of intangible assets acquired in company acquisitions 132 151 144 229 656 185 223 206 212 826
Capitalized development costs 35 33 39 25 132 32 36 28 46 142 Amortized development costs (25) (26) (30) (37) (118) (30) (25) (24) (28) (107)EBITDA 142 158 153 217 670 187 234 210 230 861 Depreciation and amortization relating to: Production (8) (9) (12) (9) (38) (11) (10) (11) (12) (44)Selling and distribution (3) (3) (4) (2) (12) (3) (3) (4) (4) (14)Administration (19) (18) (14) (20) (71) (19) (17) (19) (21) (76)EBITA 112 128 123 186 549 154 204 176 193 727 Share of profi t (loss) in associates - 3 4 (11) (4) 6 10 9 3 28 Amortization of goodwill (56) (55) (54) (52) (217) (50) (51) (47) (47) (195)Amortization of goodwill relating to capitalization of tax loss not previously recognized in company acquistion - - - (66) (66) - - - - - Amortization of other intangible assets acquired in company acquisitions (9) (8) (10) (9) (36) (7) (8) (8) (7) (30)Restructuring (7) (100) (8) (25) (140) - - - - - Earnings before interest and tax (EBIT) 40 (32) 55 23 86 103 155 130 142 530 Gain on disposal of property - - 57 - 57 - - - - - Gains on disposal of discontinuing operations - 68 - 7 75 - 9 - 30 39 Capital gains/(losses) on shares, dividends 1 2 - 4 7 3 (1) - - 2 Interest income and similar items 22 16 1 133 172 8 9 6 7 30 Interest expense and similar items (39) (23) (10) (62) (134) (14) (20) (19) (16) (69)Earnings before tax (EBT) 24 31 103 105 263 100 152 117 163 532 Margins: Gross profi t margin 55.6% 56.0% 55.6% 54.4% 55.4% 55.6% 54.2% 49.0% 54.0% 53.1%EBITA margin 9.8% 11.1% 10.8% 14.2% 11.6% 12.5% 14.8% 12.1% 13.1% 13.1%EBITA margin, excl. capitalization and amortization of development costs 8.9% 10.5% 10.1% 15.1% 11.3% 12.3% 14.0% 11.8% 11.8% 12.5%
*) The above accounting items for Q4 2004 include provision for rental obligations relating to vacation of leases in the amount of DKK 30 million. The rental obligation is distributed by function.
Investor-specifi c income statement per quarterly period
qq Back to contents
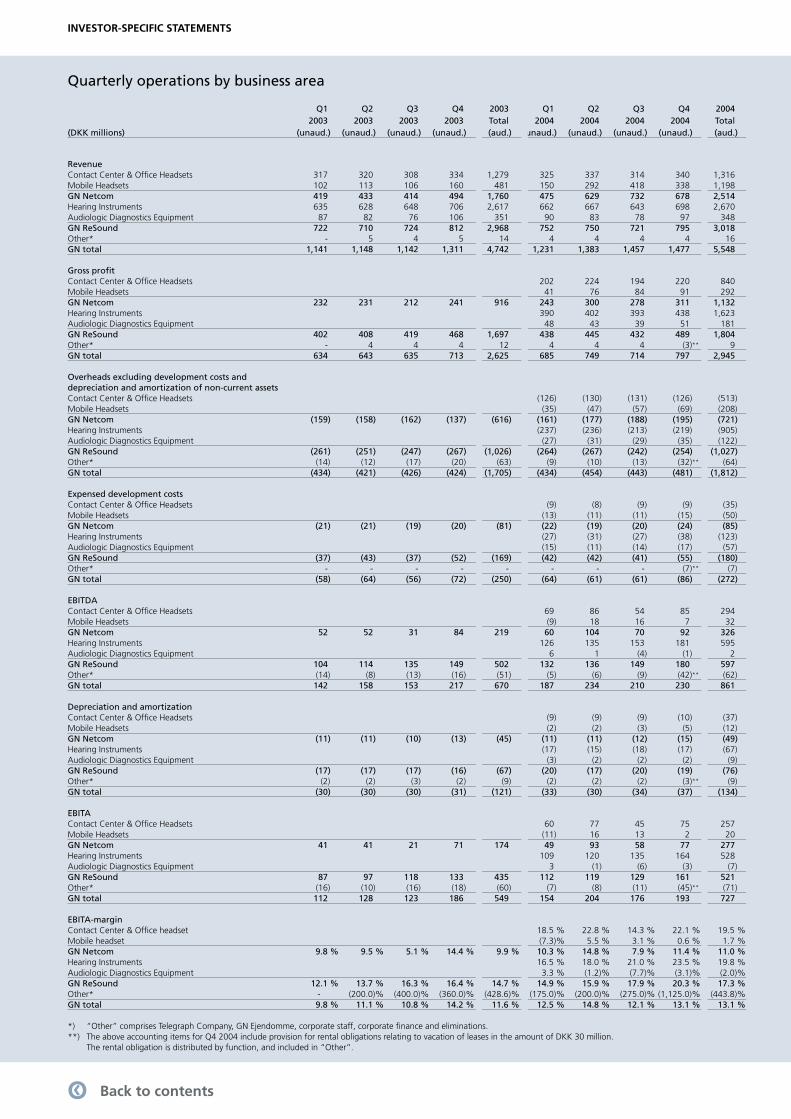
24 GN Store Nord – Annual Report 2004
Q1 Q2 Q3 Q4 2003 Q1 Q2 Q3 Q4 2004 2003 2003 2003 2003 Total 2004 2004 2004 2004 Total(DKK millions) (unaud.) (unaud.) (unaud.) (unaud.) (aud.) (unaud.) (unaud.) (unaud.) (unaud.) (aud.)
Revenue Contact Center & Offi ce Headsets 317 320 308 334 1,279 325 337 314 340 1,316 Mobile Headsets 102 113 106 160 481 150 292 418 338 1,198 GN Netcom 419 433 414 494 1,760 475 629 732 678 2,514 Hearing Instruments 635 628 648 706 2,617 662 667 643 698 2,670 Audiologic Diagnostics Equipment 87 82 76 106 351 90 83 78 97 348 GN ReSound 722 710 724 812 2,968 752 750 721 795 3,018 Other* - 5 4 5 14 4 4 4 4 16 GN total 1,141 1,148 1,142 1,311 4,742 1,231 1,383 1,457 1,477 5,548 Gross profi t Contact Center & Offi ce Headsets 202 224 194 220 840 Mobile Headsets 41 76 84 91 292 GN Netcom 232 231 212 241 916 243 300 278 311 1,132 Hearing Instruments 390 402 393 438 1,623 Audiologic Diagnostics Equipment 48 43 39 51 181 GN ReSound 402 408 419 468 1,697 438 445 432 489 1,804 Other* - 4 4 4 12 4 4 4 (3)** 9 GN total 634 643 635 713 2,625 685 749 714 797 2,945 Overheads excluding development costs and depreciation and amortization of non-current assets Contact Center & Offi ce Headsets (126) (130) (131) (126) (513)Mobile Headsets (35) (47) (57) (69) (208)GN Netcom (159) (158) (162) (137) (616) (161) (177) (188) (195) (721)Hearing Instruments (237) (236) (213) (219) (905)Audiologic Diagnostics Equipment (27) (31) (29) (35) (122)GN ReSound (261) (251) (247) (267) (1,026) (264) (267) (242) (254) (1,027)Other* (14) (12) (17) (20) (63) (9) (10) (13) (32)** (64)GN total (434) (421) (426) (424) (1,705) (434) (454) (443) (481) (1,812) Expensed development costs Contact Center & Offi ce Headsets (9) (8) (9) (9) (35)Mobile Headsets (13) (11) (11) (15) (50)GN Netcom (21) (21) (19) (20) (81) (22) (19) (20) (24) (85)Hearing Instruments (27) (31) (27) (38) (123)Audiologic Diagnostics Equipment (15) (11) (14) (17) (57)GN ReSound (37) (43) (37) (52) (169) (42) (42) (41) (55) (180)Other* - - - - - - - - (7)** (7)GN total (58) (64) (56) (72) (250) (64) (61) (61) (86) (272) EBITDA Contact Center & Offi ce Headsets 69 86 54 85 294 Mobile Headsets (9) 18 16 7 32 GN Netcom 52 52 31 84 219 60 104 70 92 326 Hearing Instruments 126 135 153 181 595 Audiologic Diagnostics Equipment 6 1 (4) (1) 2 GN ReSound 104 114 135 149 502 132 136 149 180 597 Other* (14) (8) (13) (16) (51) (5) (6) (9) (42)** (62)GN total 142 158 153 217 670 187 234 210 230 861 Depreciation and amortization Contact Center & Offi ce Headsets (9) (9) (9) (10) (37)Mobile Headsets (2) (2) (3) (5) (12)GN Netcom (11) (11) (10) (13) (45) (11) (11) (12) (15) (49)Hearing Instruments (17) (15) (18) (17) (67)Audiologic Diagnostics Equipment (3) (2) (2) (2) (9)GN ReSound (17) (17) (17) (16) (67) (20) (17) (20) (19) (76)Other* (2) (2) (3) (2) (9) (2) (2) (2) (3)** (9)GN total (30) (30) (30) (31) (121) (33) (30) (34) (37) (134) EBITA Contact Center & Offi ce Headsets 60 77 45 75 257 Mobile Headsets (11) 16 13 2 20 GN Netcom 41 41 21 71 174 49 93 58 77 277 Hearing Instruments 109 120 135 164 528 Audiologic Diagnostics Equipment 3 (1) (6) (3) (7)GN ReSound 87 97 118 133 435 112 119 129 161 521 Other* (16) (10) (16) (18) (60) (7) (8) (11) (45)** (71)GN total 112 128 123 186 549 154 204 176 193 727 EBITA-margin Contact Center & Offi ce headset 18.5 % 22.8 % 14.3 % 22.1 % 19.5 %Mobile headset (7.3)% 5.5 % 3.1 % 0.6 % 1.7 %GN Netcom 9.8 % 9.5 % 5.1 % 14.4 % 9.9 % 10.3 % 14.8 % 7.9 % 11.4 % 11.0 %Hearing Instruments 16.5 % 18.0 % 21.0 % 23.5 % 19.8 %Audiologic Diagnostics Equipment 3.3 % (1.2)% (7.7)% (3.1)% (2.0)%GN ReSound 12.1 % 13.7 % 16.3 % 16.4 % 14.7 % 14.9 % 15.9 % 17.9 % 20.3 % 17.3 %Other* - (200.0)% (400.0)% (360.0)% (428.6)% (175.0)% (200.0)% (275.0)% (1,125.0)% (443.8)%GN total 9.8 % 11.1 % 10.8 % 14.2 % 11.6 % 12.5 % 14.8 % 12.1 % 13.1 % 13.1 %
*) “Other” comprises Telegraph Company, GN Ejendomme, corporate staff, corporate fi nance and eliminations.**) The above accounting items for Q4 2004 include provision for rental obligations relating to vacation of leases in the amount of DKK 30 million.
The rental obligation is distributed by function, and included in “Other”.
INVESTOR-SPECIFIC STATEMENTS
Quarterly operations by business area
qq Back to contents
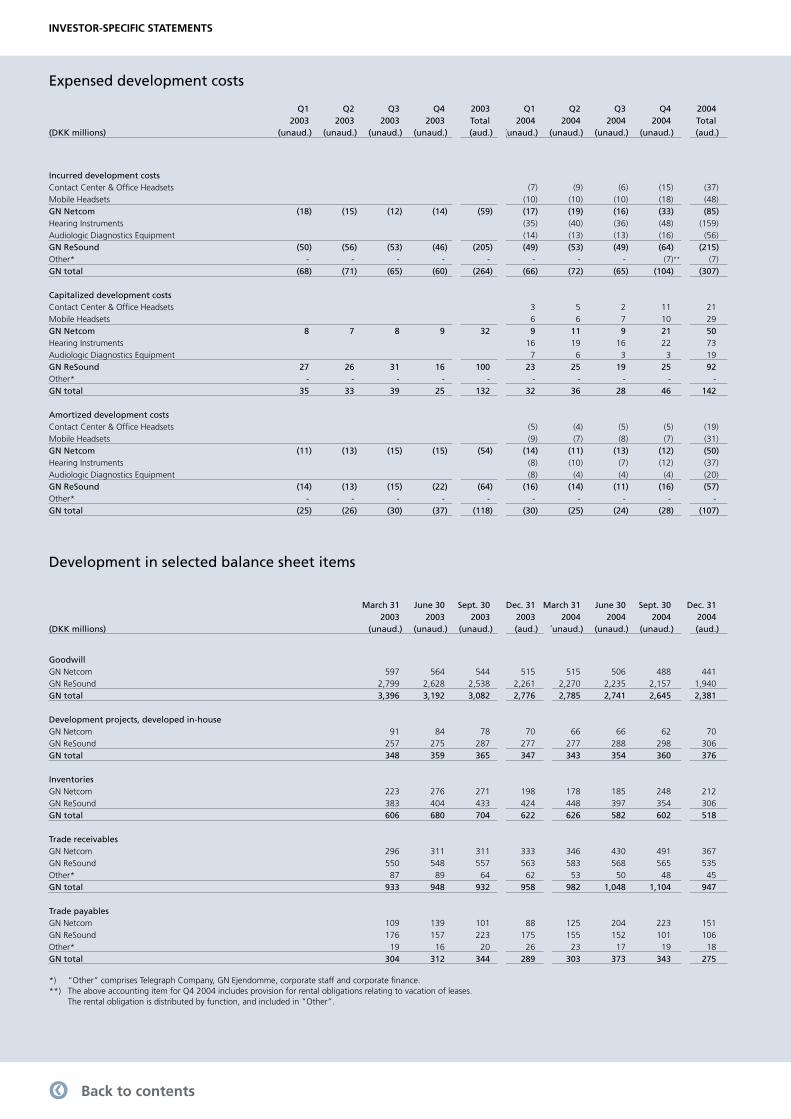
25GN Store Nord – Annual Report 2004
Q1 Q2 Q3 Q4 2003 Q1 Q2 Q3 Q4 2004 2003 2003 2003 2003 Total 2004 2004 2004 2004 Total(DKK millions) (unaud.) (unaud.) (unaud.) (unaud.) (aud.) (unaud.) (unaud.) (unaud.) (unaud.) (aud.)
Incurred development costs Contact Center & Offi ce Headsets (7) (9) (6) (15) (37)Mobile Headsets (10) (10) (10) (18) (48)GN Netcom (18) (15) (12) (14) (59) (17) (19) (16) (33) (85)Hearing Instruments (35) (40) (36) (48) (159)Audiologic Diagnostics Equipment (14) (13) (13) (16) (56)GN ReSound (50) (56) (53) (46) (205) (49) (53) (49) (64) (215)Other* - - - - - - - - (7)** (7)GN total (68) (71) (65) (60) (264) (66) (72) (65) (104) (307) Capitalized development costs Contact Center & Offi ce Headsets 3 5 2 11 21 Mobile Headsets 6 6 7 10 29 GN Netcom 8 7 8 9 32 9 11 9 21 50 Hearing Instruments 16 19 16 22 73 Audiologic Diagnostics Equipment 7 6 3 3 19 GN ReSound 27 26 31 16 100 23 25 19 25 92 Other* - - - - - - - - - - GN total 35 33 39 25 132 32 36 28 46 142 Amortized development costs Contact Center & Offi ce Headsets (5) (4) (5) (5) (19)Mobile Headsets (9) (7) (8) (7) (31)GN Netcom (11) (13) (15) (15) (54) (14) (11) (13) (12) (50)Hearing Instruments (8) (10) (7) (12) (37)Audiologic Diagnostics Equipment (8) (4) (4) (4) (20)GN ReSound (14) (13) (15) (22) (64) (16) (14) (11) (16) (57)Other* - - - - - - - - - - GN total (25) (26) (30) (37) (118) (30) (25) (24) (28) (107)
March 31 June 30 Sept. 30 Dec. 31 March 31 June 30 Sept. 30 Dec. 31 2003 2003 2003 2003 2004 2004 2004 2004(DKK millions) (unaud.) (unaud.) (unaud.) (aud.) (unaud.) (unaud.) (unaud.) (aud.)
Goodwill GN Netcom 597 564 544 515 515 506 488 441 GN ReSound 2,799 2,628 2,538 2,261 2,270 2,235 2,157 1,940 GN total 3,396 3,192 3,082 2,776 2,785 2,741 2,645 2,381 Development projects, developed in-house GN Netcom 91 84 78 70 66 66 62 70 GN ReSound 257 275 287 277 277 288 298 306 GN total 348 359 365 347 343 354 360 376 Inventories GN Netcom 223 276 271 198 178 185 248 212 GN ReSound 383 404 433 424 448 397 354 306 GN total 606 680 704 622 626 582 602 518 Trade receivables GN Netcom 296 311 311 333 346 430 491 367 GN ReSound 550 548 557 563 583 568 565 535 Other* 87 89 64 62 53 50 48 45 GN total 933 948 932 958 982 1,048 1,104 947 Trade payables GN Netcom 109 139 101 88 125 204 223 151 GN ReSound 176 157 223 175 155 152 101 106 Other* 19 16 20 26 23 17 19 18 GN total 304 312 344 289 303 373 343 275
*) “Other” comprises Telegraph Company, GN Ejendomme, corporate staff and corporate fi nance.**) The above accounting item for Q4 2004 includes provision for rental obligations relating to vacation of leases.
The rental obligation is distributed by function, and included in “Other”.
Development in selected balance sheet items
INVESTOR-SPECIFIC STATEMENTS
Expensed development costs
qq Back to contents
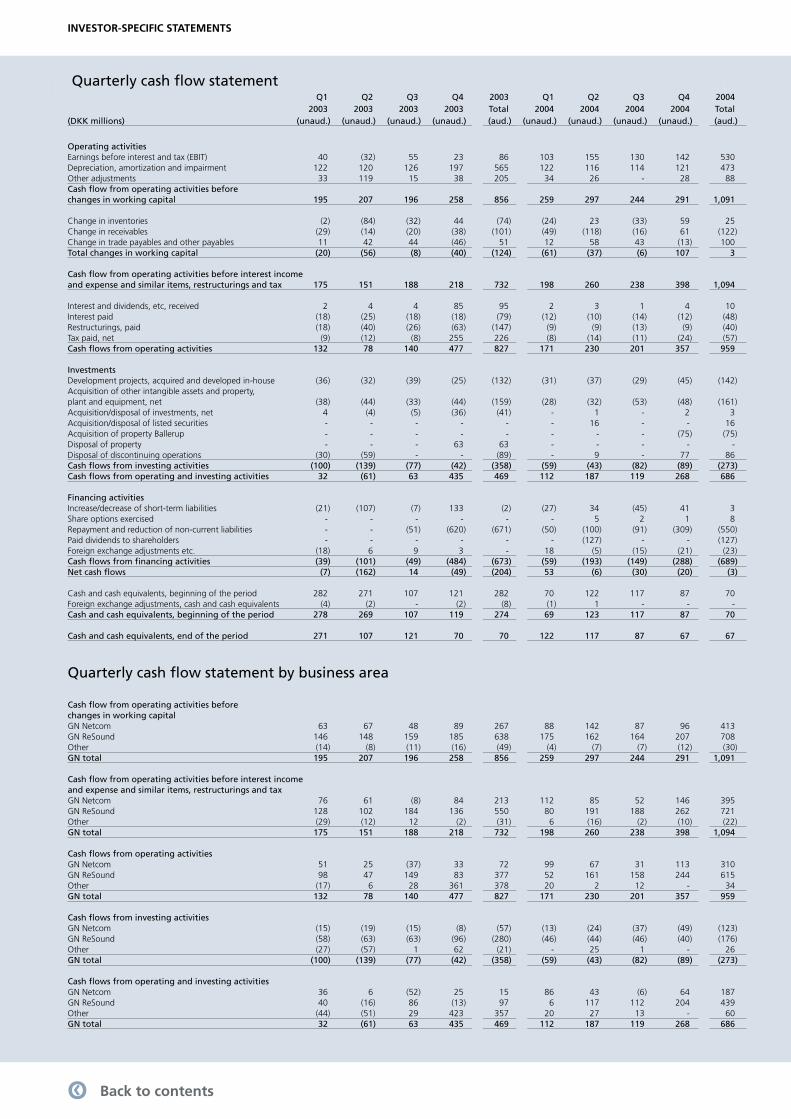
26 GN Store Nord – Annual Report 2004
Q1 Q2 Q3 Q4 2003 Q1 Q2 Q3 Q4 2004 2003 2003 2003 2003 Total 2004 2004 2004 2004 Total(DKK millions) (unaud.) (unaud.) (unaud.) (unaud.) (aud.) (unaud.) (unaud.) (unaud.) (unaud.) (aud.)
Operating activities Earnings before interest and tax (EBIT) 40 (32) 55 23 86 103 155 130 142 530 Depreciation, amortization and impairment 122 120 126 197 565 122 116 114 121 473 Other adjustments 33 119 15 38 205 34 26 - 28 88 Cash fl ow from operating activities before changes in working capital 195 207 196 258 856 259 297 244 291 1,091 Change in inventories (2) (84) (32) 44 (74) (24) 23 (33) 59 25 Change in receivables (29) (14) (20) (38) (101) (49) (118) (16) 61 (122)Change in trade payables and other payables 11 42 44 (46) 51 12 58 43 (13) 100 Total changes in working capital (20) (56) (8) (40) (124) (61) (37) (6) 107 3 Cash fl ow from operating activities before interest income and expense and similar items, restructurings and tax 175 151 188 218 732 198 260 238 398 1,094 Interest and dividends, etc, received 2 4 4 85 95 2 3 1 4 10 Interest paid (18) (25) (18) (18) (79) (12) (10) (14) (12) (48)Restructurings, paid (18) (40) (26) (63) (147) (9) (9) (13) (9) (40)Tax paid, net (9) (12) (8) 255 226 (8) (14) (11) (24) (57)Cash fl ows from operating activities 132 78 140 477 827 171 230 201 357 959 Investments Development projects, acquired and developed in-house (36) (32) (39) (25) (132) (31) (37) (29) (45) (142)Acquisition of other intangible assets and property, plant and equipment, net (38) (44) (33) (44) (159) (28) (32) (53) (48) (161)Acquisition/disposal of investments, net 4 (4) (5) (36) (41) - 1 - 2 3 Acquisition/disposal of listed securities - - - - - - 16 - - 16 Acquisition of property Ballerup - - - - - - - - (75) (75)Disposal of property - - - 63 63 - - - - - Disposal of discontinuing operations (30) (59) - - (89) - 9 - 77 86 Cash fl ows from investing activities (100) (139) (77) (42) (358) (59) (43) (82) (89) (273)Cash fl ows from operating and investing activities 32 (61) 63 435 469 112 187 119 268 686 Financing activities Increase/decrease of short-term liabilities (21) (107) (7) 133 (2) (27) 34 (45) 41 3 Share options exercised - - - - - - 5 2 1 8 Repayment and reduction of non-current liabilities - - (51) (620) (671) (50) (100) (91) (309) (550)Paid dividends to shareholders - - - - - - (127) - - (127)Foreign exchange adjustments etc. (18) 6 9 3 - 18 (5) (15) (21) (23)Cash fl ows from fi nancing activities (39) (101) (49) (484) (673) (59) (193) (149) (288) (689)Net cash fl ows (7) (162) 14 (49) (204) 53 (6) (30) (20) (3) Cash and cash equivalents, beginning of the period 282 271 107 121 282 70 122 117 87 70 Foreign exchange adjustments, cash and cash equivalents (4) (2) - (2) (8) (1) 1 - - - Cash and cash equivalents, beginning of the period 278 269 107 119 274 69 123 117 87 70 Cash and cash equivalents, end of the period 271 107 121 70 70 122 117 87 67 67
Cash fl ow from operating activities before changes in working capital GN Netcom 63 67 48 89 267 88 142 87 96 413 GN ReSound 146 148 159 185 638 175 162 164 207 708 Other (14) (8) (11) (16) (49) (4) (7) (7) (12) (30)GN total 195 207 196 258 856 259 297 244 291 1,091 Cash fl ow from operating activities before interest income and expense and similar items, restructurings and tax GN Netcom 76 61 (8) 84 213 112 85 52 146 395 GN ReSound 128 102 184 136 550 80 191 188 262 721 Other (29) (12) 12 (2) (31) 6 (16) (2) (10) (22)GN total 175 151 188 218 732 198 260 238 398 1,094 Cash fl ows from operating activities GN Netcom 51 25 (37) 33 72 99 67 31 113 310 GN ReSound 98 47 149 83 377 52 161 158 244 615 Other (17) 6 28 361 378 20 2 12 - 34 GN total 132 78 140 477 827 171 230 201 357 959 Cash fl ows from investing activities GN Netcom (15) (19) (15) (8) (57) (13) (24) (37) (49) (123)GN ReSound (58) (63) (63) (96) (280) (46) (44) (46) (40) (176)Other (27) (57) 1 62 (21) - 25 1 - 26 GN total (100) (139) (77) (42) (358) (59) (43) (82) (89) (273) Cash fl ows from operating and investing activities GN Netcom 36 6 (52) 25 15 86 43 (6) 64 187 GN ReSound 40 (16) 86 (13) 97 6 117 112 204 439 Other (44) (51) 29 423 357 20 27 13 - 60 GN total 32 (61) 63 435 469 112 187 119 268 686
Quarterly cash fl ow statement by business area
INVESTOR-SPECIFIC STATEMENTS
Quarterly cash fl ow statement
qq Back to contents

27qq Back to contents
28 GN Store Nord – Annual Report 2004
Accounting policies in general
The annual report of GN Store Nord A/S is pre-sented in accordance with International Finan-cial Reporting Standards (IFRS) and additional Danish fi nancial reporting requirements for listed companies. Additional fi nancial reporting requirements comprise the Danish Financial Statements Act’s requirements for listed compa-nies and the Copenhagen Stock Exchange’s an-nual report requirements for listed companies.
The annual report is presented within the framework of the accounting standards ad-opted in the EU.
In previous years the annual report was pre-sented in accordance with the Danish Financial Statements Act, Danish Accounting Standards and International Accounting Standards as the primary accounting basis. The change in the primary accounting basis has not affected the accounting policies, except for the effect of the implementation in 2004 of IFRS 2 on share-based payment.
The accounting standards effective as of December 31, 2004, are used. In addition, IFRS 2, Share-based Payment, has been imple-mented before the effective date. No other new or revised accounting standards have been implemented before the effective date.
The Group has not acquired any companies in the period after March 31, 2004. Accord-ingly, the accounting treatment of business combinations, including goodwill, is in ac-cordance with IAS 22, Business Combinations, at the standard in 2004 applies to the accoun-ting for business combinations made no later than March 31, 2004.
In accordance with IFRS 2 the value of ser-vices received in exchange for incentive plans is measured at the fair value of the options granted. For equity-settled plans with options granted after November 7, 2002, fair value is measured at the grant date. The amount is recognized as a salary cost in the income statement over the period in which the op-tions vest with a corresponding increase in eq-uity. Comparative fi gures for 2003 have been restated in respect of these incentive plans. For 2003 the effect on profi t for the year was DKK 5 million, corresponding to an increase in staff costs of DKK 7 million and a tax reduction of DKK 2 million. Equity was increased by DKK 2 million, which corresponds to the tax effect of the change in accounting policy. In accor-dance with the transitional provisions of IFRS 2, options granted before November 7, 2002, are not recognized and comparative fi gures in respect of these plans are not restated.
Except for the above change, the annual re-port is presented in accordance with the same accounting policies applied in previous years.
Change in classifi cation
The following change and reclassifi cation has been incorporated into the presentation format and restatement of the comparative fi gures for 2003:• Deferred tax liabilities, pensions and similar
liabilities and other provisions are no longer presented as a separate main classifi cation (provisions) in the balance sheet, but are recognized in non-current and current lia-bilities.
The reclassifi cation has not affected profi t for the year and equity.
Consolidated fi nancial statements
The consolidated financial statements relate to the parent company, GN Store Nord A/S, and the subsidiaries in which GN Store Nord A/S directly or indirectly holds more than 50% of the voting rights or which it, in some other way, controls. Enterprises in which the Group holds between 20% and 50% of the voting rights and over which it exercises significant influence are considered associ-ates. Group companies are listed on page 58.
The consolidated financial statements are prepared as a consolida tion of the financial statements of the parent company and those of the individual subsidiaries, all of which are presented in accordance with the Group’s accounting policies. Intra-group income and ex penses, shareholdings, intra-group balances and dividends, and real ized and unrealized gains and losses on intra-group transactions are eliminated.
On consolidation, the carrying amount of shares held by the par ent company in subsi-diaries is set off against the subsidiaries’ equity. Projects and companies established as joint ventures with joint con trol are accounted for by proportionate consolidation.
Business combinations
Enterprises acquired or formed during the year are recognized in the consoli dated financial statements from the date of acquisi-tion or formation. Enterprises disposed of are recognized in the consolidated income state-ment until the date of disposal. The compara-tive figures are not adjusted for acquisitions or disposals.
Acquisitions of enterprises in which the par-ent company will be able to exercise control are accounted for using the purchase meth od, according to which the identifiable assets and liabilities acquired are measured at their fair values at the date of acquisition. Provi sion is made for costs related to adopted and an-nounced plans to restructure the acquired
ACCOUNTING POLICIES
enterprise. The tax effect of the revaluation of assets and provisions is taken into account. Any excess of the cost of the acquisition over the fair value of the identifiable assets and liabilities acquired (goodwill), including restruc-turing provisions, is recognized as an intangible asset and amortized on a systematic ba sis in the income statement based on an individual assessment of the useful life of the asset, not exceeding 20 years. From the fi nancial year 2005 and on, goodwill is no longer to be am-ortized. Any excess of the fair values of the identifiable assets and liabilities acquired over the cost of the acquisition (negative goodwill), representing an anticipated adverse develop-ment in the acquired enterprises, is recognized in the balance sheet as an intangible asset and recognized in the income statement as the ad-verse development is realized. Negative good-will not related to any anticipated adverse de-velopment is recognized in the balance sheet at an amount corresponding to the fair value of non-monetary assets. The amount is subse-quently recognized in the income statement over the average useful lives of the non-mone-tary assets. Negative goodwill that exceeds the fair value of non-monetary assets is recognized as income in the year of acquisition.
The cost of acquisition of goodwill and negative goodwill is ad justed for any changes to the purchase price after the acquisition. Reversal of restructuring provisions included in the determination of goodwill reduces the value of goodwill and negative goodwill. Fur-thermore, if the fair value of assets and liabili-ties acquired on the date of acquisition differs from the fair values assessed on the date of acquisition, goodwill and negative goodwill is adjusted before the end of the financial year following the year of acquisition. Deferred tax assets which are not recognized at the date of acquisition and subsequently qualify for recognition are recognized as income in the income statement under tax for the year. Ac-cordingly, the cost of acquisition of goodwill and accumulated amortization are adjusted as if the deferred tax asset had been recognized at the date of acqui sition. The adjustment is recognized in the income statement under amortization and impairment of goodwill. All other subsequent ad justments are recognized in the income statement.
Gains or losses on disposal of subsidiaries and associates are rec ognized in the income statement and determined as the difference between the sales amount and the carrying amount of net assets at the date of disposal plus non-amortized goodwill and anticipated disposal costs.
qq Back to contents
29GN Store Nord – Annual Report 2004
Other rental and lease matters
When contracts for rent and lease of build-ings and operating assets are of an opera-tional nature, rental and lease payments are recog nized in the income statement for the period to which they relate. The remaining rental and lease obligations under such con-tracts are disclosed as contingent liabilities.
Assets leased under finance leases are rec-ognized in the balance sheet and depreciated in the same way as the Group’s other prop erty, plant and equipment.
Foreign currency translation
Danish kroner are used as the measurement currency. All other cur rencies are classified as foreign currencies. On initial recognition, transactions denominated in foreign curren-cies are translated at the exchange rates at the transaction date.
Foreign exchange differences arising be-tween the exchange rates at the trans action date and at the date of payment are recog-nized in the income statement as interest income or expense and similar items. Receivables and payables and other monetary items denomi nated in foreign currencies are translated at the exchange rates at the bal-ance sheet date. Differences arising between the exchange rates at the balance sheet date and at the date of payment are rec ognized in the income statement as interest income or expense and similar items.
On recognition of foreign subsidiaries and associates which are separate entities, the income statements are translated at the aver-age exchange rates for the month, and the balance sheet items are translated at the ex-change rates at the balance sheet date.
Goodwill arising from the acquisition of a company and any fair value adjustments to the carrying amount of assets and liabilities are recognized at the exchange rates at the date of acquisition.
Foreign exchange differences arising on translation of the opening equity of foreign subsidiaries at the exchange rates at the bal-ance sheet date and on translation of the in-come statements from aver age exchange rates to the exchange rates at the balance sheet date are recognized directly in equity.
Foreign exchange adjustments of intra-group balances with inde pendent foreign subsidiaries, which are considered part of the invest ment in the subsidiary, are recognized directly in equity. Foreign ex change gains and losses on loans and derivative financial instru-ments designated as hedges of investments in foreign subsidiaries are also recognized directly in equity.
On recognition of foreign subsidiaries which are integrated enti ties, income statement items are translated at the exchange rates at the transaction date, although items derived from non-monetary items are translated at historical exchange rates.
Monetary items are translated at the ex-change rates at the balance sheet date and non-monetary items are translated at the ex-change rates at the date of acquisition date or at the date of any subsequent revaluation.
Derivative financial instruments
Derivative financial instruments are initially recognized in the bal ance sheet at cost and are subsequently measured at fair value. Positive and negative fair values of deriva-tive financial instruments are recognized as other receiv ables and payables, respec-tively. Changes in the fair value of derivative financial instruments desig nated as and qualifying for recognition as a hedge of the fair value of a recognized asset or liability are recognized in the income state ment together with changes in the value of the hedged asset or liability.
Changes in the fair value of derivative financial instruments desig nated as and quali-fying for recognition as a hedge of future as-sets or liabilities are recognized as receivables or payables and in equity.
Income and expenses relating to such hedg-ing transactions are transferred from equity on realization of the hedged item and recog nized in the same item as the hedged item.
For derivative financial instruments that do not qualify for hedge accounting, changes in fair value are recognized in the income state-ment when they occur.
Derivative financial instrument are only des-ignated as hedges if the following conditions are met: • There must be a clear correlation between
the purchase/sale of the derivative financial instrument and the accounting items hedged at the time of the transaction or the future transaction. The derivative financial instrument must be expected to effec tively hedge the accounting item dur-ing its entire term.
• The derivative financial instrument must have effectively hedged the accounting item or the future transaction throughout the financial year and at the balance sheet date. If the effectiveness of the hedge can-not be determined, the derivative financial in strument is not recognized as a hedge for accounting purposes.
Changes in the fair value of derivative financial instruments used to hedge net in-vestments in independent foreign subsidiaries or asso ciates are recognized directly in equity.
Basic and diluted earnings per share
Basic earnings per share (EPS) are calculated by dividing the net profit or loss for the year after tax by the weighted average number of shares outstanding during the year.
Diluted EPS is calculated by adding to the weighted average number of shares out-standing the number of additional ordinary shares that would have been out standing assuming the conversion of all dilutive poten-tial shares. The dilutive effect of outstanding share options is calculated using the Treasury Stock method.
Government grants
Government grants relate to grants and funding for R&D activities, investment grants, etc.
Grants for R&D activities, which are recog-nized directly in the income statement, are recognized as development costs, thereby matching the costs for which they compen-sate. Grants for the ac quisition of assets and development activities that are recognized as assets are set off against the cost of the assets for which grants are awarded.
Incentive plans
The Executive Management and a number of executive employees are included in a share option plan (equity-settled plan). A part of the Company’s holding of treasury shares is used for the granting of share options under the Group’s share option plan.
The value of services received in exchange for incentive plans is measured at the fair val-ue of the options granted. Fair value is mea-sured at the grant date and recognized over the period in which the options vest. For the purpose of recognition, an estimate is made of the number of options expected to vest, cf. description in note 34. That estimate is subse-quently revised for changes in the number of options expected to vest. Accordingly, recogni-tion is based on the number of options that ultimately vested.
The amount is recognized as a salary cost with a corresponding increase in equity.
The fair value of granted share options is estimated using the internationally accepted Black-Scholes option pricing model. Vesting conditions are taken into account when esti-mating the fair value of the share options.
qq Back to contents
30 GN Store Nord – Annual Report 2004
Discontinuing operations
Discontinuing operations which the Company pursuant to a single plan is disposing of, ter-minating or abandoning and which can be separated from other activities, are presented separately under seg ment information.
INCOME STATEMENT
Revenue
Revenue from the sale of goods and render-ing of services is recog nized in the income statement provided that delivery and transfer of risk to the buyer has taken place before year-end and that the income can be reliably measured and is expected to be received. Extended warranties are recognized over the term of the contract.
Revenue is measured excluding VAT, taxes and granted cash and quantity discounts in relation to the sale.
Production costs
Production costs comprise costs, including depreciation and salaries, incurred in generat-ing the revenue for the year.
Production costs include direct and indirect costs for raw materials and consumables, wages and salaries, maintenance and depre -c iation and impairment of production plant and costs and expenses relating to the opera-tion, administration and management of facto-ries. Also included are inventory write-downs.
R&D costs
R&D costs comprise costs, salaries, and depreciation of operating assets and equip-ment directly or indirectly attributable to the Group’s R&D activities.
Research costs are recognized in the income statement as in curred.
Development projects that are clearly de-fined and identifiable, where the technical utilization degree, sufficient resources and a po tential future market or development opportunities in the Company is evidenced, and where the Company intends to produce, market or use the project, are recognized as intangible assets from the date on which the above-mentioned conditions are satisfied and when the present value of future earnings or the net realizable value is expected to exceed the development costs incurred. The cost of such development projects includes direct wages, salaries, materials and other direct and indirect costs attributable to the development proj ects. Amortization and write-down of such capitalized development projects are started at the date of completion and are included in R&D costs. Other development costs are rec-ognized in the income statement as incurred.
Selling and distribution costs
Selling and distribution costs comprise costs relating to the sale and distribution of pro-ducts and services, including salaries, sales com missions, advertising and marketing costs, depreciation and impair ment, etc.
Management and administrative expenses
Management and administrative expenses comprise expenses incurred for Group management and administration, including ex penses for administrative staff and man-agement, office expenses, and depreciation and impairment, etc. Also included are losses on receivables.
Amortization and impairment of goodwill
and other intangible assets acquired in
company acquisitions
Amortization and impairment of goodwill and other intangible as sets acquired in com-pany acquisitions comprise amortization and impairment of goodwill and other intangible assets identified as separate assets and recognized at fair value in connection with acquisitions.
Restructurings
Restructuring costs relating to acquired com-panies are included in the determination of goodwill when the restructuring has been decided on and announced on the date of acquisition. Other restructuring costs are provided for and recognized in the income statement when they have been decided on and announced.
Restructuring costs for the year are recog-nized in the income state ment in restructuring to the extent that the costs are attributable to restructurings relating to disposal or termina-tion of a line of business, closing of business premises or transfer of activities from one country to another and significant changes in management structure or other material matters which have a significant effect on the Group’s activi ties.
Other restructuring costs are recognized in the income statement under the items to which they are attributable.
Profit/loss from investments in
subsidiaries and associates
The proportionate share of the profit/loss before tax of the indi vidual subsidiaries is recognized in the income statement of the parent company less amortization of good-will. The share of the taxes of subsidiaries is recognized as tax on profit/loss from ordinary activities.
The proportionate share of the profit/loss
before tax of associates is recognized in both the parent company and the consolidated in-come statement less amortization of goodwill and after elimination of the proportionate share of intra-group profits/losses.
The share of the taxes of associates is rec-ognized as tax on profit/ loss from ordinary activities.
Interest income and expense and similar
items
Interest income and expense and similar items comprise interest income and expense, gains and losses on securities, payables and transactions denominated in foreign cur-rencies, amortization of financial assets and liabilities as well as surcharges and refunds under the on-account tax scheme, etc. Also included are realized and unrealized gains and losses on derivative financial instruments which are not designated as hedges.
Tax on profit/loss for the year
The parent company is jointly taxed with a number of Danish and foreign subsidiar-ies. The parent company makes provisions for and pays the total Danish tax on these companies’ taxable income. The parent com-pany also makes provisions for deferred tax for the Dan ish companies. The jointly taxed companies are taxed under the on-account tax scheme.
Tax for the year comprises current tax and changes in deferred tax for the year. The tax expense relating to the profit/loss for the year is recognized in the income statement, and the tax expense relating to amounts directly recognized in equity is recognized directly in equity. Current tax payable is recognized in current liabilities and deferred tax is recog-nized in provisions. Tax receivable is recognized in receiv ables and deferred tax assets are rec-ognized in investments.
Deferred tax is measured using the balance sheet liability method on all temporary dif-ferences between the carrying amount and the tax base of assets and liabilities. Deferred tax also includes the tax value of tax losses in jointly taxed foreign companies which may be clawed back when disposing of shareholdings or when Danish joint taxation is no longer ap-plicable.
Deferred tax assets, including the tax base of tax loss carryfor wards, are recognized at the expected value of their utilization; either as a set-off against tax on future income or as a set-off against de ferred tax liabilities in the same legal tax entity and jurisdiction.
Deferred tax is not recognized on goodwill unless this is deductible for tax purposes.
ACCOUNTING POLICIES
qq Back to contents
31GN Store Nord – Annual Report 2004
Deferred tax is measured according to the tax rules and at the tax rates applicable in the respective countries at the balance sheet date when the deferred tax is expected to crystallize as current tax. The change in deferred tax as a result of changes in tax rates is recog nized in the income statement.
BALANCE SHEET
Intangible assets
Intangible assets are measured at cost less accumulated amortiza tion and impairment. Intangible assets include telecommunications systems which are not in the legal ownership of the Group, but from which the Group is contractually entitled to receive revenue.
Amortization of the following intangible assets is provided on a straight-line basis over the expected useful lives of the assets. The expected useful lives are as follows:
Goodwill up to 20 years Completed development projects 2-5 years Software 3-5 years Patents, licenses, trademarks and other intellectual property rights up to 20 years
The amortization period of goodwill is de-termined on the basis of management’s experience in the Group’s business areas and reflects management’s best estimate of the expected useful life of the goodwill.
Amortization of telecommunications sys-tems reflects utilization during the period in the form of actual traffic as compared to total forecast traffic over the term of the contract. The carrying amount of a telecommunica-tions system may, however, not exceed what it would have been had amortization been provided on a straight-line basis over the expected useful lives of the assets (contract term). The expected useful lives of telecom-munications systems are as follows:
Telecommunications systems 5-15 years
Gains or losses on the disposal of intangible assets are determined as the difference be-tween the selling price less selling costs and the carrying amount at the disposal date, and are recognized in the income statement as other operating income or other operating costs, respectively.
Property, plant and equipment
Property, machinery, equipment etc. are measured at cost less de preciation and im-pairment.
Cost includes the cost of acquisition and cost of materials, compo nents, subcontractor
services, direct wages and salaries, and indirect production costs. Interest and other borrowing costs are not included in the cost of acquisi-tion.
The cost of assets leased under finance leases is stated at the low er of fair value and the present value of the future lease payments at the time of acquisition. For the calculation of the net present value, the interest rate im-plicit in the lease or an approximation thereof is used as discount rate.
Depreciation of property, plant and equip-ment is provided on a straight-line basis over the expected useful lives of the assets. In cal culating depreciation on buildings, an esti-mated scrap value is used.
The expected useful lives are as follows:
Buildings and installations 10-50 years Leasehold improvements 5-20 years Plant and machinery 3-15 years Operating assets and equipment 2-7 years Land is not depreciated.
Gains and losses on the disposal or retirement of an item of proper ty, plant and equipment are determined as the difference between the selling price less costs of dismantling and dis-posal of the item and restoring the site and the carrying amount at the date of dis posal. The gains or losses are recognized in the income statement as other operating income or other operating costs, respectively.
Investments
Investments in subsidiaries and associates are measured using the equity method. Investments in subsidiaries and associates are mea sured in the balance sheet at the proportionate share of the enter prises’ eq-uity calculated in accordance with the par-ent company’s accounting policies less the proportionate share of unrealized intra group profits and losses and plus non-amortized goodwill.
Subsidiaries and associates with negative equity are measured at DKK 0 (nil), and any amounts owed by such enterprises are written down by the parent company’s/the Group’s share of the negative equity if the amount owed is considered irrecoverable. Where the negative equity exceeds the amount owed, the remaining amount is recognized in provi-sions if the Group has a legal or constructive obligation.
Net revaluation of investments in subsidiar-ies and associates is transferred to the reserve for net revaluation in equity according to the equity method to the extent that the carrying amount exceeds cost. Other securities are
measured at fair value, where such value can be reliably measured, or at cost.
Impairment
The carrying amount of intangible assets, property, plant and equip ment and invest-ments is subject to an impairment test on an ongo ing basis, at least annually. If indications of impairment are present, the asset’s recov-erable amount is assessed. The recoverable amount is the higher of an asset’s net selling price and its value in use. An impairment loss is recognized when the carrying amount of the as set or its cash-generating unit exceeds the recoverable amount of the asset or the cash-generating unit. Impairment losses are recog nized in the income statement.
Inventories
Raw materials and goods for resale are measured at cost in accor dance with the FIFO method. Finished goods are measured at cost in accordance with the FIFO met-hod. Cost includes direct materials, wages and salaries and indirect production costs. Where the net realizable value is lower than cost, inventories are written down to this lower value.
Receivables
Receivables are measured at amortized cost. Write-down is made for expected bad debt losses.
Listed securities
Listed securities, recognized as current assets, are measured at fair value at the balance sheet date.
Equity
Dividends
Proposed dividends are recognized as a li-ability at the date they are adopted by the annual general meeting (declaration date). The expected dividend payment for the year is disclosed as a separate item in equity.
Treasury shares
Cost of acquisition, consideration received and dividends received from treasury shares are recognized directly as retained earnings in equity. Accordingly, gains and losses from sale are not recognized in the income statement. Capital reductions from the cancellation of treasury shares are deducted from the share capital in an amount corresponding to the nominal value of the shares.
qq Back to contents
32 GN Store Nord – Annual Report 2004
Pensions
Contributions to defined contribution plans are recognized in the income statement in the period to which they relate and any con-tributions outstanding are recognized in the balance sheet as other payables.
Defined benefit plans are subject to an an-nual actuarial estimate of the present value of future benefits under the defined benefit plan. The present value is determined on the basis of assumptions about the future development in variables such as salary levels, inter est rates, inflation and mortality. The present value is de-termined only for benefits earned by employ-ees from their employment with the Group.
The actuarial present value less the fair value of any plan assets is recognized in the balance sheet in pensions, cf. below. Any differ ence between the expected development in plan assets and the de fined benefit obliga-tion and actual amounts result in actuarial gains or losses.
If the cumulative actuarial gains or losses exceed the greater of 10% of the defined benefit obligation or 10% of the fair value of the plan assets, the gains or losses are recognized in the income statement over the expected remaining working lives of the employ ees. Actuarial gains or losses not ex-ceeding the above limits are not recognized in the income statement.
If changes in benefits relating to services rendered by employees in previous years result in changes in the actuarial present value, the changes are recognized as historical costs. Historical costs are recog nized in the income statement of the year provided employees have already earned the changed benefits. If employees have not earned the benefits, the historical costs are recognized in the income state ment over the period in which the changed benefits are earned by the em-ployees.
Other provisions
Provisions are recognized when as a result of events in the finan cial year or in previous years the Group has an obligation and it is probable that setting the obligation would require an outflow of resources embodying economic benefits.
Other provisions for restructuring obligati ons include obligations relating to the acquirer as part of an acquisition, as well as those re structur-ings that relate to publicly announced decisions to restructure existing business units. Such provi-sions are recognized in the income statement.
Provisions for warranties are measured and recognized based on past experience. Provi-
sions expected to be maintained for more than one year from the balance sheet date are discounted when ap propriate.
Financial liabilities
Amounts owed to mortgage credit institu-tions and banks are rec ognized at the date of borrowing at the net proceeds received less transaction costs paid.
In subsequent periods, the financial liabi-lities are measured at am ortized cost, cor-responding to the capitalized value using the effec tive interest rate. Accordingly, the differ-ence between the proceeds and the nominal value is recognized in the income statement over the term of the loan.
Financial liabilities also include the capital-ized residual obligation on finance leases. Other liabilities, comprising trade payables, amounts owed to group enterprises and asso-ciates as well as other payables, are measured at amortized cost.
Received prepayments
Received prepayments, recognized in liabili-ties, comprise payments received concerning income in subsequent years.
CASH FLOW STATEMENT
The cash flow statement is presented using the indirect method based on the operating profit/loss. The cash flow statement shows the cash flows from operating, investing and financing activities for the year, the year’s changes in cash and cash equivalents as well as the cash and cash equivalents at the be-ginning and end of the year.
The cash flow effect of acquisitions and disposals of enterprises is shown separately in cash flows from investing activities. Cash flows from acquisitions of enterprises are recognized in the cash flow statement from the date of acquisition. Cash flows from disposals of enterprises are recognized up until the date of disposal.
Cash flows from operating activities com-prise cash flows from the year’s operations adjusted for non-cash operating items and changes in working capital. Working capital comprises current assets excluding items stat-ed as cash and cash equivalents and excluding tax receivable, as well as current liabilities less repayment of non-current liabilities, bank loans and tax payable. Cash flows from invest-ing activities comprise payments in connection with acquisitions and dis posals of non-current assets, including investments.
Cash flows from financing activities com-prise amounts received from shareholders
ACCOUNTING POLICIES
and payment of dividends to shareholders and raising and repayment of long-term and short-term loans which are not included in the working capital.
Cash and cash equivalents comprise cash and short-term market able securities with a term of three months or less which are subject to an insignificant risk of changes in value.
SEGMENT INFORMATION
The Group’s main activities and primary seg-ment comprise: • GN Netcom (Contact Center & Office
Headsets and Mobile Headsets) • GN ReSound (Hearing Instruments and
Audiologic Diagnostics Equipment)
The Group’s secondary segments comprise:
• Denmark• Rest of Nordic region • Rest of Europe • North and South America • Asia and rest of world
Assets are identified by secondary segments. Segment information is based on the
Group’s accounting poli cies, risks and internal financial management. Segment revenue and expense and segment assets and liabilities comprise items directly attributable to a seg-ment and items which can be allocated to a seg ment on a reasonable basis. Unallocated items primarily comprise assets and liabilities and revenue and expense relating to the Group’s administrative functions, investing activities, income taxes etc.
Non-current segment assets comprise non-current assets used di rectly in the operating activities of the segment, including intangible assets, property, plant and equipment and investments in associates.
Current segment assets comprise current assets used directly in the operating activities of the segment, including inventories, trade receivables, other receivables, prepayments and cash and cash equivalents.
Segment liabilities comprise liabilities re-sulting from the operating activities of the segment, including trade payables and other pay ables.
KEY RATIOS
Key ratios are calculated in accordance with the Danish Society of Financial Analysts’ guidelines on the calculation of key ratios “Recommendations and Financial Ratios 2005”. The key ratios stated in the survey of consolidated financial highlights are defined on the inside of the back cover.
qq Back to contents
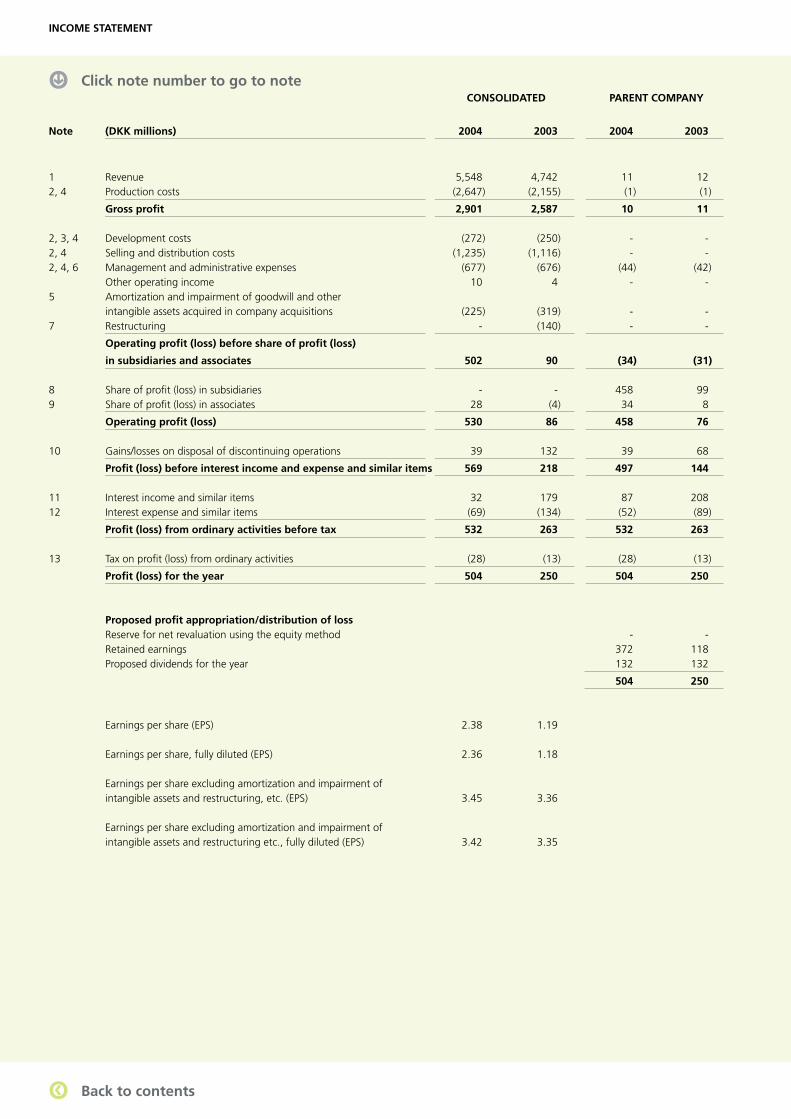
33GN Store Nord – Annual Report 2004
CONSOLIDATED PARENT COMPANY
Note (DKK millions) 2004 2003 2004 2003
1 Revenue 5,548 4,742 11 12 2, 4 Production costs (2,647) (2,155) (1) (1)
Gross profi t 2,901 2,587 10 11 2, 3, 4 Development costs (272) (250) - - 2, 4 Selling and distribution costs (1,235) (1,116) - - 2, 4, 6 Management and administrative expenses (677) (676) (44) (42) Other operating income 10 4 - - 5 Amortization and impairment of goodwill and other
intangible assets acquired in company acquisitions (225) (319) - - 7 Restructuring - (140) - -
Operating profi t (loss) before share of profi t (loss)
in subsidiaries and associates 502 90 (34) (31) 8 Share of profi t (loss) in subsidiaries - - 458 99 9 Share of profi t (loss) in associates 28 (4) 34 8
Operating profi t (loss) 530 86 458 76 10 Gains/losses on disposal of discontinuing operations 39 132 39 68
Profi t (loss) before interest income and expense and similar items 569 218 497 144 11 Interest income and similar items 32 179 87 208 12 Interest expense and similar items (69) (134) (52) (89)
Profi t (loss) from ordinary activities before tax 532 263 532 263 13 Tax on profi t (loss) from ordinary activities (28) (13) (28) (13)
Profi t (loss) for the year 504 250 504 250 Proposed profi t appropriation/distribution of loss Reserve for net revaluation using the equity method - - Retained earnings 372 118 Proposed dividends for the year 132 132
504 250 Earnings per share (EPS) 2.38 1.19 Earnings per share, fully diluted (EPS) 2.36 1.18 Earnings per share excluding amortization and impairment of intangible assets and restructuring, etc. (EPS) 3.45 3.36 Earnings per share excluding amortization and impairment of intangible assets and restructuring etc., fully diluted (EPS) 3.42 3.35
INCOME STATEMENT
qq Back to contents
pp Click note number to go to note
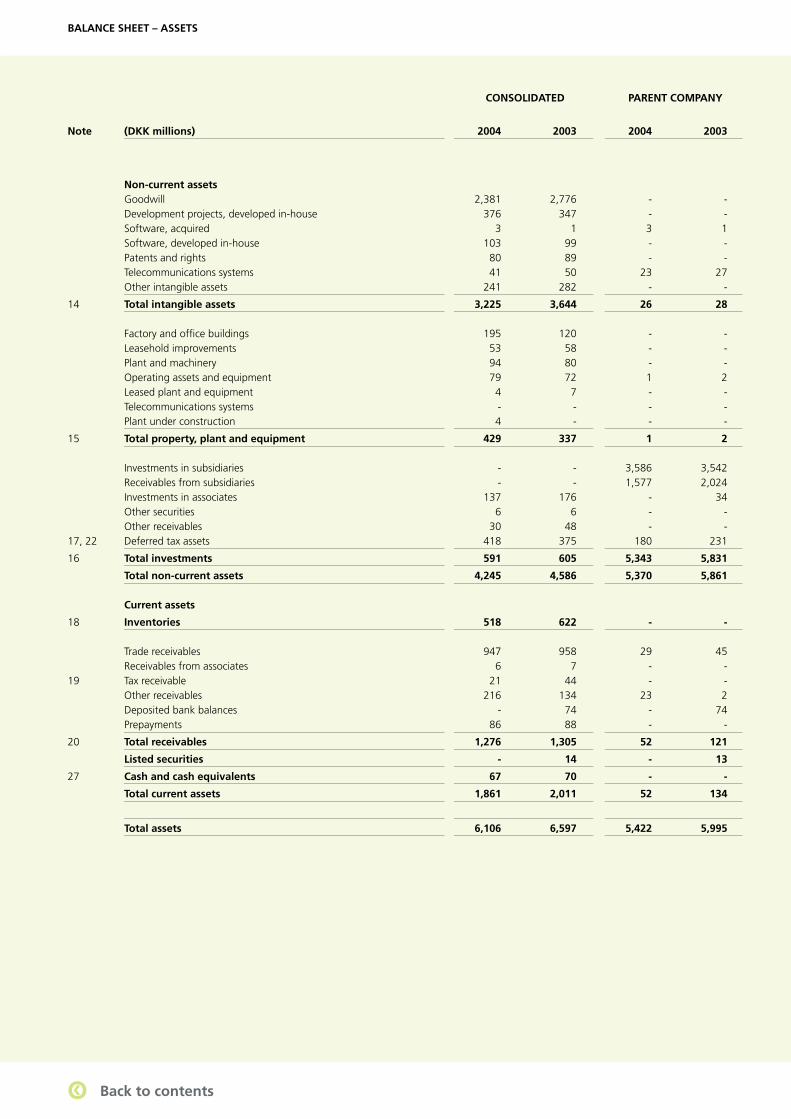
34 GN Store Nord – Annual Report 2004
Non-current assets Goodwill 2,381 2,776 - - Development projects, developed in-house 376 347 - - Software, acquired 3 1 3 1 Software, developed in-house 103 99 - - Patents and rights 80 89 - - Telecommunications systems 41 50 23 27 Other intangible assets 241 282 - -
14 Total intangible assets 3,225 3,644 26 28 Factory and offi ce buildings 195 120 - - Leasehold improvements 53 58 - - Plant and machinery 94 80 - - Operating assets and equipment 79 72 1 2 Leased plant and equipment 4 7 - - Telecommunications systems - - - - Plant under construction 4 - - -
15 Total property, plant and equipment 429 337 1 2 Investments in subsidiaries - - 3,586 3,542 Receivables from subsidiaries - - 1,577 2,024 Investments in associates 137 176 - 34 Other securities 6 6 - - Other receivables 30 48 - - 17, 22 Deferred tax assets 418 375 180 231
16 Total investments 591 605 5,343 5,831
Total non-current assets 4,245 4,586 5,370 5,861 Current assets
18 Inventories 518 622 - - Trade receivables 947 958 29 45 Receivables from associates 6 7 - - 19 Tax receivable 21 44 - - Other receivables 216 134 23 2 Deposited bank balances - 74 - 74 Prepayments 86 88 - -
20 Total receivables 1,276 1,305 52 121
Listed securities - 14 - 13
27 Cash and cash equivalents 67 70 - -
Total current assets 1,861 2,011 52 134
Total assets 6,106 6,597 5,422 5,995
CONSOLIDATED PARENT COMPANY
Note (DKK millions) 2004 2003 2004 2003
BALANCE SHEET – ASSETS
qq Back to contents
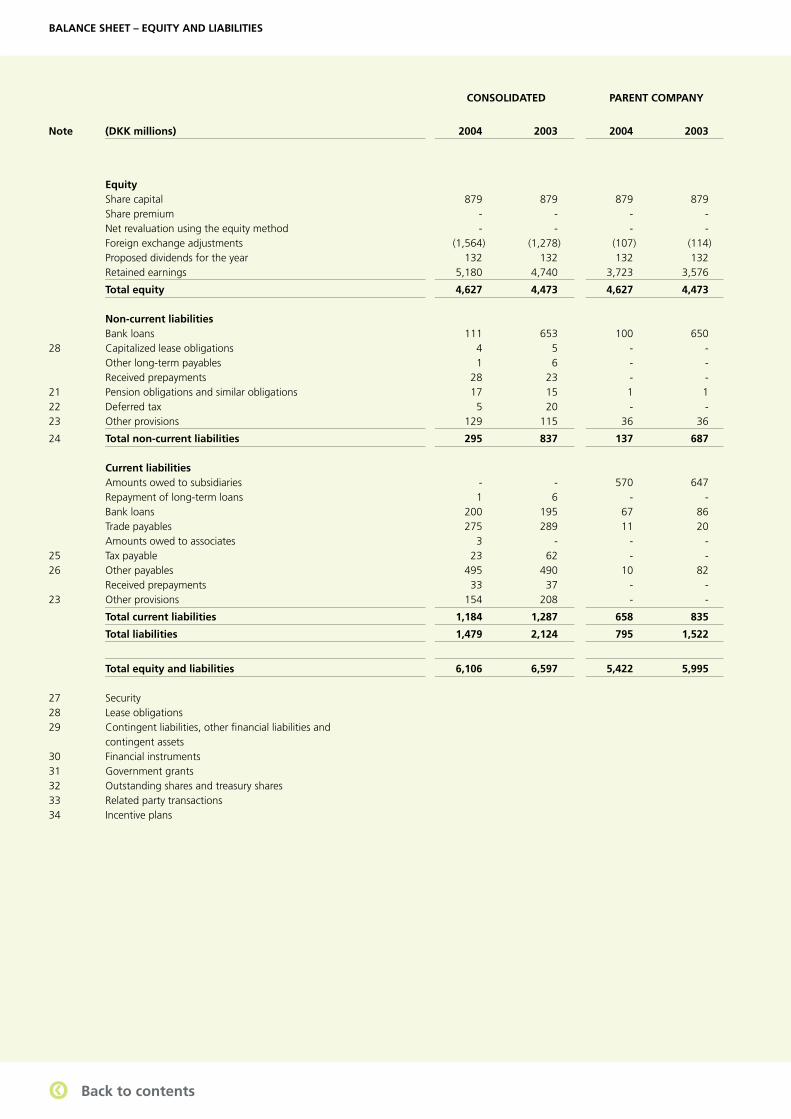
35GN Store Nord – Annual Report 2004
CONSOLIDATED PARENT COMPANY
Note (DKK millions) 2004 2003 2004 2003
Equity Share capital 879 879 879 879 Share premium - - - - Net revaluation using the equity method - - - - Foreign exchange adjustments (1,564) (1,278) (107) (114) Proposed dividends for the year 132 132 132 132 Retained earnings 5,180 4,740 3,723 3,576
Total equity 4,627 4,473 4,627 4,473 Non-current liabilities Bank loans 111 653 100 650 28 Capitalized lease obligations 4 5 - - Other long-term payables 1 6 - - Received prepayments 28 23 - - 21 Pension obligations and similar obligations 17 15 1 1 22 Deferred tax 5 20 - - 23 Other provisions 129 115 36 36
24 Total non-current liabilities 295 837 137 687 Current liabilities Amounts owed to subsidiaries - - 570 647 Repayment of long-term loans 1 6 - - Bank loans 200 195 67 86 Trade payables 275 289 11 20 Amounts owed to associates 3 - - - 25 Tax payable 23 62 - - 26 Other payables 495 490 10 82 Received prepayments 33 37 - - 23 Other provisions 154 208 - -
Total current liabilities 1,184 1,287 658 835
Total liabilities 1,479 2,124 795 1,522
Total equity and liabilities 6,106 6,597 5,422 5,995 27 Security 28 Lease obligations 29 Contingent liabilities, other fi nancial liabilities and contingent assets 30 Financial instruments 31 Government grants 32 Outstanding shares and treasury shares 33 Related party transactions 34 Incentive plans
BALANCE SHEET – EQUITY AND LIABILITIES
qq Back to contents
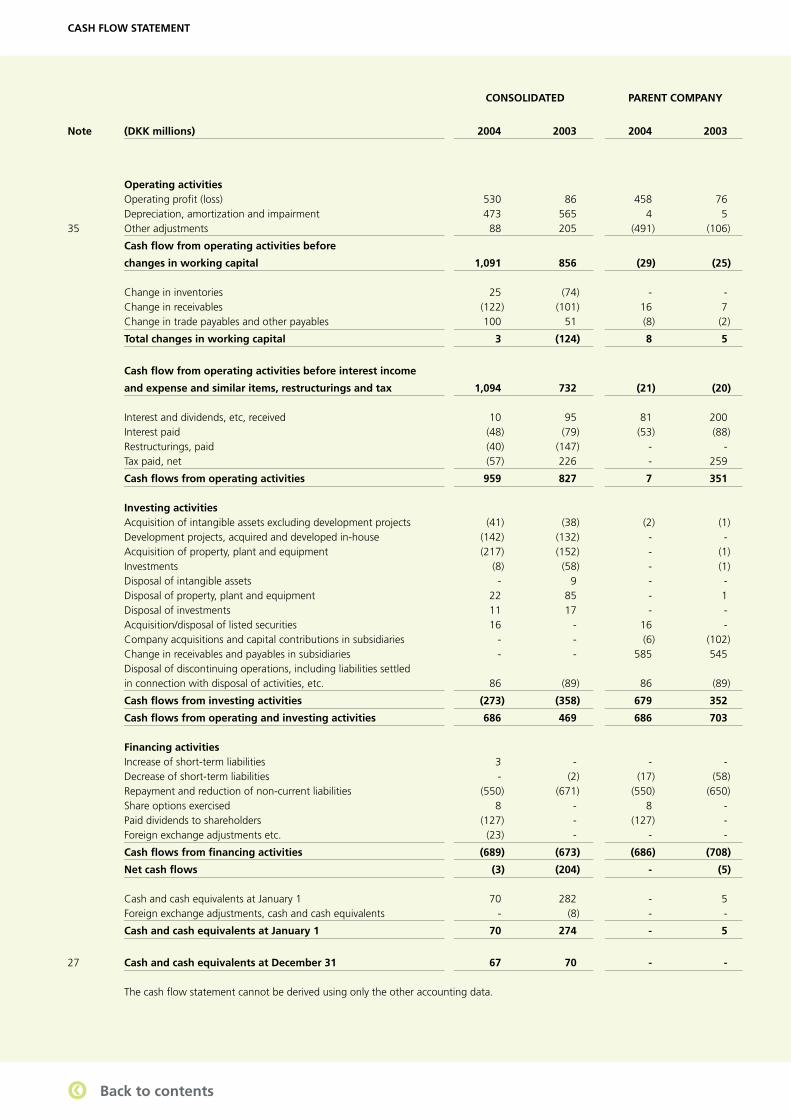
36 GN Store Nord – Annual Report 2004
CASH FLOW STATEMENT
Operating activities Operating profi t (loss) 530 86 458 76 Depreciation, amortization and impairment 473 565 4 5 35 Other adjustments 88 205 (491) (106)
Cash fl ow from operating activities before
changes in working capital 1,091 856 (29) (25) Change in inventories 25 (74) - - Change in receivables (122) (101) 16 7 Change in trade payables and other payables 100 51 (8) (2)
Total changes in working capital 3 (124) 8 5
Cash fl ow from operating activities before interest income
and expense and similar items, restructurings and tax 1,094 732 (21) (20) Interest and dividends, etc, received 10 95 81 200 Interest paid (48) (79) (53) (88) Restructurings, paid (40) (147) - - Tax paid, net (57) 226 - 259
Cash fl ows from operating activities 959 827 7 351 Investing activities Acquisition of intangible assets excluding development projects (41) (38) (2) (1) Development projects, acquired and developed in-house (142) (132) - - Acquisition of property, plant and equipment (217) (152) - (1) Investments (8) (58) - (1) Disposal of intangible assets - 9 - - Disposal of property, plant and equipment 22 85 - 1 Disposal of investments 11 17 - - Acquisition/disposal of listed securities 16 - 16 - Company acquisitions and capital contributions in subsidiaries - - (6) (102) Change in receivables and payables in subsidiaries - - 585 545 Disposal of discontinuing operations, including liabilities settled in connection with disposal of activities, etc. 86 (89) 86 (89)
Cash fl ows from investing activities (273) (358) 679 352
Cash fl ows from operating and investing activities 686 469 686 703 Financing activities Increase of short-term liabilities 3 - - - Decrease of short-term liabilities - (2) (17) (58) Repayment and reduction of non-current liabilities (550) (671) (550) (650) Share options exercised 8 - 8 - Paid dividends to shareholders (127) - (127) - Foreign exchange adjustments etc. (23) - - -
Cash fl ows from fi nancing activities (689) (673) (686) (708)
Net cash fl ows (3) (204) - (5) Cash and cash equivalents at January 1 70 282 - 5 Foreign exchange adjustments, cash and cash equivalents - (8) - -
Cash and cash equivalents at January 1 70 274 - 5
27 Cash and cash equivalents at December 31 67 70 - - The cash fl ow statement cannot be derived using only the other accounting data.
CONSOLIDATED PARENT COMPANY
Note (DKK millions) 2004 2003 2004 2003
qq Back to contents
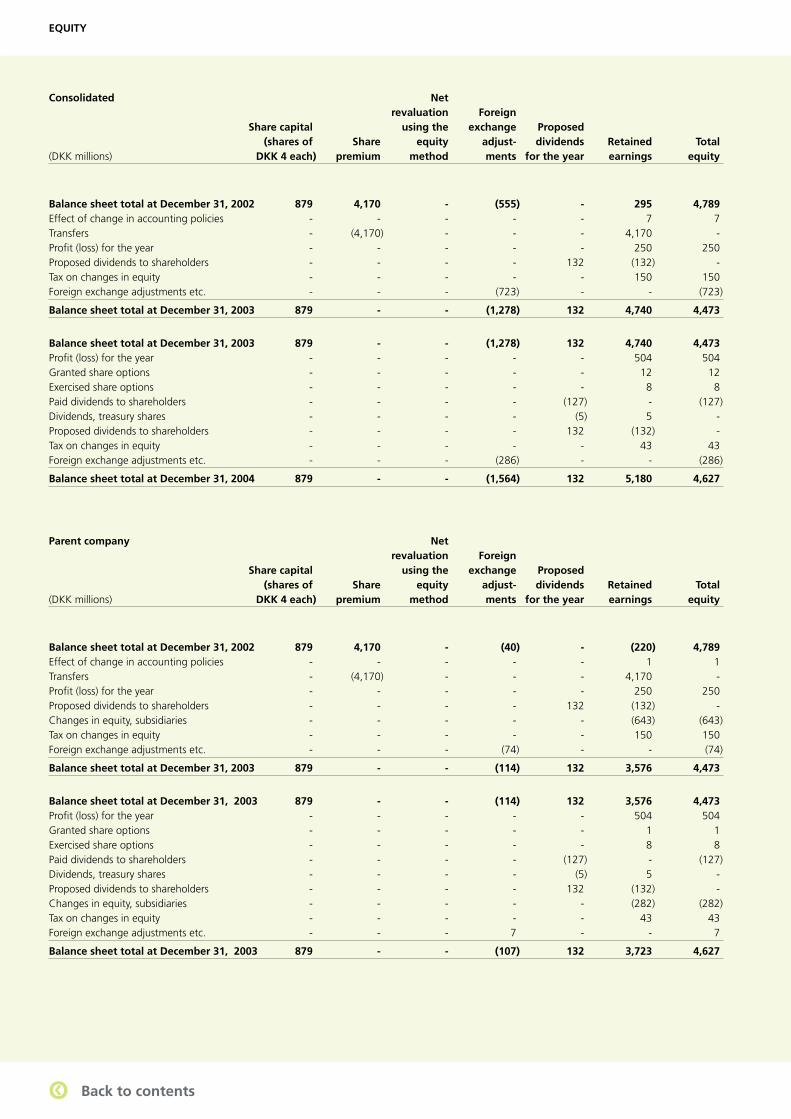
37GN Store Nord – Annual Report 2004
EQUITY
Consolidated Net revaluation Foreign Share capital using the exchange Proposed (shares of Share equity adjust- dividends Retained Total(DKK millions) DKK 4 each) premium method ments for the year earnings equity
Balance sheet total at December 31, 2002 879 4,170 - (555) - 295 4,789 Effect of change in accounting policies - - - - - 7 7 Transfers - (4,170) - - - 4,170 - Profi t (loss) for the year - - - - - 250 250 Proposed dividends to shareholders - - - - 132 (132) - Tax on changes in equity - - - - - 150 150 Foreign exchange adjustments etc. - - - (723) - - (723)
Balance sheet total at December 31, 2003 879 - - (1,278) 132 4,740 4,473
Balance sheet total at December 31, 2003 879 - - (1,278) 132 4,740 4,473 Profi t (loss) for the year - - - - - 504 504 Granted share options - - - - - 12 12 Exercised share options - - - - - 8 8 Paid dividends to shareholders - - - - (127) - (127)Dividends, treasury shares - - - - (5) 5 - Proposed dividends to shareholders - - - - 132 (132) - Tax on changes in equity - - - - - 43 43 Foreign exchange adjustments etc. - - - (286) - - (286)
Balance sheet total at December 31, 2004 879 - - (1,564) 132 5,180 4,627
Parent company Net revaluation Foreign Share capital using the exchange Proposed (shares of Share equity adjust- dividends Retained Total(DKK millions) DKK 4 each) premium method ments for the year earnings equity
Balance sheet total at December 31, 2002 879 4,170 - (40) - (220) 4,789 Effect of change in accounting policies - - - - - 1 1 Transfers - (4,170) - - - 4,170 - Profi t (loss) for the year - - - - - 250 250 Proposed dividends to shareholders - - - - 132 (132) -Changes in equity, subsidiaries - - - - - (643) (643)Tax on changes in equity - - - - - 150 150 Foreign exchange adjustments etc. - - - (74) - - (74)
Balance sheet total at December 31, 2003 879 - - (114) 132 3,576 4,473
Balance sheet total at December 31, 2003 879 - - (114) 132 3,576 4,473 Profi t (loss) for the year - - - - - 504 504 Granted share options - - - - - 1 1 Exercised share options - - - - - 8 8 Paid dividends to shareholders - - - - (127) - (127)Dividends, treasury shares - - - - (5) 5 - Proposed dividends to shareholders - - - - 132 (132) - Changes in equity, subsidiaries - - - - - (282) (282)Tax on changes in equity - - - - - 43 43 Foreign exchange adjustments etc. - - - 7 - - 7
Balance sheet total at December 31, 2003 879 - - (107) 132 3,723 4,627
qq Back to contents
38 GN Store Nord – Annual Report 2004
Notes – Income statement
1 Revenue ...................................................................................................................................39
2 Employees and staff costs .........................................................................................................39
3 Development costs ...................................................................................................................39
4 Depreciation, amortization and impairment ..............................................................................40
5 Amortization and impairment of goodwill and other
intangible assets acquired in company acquisitions ...................................................................40
6 Fees to auditors appointed by the Annual General Meeting ......................................................40
7 Restructuring ............................................................................................................................40
8 Share of profi t (loss) in subsidiaries ...........................................................................................40
9 Share of profi t (loss) in associates .............................................................................................40
10 Gains/losses on disposal of discontinuing operations ................................................................41
11 Interest income and similar items ..............................................................................................41
12 Interest expense and similar items ............................................................................................41
13 Tax on profi t (loss) from ordinary activities ................................................................................41
Notes – Balance sheet
14 Intangible assets .......................................................................................................................42
15 Property, plant and equipment .................................................................................................43
16 Investments ..............................................................................................................................44
17 Deferred tax assets ...................................................................................................................45
18 Inventories ...............................................................................................................................45
19 Tax receivable ...........................................................................................................................45
20 Receivables ...............................................................................................................................45
21 Pension obligations and similar obligations ...............................................................................46
22 Deferred tax .............................................................................................................................47
23 Other provisions .......................................................................................................................48
24 Non-current liabilities ...............................................................................................................48
25 Tax payable ..............................................................................................................................48
26 Other payables .........................................................................................................................48
Notes – Supplementary information
27 Security ....................................................................................................................................49
28 Lease obligations ......................................................................................................................49
29 Contingent liabilities, other fi nancial liabilities and contingent assets ........................................49
30 Financial instruments ................................................................................................................50
31 Government grants ..................................................................................................................51
32 Outstanding shares and treasury shares ....................................................................................51
33 Related party transactions ........................................................................................................51
34 Incentive plans .........................................................................................................................52
Note – Cash fl ow statement
35 Other adjustments ....................................................................................................................53
NOTES – CONTENTS
qq Back to contents
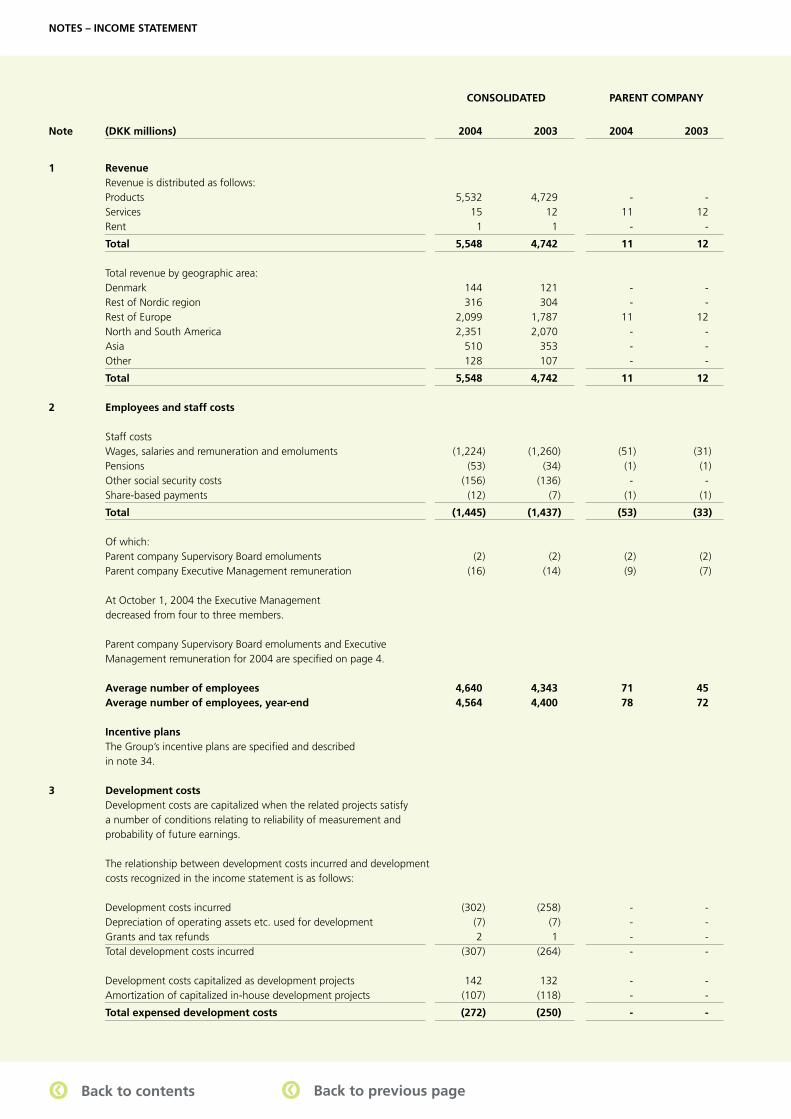
39GN Store Nord – Annual Report 2004
1 Revenue Revenue is distributed as follows: Products 5,532 4,729 - - Services 15 12 11 12 Rent 1 1 - -
Total 5,548 4,742 11 12 Total revenue by geographic area: Denmark 144 121 - - Rest of Nordic region 316 304 - - Rest of Europe 2,099 1,787 11 12 North and South America 2,351 2,070 - - Asia 510 353 - - Other 128 107 - -
Total 5,548 4,742 11 12
2 Employees and staff costs Staff costs Wages, salaries and remuneration and emoluments (1,224) (1,260) (51) (31) Pensions (53) (34) (1) (1) Other social security costs (156) (136) - - Share-based payments (12) (7) (1) (1)
Total (1,445) (1,437) (53) (33) Of which: Parent company Supervisory Board emoluments (2) (2) (2) (2) Parent company Executive Management remuneration (16) (14) (9) (7) At October 1, 2004 the Executive Management decreased from four to three members. Parent company Supervisory Board emoluments and Executive Management remuneration for 2004 are specifi ed on page 4. Average number of employees 4,640 4,343 71 45 Average number of employees, year-end 4,564 4,400 78 72 Incentive plans The Group’s incentive plans are specifi ed and described in note 34.
3 Development costs Development costs are capitalized when the related projects satisfy a number of conditions relating to reliability of measurement and probability of future earnings. The relationship between development costs incurred and development costs recognized in the income statement is as follows: Development costs incurred (302) (258) - - Depreciation of operating assets etc. used for development (7) (7) - - Grants and tax refunds 2 1 - - Total development costs incurred (307) (264) - - Development costs capitalized as development projects 142 132 - - Amortization of capitalized in-house development projects (107) (118) - -
Total expensed development costs (272) (250) - -
CONSOLIDATED PARENT COMPANY
Note (DKK millions) 2004 2003 2004 2003
NOTES – INCOME STATEMENT
qq Back to contents qq Back to previous page
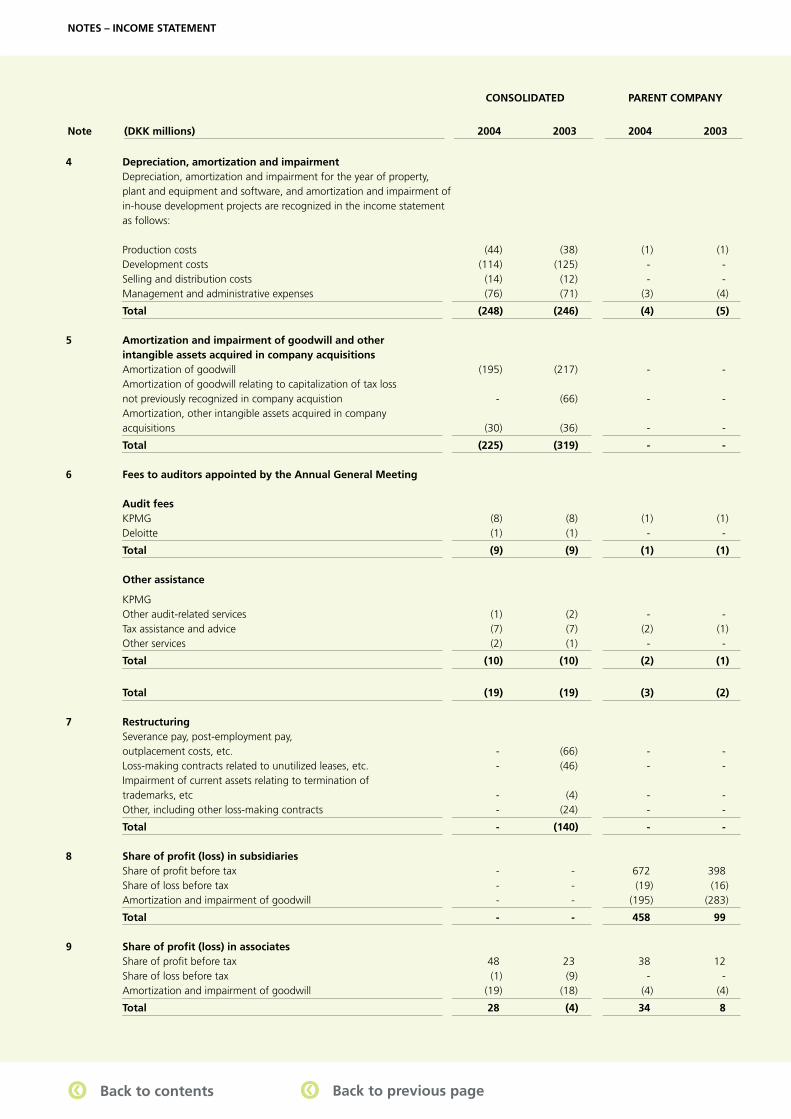
40 GN Store Nord – Annual Report 2004
4 Depreciation, amortization and impairment Depreciation, amortization and impairment for the year of property, plant and equipment and software, and amortization and impairment of in-house development projects are recognized in the income statement as follows:
Production costs (44) (38) (1) (1) Development costs (114) (125) - - Selling and distribution costs (14) (12) - - Management and administrative expenses (76) (71) (3) (4)
Total (248) (246) (4) (5)
5 Amortization and impairment of goodwill and other intangible assets acquired in company acquisitions Amortization of goodwill (195) (217) - - Amortization of goodwill relating to capitalization of tax loss not previously recognized in company acquistion - (66) - - Amortization, other intangible assets acquired in company acquisitions (30) (36) - -
Total (225) (319) - -
6 Fees to auditors appointed by the Annual General Meeting Audit fees KPMG (8) (8) (1) (1) Deloitte (1) (1) - -
Total (9) (9) (1) (1) Other assistance
KPMG Other audit-related services (1) (2) - - Tax assistance and advice (7) (7) (2) (1) Other services (2) (1) - -
Total (10) (10) (2) (1)
Total (19) (19) (3) (2)
7 Restructuring Severance pay, post-employment pay, outplacement costs, etc. - (66) - - Loss-making contracts related to unutilized leases, etc. - (46) - - Impairment of current assets relating to termination of trademarks, etc - (4) - - Other, including other loss-making contracts - (24) - -
Total - (140) - -
8 Share of profi t (loss) in subsidiaries Share of profi t before tax - - 672 398 Share of loss before tax - - (19) (16) Amortization and impairment of goodwill - - (195) (283)
Total - - 458 99
9 Share of profi t (loss) in associates Share of profi t before tax 48 23 38 12 Share of loss before tax (1) (9) - - Amortization and impairment of goodwill (19) (18) (4) (4)
Total 28 (4) 34 8
CONSOLIDATED PARENT COMPANY
Note (DKK millions) 2004 2003 2004 2003
NOTES – INCOME STATEMENT
qq Back to contents qq Back to previous page
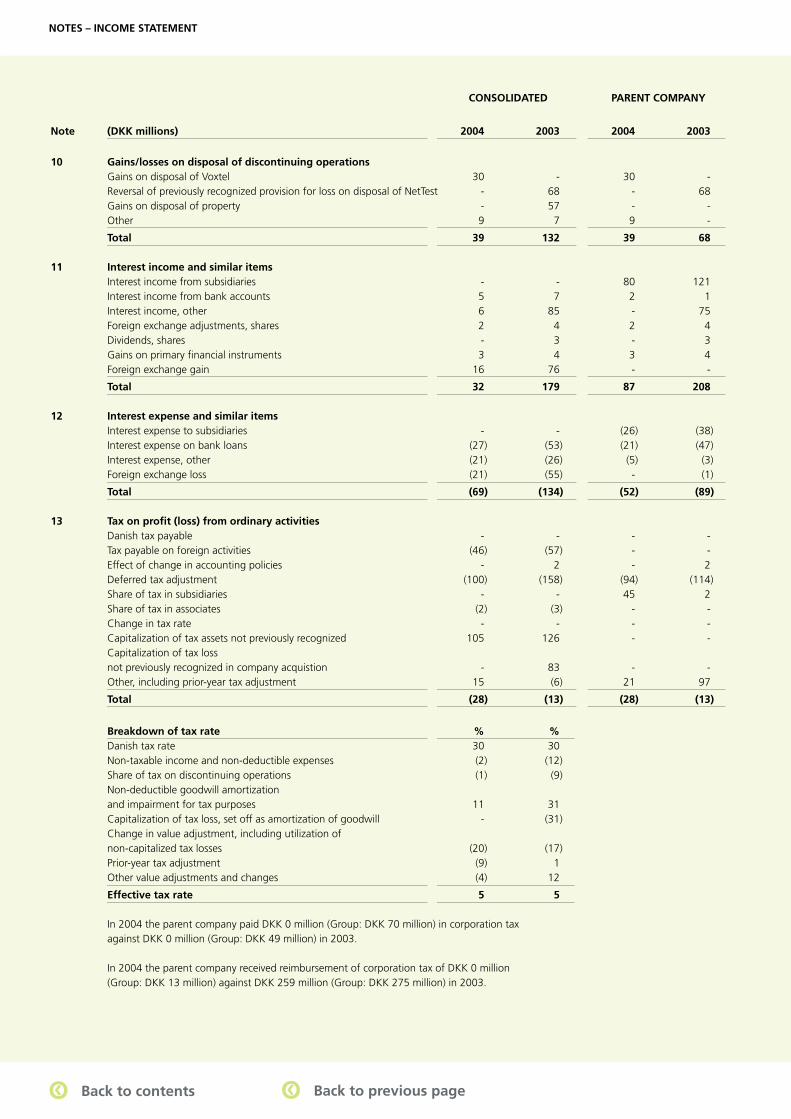
41GN Store Nord – Annual Report 2004
10 Gains/losses on disposal of discontinuing operations Gains on disposal of Voxtel 30 - 30 - Reversal of previously recognized provision for loss on disposal of NetTest - 68 - 68 Gains on disposal of property - 57 - - Other 9 7 9 -
Total 39 132 39 68
11 Interest income and similar items Interest income from subsidiaries - - 80 121 Interest income from bank accounts 5 7 2 1 Interest income, other 6 85 - 75 Foreign exchange adjustments, shares 2 4 2 4 Dividends, shares - 3 - 3 Gains on primary fi nancial instruments 3 4 3 4 Foreign exchange gain 16 76 - -
Total 32 179 87 208
12 Interest expense and similar items Interest expense to subsidiaries - - (26) (38) Interest expense on bank loans (27) (53) (21) (47) Interest expense, other (21) (26) (5) (3) Foreign exchange loss (21) (55) - (1)
Total (69) (134) (52) (89)
13 Tax on profi t (loss) from ordinary activities Danish tax payable - - - - Tax payable on foreign activities (46) (57) - - Effect of change in accounting policies - 2 - 2 Deferred tax adjustment (100) (158) (94) (114) Share of tax in subsidiaries - - 45 2 Share of tax in associates (2) (3) - - Change in tax rate - - - - Capitalization of tax assets not previously recognized 105 126 - - Capitalization of tax loss not previously recognized in company acquistion - 83 - - Other, including prior-year tax adjustment 15 (6) 21 97
Total (28) (13) (28) (13)
Breakdown of tax rate % % Danish tax rate 30 30 Non-taxable income and non-deductible expenses (2) (12) Share of tax on discontinuing operations (1) (9) Non-deductible goodwill amortization and impairment for tax purposes 11 31 Capitalization of tax loss, set off as amortization of goodwill - (31) Change in value adjustment, including utilization of non-capitalized tax losses (20) (17) Prior-year tax adjustment (9) 1 Other value adjustments and changes (4) 12
Effective tax rate 5 5 In 2004 the parent company paid DKK 0 million (Group: DKK 70 million) in corporation tax
against DKK 0 million (Group: DKK 49 million) in 2003. In 2004 the parent company received reimbursement of corporation tax of DKK 0 million
(Group: DKK 13 million) against DKK 259 million (Group: DKK 275 million) in 2003.
CONSOLIDATED PARENT COMPANY
Note (DKK millions) 2004 2003 2004 2003
NOTES – INCOME STATEMENT
qq Back to contents qq Back to previous page
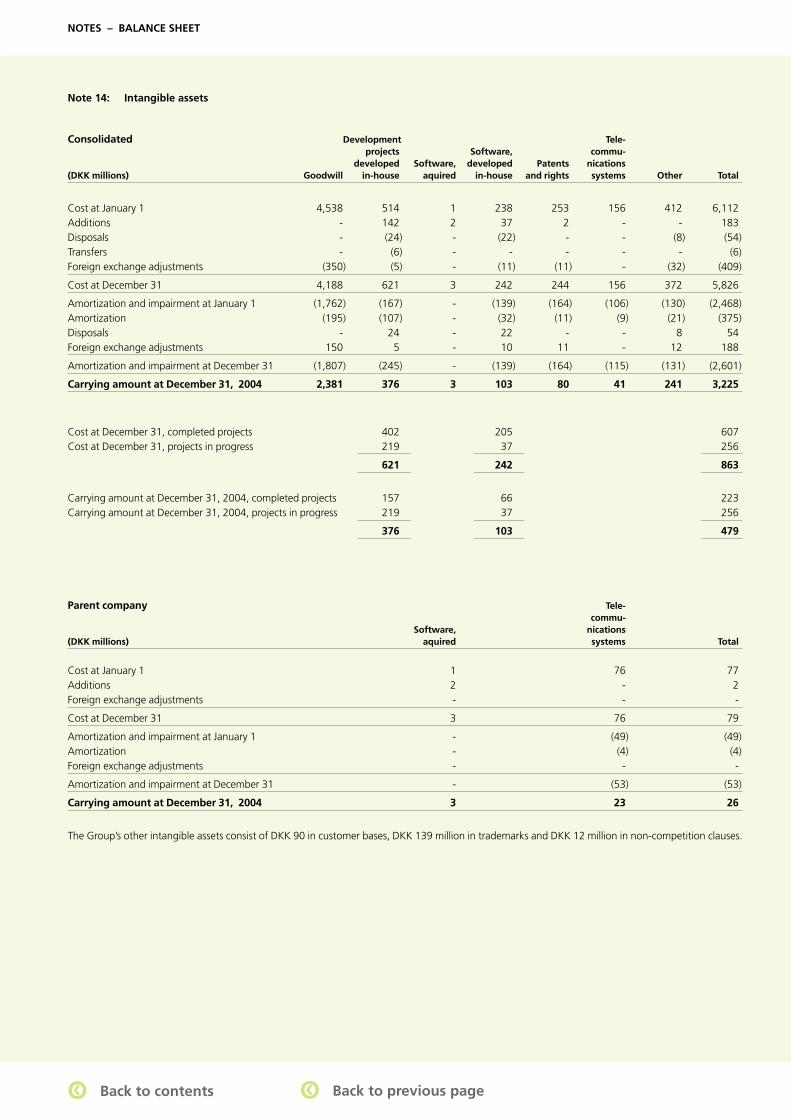
42 GN Store Nord – Annual Report 2004
Note 14: Intangible assets
Consolidated Development Tele- projects Software, commu- developed Software, developed Patents nications (DKK millions) Goodwill in-house aquired in-house and rights systems Other Total
Cost at January 1 4,538 514 1 238 253 156 412 6,112 Additions - 142 2 37 2 - - 183 Disposals - (24) - (22) - - (8) (54)Transfers - (6) - - - - - (6)Foreign exchange adjustments (350) (5) - (11) (11) - (32) (409)
Cost at December 31 4,188 621 3 242 244 156 372 5,826
Amortization and impairment at January 1 (1,762) (167) - (139) (164) (106) (130) (2,468)Amortization (195) (107) - (32) (11) (9) (21) (375)Disposals - 24 - 22 - - 8 54 Foreign exchange adjustments 150 5 - 10 11 - 12 188
Amortization and impairment at December 31 (1,807) (245) - (139) (164) (115) (131) (2,601)
Carrying amount at December 31, 2004 2,381 376 3 103 80 41 241 3,225
Cost at December 31, completed projects 402 205 607 Cost at December 31, projects in progress 219 37 256
621 242 863
Carrying amount at December 31, 2004, completed projects 157 66 223 Carrying amount at December 31, 2004, projects in progress 219 37 256
376 103 479
Parent company Tele- commu- Software, nications (DKK millions) aquired systems Total
Cost at January 1 1 76 77 Additions 2 - 2 Foreign exchange adjustments - - -
Cost at December 31 3 76 79
Amortization and impairment at January 1 - (49) (49)Amortization - (4) (4)Foreign exchange adjustments - - -
Amortization and impairment at December 31 - (53) (53)
Carrying amount at December 31, 2004 3 23 26
The Group’s other intangible assets consist of DKK 90 in customer bases, DKK 139 million in trademarks and DKK 12 million in non-competition clauses.
NOTES – BALANCE SHEET
qq Back to contents qq Back to previous page
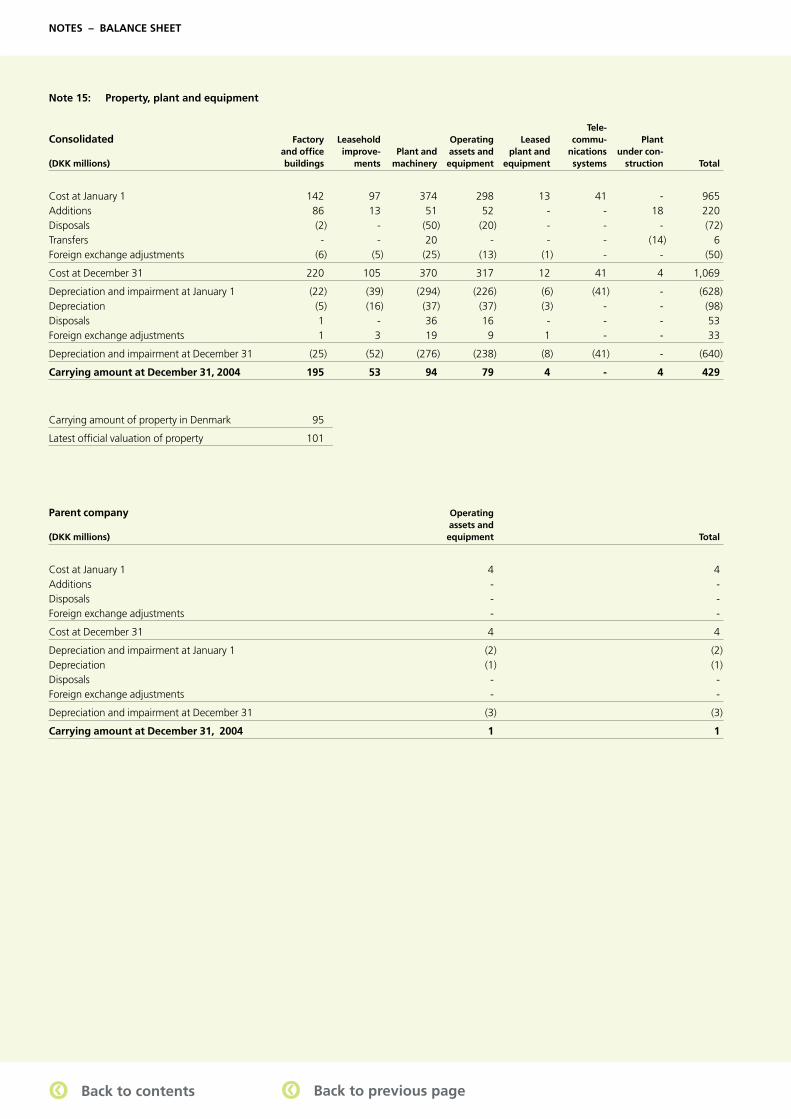
43GN Store Nord – Annual Report 2004
Note 15: Property, plant and equipment
Tele- Consolidated Factory Leasehold Operating Leased commu- Plant and offi ce improve- Plant and assets and plant and nications under con- (DKK millions) buildings ments machinery equipment equipment systems struction Total
Cost at January 1 142 97 374 298 13 41 - 965 Additions 86 13 51 52 - - 18 220 Disposals (2) - (50) (20) - - - (72)Transfers - - 20 - - - (14) 6 Foreign exchange adjustments (6) (5) (25) (13) (1) - - (50)
Cost at December 31 220 105 370 317 12 41 4 1,069
Depreciation and impairment at January 1 (22) (39) (294) (226) (6) (41) - (628)Depreciation (5) (16) (37) (37) (3) - - (98)Disposals 1 - 36 16 - - - 53 Foreign exchange adjustments 1 3 19 9 1 - - 33
Depreciation and impairment at December 31 (25) (52) (276) (238) (8) (41) - (640)
Carrying amount at December 31, 2004 195 53 94 79 4 - 4 429
Carrying amount of property in Denmark 95
Latest offi cial valuation of property 101
Parent company Operating assets and (DKK millions) equipment Total
Cost at January 1 4 4 Additions - - Disposals - - Foreign exchange adjustments - -
Cost at December 31 4 4
Depreciation and impairment at January 1 (2) (2)Depreciation (1) (1)Disposals - - Foreign exchange adjustments - -
Depreciation and impairment at December 31 (3) (3)
Carrying amount at December 31, 2004 1 1
NOTES – BALANCE SHEET
qq Back to contents qq Back to previous page
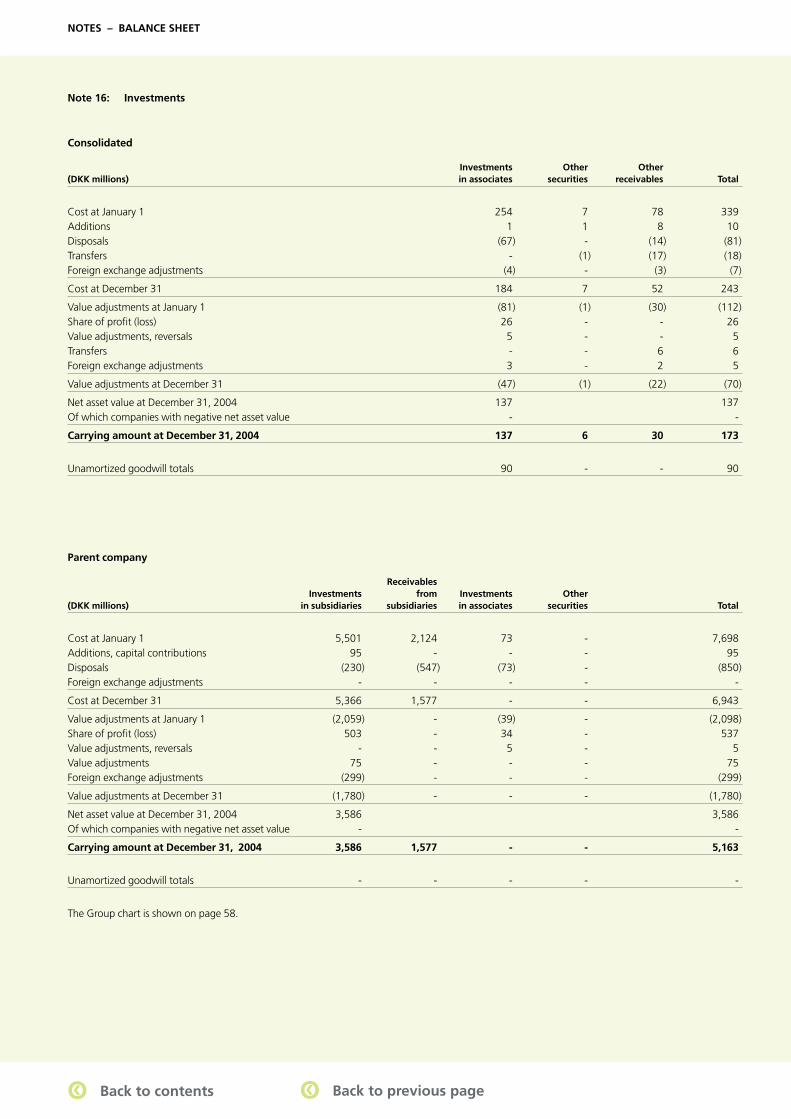
44 GN Store Nord – Annual Report 2004
Note 16: Investments
Consolidated
Investments Other Other (DKK millions) in associates securities receivables Total
Cost at January 1 254 7 78 339 Additions 1 1 8 10 Disposals (67) - (14) (81)Transfers - (1) (17) (18)Foreign exchange adjustments (4) - (3) (7)
Cost at December 31 184 7 52 243
Value adjustments at January 1 (81) (1) (30) (112)Share of profi t (loss) 26 - - 26 Value adjustments, reversals 5 - - 5 Transfers - - 6 6 Foreign exchange adjustments 3 - 2 5
Value adjustments at December 31 (47) (1) (22) (70)
Net asset value at December 31, 2004 137 137 Of which companies with negative net asset value - -
Carrying amount at December 31, 2004 137 6 30 173
Unamortized goodwill totals 90 - - 90
Parent company Receivables Investments from Investments Other (DKK millions) in subsidiaries subsidiaries in associates securities Total
Cost at January 1 5,501 2,124 73 - 7,698 Additions, capital contributions 95 - - - 95 Disposals (230) (547) (73) - (850)Foreign exchange adjustments - - - - -
Cost at December 31 5,366 1,577 - - 6,943
Value adjustments at January 1 (2,059) - (39) - (2,098)Share of profi t (loss) 503 - 34 - 537 Value adjustments, reversals - - 5 - 5 Value adjustments 75 - - - 75 Foreign exchange adjustments (299) - - - (299)
Value adjustments at December 31 (1,780) - - - (1,780)
Net asset value at December 31, 2004 3,586 3,586 Of which companies with negative net asset value - -
Carrying amount at December 31, 2004 3,586 1,577 - - 5,163
Unamortized goodwill totals - - - - -
The Group chart is shown on page 58.
NOTES – BALANCE SHEET
qq Back to contents qq Back to previous page
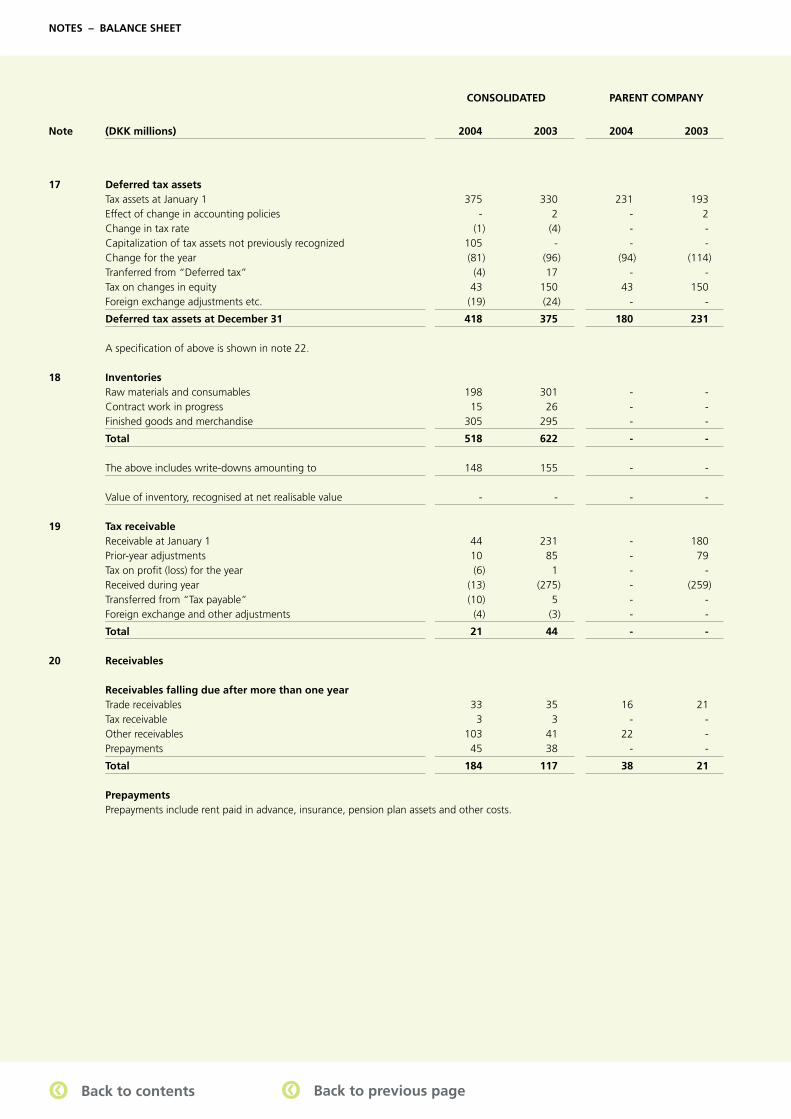
45GN Store Nord – Annual Report 2004
17 Deferred tax assets Tax assets at January 1 375 330 231 193 Effect of change in accounting policies - 2 - 2 Change in tax rate (1) (4) - - Capitalization of tax assets not previously recognized 105 - - - Change for the year (81) (96) (94) (114) Tranferred from “Deferred tax” (4) 17 - - Tax on changes in equity 43 150 43 150 Foreign exchange adjustments etc. (19) (24) - -
Deferred tax assets at December 31 418 375 180 231 A specifi cation of above is shown in note 22.
18 Inventories Raw materials and consumables 198 301 - - Contract work in progress 15 26 - - Finished goods and merchandise 305 295 - -
Total 518 622 - - The above includes write-downs amounting to 148 155 - -
Value of inventory, recognised at net realisable value - - - -
19 Tax receivable Receivable at January 1 44 231 - 180 Prior-year adjustments 10 85 - 79 Tax on profi t (loss) for the year (6) 1 - - Received during year (13) (275) - (259) Transferred from “Tax payable” (10) 5 - - Foreign exchange and other adjustments (4) (3) - -
Total 21 44 - -
20 Receivables Receivables falling due after more than one year Trade receivables 33 35 16 21 Tax receivable 3 3 - - Other receivables 103 41 22 - Prepayments 45 38 - -
Total 184 117 38 21 Prepayments Prepayments include rent paid in advance, insurance, pension plan assets and other costs.
CONSOLIDATED PARENT COMPANY
Note (DKK millions) 2004 2003 2004 2003
NOTES – BALANCE SHEET
qq Back to contents qq Back to previous page
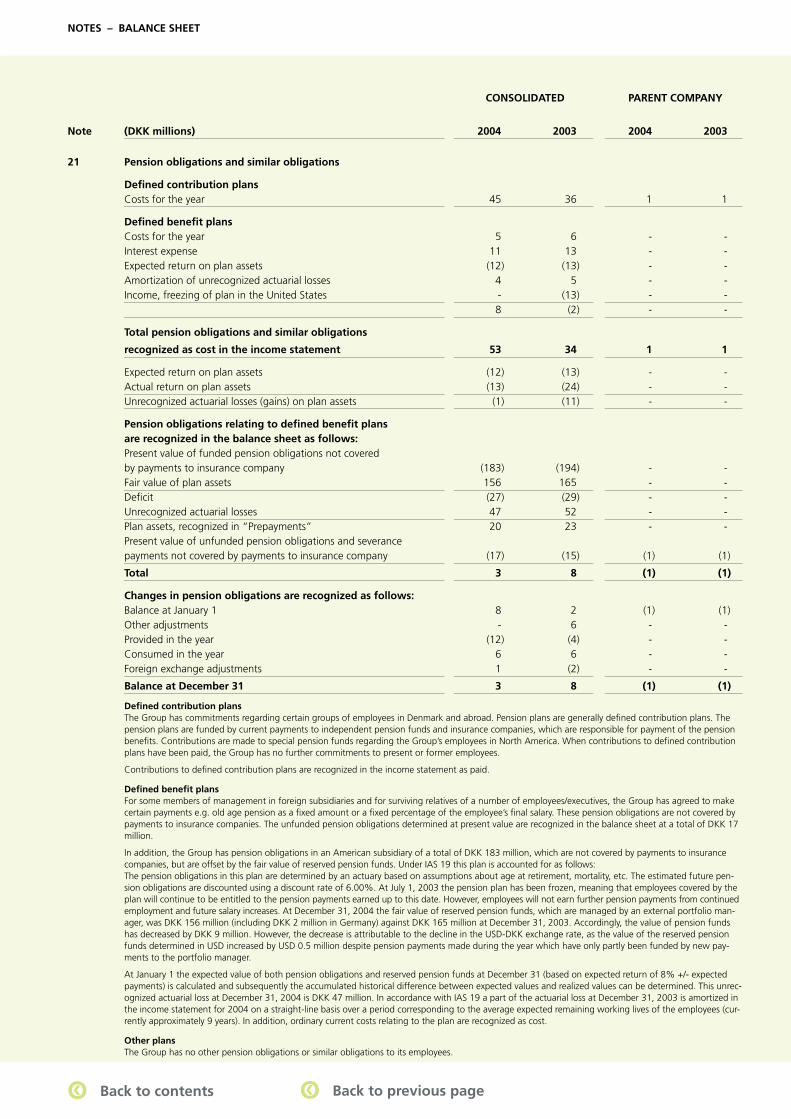
46 GN Store Nord – Annual Report 2004
21 Pension obligations and similar obligations Defi ned contribution plans Costs for the year 45 36 1 1 Defi ned benefi t plans Costs for the year 5 6 - - Interest expense 11 13 - - Expected return on plan assets (12) (13) - - Amortization of unrecognized actuarial losses 4 5 - - Income, freezing of plan in the United States - (13) - - 8 (2) - - Total pension obligations and similar obligations
recognized as cost in the income statement 53 34 1 1 Expected return on plan assets (12) (13) - - Actual return on plan assets (13) (24) - - Unrecognized actuarial losses (gains) on plan assets (1) (11) - - Pension obligations relating to defi ned benefi t plans
are recognized in the balance sheet as follows: Present value of funded pension obligations not covered
by payments to insurance company (183) (194) - - Fair value of plan assets 156 165 - - Defi cit (27) (29) - - Unrecognized actuarial losses 47 52 - - Plan assets, recognized in “Prepayments” 20 23 - - Present value of unfunded pension obligations and severance payments not covered by payments to insurance company (17) (15) (1) (1)
Total 3 8 (1) (1) Changes in pension obligations are recognized as follows: Balance at January 1 8 2 (1) (1) Other adjustments - 6 - - Provided in the year (12) (4) - - Consumed in the year 6 6 - - Foreign exchange adjustments 1 (2) - -
Balance at December 31 3 8 (1) (1)
Defi ned contribution plans The Group has commitments regarding certain groups of employees in Denmark and abroad. Pension plans are generally defi ned contribution plans. The
pension plans are funded by current payments to independent pension funds and insurance companies, which are responsible for payment of the pension benefi ts. Contributions are made to special pension funds regarding the Group’s employees in North America. When contributions to defi ned contribution plans have been paid, the Group has no further commitments to present or former employees.
Contributions to defi ned contribution plans are recognized in the income statement as paid.
Defi ned benefi t plans For some members of management in foreign subsidiaries and for surviving relatives of a number of employees/executives, the Group has agreed to make
certain payments e.g. old age pension as a fi xed amount or a fi xed percentage of the employee’s fi nal salary. These pension obligations are not covered by payments to insurance companies. The unfunded pension obligations determined at present value are recognized in the balance sheet at a total of DKK 17 million.
In addition, the Group has pension obligations in an American subsidiary of a total of DKK 183 million, which are not covered by payments to insurance companies, but are offset by the fair value of reserved pension funds. Under IAS 19 this plan is accounted for as follows:
The pension obligations in this plan are determined by an actuary based on assumptions about age at retirement, mortality, etc. The estimated future pen-sion obligations are discounted using a discount rate of 6.00%. At July 1, 2003 the pension plan has been frozen, meaning that employees covered by the plan will continue to be entitled to the pension payments earned up to this date. However, employees will not earn further pension payments from continued employment and future salary increases. At December 31, 2004 the fair value of reserved pension funds, which are managed by an external portfolio man-ager, was DKK 156 million (including DKK 2 million in Germany) against DKK 165 million at December 31, 2003. Accordingly, the value of pension funds has decreased by DKK 9 million. However, the decrease is attributable to the decline in the USD-DKK exchange rate, as the value of the reserved pension funds determined in USD increased by USD 0.5 million despite pension payments made during the year which have only partly been funded by new pay-ments to the portfolio manager.
At January 1 the expected value of both pension obligations and reserved pension funds at December 31 (based on expected return of 8% +/- expected payments) is calculated and subsequently the accumulated historical difference between expected values and realized values can be determined. This unrec-ognized actuarial loss at December 31, 2004 is DKK 47 million. In accordance with IAS 19 a part of the actuarial loss at December 31, 2003 is amortized in the income statement for 2004 on a straight-line basis over a period corresponding to the average expected remaining working lives of the employees (cur-rently approximately 9 years). In addition, ordinary current costs relating to the plan are recognized as cost.
Other plans The Group has no other pension obligations or similar obligations to its employees.
CONSOLIDATED PARENT COMPANY
Note (DKK millions) 2004 2003 2004 2003
NOTES – BALANCE SHEET
qq Back to contents qq Back to previous page
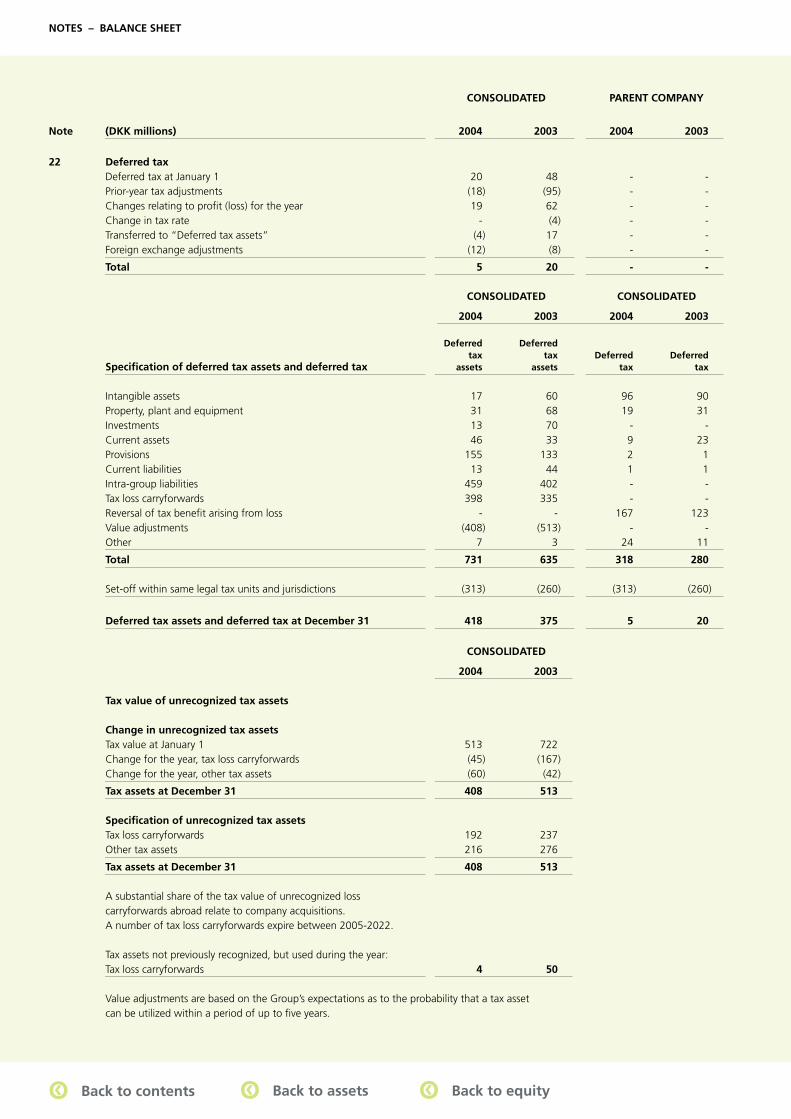
47GN Store Nord – Annual Report 2004
22 Deferred tax Deferred tax at January 1 20 48 - - Prior-year tax adjustments (18) (95) - - Changes relating to profi t (loss) for the year 19 62 - - Change in tax rate - (4) - - Transferred to “Deferred tax assets” (4) 17 - - Foreign exchange adjustments (12) (8) - -
Total 5 20 - -
CONSOLIDATED CONSOLIDATED
2004 2003 2004 2003 Deferred Deferred tax tax Deferred Deferred Specifi cation of deferred tax assets and deferred tax assets assets tax tax
Intangible assets 17 60 96 90 Property, plant and equipment 31 68 19 31 Investments 13 70 - - Current assets 46 33 9 23 Provisions 155 133 2 1 Current liabilities 13 44 1 1 Intra-group liabilities 459 402 - - Tax loss carryforwards 398 335 - - Reversal of tax benefi t arising from loss - - 167 123 Value adjustments (408) (513) - - Other 7 3 24 11
Total 731 635 318 280 Set-off within same legal tax units and jurisdictions (313) (260) (313) (260)
Deferred tax assets and deferred tax at December 31 418 375 5 20
CONSOLIDATED
2004 2003 Tax value of unrecognized tax assets Change in unrecognized tax assets Tax value at January 1 513 722 Change for the year, tax loss carryforwards (45) (167) Change for the year, other tax assets (60) (42)
Tax assets at December 31 408 513 Specifi cation of unrecognized tax assets Tax loss carryforwards 192 237 Other tax assets 216 276
Tax assets at December 31 408 513 A substantial share of the tax value of unrecognized loss
carryforwards abroad relate to company acquisitions. A number of tax loss carryforwards expire between 2005-2022. Tax assets not previously recognized, but used during the year: Tax loss carryforwards 4 50 Value adjustments are based on the Group’s expectations as to the probability that a tax asset
can be utilized within a period of up to fi ve years.
CONSOLIDATED PARENT COMPANY
Note (DKK millions) 2004 2003 2004 2003
NOTES – BALANCE SHEET
qq Back to contents qq Back to assets qq Back to equity
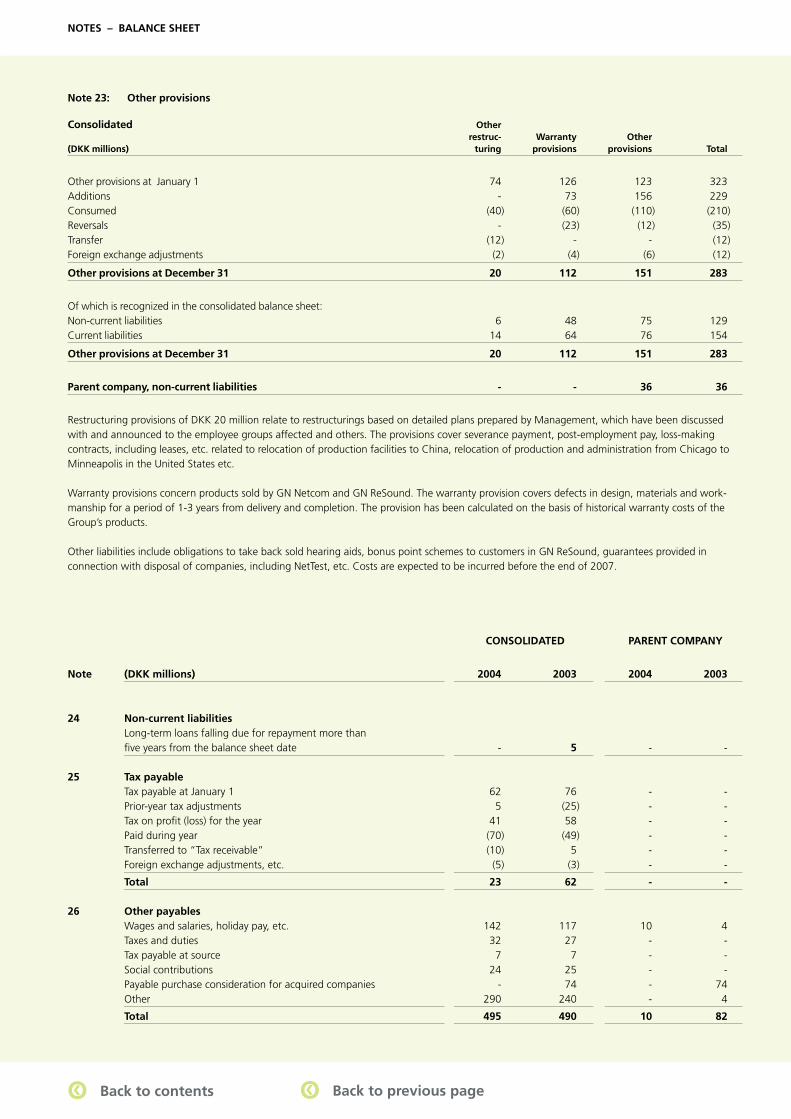
48 GN Store Nord – Annual Report 2004
Note 23: Other provisions
Consolidated Other restruc- Warranty Other (DKK millions) turing provisions provisions Total
Other provisions at January 1 74 126 123 323 Additions - 73 156 229 Consumed (40) (60) (110) (210)Reversals - (23) (12) (35)Transfer (12) - - (12)Foreign exchange adjustments (2) (4) (6) (12)
Other provisions at December 31 20 112 151 283
Of which is recognized in the consolidated balance sheet: Non-current liabilities 6 48 75 129Current liabilities 14 64 76 154
Other provisions at December 31 20 112 151 283
Parent company, non-current liabilities - - 36 36
Restructuring provisions of DKK 20 million relate to restructurings based on detailed plans prepared by Management, which have been discussed with and announced to the employee groups affected and others. The provisions cover severance payment, post-employment pay, loss-making contracts, including leases, etc. related to relocation of production facilities to China, relocation of production and administration from Chicago to Minneapolis in the United States etc.
Warranty provisions concern products sold by GN Netcom and GN ReSound. The warranty provision covers defects in design, materials and work-manship for a period of 1-3 years from delivery and completion. The provision has been calculated on the basis of historical warranty costs of the Group’s products.
Other liabilities include obligations to take back sold hearing aids, bonus point schemes to customers in GN ReSound, guarantees provided in connection with disposal of companies, including NetTest, etc. Costs are expected to be incurred before the end of 2007.
24 Non-current liabilities Long-term loans falling due for repayment more than fi ve years from the balance sheet date - 5 - -
25 Tax payable Tax payable at January 1 62 76 - - Prior-year tax adjustments 5 (25) - - Tax on profi t (loss) for the year 41 58 - - Paid during year (70) (49) - - Transferred to “Tax receivable” (10) 5 - - Foreign exchange adjustments, etc. (5) (3) - -
Total 23 62 - -
26 Other payables Wages and salaries, holiday pay, etc. 142 117 10 4 Taxes and duties 32 27 - - Tax payable at source 7 7 - - Social contributions 24 25 - - Payable purchase consideration for acquired companies - 74 - 74 Other 290 240 - 4
Total 495 490 10 82
CONSOLIDATED PARENT COMPANY
Note (DKK millions) 2004 2003 2004 2003
NOTES – BALANCE SHEET
qq Back to contents qq Back to previous page
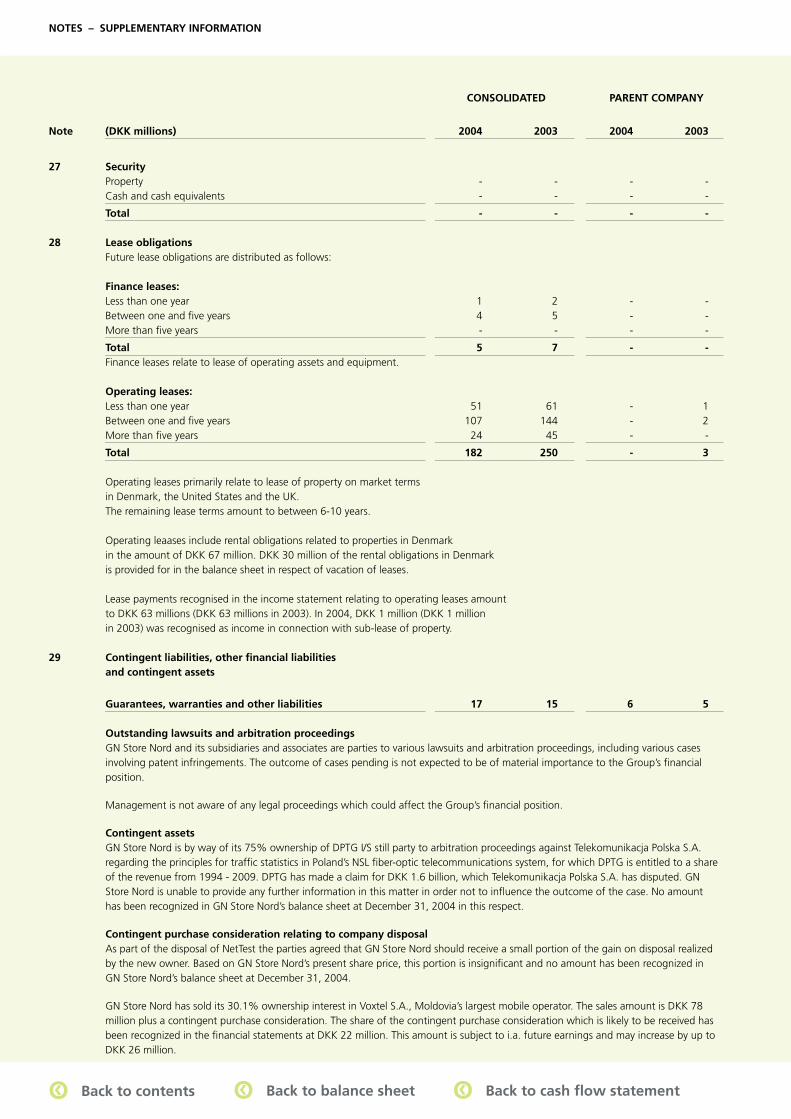
49GN Store Nord – Annual Report 2004
27 Security Property - - - - Cash and cash equivalents - - - -
Total - - - -
28 Lease obligations Future lease obligations are distributed as follows:
Finance leases: Less than one year 1 2 - - Between one and fi ve years 4 5 - - More than fi ve years - - - -
Total 5 7 - - Finance leases relate to lease of operating assets and equipment. Operating leases: Less than one year 51 61 - 1 Between one and fi ve years 107 144 - 2 More than fi ve years 24 45 - -
Total 182 250 - 3 Operating leases primarily relate to lease of property on market terms in Denmark, the United States and the UK. The remaining lease terms amount to between 6-10 years. Operating leaases include rental obligations related to properties in Denmark in the amount of DKK 67 million. DKK 30 million of the rental obligations in Denmark is provided for in the balance sheet in respect of vacation of leases. Lease payments recognised in the income statement relating to operating leases amount
to DKK 63 millions (DKK 63 millions in 2003). In 2004, DKK 1 million (DKK 1 million in 2003) was recognised as income in connection with sub-lease of property.
29 Contingent liabilities, other fi nancial liabilities and contingent assets
Guarantees, warranties and other liabilities 17 15 6 5
Outstanding lawsuits and arbitration proceedings GN Store Nord and its subsidiaries and associates are parties to various lawsuits and arbitration proceedings, including various cases
involving patent infringements. The outcome of cases pending is not expected to be of material importance to the Group’s fi nancial position.
Management is not aware of any legal proceedings which could affect the Group’s fi nancial position.
Contingent assets GN Store Nord is by way of its 75% ownership of DPTG I/S still party to arbitration proceedings against Telekomunikacja Polska S.A.
regarding the principles for traffi c statistics in Poland’s NSL fi ber-optic telecommunications system, for which DPTG is entitled to a share of the revenue from 1994 - 2009. DPTG has made a claim for DKK 1.6 billion, which Telekomunikacja Polska S.A. has disputed. GN Store Nord is unable to provide any further information in this matter in order not to infl uence the outcome of the case. No amount has been recognized in GN Store Nord’s balance sheet at December 31, 2004 in this respect.
Contingent purchase consideration relating to company disposal As part of the disposal of NetTest the parties agreed that GN Store Nord should receive a small portion of the gain on disposal realized
by the new owner. Based on GN Store Nord’s present share price, this portion is insignifi cant and no amount has been recognized in GN Store Nord’s balance sheet at December 31, 2004.
GN Store Nord has sold its 30.1% ownership interest in Voxtel S.A., Moldovia’s largest mobile operator. The sales amount is DKK 78 million plus a contingent purchase consideration. The share of the contingent purchase consideration which is likely to be received has been recognized in the fi nancial statements at DKK 22 million. This amount is subject to i.a. future earnings and may increase by up to DKK 26 million.
CONSOLIDATED PARENT COMPANY
Note (DKK millions) 2004 2003 2004 2003
NOTES – SUPPLEMENTARY INFORMATION
qq Back to contents qq Back to balance sheet qq Back to cash fl ow statement
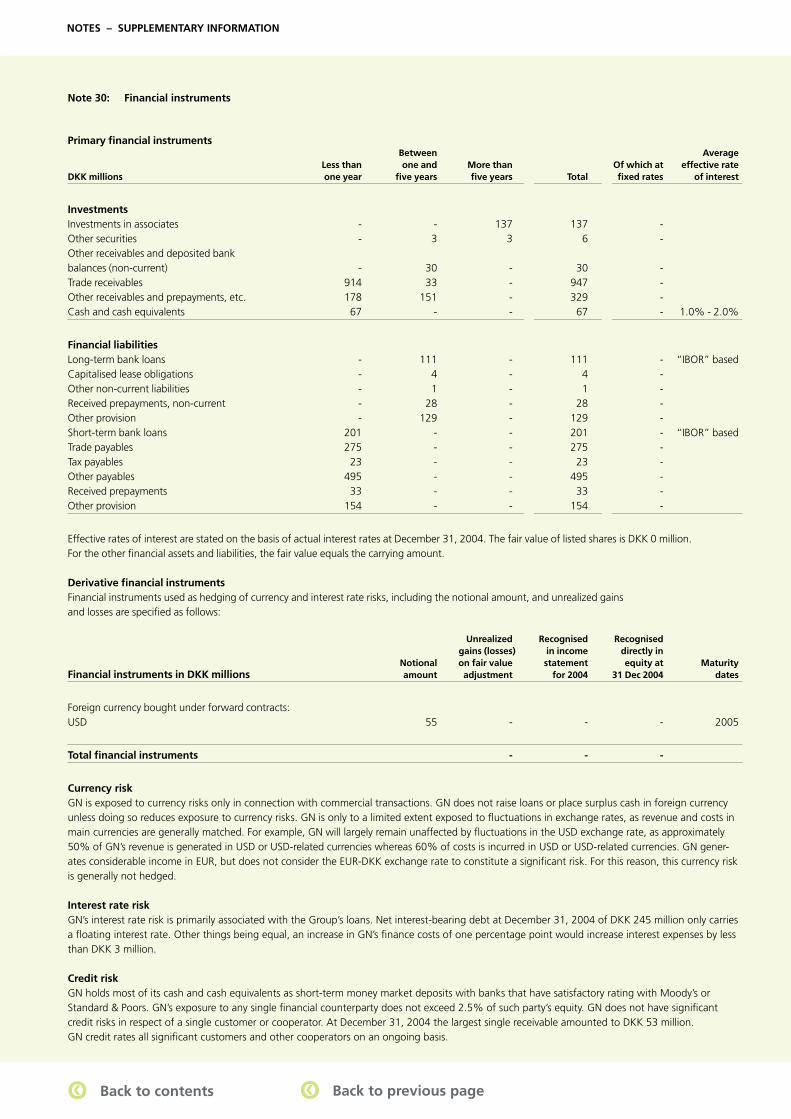
50 GN Store Nord – Annual Report 2004
Note 30: Financial instruments
Primary fi nancial instruments Between Average Less than one and More than Of which at effective rateDKK millions one year fi ve years fi ve years Total fi xed rates of interest
Investments Investments in associates - - 137 137 - Other securities - 3 3 6 - Other receivables and deposited bank balances (non-current) - 30 - 30 - Trade receivables 914 33 - 947 - Other receivables and prepayments, etc. 178 151 - 329 - Cash and cash equivalents 67 - - 67 - 1.0% - 2.0%
Financial liabilities Long-term bank loans - 111 - 111 - “IBOR” basedCapitalised lease obligations - 4 - 4 - Other non-current liabilities - 1 - 1 - Received prepayments, non-current - 28 - 28 - Other provision - 129 - 129 - Short-term bank loans 201 - - 201 - “IBOR” basedTrade payables 275 - - 275 - Tax payables 23 - - 23 - Other payables 495 - - 495 - Received prepayments 33 - - 33 - Other provision 154 - - 154 -
Effective rates of interest are stated on the basis of actual interest rates at December 31, 2004. The fair value of listed shares is DKK 0 million. For the other fi nancial assets and liabilities, the fair value equals the carrying amount. Derivative fi nancial instrumentsFinancial instruments used as hedging of currency and interest rate risks, including the notional amount, and unrealized gains and losses are specifi ed as follows:
Unrealized Recognised Recognised gains (losses) in income directly in Notional on fair value statement equity at MaturityFinancial instruments in DKK millions amount adjustment for 2004 31 Dec 2004 dates
Foreign currency bought under forward contracts: USD 55 - - - 2005
Total fi nancial instruments - - -
Currency riskGN is exposed to currency risks only in connection with commercial transactions. GN does not raise loans or place surplus cash in foreign currency unless doing so reduces exposure to currency risks. GN is only to a limited extent exposed to fl uctuations in exchange rates, as revenue and costs in main currencies are generally matched. For example, GN will largely remain unaffected by fl uctuations in the USD exchange rate, as approximately 50% of GN’s revenue is generated in USD or USD-related currencies whereas 60% of costs is incurred in USD or USD-related currencies. GN gener-ates considerable income in EUR, but does not consider the EUR-DKK exchange rate to constitute a signifi cant risk. For this reason, this currency risk is generally not hedged.
Interest rate riskGN’s interest rate risk is primarily associated with the Group’s loans. Net interest-bearing debt at December 31, 2004 of DKK 245 million only carries a fl oating interest rate. Other things being equal, an increase in GN’s fi nance costs of one percentage point would increase interest expenses by less than DKK 3 million.
Credit riskGN holds most of its cash and cash equivalents as short-term money market deposits with banks that have satisfactory rating with Moody’s or Standard & Poors. GN’s exposure to any single fi nancial counterparty does not exceed 2.5% of such party’s equity. GN does not have signifi cant credit risks in respect of a single customer or cooperator. At December 31, 2004 the largest single receivable amounted to DKK 53 million. GN credit rates all signifi cant customers and other cooperators on an ongoing basis.
NOTES – SUPPLEMENTARY INFORMATION
qq Back to contents qq Back to previous page
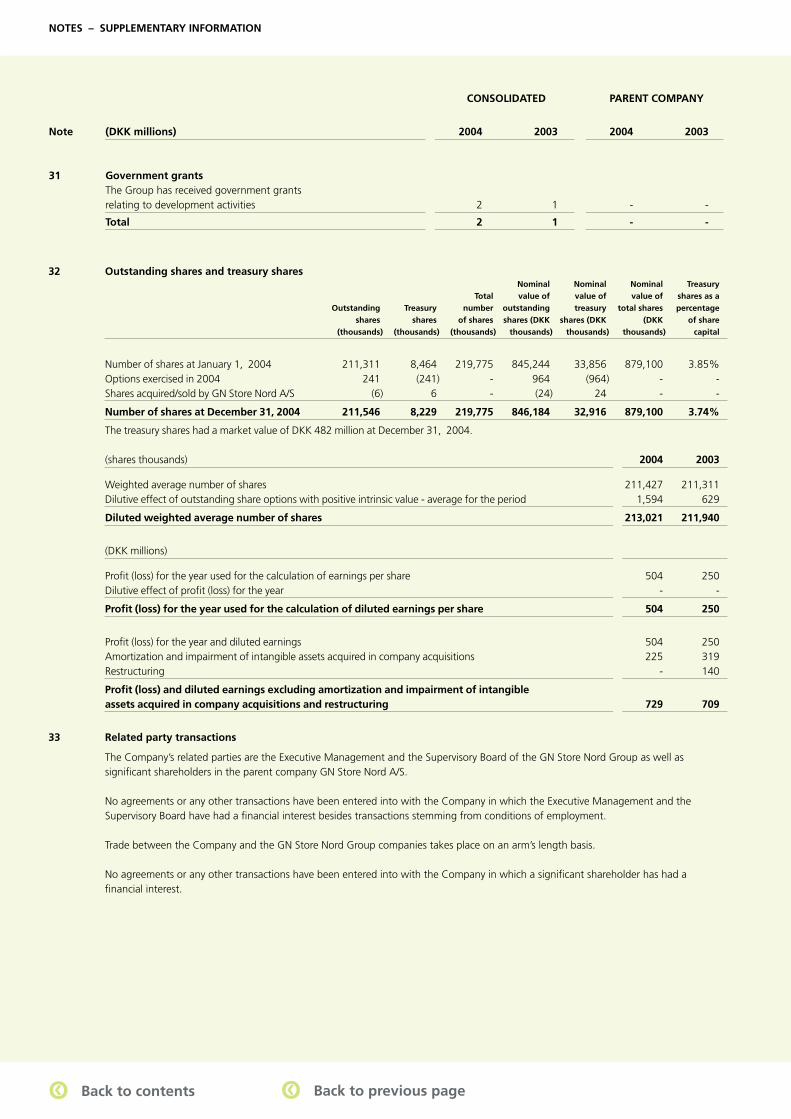
51GN Store Nord – Annual Report 2004
32 Outstanding shares and treasury shares Nominal Nominal Nominal Treasury Total value of value of value of shares as a Outstanding Treasury number outstanding treasury total shares percentage shares shares of shares shares (DKK shares (DKK (DKK of share (thousands) (thousands) (thousands) thousands) thousands) thousands) capital
Number of shares at January 1, 2004 211,311 8,464 219,775 845,244 33,856 879,100 3.85%Options exercised in 2004 241 (241) - 964 (964) - -Shares acquired/sold by GN Store Nord A/S (6) 6 - (24) 24 - -
Number of shares at December 31, 2004 211,546 8,229 219,775 846,184 32,916 879,100 3.74%
The treasury shares had a market value of DKK 482 million at December 31, 2004. (shares thousands) 2004 2003
Weighted average number of shares 211,427 211,311 Dilutive effect of outstanding share options with positive intrinsic value - average for the period 1,594 629
Diluted weighted average number of shares 213,021 211,940
(DKK millions)
Profi t (loss) for the year used for the calculation of earnings per share 504 250 Dilutive effect of profi t (loss) for the year - -
Profi t (loss) for the year used for the calculation of diluted earnings per share 504 250
Profi t (loss) for the year and diluted earnings 504 250 Amortization and impairment of intangible assets acquired in company acquisitions 225 319 Restructuring - 140
Profi t (loss) and diluted earnings excluding amortization and impairment of intangible assets acquired in company acquisitions and restructuring 729 709
33 Related party transactions
The Company’s related parties are the Executive Management and the Supervisory Board of the GN Store Nord Group as well as signifi cant shareholders in the parent company GN Store Nord A/S.
No agreements or any other transactions have been entered into with the Company in which the Executive Management and the Supervisory Board have had a fi nancial interest besides transactions stemming from conditions of employment.
Trade between the Company and the GN Store Nord Group companies takes place on an arm’s length basis.
No agreements or any other transactions have been entered into with the Company in which a signifi cant shareholder has had a fi nancial interest.
NOTES – SUPPLEMENTARY INFORMATION
CONSOLIDATED PARENT COMPANY
Note (DKK millions) 2004 2003 2004 2003
31 Government grants The Group has received government grants relating to development activities 2 1 - -
Total 2 1 - -
qq Back to contents qq Back to previous page
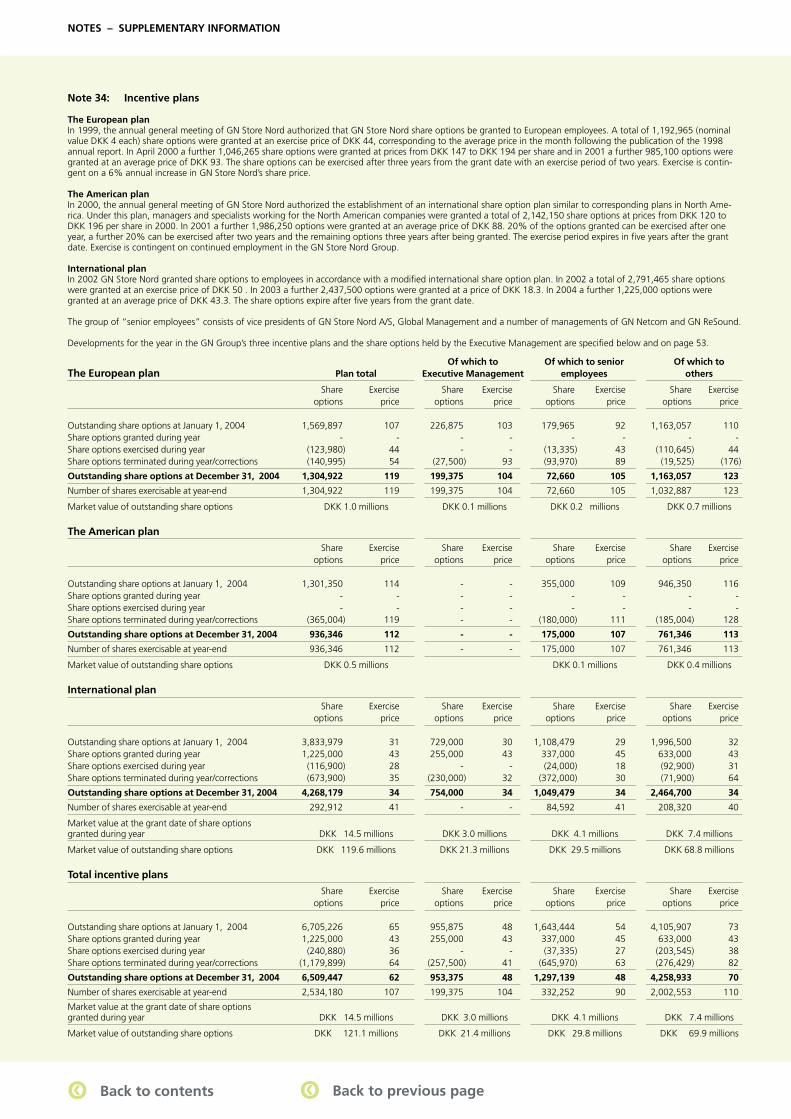
52 GN Store Nord – Annual Report 2004
Note 34: Incentive plans The European plan In 1999, the annual general meeting of GN Store Nord authorized that GN Store Nord share options be granted to European employees. A total of 1,192,965 (nominal value DKK 4 each) share options were granted at an exercise price of DKK 44, corresponding to the average price in the month following the publication of the 1998 annual report. In April 2000 a further 1,046,265 share options were granted at prices from DKK 147 to DKK 194 per share and in 2001 a further 985,100 options were granted at an average price of DKK 93. The share options can be exercised after three years from the grant date with an exercise period of two years. Exercise is contin-gent on a 6% annual increase in GN Store Nord’s share price.
The American plan In 2000, the annual general meeting of GN Store Nord authorized the establishment of an international share option plan similar to corresponding plans in North Ame-rica. Under this plan, managers and specialists working for the North American companies were granted a total of 2,142,150 share options at prices from DKK 120 to DKK 196 per share in 2000. In 2001 a further 1,986,250 options were granted at an average price of DKK 88. 20% of the options granted can be exercised after one year, a further 20% can be exercised after two years and the remaining options three years after being granted. The exercise period expires in fi ve years after the grant date. Exercise is contingent on continued employment in the GN Store Nord Group.
International planIn 2002 GN Store Nord granted share options to employees in accordance with a modifi ed international share option plan. In 2002 a total of 2,791,465 share options were granted at an exercise price of DKK 50 . In 2003 a further 2,437,500 options were granted at a price of DKK 18.3. In 2004 a further 1,225,000 options were granted at an average price of DKK 43.3. The share options expire after fi ve years from the grant date.
The group of “senior employees” consists of vice presidents of GN Store Nord A/S, Global Management and a number of managements of GN Netcom and GN ReSound.
Developments for the year in the GN Group’s three incentive plans and the share options held by the Executive Management are specifi ed below and on page 53.
Of which to Of which to senior Of which toThe European plan Plan total Executive Management employees others
Share Exercise Share Exercise Share Exercise Share Exercise options price options price options price options price
Outstanding share options at January 1, 2004 1,569,897 107 226,875 103 179,965 92 1,163,057 110Share options granted during year - - - - - - - - Share options exercised during year (123,980) 44 - - (13,335) 43 (110,645) 44 Share options terminated during year/corrections (140,995) 54 (27,500) 93 (93,970) 89 (19,525) (176)
Outstanding share options at December 31, 2004 1,304,922 119 199,375 104 72,660 105 1,163,057 123
Number of shares exercisable at year-end 1,304,922 119 199,375 104 72,660 105 1,032,887 123
Market value of outstanding share options DKK 1.0 millions DKK 0.1 millions DKK 0.2 millions DKK 0.7 millions
The American plan
Share Exercise Share Exercise Share Exercise Share Exercise options price options price options price options price
Outstanding share options at January 1, 2004 1,301,350 114 - - 355,000 109 946,350 116Share options granted during year - - - - - - - - Share options exercised during year - - - - - - - - Share options terminated during year/corrections (365,004) 119 - - (180,000) 111 (185,004) 128
Outstanding share options at December 31, 2004 936,346 112 - - 175,000 107 761,346 113
Number of shares exercisable at year-end 936,346 112 - - 175,000 107 761,346 113
Market value of outstanding share options DKK 0.5 millions DKK 0.1 millions DKK 0.4 millions
International plan
Share Exercise Share Exercise Share Exercise Share Exercise options price options price options price options price
Outstanding share options at January 1, 2004 3,833,979 31 729,000 30 1,108,479 29 1,996,500 32 Share options granted during year 1,225,000 43 255,000 43 337,000 45 633,000 43Share options exercised during year (116,900) 28 - - (24,000) 18 (92,900) 31 Share options terminated during year/corrections (673,900) 35 (230,000) 32 (372,000) 30 (71,900) 64
Outstanding share options at December 31, 2004 4,268,179 34 754,000 34 1,049,479 34 2,464,700 34
Number of shares exercisable at year-end 292,912 41 - - 84,592 41 208,320 40
Market value at the grant date of share options granted during year DKK 14.5 millions DKK 3.0 millions DKK 4.1 millions DKK 7.4 millions
Market value of outstanding share options DKK 119.6 millions DKK 21.3 millions DKK 29.5 millions DKK 68.8 millions
Total incentive plans
Share Exercise Share Exercise Share Exercise Share Exercise options price options price options price options price
Outstanding share options at January 1, 2004 6,705,226 65 955,875 48 1,643,444 54 4,105,907 73Share options granted during year 1,225,000 43 255,000 43 337,000 45 633,000 43 Share options exercised during year (240,880) 36 - - (37,335) 27 (203,545) 38 Share options terminated during year/corrections (1,179,899) 64 (257,500) 41 (645,970) 63 (276,429) 82
Outstanding share options at December 31, 2004 6,509,447 62 953,375 48 1,297,139 48 4,258,933 70
Number of shares exercisable at year-end 2,534,180 107 199,375 104 332,252 90 2,002,553 110
Market value at the grant date of share options granted during year DKK 14.5 millions DKK 3.0 millions DKK 4.1 millions DKK 7.4 millions
Market value of outstanding share options DKK 121.1 millions DKK 21.4 millions DKK 29.8 millions DKK 69.9 millions
NOTES – SUPPLEMENTARY INFORMATION
qq Back to contents qq Back to previous page
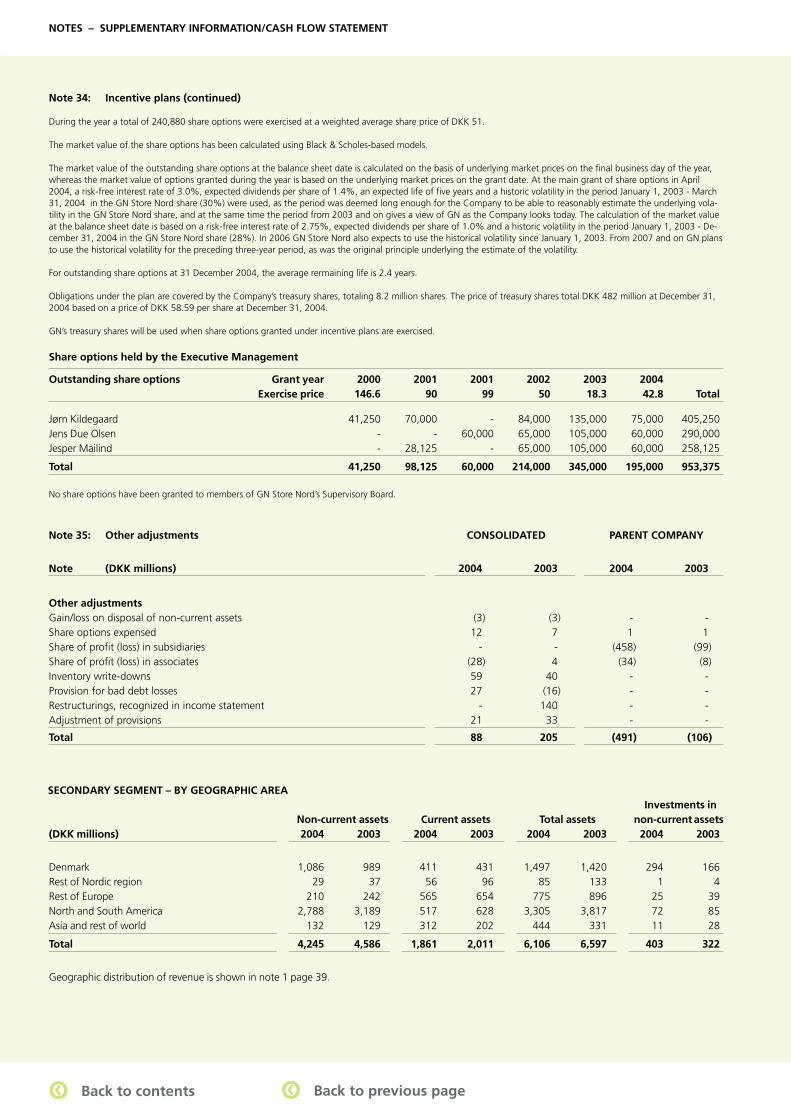
53GN Store Nord – Annual Report 2004
Other adjustments Gain/loss on disposal of non-current assets (3) (3) - - Share options expensed 12 7 1 1 Share of profi t (loss) in subsidiaries - - (458) (99)Share of profi t (loss) in associates (28) 4 (34) (8)Inventory write-downs 59 40 - - Provision for bad debt losses 27 (16) - - Restructurings, recognized in income statement - 140 - - Adjustment of provisions 21 33 - -
Total 88 205 (491) (106)
Note 34: Incentive plans (continued)
During the year a total of 240,880 share options were exercised at a weighted average share price of DKK 51.
The market value of the share options has been calculated using Black & Scholes-based models.
The market value of the outstanding share options at the balance sheet date is calculated on the basis of underlying market prices on the fi nal business day of the year, whereas the market value of options granted during the year is based on the underlying market prices on the grant date. At the main grant of share options in April 2004, a risk-free interest rate of 3.0%, expected dividends per share of 1.4%, an expected life of fi ve years and a historic volatility in the period January 1, 2003 - March 31, 2004 in the GN Store Nord share (30%) were used, as the period was deemed long enough for the Company to be able to reasonably estimate the underlying vola-tility in the GN Store Nord share, and at the same time the period from 2003 and on gives a view of GN as the Company looks today. The calculation of the market value at the balance sheet date is based on a risk-free interest rate of 2.75%, expected dividends per share of 1.0% and a historic volatility in the period January 1, 2003 - De-cember 31, 2004 in the GN Store Nord share (28%). In 2006 GN Store Nord also expects to use the historical volatility since January 1, 2003. From 2007 and on GN plans to use the historical volatility for the preceding three-year period, as was the original principle underlying the estimate of the volatility.
For outstanding share options at 31 December 2004, the average rermaining life is 2.4 years.
Obligations under the plan are covered by the Company’s treasury shares, totaling 8.2 million shares. The price of treasury shares total DKK 482 million at December 31, 2004 based on a price of DKK 58.59 per share at December 31, 2004.
GN’s treasury shares will be used when share options granted under incentive plans are exercised.
Share options held by the Executive Management
Outstanding share options Grant year 2000 2001 2001 2002 2003 2004 Exercise price 146.6 90 99 50 18.3 42.8 Total Jørn Kildegaard 41,250 70,000 - 84,000 135,000 75,000 405,250 Jens Due Olsen - - 60,000 65,000 105,000 60,000 290,000 Jesper Mailind - 28,125 - 65,000 105,000 60,000 258,125
Total 41,250 98,125 60,000 214,000 345,000 195,000 953,375
No share options have been granted to members of GN Store Nord’s Supervisory Board.
Investments in Non-current assets Current assets Total assets non-current assets(DKK millions) 2004 2003 2004 2003 2004 2003 2004 2003
Denmark 1,086 989 411 431 1,497 1,420 294 166 Rest of Nordic region 29 37 56 96 85 133 1 4 Rest of Europe 210 242 565 654 775 896 25 39 North and South America 2,788 3,189 517 628 3,305 3,817 72 85 Asia and rest of world 132 129 312 202 444 331 11 28
Total 4,245 4,586 1,861 2,011 6,106 6,597 403 322
Geographic distribution of revenue is shown in note 1 page 39.
NOTES – SUPPLEMENTARY INFORMATION/CASH FLOW STATEMENT
Note 35: Other adjustments CONSOLIDATED PARENT COMPANY
Note (DKK millions) 2004 2003 2004 2003
SECONDARY SEGMENT – BY GEOGRAPHIC AREA
qq Back to contents qq Back to previous page
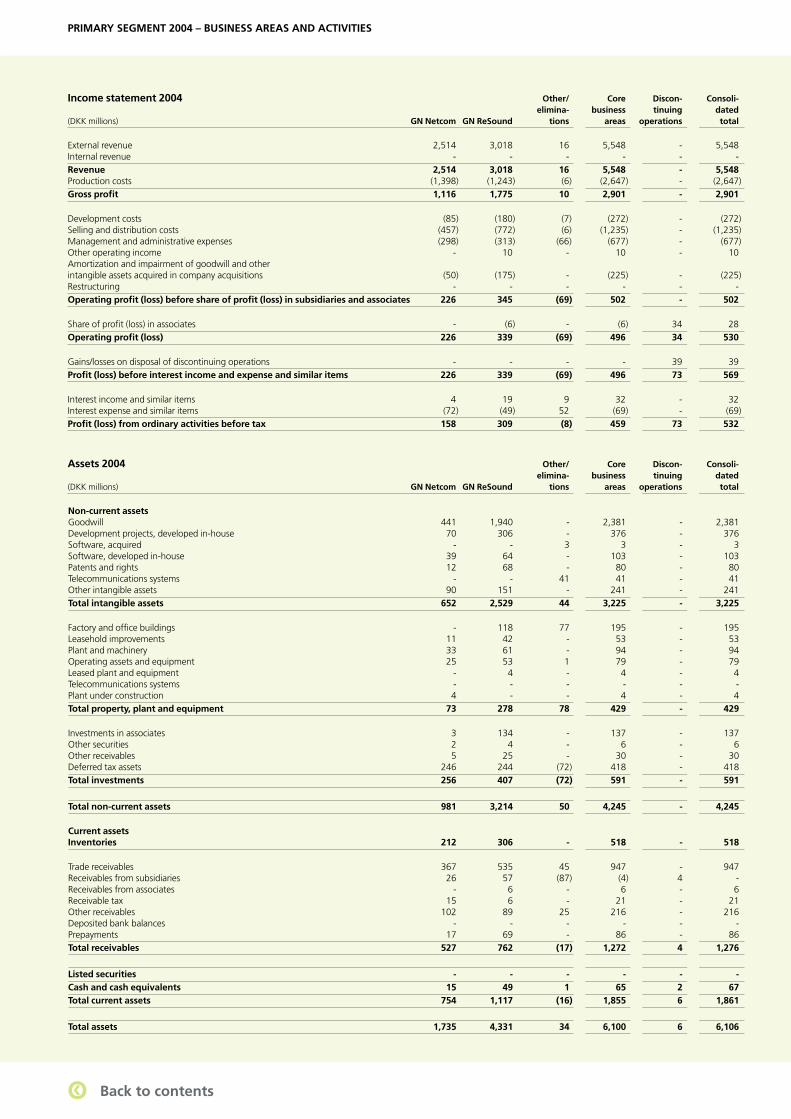
54 GN Store Nord – Annual Report 2004
PRIMARY SEGMENT 2004 – BUSINESS AREAS AND ACTIVITIES
Assets 2004 Other/ Core Discon- Consoli- elimina- business tinuing dated(DKK millions) GN Netcom GN ReSound tions areas operations total
External revenue 2,514 3,018 16 5,548 - 5,548 Internal revenue - - - - - - Revenue 2,514 3,018 16 5,548 - 5,548 Production costs (1,398) (1,243) (6) (2,647) - (2,647)Gross profi t 1,116 1,775 10 2,901 - 2,901 Development costs (85) (180) (7) (272) - (272)Selling and distribution costs (457) (772) (6) (1,235) - (1,235)Management and administrative expenses (298) (313) (66) (677) - (677)Other operating income - 10 - 10 - 10 Amortization and impairment of goodwill and other intangible assets acquired in company acquisitions (50) (175) - (225) - (225)Restructuring - - - - - - Operating profi t (loss) before share of profi t (loss) in subsidiaries and associates 226 345 (69) 502 - 502 Share of profi t (loss) in associates - (6) - (6) 34 28 Operating profi t (loss) 226 339 (69) 496 34 530 Gains/losses on disposal of discontinuing operations - - - - 39 39 Profi t (loss) before interest income and expense and similar items 226 339 (69) 496 73 569 Interest income and similar items 4 19 9 32 - 32 Interest expense and similar items (72) (49) 52 (69) - (69)Profi t (loss) from ordinary activities before tax 158 309 (8) 459 73 532
Non-current assets Goodwill 441 1,940 - 2,381 - 2,381 Development projects, developed in-house 70 306 - 376 - 376 Software, acquired - - 3 3 - 3 Software, developed in-house 39 64 - 103 - 103 Patents and rights 12 68 - 80 - 80 Telecommunications systems - - 41 41 - 41 Other intangible assets 90 151 - 241 - 241 Total intangible assets 652 2,529 44 3,225 - 3,225 Factory and offi ce buildings - 118 77 195 - 195 Leasehold improvements 11 42 - 53 - 53 Plant and machinery 33 61 - 94 - 94 Operating assets and equipment 25 53 1 79 - 79 Leased plant and equipment - 4 - 4 - 4 Telecommunications systems - - - - - - Plant under construction 4 - - 4 - 4 Total property, plant and equipment 73 278 78 429 - 429 Investments in associates 3 134 - 137 - 137 Other securities 2 4 - 6 - 6 Other receivables 5 25 - 30 - 30 Deferred tax assets 246 244 (72) 418 - 418 Total investments 256 407 (72) 591 - 591 Total non-current assets 981 3,214 50 4,245 - 4,245 Current assets Inventories 212 306 - 518 - 518 Trade receivables 367 535 45 947 - 947 Receivables from subsidiaries 26 57 (87) (4) 4 - Receivables from associates - 6 - 6 - 6 Receivable tax 15 6 - 21 - 21 Other receivables 102 89 25 216 - 216 Deposited bank balances - - - - - - Prepayments 17 69 - 86 - 86 Total receivables 527 762 (17) 1,272 4 1,276 Listed securities - - - - - - Cash and cash equivalents 15 49 1 65 2 67 Total current assets 754 1,117 (16) 1,855 6 1,861 Total assets 1,735 4,331 34 6,100 6 6,106
Income statement 2004 Other/ Core Discon- Consoli- elimina- business tinuing dated(DKK millions) GN Netcom GN ReSound tions areas operations total
qq Back to contents
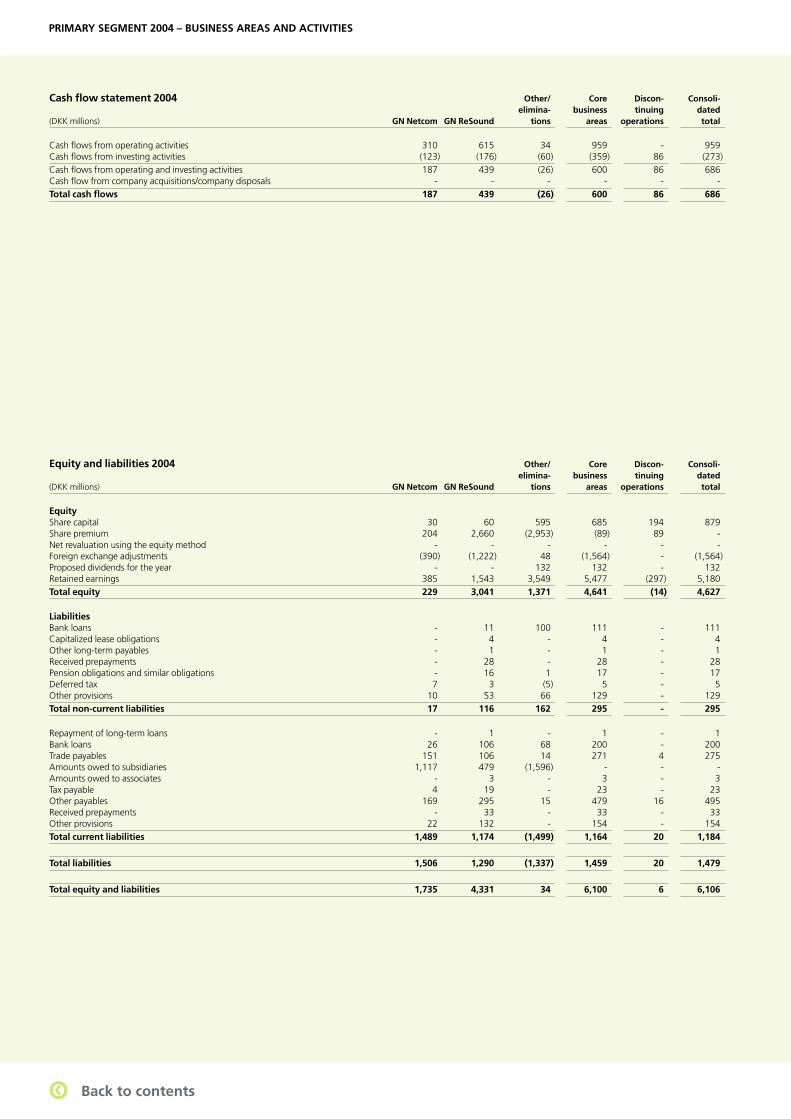
55GN Store Nord – Annual Report 2004
PRIMARY SEGMENT 2004 – BUSINESS AREAS AND ACTIVITIES
Equity and liabilities 2004 Other/ Core Discon- Consoli- elimina- business tinuing dated(DKK millions) GN Netcom GN ReSound tions areas operations total
Cash fl ow statement 2004 Other/ Core Discon- Consoli- elimina- business tinuing dated(DKK millions) GN Netcom GN ReSound tions areas operations total
Cash fl ows from operating activities 310 615 34 959 - 959 Cash fl ows from investing activities (123) (176) (60) (359) 86 (273)Cash fl ows from operating and investing activities 187 439 (26) 600 86 686 Cash fl ow from company acquisitions/company disposals - - - - - - Total cash fl ows 187 439 (26) 600 86 686
Equity Share capital 30 60 595 685 194 879 Share premium 204 2,660 (2,953) (89) 89 - Net revaluation using the equity method - - - - - - Foreign exchange adjustments (390) (1,222) 48 (1,564) - (1,564)Proposed dividends for the year - - 132 132 - 132 Retained earnings 385 1,543 3,549 5,477 (297) 5,180 Total equity 229 3,041 1,371 4,641 (14) 4,627 Liabilities Bank loans - 11 100 111 - 111 Capitalized lease obligations - 4 - 4 - 4 Other long-term payables - 1 - 1 - 1 Received prepayments - 28 - 28 - 28 Pension obligations and similar obligations - 16 1 17 - 17 Deferred tax 7 3 (5) 5 - 5 Other provisions 10 53 66 129 - 129 Total non-current liabilities 17 116 162 295 - 295 Repayment of long-term loans - 1 - 1 - 1 Bank loans 26 106 68 200 - 200 Trade payables 151 106 14 271 4 275 Amounts owed to subsidiaries 1,117 479 (1,596) - - - Amounts owed to associates - 3 - 3 - 3 Tax payable 4 19 - 23 - 23 Other payables 169 295 15 479 16 495 Received prepayments - 33 - 33 - 33 Other provisions 22 132 - 154 - 154 Total current liabilities 1,489 1,174 (1,499) 1,164 20 1,184 Total liabilities 1,506 1,290 (1,337) 1,459 20 1,479 Total equity and liabilities 1,735 4,331 34 6,100 6 6,106
qq Back to contents
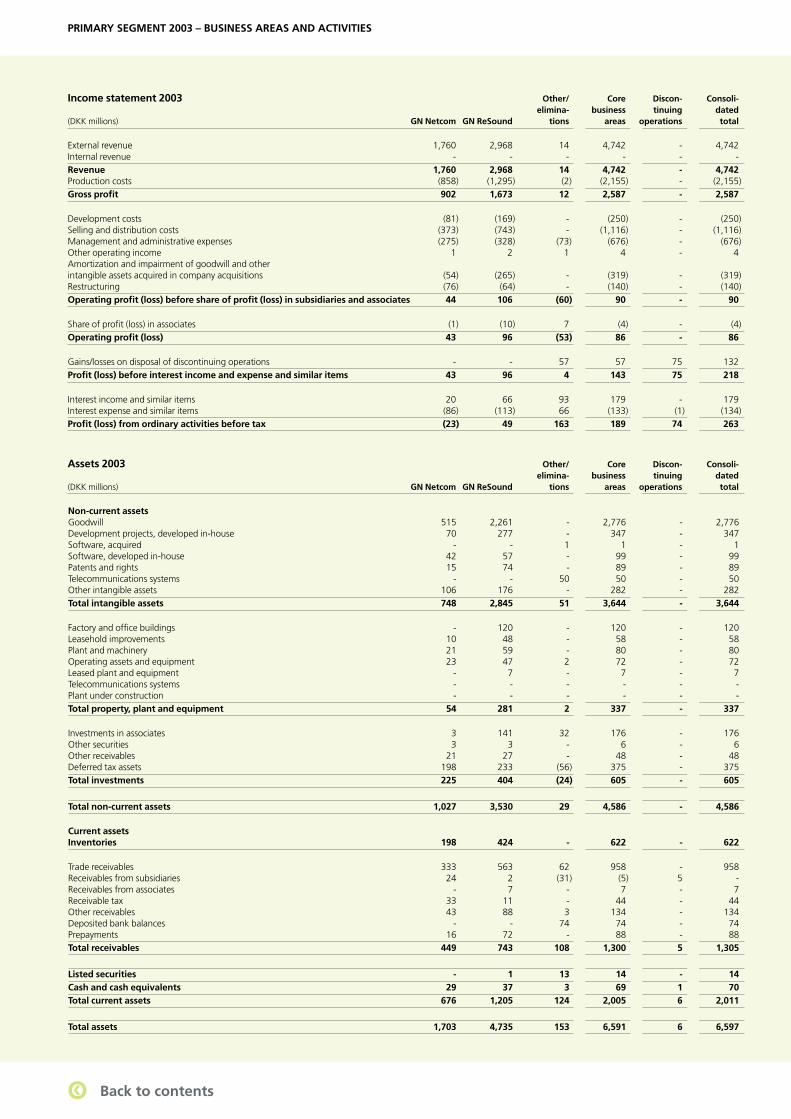
56 GN Store Nord – Annual Report 2004
Income statement 2003 Other/ Core Discon- Consoli- elimina- business tinuing dated(DKK millions) GN Netcom GN ReSound tions areas operations total
Assets 2003 Other/ Core Discon- Consoli- elimina- business tinuing dated(DKK millions) GN Netcom GN ReSound tions areas operations total
External revenue 1,760 2,968 14 4,742 - 4,742 Internal revenue - - - - - - Revenue 1,760 2,968 14 4,742 - 4,742 Production costs (858) (1,295) (2) (2,155) - (2,155)Gross profi t 902 1,673 12 2,587 - 2,587 Development costs (81) (169) - (250) - (250)Selling and distribution costs (373) (743) - (1,116) - (1,116)Management and administrative expenses (275) (328) (73) (676) - (676)Other operating income 1 2 1 4 - 4 Amortization and impairment of goodwill and other intangible assets acquired in company acquisitions (54) (265) - (319) - (319)Restructuring (76) (64) - (140) - (140)Operating profi t (loss) before share of profi t (loss) in subsidiaries and associates 44 106 (60) 90 - 90 Share of profi t (loss) in associates (1) (10) 7 (4) - (4)Operating profi t (loss) 43 96 (53) 86 - 86 Gains/losses on disposal of discontinuing operations - - 57 57 75 132 Profi t (loss) before interest income and expense and similar items 43 96 4 143 75 218 Interest income and similar items 20 66 93 179 - 179 Interest expense and similar items (86) (113) 66 (133) (1) (134)Profi t (loss) from ordinary activities before tax (23) 49 163 189 74 263
PRIMARY SEGMENT 2003 – BUSINESS AREAS AND ACTIVITIES
Non-current assets Goodwill 515 2,261 - 2,776 - 2,776 Development projects, developed in-house 70 277 - 347 - 347 Software, acquired - - 1 1 - 1 Software, developed in-house 42 57 - 99 - 99 Patents and rights 15 74 - 89 - 89 Telecommunications systems - - 50 50 - 50 Other intangible assets 106 176 - 282 - 282 Total intangible assets 748 2,845 51 3,644 - 3,644 Factory and offi ce buildings - 120 - 120 - 120 Leasehold improvements 10 48 - 58 - 58 Plant and machinery 21 59 - 80 - 80 Operating assets and equipment 23 47 2 72 - 72 Leased plant and equipment - 7 - 7 - 7 Telecommunications systems - - - - - - Plant under construction - - - - - - Total property, plant and equipment 54 281 2 337 - 337 Investments in associates 3 141 32 176 - 176 Other securities 3 3 - 6 - 6 Other receivables 21 27 - 48 - 48 Deferred tax assets 198 233 (56) 375 - 375 Total investments 225 404 (24) 605 - 605 Total non-current assets 1,027 3,530 29 4,586 - 4,586 Current assets Inventories 198 424 - 622 - 622 Trade receivables 333 563 62 958 - 958 Receivables from subsidiaries 24 2 (31) (5) 5 - Receivables from associates - 7 - 7 - 7 Receivable tax 33 11 - 44 - 44 Other receivables 43 88 3 134 - 134 Deposited bank balances - - 74 74 - 74 Prepayments 16 72 - 88 - 88 Total receivables 449 743 108 1,300 5 1,305 Listed securities - 1 13 14 - 14 Cash and cash equivalents 29 37 3 69 1 70 Total current assets 676 1,205 124 2,005 6 2,011 Total assets 1,703 4,735 153 6,591 6 6,597
qq Back to contents
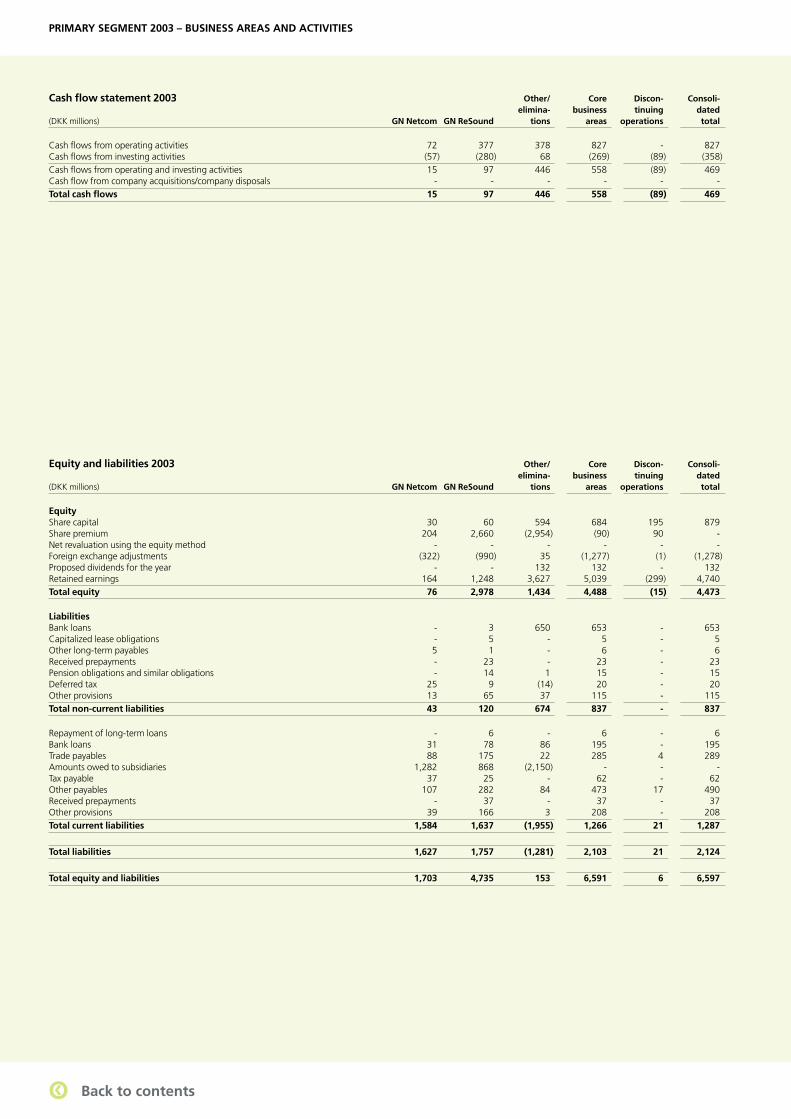
57GN Store Nord – Annual Report 2004
PRIMARY SEGMENT 2003 – BUSINESS AREAS AND ACTIVITIES
Equity and liabilities 2003 Other/ Core Discon- Consoli- elimina- business tinuing dated(DKK millions) GN Netcom GN ReSound tions areas operations total
Cash fl ow statement 2003 Other/ Core Discon- Consoli- elimina- business tinuing dated(DKK millions) GN Netcom GN ReSound tions areas operations total
Cash fl ows from operating activities 72 377 378 827 - 827 Cash fl ows from investing activities (57) (280) 68 (269) (89) (358)Cash fl ows from operating and investing activities 15 97 446 558 (89) 469 Cash fl ow from company acquisitions/company disposals - - - - - - Total cash fl ows 15 97 446 558 (89) 469
Equity Share capital 30 60 594 684 195 879 Share premium 204 2,660 (2,954) (90) 90 - Net revaluation using the equity method - - - - - - Foreign exchange adjustments (322) (990) 35 (1,277) (1) (1,278)Proposed dividends for the year - - 132 132 - 132 Retained earnings 164 1,248 3,627 5,039 (299) 4,740 Total equity 76 2,978 1,434 4,488 (15) 4,473 Liabilities Bank loans - 3 650 653 - 653 Capitalized lease obligations - 5 - 5 - 5 Other long-term payables 5 1 - 6 - 6 Received prepayments - 23 - 23 - 23 Pension obligations and similar obligations - 14 1 15 - 15 Deferred tax 25 9 (14) 20 - 20 Other provisions 13 65 37 115 - 115 Total non-current liabilities 43 120 674 837 - 837 Repayment of long-term loans - 6 - 6 - 6 Bank loans 31 78 86 195 - 195 Trade payables 88 175 22 285 4 289 Amounts owed to subsidiaries 1,282 868 (2,150) - - - Tax payable 37 25 - 62 - 62 Other payables 107 282 84 473 17 490 Received prepayments - 37 - 37 - 37 Other provisions 39 166 3 208 - 208 Total current liabilities 1,584 1,637 (1,955) 1,266 21 1,287 Total liabilities 1,627 1,757 (1,281) 2,103 21 2,124 Total equity and liabilities 1,703 4,735 153 6,591 6 6,597
qq Back to contents
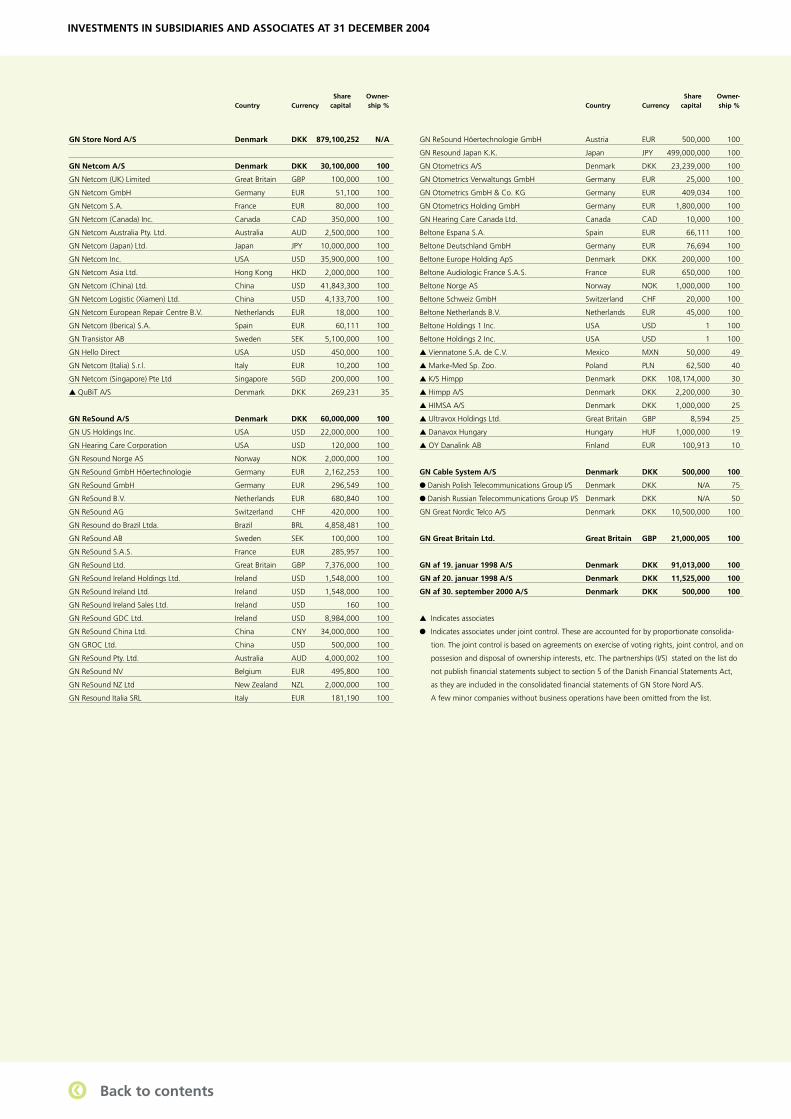
58 GN Store Nord – Annual Report 2004
GN Store Nord A/S Denmark DKK 879,100,252 N/A
GN Netcom A/S Denmark DKK 30,100,000 100
GN Netcom (UK) Limited Great Britain GBP 100,000 100
GN Netcom GmbH Germany EUR 51,100 100
GN Netcom S.A. France EUR 80,000 100
GN Netcom (Canada) Inc. Canada CAD 350,000 100
GN Netcom Australia Pty. Ltd. Australia AUD 2,500,000 100
GN Netcom (Japan) Ltd. Japan JPY 10,000,000 100
GN Netcom Inc. USA USD 35,900,000 100
GN Netcom Asia Ltd. Hong Kong HKD 2,000,000 100
GN Netcom (China) Ltd. China USD 41,843,300 100
GN Netcom Logistic (Xiamen) Ltd. China USD 4,133,700 100
GN Netcom European Repair Centre B.V. Netherlands EUR 18,000 100
GN Netcom (Iberica) S.A. Spain EUR 60,111 100
GN Transistor AB Sweden SEK 5,100,000 100
GN Hello Direct USA USD 450,000 100
GN Netcom (Italia) S.r.l. Italy EUR 10,200 100
GN Netcom (Singapore) Pte Ltd Singapore SGD 200,000 100
▲ QuBiT A/S Denmark DKK 269,231 35
GN ReSound A/S Denmark DKK 60,000,000 100
GN US Holdings Inc. USA USD 22,000,000 100
GN Hearing Care Corporation USA USD 120,000 100
GN Resound Norge AS Norway NOK 2,000,000 100
GN ReSound GmbH Höertechnologie Germany EUR 2,162,253 100
GN ReSound GmbH Germany EUR 296,549 100
GN ReSound B.V. Netherlands EUR 680,840 100
GN ReSound AG Switzerland CHF 420,000 100
GN Resound do Brazil Ltda. Brazil BRL 4,858,481 100
GN ReSound AB Sweden SEK 100,000 100
GN ReSound S.A.S. France EUR 285,957 100
GN ReSound Ltd. Great Britain GBP 7,376,000 100
GN ReSound Ireland Holdings Ltd. Ireland USD 1,548,000 100
GN ReSound Ireland Ltd. Ireland USD 1,548,000 100
GN ReSound Ireland Sales Ltd. Ireland USD 160 100
GN ReSound GDC Ltd. Ireland USD 8,984,000 100
GN ReSound China Ltd. China CNY 34,000,000 100
GN GROC Ltd. China USD 500,000 100
GN ReSound Pty. Ltd. Australia AUD 4,000,002 100
GN ReSound NV Belgium EUR 495,800 100
GN ReSound NZ Ltd New Zealand NZL 2,000,000 100
GN Resound Italia SRL Italy EUR 181,190 100
INVESTMENTS IN SUBSIDIARIES AND ASSOCIATES AT 31 DECEMBER 2004
GN ReSound Höertechnologie GmbH Austria EUR 500,000 100
GN Resound Japan K.K. Japan JPY 499,000,000 100
GN Otometrics A/S Denmark DKK 23,239,000 100
GN Otometrics Verwaltungs GmbH Germany EUR 25,000 100
GN Otometrics GmbH & Co. KG Germany EUR 409,034 100
GN Otometrics Holding GmbH Germany EUR 1,800,000 100
GN Hearing Care Canada Ltd. Canada CAD 10,000 100
Beltone Espana S.A. Spain EUR 66,111 100
Beltone Deutschland GmbH Germany EUR 76,694 100
Beltone Europe Holding ApS Denmark DKK 200,000 100
Beltone Audiologic France S.A.S. France EUR 650,000 100
Beltone Norge AS Norway NOK 1,000,000 100
Beltone Schweiz GmbH Switzerland CHF 20,000 100
Beltone Netherlands B.V. Netherlands EUR 45,000 100
Beltone Holdings 1 Inc. USA USD 1 100
Beltone Holdings 2 Inc. USA USD 1 100
▲ Viennatone S.A. de C.V. Mexico MXN 50,000 49
▲ Marke-Med Sp. Zoo. Poland PLN 62,500 40
▲ K/S Himpp Denmark DKK 108,174,000 30
▲ Himpp A/S Denmark DKK 2,200,000 30
▲ HIMSA A/S Denmark DKK 1,000,000 25
▲ Ultravox Holdings Ltd. Great Britain GBP 8,594 25
▲ Danavox Hungary Hungary HUF 1,000,000 19
▲ OY Danalink AB Finland EUR 100,913 10
GN Cable System A/S Denmark DKK 500,000 100
● Danish Polish Telecommunications Group I/S Denmark DKK N/A 75
● Danish Russian Telecommunications Group I/S Denmark DKK N/A 50
GN Great Nordic Telco A/S Denmark DKK 10,500,000 100
GN Great Britain Ltd. Great Britain GBP 21,000,005 100
GN af 19. januar 1998 A/S Denmark DKK 91,013,000 100
GN af 20. januar 1998 A/S Denmark DKK 11,525,000 100
GN af 30. september 2000 A/S Denmark DKK 500,000 100
▲ Indicates associates
● Indicates associates under joint control. These are accounted for by proportionate consolida-
tion. The joint control is based on agreements on exercise of voting rights, joint control, and on
possesion and disposal of ownership interests, etc. The partnerships (I/S) stated on the list do
not publish fi nancial statements subject to section 5 of the Danish Financial Statements Act,
as they are included in the consolidated fi nancial statements of GN Store Nord A/S.
A few minor companies without business operations have been omitted from the list.
Share Owner- Country Currency capital ship %
Share Owner- Country Currency capital ship %
qq Back to contents
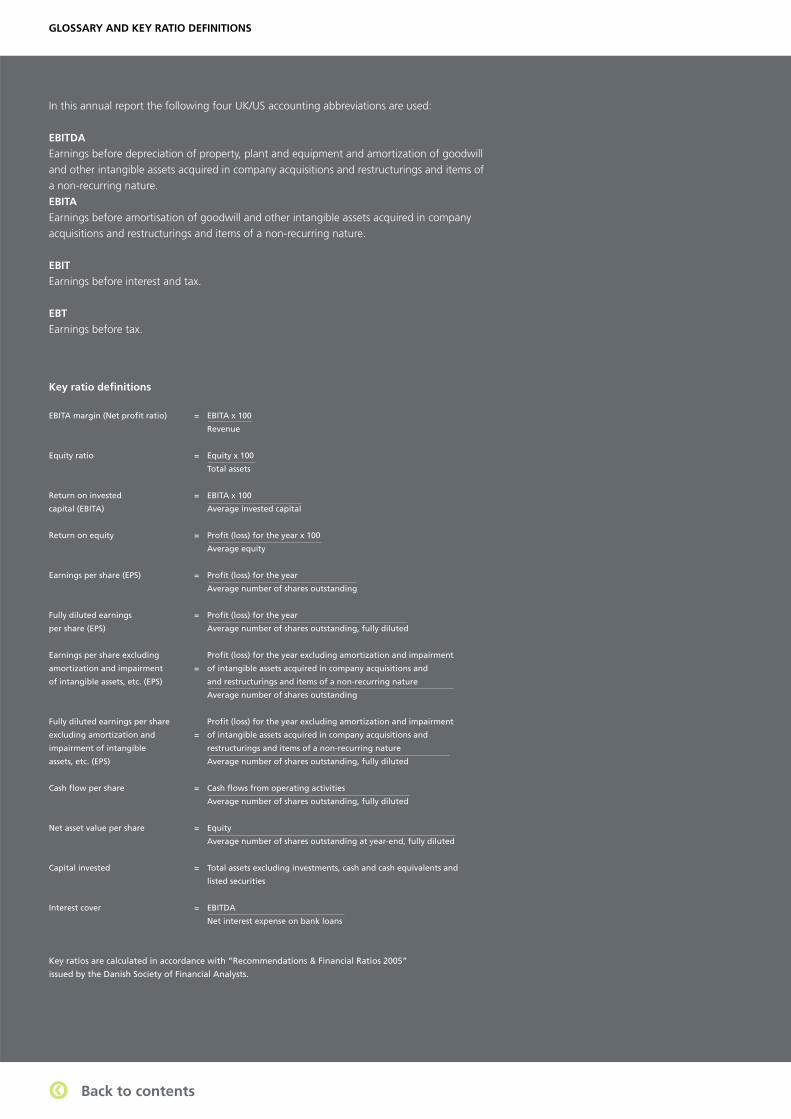
59GN Store Nord – Annual Report 2004
In this annual report the following four UK/US accounting ab bre vi a ti ons are used: EBITDA
Earnings before depreciation of property, plant and equip ment and amortization of goodwill and other in tan gi ble as sets acquired in company acquisitions and restructurings and items of a non-recurring nature. EBITA
Earnings before amortisation of goodwill and other intangible assets acquired in company ac qui si ti ons and restructurings and items of a non-recurring nature. EBIT
Earnings before interest and tax. EBT
Earnings before tax.
Key ratio defi nitions
EBITA margin (Net profi t ratio) = EBITA x 100
Revenue
Equity ratio = Equity x 100
Total assets
Return on invested = EBITA x 100
capital (EBITA) Average invested capital
Return on equity = Profi t (loss) for the year x 100
Average equity
Earnings per share (EPS) = Profi t (loss) for the year
Average number of shares outstanding
Fully diluted earnings = Profi t (loss) for the year
per share (EPS) Average number of shares out stan ding, fully diluted
Earnings per share excluding Profi t (loss) for the year ex clu ding amortization and impairment
amortization and im pair ment = of intangible assets acquired in company acquisitions and
of intangible assets, etc. (EPS) and restructurings and items of a non-recurring nature
Average number of shares outstanding
Fully diluted earnings per share Profi t (loss) for the year ex clu ding amortization and impairment
excluding amortization and = of intangible assets acquired in company acquisitions and
impairment of intangible restructurings and items of a non-recurring nature
assets, etc. (EPS) Average number of shares outstanding, fully diluted
Cash fl ow per share = Cash fl ows from operating activities
Average number of shares outstanding, fully diluted
Net asset value per share = Equity
Average number of shares outstanding at year-end, fully diluted
Capital invested = Total assets excluding investments, cash and cash equivalents and
listed securities
Interest cover = EBITDA
Net interest expense on bank loans
Key ratios are calculated in accordance with ”Recommendations & Financial Ratios 2005”
issued by the Danish Society of Financial Analysts.
GLOSSARY AND KEY RATIO DEFINITIONS
qq Back to contents
60 GN Store Nord – Annual Report 2004
International Financial Reporting Standards
The Annual Report for 2004 is presented in accordance with the international fi nancial reporting standards, IFRS, and additional Danish fi nancial reporting requirements for listed companies. For ease of comparison with GN’s foreign competitors, EBITDA, EBITA and other accounting terms that are not offi cial terms according to IFRS are used in both Management’s report and in the fi nancial statements. The relationship between IFRS accounts and other terms and con-cepts applied is explained on page 22 of this report. GN Store Nord has prepared its annual report in accordance with international fi nancial standards since 1999.
Forward-looking statements
The forward-looking statements in this annual report refl ect GN management’s current expectations for future events and fi nancial results. Statements regarding 2005 are, of course, subject to risks and uncertainties which may result in material deviations from expectations. Factors that may cause the actual results to deviate materially from expectations include but are not limited to general economic developments and developments in the fi nancial markets; technological develop-ments; changes and amendments to legislation and regulations in GN’s markets; changes in product demand; competition; shortages of components needed in production; and the integration of company acquisitions. For more information, see “GN 360° – Operations and risk” elsewhere in this Annual Report. This annual report should not be considered an offer to sell securities in GN Store Nord.
This publication is available in Danish and in English. In the event of any discrepancies, the Danish version shall be the governing text.
GN Store Nord A/SCVR number 24257843 – Edited by: GN Store Nord A/S, Corporate CommunicationsDesign, repro and production: Boje & Mobeck as – Translations: Fokus Translations – Printed by: PrintDivision as – ISSN 0903-6768
The Bluetooth word mark and logos are owned by Bluetooth SIG, Inc. and any use of such marks by GN Netcom is under license.
qq Back to contents
61GN Store Nord – Annual Report 2004
GN Net com
Metalbuen 66PO Box 201DK-2750 Ballerup
Tel.: +45 72 11 86 86Fax: +45 72 11 86 89www.gnnetcom.com
GN Mobile
Metalbuen 66PO Box 201DK-2750 Ballerup
Tel.: +45 72 11 86 86Fax: +45 72 11 86 89www.gnmobile.com
GN ReSound
Mårkærvej 2APO Box 224DK-2630 Taastrup
Tel.: +45 72 111 111Fax: +45 72 111 188www.gnresound-group.com
GN Oto me trics
Dybendalsvænget 2PO Box 119DK-2630 Taastrup
Tel.: +45 72 111 555Fax: +45 72 111 548www.gnotometrics.com
GN Store Nord A/S
Mårkærvej 2APO Box 249DK-2630 Taastrup
Tel.: +45 72 111 888Fax: +45 72 111 889www.gn.com
qq Back to contents