Embed Size (px)
Citation preview

Finance and Capital Committee
Information Item IV-A
November 1, 2018
GM/CEO’s Proposed FY2020 Budget

Washington Metropolitan Area Transit Authority
Board Action/Information Summary
Action Information MEAD Number: 202038
Resolution: Yes No
TITLE:
GM's Recommended FY2020 Budget
PRESENTATION SUMMARY:
Management will present the General Manager and Chief Executive Officer's(GM/CEO) recommended FY2020 Operating Budget and FY2020-2025 CapitalProgram.
PURPOSE:
To present the GM/CEO's recommended FY2020 budget to the Finance and CapitalCommittee and Board of Directors for consideration. Board adoption of the FY2020budget is scheduled for March 2019.
DESCRIPTION:
Key Highlights:
The GM/CEO's recommended budget totals $3.4 billion, including $2.0 billionof operating expenses and $1.4 billion in capital program spending in FY2020.In the interest of demonstrating compliance with new restrictions in Marylandand Virginia dedicated revenue legislation, the FY2020 Budget is broken downas follows: the base budget which reflects the new 3 percent subsidy growthcap, items legislatively excluded from the subsidy cap, and newcustomer/ridership initiatives which require additional support beyond the cap.The total operating subsidy, including capped subsidy, exclusions, and newinitiatives is $1.2 billion.
The budget is designed to attract new customers and deliver betterservice for current riders, by increasing service, making passes moreaffordable, and not raising fares or cutting existing services.The customer service recommendations include: expanding rush-hoursto provide more frequent rail service later in the morning and evening,extending the Yellow Line to Greenbelt to double rush-hour service atnine stations, running all Red Line trains to Glenmont to double rush-hourservice at an additional three stations, making all trains eight-cars long,and enhancing the value of Metro unlimited bus and rail passes.

These improvements are in addition to FY2019 service improvementssuch as the December 17, 2018 elimination of the “Grosvenor Turnback”which will double rush-hour service at four Red Line stations and wasapproved by the Board earlier this year, along with a separaterecommendation to improve Metro’s industry-first “Rush Hour Promise”by crediting customers for unscheduled delays of 10 minutes of more,rather than 15 minutes today, and other initiatives to improve Metro suchas the ability for customers to pay for their Metro trip using theirsmartphone.
Background and History:
FY2020 Budget Priorities include the following:
FY2020-2025 Capital Improvement Program
Fully fund system safety and complianceImprove the customer experienceContinue focus on system preservation and State of Good RepairMeet program budget and scheduleRamp up to $1.5 billion average annual programDevelop capital investment pipeline (D&E)
FY2020 Operating Budget
Increase ridershipImprove the customer experienceMaximize operating efficiencyIncrease non-fare revenuesEnhance employee engagement and developmentComply with Dedicated Revenue restrictions
Discussion:
The recommended FY2020 capital budget of $1.4 billion and six-year capitalplan of $9.2 billion include investment in ongoing projects, prioritized systempreservation and renewal needs from the Capital Needs Inventory. The six-year plan includes $436 million of reimbursable projects such as the SilverLine, the Potomac Yard infill station, and the Purple Line. PRIIA funding ends in Federal FY2019; without reauthorization from Congress,capital contributions from jurisdictions will increase by nearly $750 million overfive years. With PRIIA, Jurisdictional Match and System Performancerequirements will total $2.6 billion over six years. Without PRIIA, JurisdictionalMatch and System Performance will increase to $3.3 billion over that timeframe. New Initiatives
Fare and Pass adjustments to encourage ridership included in therecommended FY2020 Budget include:
Weekend Flat FarePass Enhancements
Reduce 7-Day Bus Pass ($17.50 to $15)Reduce 1-Day Visitor Pass Price ($14.75 to $13)Reduce 7-Day Visitor Pass Price ($38.50 to $38 on short trip, $60to $58 on full system pass)Add a 3-Day Weekday Pass ($28)Add unlimited bus in all Visitor and SelectPasses
New initiatives to drive ridership growth include:
Expand rush hour service periods. Trains would run at more-frequentrush hour service levels for an additional 30 minutes each morning (until10 a.m.) and an additional 90 minutes each evening (until 8:30 p.m.). Themove would reduce the time customers wait for trains and make Metro amore attractive option for customers who commute later in the morning,as well as those using Metro for evening activities. The GM’s budgetdoes not include any fare increases, and this recommendation would notchange the hours when peak fares are charged.Extend Yellow Line service to Greenbelt. Today, Yellow Line trains turnback at Mt. Vernon Square during rush hours and at Fort Totten at allother times. The GM’s budget recommendation would extend everyYellow Line train to Greenbelt, which would double service during rushhours and address current crowding conditions at the nine stations northof Mt Vernon Square (Shaw-Howard, U Street, Columbia Heights,Georgia Ave-Petworth, Fort Totten, West Hyattsville, Prince George’sPlaza, College Park, and Greenbelt). During off-peak times, the fourstations north of Fort Totten would see an increase in service. Manycurrent Green Line customers traveling to Yellow Line stations in Virginia(e.g. Reagan National Airport) would be able to make the trip withoutchanging trains.Run all Red Line trains to Glenmont. Currently, some Red Line trains“turn back” at Silver Spring, while others operate to the end of the line atGlenmont. In a move intended to simplify Metro’s service pattern forcustomers while increasing service at another three Red Line stations,Wiedefeld will recommend running all Red Line trains to Glenmont. Theproposal would complement a related service enhancement on theShady Grove end of the Red Line: Beginning December 17, 2018, allRed Line trains will begin/end at Shady Grove, instead of some turningback at Grosvenor. As a result, rush-hour service levels will double atfour stations: Shady Grove, Rockville, Twinbrook, and White Flint.Expand all trains to the maximum length of 8 cars. The GM’s budgetrecommends that all trains be increased to their maximum length of eightcars to increase capacity and reduce crowding. The move would also

allow Metro to simplify its yard and maintenance operations bystandardizing trainsets (i.e. reducing the need to continually add andremove cars to trains).
Risks Risks to the Proposed Operating Budget include Federal uncertaintysurrounding the PRIIA program, formula funding, the transit benefit and federalemployment and contracting levels. Ridership uncertainty is another risk, dueto changes in trip-making and the broader transportation market (telework,alternate modes, gas prices, etc.). Continued paratransit cost growthcontributes risk to the FY2020 budget, as do unfunded initiatives to coveremergencies and special events (the Rainy Day fund) and increasing Pensionand OPEB liabilities.
FUNDING IMPACT:
Information item only, no immediate impact on funding. Project Manager: Dennis Anosike
ProjectDepartment/Office: CFO/OMBS
TIMELINE:
Previous ActionsSeptember-October 2018 – staff preparation ofrecommended FY2020 Operating and FY2020-2025Capital budgets
Anticipated actionsafter presentation
December 2018 – Board authorization of public hearingand budget deliberations January-February 2019 – Budget deliberations, publicoutreach and public comment period March 2019 – Board adoption of the FY2020 Budget andFY2020-2025 Capital Program April 2019 – Submit Federal grant applications July 2019 – Fiscal Year 2020 begins
RECOMMENDATION:
This is an information item. Budget adoption is scheduled for March 2019. Budgetadoption in March is necessary to ensure uninterrupted regional funding of the capitalprogram and to allow for the timely application and award of FTA grants.

WASHINGTON METROPOLITAN AREA TRANSIT AUTHORITY1
FY2020 Proposed Budget
Finance & Capital CommitteeNovember 1, 2018

WASHINGTON METROPOLITAN AREA TRANSIT AUTHORITY2
Purpose
• Capital and Operating Budget Overview
• Proposed FY2020-2025 Capital Program
• Proposed FY2020 Operating Budget
• Schedule
Present the General Manager/CEO’s Recommended FY2020 Operating Budget and FY2020-2025 Capital Improvement Program

WASHINGTON METROPOLITAN AREA TRANSIT AUTHORITY3
FY2020 Budget Priorities
FY2020-2025 Capital Improvement Program • Fully fund system safety and compliance• Improve customer experience• Continue focus on system preservation and State of
Good Repair• Meet program budget and schedule• Ramp up to $1.5 billion average annual program• Develop capital investment pipeline (D&E)
FY2020 Operating Budget• Increase ridership• Improve customer experience• Maximize operating efficiency• Increase non-fare revenues• Enhance employee engagement and development• Comply with Dedicated Revenue restrictions

WASHINGTON METROPOLITAN AREA TRANSIT AUTHORITY4
FY2020-2025 Proposed Capital Improvement Program
WASHINGTON METROPOLITAN AREA TRANSIT AUTHORITY5
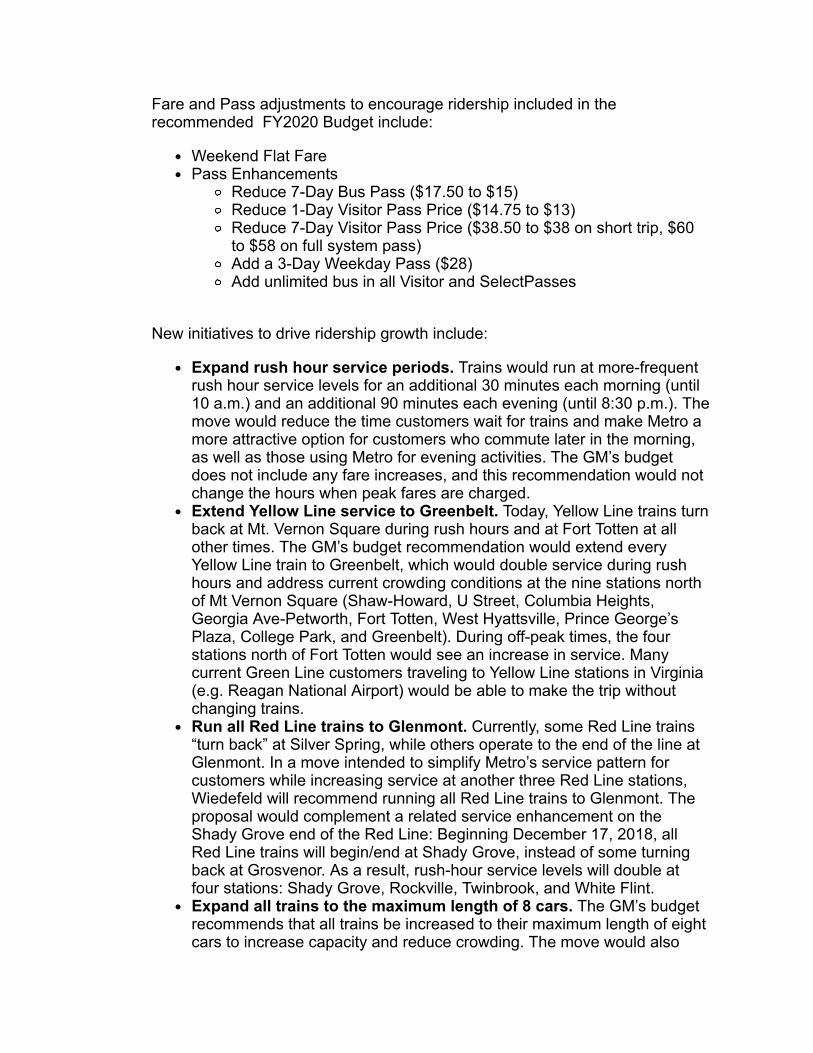
FY2020 Proposed Capital Budget• Planned investment of $1.4 billion • Over 85 percent of planned investment already underway
Six Year Plan• Proposed $9.3 billion six-year investment in on ongoing projects,
prioritized system preservation and renewal needs from Capital Needs Inventory
— Includes $436 million of reimbursable projects such as Silver Line, Potomac Yard and Purple Line
• Includes Development and Evaluation Program to advance capital project pipeline
• PRIIA funding ends in Federal Fiscal Year 2019 - without reauthorization contribution from Jurisdictions will increase by nearly $750 million over five years
FY2020-2025 Proposed Capital Improvement Program

WASHINGTON METROPOLITAN AREA TRANSIT AUTHORITY6
$403 $410 $418 $426 $434 $443 $451
$384 $384 $462 $515
$608 $665 $692
$311 $352 $337
$337
$336 $336 $333 $149
$149
$149 $149 $149
$33 $81
$133 $83
$80 $37 $22
$1,279
$1,375
$1,499 $1,509
$1,606 $1,630 $1,646
$0
$200
$400
$600
$800
$1,000
$1,200
$1,400
$1,600
$1,800
FY2019 FY2020 FY2021 FY2022 FY2023 FY2024 FY2025
$ in
mill
ions
Jurisdictional Match & SP Dedicated Funding Federal Federal PRIIA Reimbursable Projects Total
With PRIIA, 6 Year $9.3 billion Capital Investment Program for System Safety and Reliability
$0.4B
$2.9B
$2.6B
$3.3B
FY2020-2025 Proposed Capital Improvement Program
Note: Capital funding sources include an additional $23M for service disruptions associated with major capital projects
$0.74B

WASHINGTON METROPOLITAN AREA TRANSIT AUTHORITY7
$125 $140 $144 $146 $148 $151 $153
$158 $138 $140 $143 $146 $149 $152
$120 $132 $134 $137 $140 $143 $146
$403 $410 $418 $426 $434 $443 $451
$0
$100
$200
$300
$400
$500
$600
FY2019 FY2020 FY2021 FY2022 FY2023 FY2024 FY2025
$ in
mill
ions
District of Columbia State of Maryland Commonwealth of Virginia
Jurisdictional Match and System Performance with PRIIA is $2.6 billion
$0.83B
$0.88B
$0.87B
FY2020-2025 Proposed Capital Improvement Program

WASHINGTON METROPOLITAN AREA TRANSIT AUTHORITY8
$125 $140 $193 $196 $198 $200 $202
$158 $138
$190 $192 $195 $198 $201
$120 $132
$184 $186 $190 $193 $196
$403 $410
$566 $575 $583 $591 $599
$0
$100
$200
$300
$400
$500
$600
FY2019 FY2020 FY2021 FY2022 FY2023 FY2024 FY2025
$ in
mill
ions
District of Columbia State of Maryland Commonwealth of Virginia
Jurisdictional Match and System Performance without PRIIA is $3.3 billion
$1.01B
$1.13B
$1.12B
FY2020-2025 Proposed Capital Improvement Program

WASHINGTON METROPOLITAN AREA TRANSIT AUTHORITY9
Improving Capital Program Delivery and Service Reliability
$714
$1,023
$1,163 $1,247
$1,324
FY2015 FY2016 FY2017 FY2018 FY2019forecast
Capital Program Investment Ramp-Up Key Resulting Improvements
• 550+ New 7000 Series Railcars Now in Service• Railcar Performance Highest in Eight Years –
More Than 100,000 Miles Between Delays• Track Rehabilitation & Preventive Maintenance
Programs Reducing Delays• 88 percent of rail trips On-Time Since Early 2018• Underground Cellular & WIFI Availability Expanding• Brighter & Energy Efficient Station Lighting
Installations Underway• Escalator & Elevator Replacement and
Rehabilitation Programs• New Buses & MetroAccess Vehicles in Service• New Cinder Bed Road & Andrews Federal Center
Bus Facilities Nearing Completion
FY2020-2025 Proposed Capital Improvement Program
Notes: FY2019 expenditure forecast as of October 2018. Dollars in millions. Forecast currently shows projects ahead of schedule, $46 million above the plan. Staff will request a budget amendment if the forecast holds.

WASHINGTON METROPOLITAN AREA TRANSIT AUTHORITY10
FY2020-2025 Proposed Capital Improvement Program
FY2020-2025 Investment by Asset Category
12%
14%
16%
23%
15%
20%
Bus & ParatransitVehicles
Business Support
Rail Systems
$9.3B100% =
Stations &Passenger Facilities
Track & Structures
New railcar fleet & OH Facility
▪ All 7000 series cars in service▪ Begin taking delivery of 8000 series ▪ Construction of new overhaul facility
Bus Garages and Fleet
Track Rehab & Tunnels
Signals & Communications
Railcars▪ Replacement of Northern and Bladensburg Bus
Garages▪ Bus and MetroAccess fleet replacement
Station Upgrades & Capacity
▪ Replacement of escalators and escalators▪ D&E capacity and circulation improvements at
core stations ▪ Modernize existing fare collection system
▪ Continue replacement of track components▪ Complete water remediation and ventilation in
tunnels▪ Third rail reconfiguration
Admin and IT Infrastructure
▪ Consolidation of WMATA offices▪ Continue upgrades of IT infrastructure
▪ Complete radio and cellular upgrades▪ D&E of next generation train control
technology

WASHINGTON METROPOLITAN AREA TRANSIT AUTHORITY11
FY2020-2025 Proposed Capital Improvement Program
Railcar Investments
Planned Investment FY2019 FY2020 Six Year
Railcar Programs $386 $255 $1,783
Acquire, rehabilitate, and maintain railcars and railcar facilities in state of good repair to provide safe and reliable Metrorail service
Active Projects
• New 7000 Series Railcars - 748 cars in service in 2019
• Railcar Rehabilitation & Maintenance Programs
Project Development/ Procurement
• New 8000 Series Railcars
• Railcar Heavy Maintenance & Overhaul Facility
Development & Evaluation
• Rail Yard Facility Rehabilitation & Upgrade Program
Notes: Expenditure forecast as of October 2018. Dollars in millions.

WASHINGTON METROPOLITAN AREA TRANSIT AUTHORITY12
FY2020-2025 Proposed Capital Improvement Program
Rail Systems Investments
Planned Investment FY2019 FY2020 Six Year
Rail System Programs $161 $187 $1,225
Replace, rehabilitate and maintain rail power, signal and communications systems in a state of good repair to provide safe and reliable Metrorail service.
Notes: Expenditure forecast as of October 2018. Dollars in millions.
Active Projects
• Radio & Wireless Upgrades – cellular in all underground in 2020; radio system deployed by 2022
• Rail Power System Rehabilitation (Systemwide) & Upgrades (Orange/Blue/Yellow Lines)
• Train Control System Rehabilitation
Project Development/ Procurement
• Rail Power System Upgrades (Red, Yellow, Green Lines)
Development & Evaluation
• Train Control System Modernization

WASHINGTON METROPOLITAN AREA TRANSIT AUTHORITY13
FY2020-2025 Proposed Capital Improvement Program
Track and Structures Investments
Planned Investment FY2019 FY2020 Six Year
Track and Structures Programs $111 $171 $1,491
Replace, rehabilitate, maintain, and upgrade track and rail infrastructure including bridges, tunnels, and cross-overs
Notes: Expenditure forecast as of October 2018. Dollars in millions.
Active Projects
• Track Rehabilitation and Preventive Maintenance Programs
• Tunnel Lighting Program
Project Development/ Procurement
• Tunnel Water Mitigation Program
• Track Maintenance Equipment
• Bridge & Aerial Structure Rehabilitation & Maintenance Program
Development & Evaluation
• Blue, Orange, Silver Line Corridor Reliability & Capacity Alternatives Analysis (Potential Rosslyn Tunnel)
• Capacity & Reliability of D&G Junction Near Stadium-Armory

WASHINGTON METROPOLITAN AREA TRANSIT AUTHORITY14
FY2020-2025 Proposed Capital Improvement Program
Station and Passenger Facility Investments
Planned Investment FY2019 FY2020 Six Year
Station and Passenger Facility Programs $260 $360 $2,066
Construct, replace and rehabilitate rail station and passenger facilities to provide safe and reliable service to customers
Active Projects
• Elevator & Escalator Rehabilitation & Replacement
• Station Lighting & Cooling Programs
• Parking Garage Rehabilitation
• Station Entrance Canopies• Silver Line Extension
Construction Support (Reimbursable)
• Potomac Yard Station (Reimbursable)
Project Development/ Procurement
• Station Platform Rehabilitation Program
• Bicycle & Pedestrian Access Improvement Program
• Union Station Entrance Improvements
Development & Evaluation
• Station Customer Circulation & Access Improvements (Core Stations & Jurisdiction-Sponsored Projects)
• Shady Grove Station & Track Infrastructure
• Station Audio & Digital Signage Improvements
Notes: Expenditure forecast as of October 2018. Dollars in millions.

WASHINGTON METROPOLITAN AREA TRANSIT AUTHORITY15
FY2020-2025 Proposed Capital Improvement Program
Bus and Paratransit Investments
Planned Investment FY2019 FY2020 Six Year
Bus and Paratransit Programs $183 $205 $1,374
Acquire, rehabilitate and maintain buses and paratransit vehicles and supporting facilities and systems in a state of good repair to provide safe and reliable Metrobus and MetroAccess service
Active Projects
• New Buses – 122 planned for FY2020
• New MetroAccess Vehicles – 275 planned for FY2020
• Bus Rehabilitation & Maintenance Programs
• Andrews Federal Center Bus Facility – Open for operation in 2019
Project Development/ Procurement
• Replacement of Bladensburg Bus Garage
• Replacement of Northern Bus Garage
• Transit Signal Priority Program Expansion
• Bus Shelter Replacement Program
Development & Evaluation
• Bus Transformation Strategy
• Western Bus Garage Replacement
• Bus Facility Rehabilitation Program
Notes: Expenditure forecast as of October 2018. Dollars in millions.

WASHINGTON METROPOLITAN AREA TRANSIT AUTHORITY16
FY2020-2025 Proposed Capital Improvement Program
Business Support Investments
Planned Investment FY2019 FY2020 Six Year
Business Support Programs $224 $174 $1,302
Acquire, rehabilitate and maintain support facilities, information technology infrastructure and systems, and other equipment and infrastructure to support safe and reliable transit service and business functions
Active Projects
• WMATA Office Consolidation Project
• Roof Rehabilitation• IT Infrastructure &
System Improvements
Project Development/ Procurement
• Rail & Bus Control Centers
• Financial System Upgrades
Development & Evaluation
• Asset Management and Work-Order System Upgrades
• Data Center Replacement
Notes: Expenditure forecast as of October 2018. Dollars in millions.

WASHINGTON METROPOLITAN AREA TRANSIT AUTHORITY17
FY2020-2025 Proposed Capital Improvement Program
Planned Investment FY2019 FY2020 Six Year
Railcars $386 $255 $1,783
Rail Systems $161 $187 $1,225
Track and Structures $111 $171 $1,491
Stations and Passenger Facilities $260 $360 $2,066
Bus and Paratransit $183 $205 $1,374
Business Support $224 $174 $1,302
Total $1,324 $1,352 $9,241Notes: Expenditure forecast as of October 2018. Dollars in millions.

WASHINGTON METROPOLITAN AREA TRANSIT AUTHORITY18
FY2020 Proposed Operating Budget

WASHINGTON METROPOLITAN AREA TRANSIT AUTHORITY19
Base Operating Subsidy
FY2020 Proposed Operating Budget Structure
FY2020 Capped Subsidy
Allowable Above Base Operating Subsidy
FY2020 BudgetSubsidy
3% Subsidy Growth Cap
FY2019 Subsidy
FY2020 Capped Subsidy
Legislatively Excluded
Subsidy Growth Above 3% Cap

WASHINGTON METROPOLITAN AREA TRANSIT AUTHORITY20
FY2020 Proposed Operating Budget
Base Operating Subsidy Maintains current Hours of Service Meets 3% legal operating subsidy growth cap
Allowable Above Base Subsidy Includes Silver Line Phase 2 ramp up Mandated paratransit services Occupational Health and Safety requirements

WASHINGTON METROPOLITAN AREA TRANSIT AUTHORITY21
FY2020 Proposed Operating Budget
FY2020 Base Operating Subsidy Growth Constrained to 3%
* Emergency and Other CBA costs may require additional amendments
($ in Millions)Subsidy Impact
FY2019 Subsidy* $1,079 3% Subsidy Growth Cap $32
FY2020 Capped Subsidy $1,111 FY2020 Cost Drivers
Inflation & Contractual Steps $28 CBA/Labor Settlements $27 Overhead & Inventory Management $23
Subtotal $78 Less 3% Subsidy Growth Cap ($32)
Management Savings Required $46 FY2020 Actions to Manage Costs Above 3% CapReduced Contracted Services ($10)Administrative Streamlining ($6)Non-Passenger Revenue ($5)Pass Products Enhancements ($2)Management Efficiencies ($24)
Subtotal ($46)FY2020 Capped Subsidy $1,111

WASHINGTON METROPOLITAN AREA TRANSIT AUTHORITY22
FY2020 Proposed Operating Budget
Legislatively Excluded Operating Subsidy Growth Above the 3% Cap is $51 million
Silver Line Phase 2 - $37 million (ramp up only)• Metro responsible for ramp up training costs
• MWAA responsible for other pre-revenue operations costs
• Revenue service begins after July 2020
Litigation Costs - $5 million Occupational Safety and Health Requirements - $4 million ADA Paratransit Cost Increase - $5 million

WASHINGTON METROPOLITAN AREA TRANSIT AUTHORITY23
FY2020 Proposed Operating Budget
Projected FY2020 Capped Subsidy and Legislative Exclusions
($ in Millions) Expense Revenue Subsidy
FY2019 Subsidy $1,877 $798 $1,079
+ 3% Growth Cap $39 $7 $32
+ Legislative Cap Excluded $51 $0 $51
FY2020 Total Subsidy with Exclusions $1,162

WASHINGTON METROPOLITAN AREA TRANSIT AUTHORITY24
New Customer Initiatives
WASHINGTON METROPOLITAN AREA TRANSIT AUTHORITY25
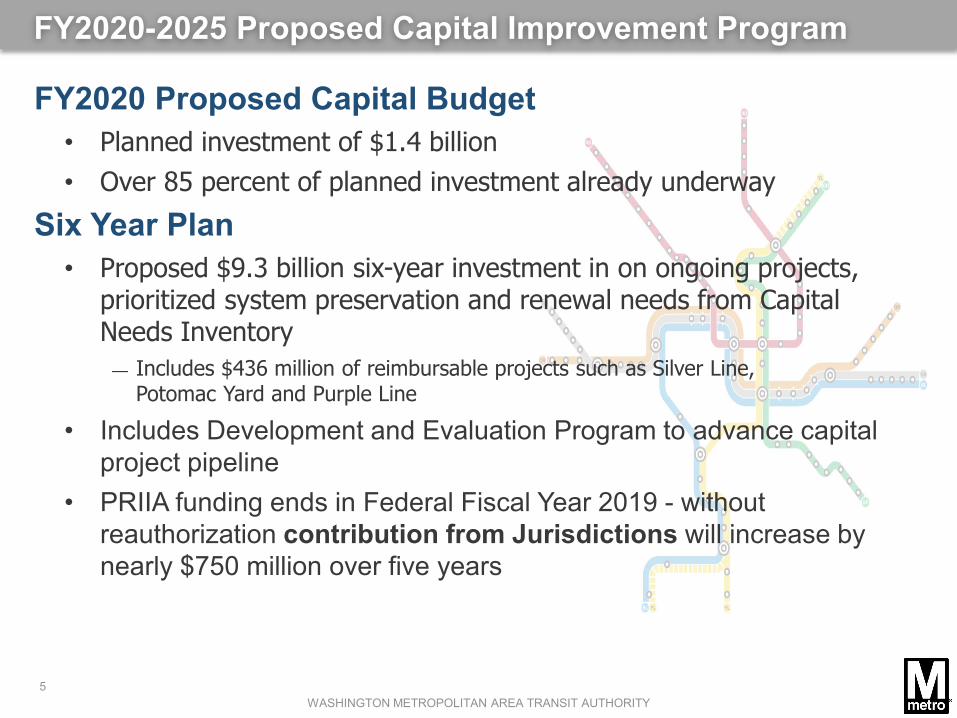
Within Cap Initiatives to Drive Ridership Growth Service and Fares No Fare Increase No Service Cut Automatic Train Operations Better Rush Hour Promise Late Night Service Partnerships
Weekend Flat Fare Pass Enhancements Reduce 7-Day Bus Pass ($17.50 to $15) Reduce 1-Day Visitor Pass Price ($14.75 to $13) Reduce 7-Day Visitor Pass Price ($38.50 to $38 on short
trip, $60 to $58 on full system pass) Add a 3-Day Weekday Pass ($28) Add unlimited bus in all Visitor and SelectPasses
FY2020 Proposed Operating Budget

WASHINGTON METROPOLITAN AREA TRANSIT AUTHORITY26
FY2020 Proposed Operating Budget
Expand Rush Hour Service Periods Extend Yellow Line Service to Greenbelt Run all Red Line Trains to Glenmont Expand All Trains to the Maximum Length of 8 Cars
New Initiatives to Drive Ridership Growth

WASHINGTON METROPOLITAN AREA TRANSIT AUTHORITY27
Expand Rush Hour Service Periods
Improve Service Frequency: Providing 8-minute service on all lines, 3-4 minute service in the core
• 9:30am to 10:00am• 7:00pm to 8:30pm
No change to fare policy
FY2020 Proposed Operating Budget
Increased HoursOperating
CostRiders
BenefittingNew
TripsNew FareRevenue
Subsidy Impact
9:30am – 10:00am $1.5m 3.7m 0.4m $0.9m $0.6m
7:00pm – 8:30pm $6.7m 8.0m 0.8m $1.9m $4.8m
Total $8.2m 11.7m 1.2m $2.8m $5.4m
WASHINGTON METROPOLITAN AREA TRANSIT AUTHORITY28
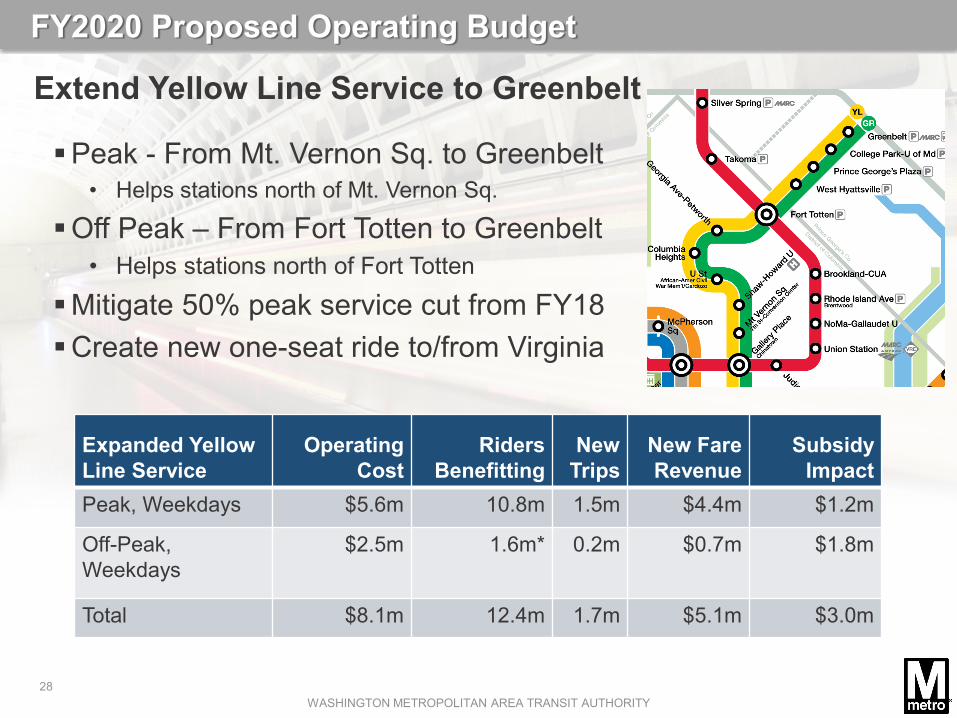
Extend Yellow Line Service to Greenbelt
Peak - From Mt. Vernon Sq. to Greenbelt• Helps stations north of Mt. Vernon Sq.
Off Peak – From Fort Totten to Greenbelt• Helps stations north of Fort Totten
Mitigate 50% peak service cut from FY18Create new one-seat ride to/from Virginia
Expanded Yellow Line Service
OperatingCost
Riders Benefitting
New Trips
New FareRevenue
Subsidy Impact
Peak, Weekdays $5.6m 10.8m 1.5m $4.4m $1.2m
Off-Peak, Weekdays
$2.5m 1.6m* 0.2m $0.7m $1.8m
Total $8.1m 12.4m 1.7m $5.1m $3.0m
FY2020 Proposed Operating Budget

WASHINGTON METROPOLITAN AREA TRANSIT AUTHORITY29
Run all Red Line Trains to Glenmont
All Red Line trains operate to Glenmont
• Stop turning Red Line trains at Silver Spring
Doubles frequency for three Red Line stations
FY2020 Proposed Operating Budget
Expanded Red Line Service
OperatingCost
Riders Benefitting
New Trips
New FareRevenue
Subsidy Impact
Peak,Weekdays
$2.0 m 2.9 m 0.3 m $1.1 m $0.9 m
Weekends $1.2 m 0.5 m 0.3 m $0.9 m $0.3 m
Total $3.2 m 3.4 m 0.6 m $2.0 m $1.2 m

WASHINGTON METROPOLITAN AREA TRANSIT AUTHORITY30
Expand All Trains to the Maximum Length of 8 CarsOperate eight-car trains on all lines
• Phased implementation over two years based on fleet and yard availability
• Yellow and Green Lines implementation complete• Red Line (July 2019), Blue Line (October 2019), and Orange and
Silver Lines (June 2020)Significantly relieve crowding, especially during peak times
Additional Eight Car Trains
OperatingCost
Riders Benefitting
New Trips
New FareRevenue
Subsidy Impact
Phased Implementation* $10.3m 1.5m 0.1m $0.2m $10.1m
FY2020 Proposed Operating Budget
*Annualized subsidy impact when fully implemented is $15 million

WASHINGTON METROPOLITAN AREA TRANSIT AUTHORITY31
FY2020 Proposed Operating Budget
Projected FY2020 Capped Subsidy, Legislative Exclusions and New Initiatives
($ in Millions) Expense Revenue SubsidyFY2019 Subsidy $1,877 $798 $1,079
+ 3% Subsidy Growth Cap $39 $7 $32
+ Legislative Excluded Subsidy $51 $0 $51 FY2020 Capped Subsidy and Legislative Exclusions $1,162
+ New Customer/Ridership Initiatives $30 $10 $20
FY2020 Total for Capped Subsidy, Exclusions & Initiatives $1,182

WASHINGTON METROPOLITAN AREA TRANSIT AUTHORITY32
Budget Risks
Federal uncertainty – PRIIA reauthorization, formula program funding, transit benefit, federal employment and contracting levels
Ridership uncertainty due to changes in trip-making and transportation market (telework, alternate modes, gas prices, etc.)
Continued paratransit cost growth Emergencies and special events
• Establish a Rainy Day Fund for emergencies starting with $20 million in FY2020 (1% of operating expenses is unfunded)
Increasing Pension and OPEB liabilities• OPEB – Contribute $12 million to the OPEB Trust Fund in
FY2020 to reduce long-term liability is unfunded
Risks to the FY2020 Proposed Operating Budget include:

WASHINGTON METROPOLITAN AREA TRANSIT AUTHORITY33
Next Steps
FY2020 Operating Budget and FY2020-2025 Capital Improvement Program include timeline include:
December 2019: Board Authorization of Public Hearing and Budget Deliberations
January – February 2019: Budget Deliberations, Public Outreach and Public Comment Period
March 2019: Board Adoption of FY2020 Budget April 2019: Submit Federal Grant Applications July 2019: FY2020 Fiscal Year Begins
WASHINGTON METROPOLITAN AREA TRANSIT AUTHORITY34
Appendix

WASHINGTON METROPOLITAN AREA TRANSIT AUTHORITY35
Appendix I - Capital Funding Sources
FY2020-2025 Capital FundingFunding Sources($ in Millions)
FY2020Budget
FY2021Plan
FY2022Plan
FY2023Plan
FY2024Plan
FY2025Plan
Total FY2020 -
FY2025FEDERAL FUNDINGFederal Formula Programs $348 $333 $333 $333 $333 $333 $2,012 Federal PRIIA $149 $149 $149 $149 $149 $149 $891 Other Federal Grants $4 $4 $4 $4 $4 $0 $19
TOTAL, Federal Grants $501 $485 $486 $485 $485 $481 $2,922 State and Local Match to Federal Formula $87 $83 $83 $83 $83 $83 $503 System Performance $174 $185 $193 $202 $210 $219 $1,183
Subtotal, Match and System Performance $261 $268 $277 $285 $293 $302 $1,686
State and Local PRIIA $149 $149 $149 $149 $149 $149 $891 Other State and Local $1 $1 $1 $1 $1 $0 $5 Dedicated Funding $500 $500 $500 $500 $500 $500 $3,000 Under/Over Debt Funded ($116) ($38) $15 $108 $165 $192 $326
Subtotal, State & Local $794 $880 $941 $1,042 $1,108 $1,143 $5,907 Reimbursable Projects $78 $130 $80 $77 $34 $19 $418 Jurisdictional Planning Projects $3 $3 $3 $3 $3 $3 $18
TOTAL, State and Local with Reimbursable $875 $1,013 $1,023 $1,122 $1,145 $1,165 $6,343
Grand Total $1,375 $1,499 $1,509 $1,606 $1,630 $1,646 $9,265 Assumes PRIIA is reauthorized.

WASHINGTON METROPOLITAN AREA TRANSIT AUTHORITY36
Appendix IIA - FY2020 Jurisdictional Capital Contributions - Traditional
($ in Millions)FY2020Budget
FY2021Plan
FY2022Plan
FY2023Plan
FY2024Plan
FY2025Plan
FY2020 -FY2025
Federal Formula Match & System Performance District of Columbia $90 $94 $97 $99 $101 $103 $585
Montgomery County $44 $45 $47 $48 $50 $52 $287 Prince George's County $44 $45 $47 $48 $49 $50 $282
Maryland Subtotal $88 $90 $93 $96 $99 $102 $569 City of Alexandria $12 $12 $13 $13 $13 $14 $77 Arlington County $22 $23 $23 $24 $25 $26 $144 City of Fairfax $1 $1 $1 $1 $1 $1 $5 Fairfax County $40 $41 $42 $44 $45 $47 $259 City of Falls Church $1 $1 $1 $1 $1 $1 $5 Loudoun County $6 $6 $7 $7 $7 $8 $42
Virginia Subtotal $82 $83 $86 $90 $93 $97 $531 Subtotal $261 $268 $277 $285 $293 $302 $1,686
State and Local PRIIA District of Columbia $50 $50 $50 $50 $50 $50 $297 State of Maryland $50 $50 $50 $50 $50 $50 $297 Commonwealth of Virginia $50 $50 $50 $50 $50 $50 $297
Subtotal $149 $149 $149 $149 $149 $149 $891 Dedicated Funding District of Columbia $179 $179 $179 $179 $179 $179 $1,071
State of Maryland $167 $167 $167 $167 $167 $167 $1,002 Commonwealth of Virginia $155 $155 $155 $155 $155 $155 $927 Under/Over Debt Funded ($116) ($38) $15 $108 $165 $192 $326
Subtotal $384 $462 $515 $608 $665 $692 $3,326 Other Virginia DRPT (CMAQ Match) $1 $1 $1 $1 $1 $0 $5
Subtotal $794 $880 $941 $1,042 $1,108 $1,143 $5,907 Reimbursable Projects District of Columbia $1 $1 $1 $1 $1 $1 $6
State of Maryland $1 $1 $1 $1 $1 $1 $6 Commonwealth of Virginia $1 $1 $1 $1 $1 $1 $6 Reimbursable Projects $78 $130 $80 $77 $34 $19 $418
Subtotal $81 $133 $83 $80 $37 $22 $436 Grand Total $875 $1,013 $1,023 $1,122 $1,145 $1,165 $6,343
Assumes PRIIA is reauthorized.

WASHINGTON METROPOLITAN AREA TRANSIT AUTHORITY37
Appendix IIB - FY2020 Jurisdictional Capital Contributions - Training
($ in Millions)FY2020Budget
FY2021Plan
FY2022Plan
FY2023Plan
FY2024Plan
FY2025Plan
FY2020 -FY2025
Federal Formula Match & System Performance District of Columbia $93 $94 $97 $99 $101 $103 $585
Montgomery County $46 $45 $47 $48 $50 $52 $287 Prince George's County $45 $45 $47 $48 $49 $50 $282
Maryland Subtotal $91 $90 $93 $96 $99 $102 $569 City of Alexandria $12 $12 $13 $13 $13 $14 $77 Arlington County $23 $23 $23 $24 $25 $26 $144 City of Fairfax $1 $1 $1 $1 $1 $1 $5 Fairfax County $39 $41 $42 $44 $45 $47 $259 City of Falls Church $1 $1 $1 $1 $1 $1 $5 Loudoun County $0 $6 $7 $7 $7 $8 $42
Virginia Subtotal $76 $83 $86 $90 $93 $97 $531 Subtotal $261 $268 $277 $285 $293 $302 $1,686
State and Local PRIIA District of Columbia $50 $50 $50 $50 $50 $50 $297 State of Maryland $50 $50 $50 $50 $50 $50 $297 Commonwealth of Virginia $50 $50 $50 $50 $50 $50 $297
Subtotal $149 $149 $149 $149 $149 $149 $891 Dedicated Funding District of Columbia $179 $179 $179 $179 $179 $179 $1,071
State of Maryland $167 $167 $167 $167 $167 $167 $1,002 Commonwealth of Virginia $155 $155 $155 $155 $155 $155 $927 Under/Over Debt Funded ($116) ($38) $15 $108 $165 $192 $326
Subtotal $384 $462 $515 $608 $665 $692 $3,326 Other Virginia DRPT (CMAQ Match) $1 $1 $1 $1 $1 $0 $5
Subtotal $794 $880 $941 $1,042 $1,108 $1,143 $5,907 Reimbursable Projects District of Columbia $1 $1 $1 $1 $1 $1 $6
State of Maryland $1 $1 $1 $1 $1 $1 $6 Commonwealth of Virginia $1 $1 $1 $1 $1 $1 $6 Reimbursable Projects $78 $130 $80 $77 $34 $19 $418
Subtotal $81 $133 $83 $80 $37 $22 $436 Grand Total $875 $1,013 $1,023 $1,122 $1,145 $1,165 $6,343
Assumes PRIIA is reauthorized.

WASHINGTON METROPOLITAN AREA TRANSIT AUTHORITY38
Appendix IIC - FY2020 Jurisdictional Capital Contributions - No Bus
($ in Millions)FY2020Budget
FY2021Plan
FY2022Plan
FY2023Plan
FY2024Plan
FY2025Plan
FY2020 -FY2025
Federal Formula Match & System Performance District of Columbia $91 $95 $97 $99 $101 $104 $586
Montgomery County $44 $45 $47 $49 $50 $52 $288 Prince George's County $44 $46 $47 $48 $49 $50 $283
Maryland Subtotal $88 $91 $94 $96 $99 $102 $571 City of Alexandria $12 $12 $13 $13 $14 $14 $78 Arlington County $22 $23 $23 $24 $25 $26 $144 City of Fairfax $1 $1 $1 $1 $1 $1 $5 Fairfax County $40 $41 $42 $44 $45 $47 $260 City of Falls Church $1 $1 $1 $1 $1 $1 $5 Loudoun County $6 $6 $6 $6 $7 $7 $38
Virginia Subtotal $82 $83 $86 $90 $93 $96 $529 Subtotal $261 $268 $277 $285 $293 $302 $1,686
State and Local PRIIA District of Columbia $50 $50 $50 $50 $50 $50 $297 State of Maryland $50 $50 $50 $50 $50 $50 $297 Commonwealth of Virginia $50 $50 $50 $50 $50 $50 $297
Subtotal $149 $149 $149 $149 $149 $149 $891 Dedicated Funding District of Columbia $179 $179 $179 $179 $179 $179 $1,071
State of Maryland $167 $167 $167 $167 $167 $167 $1,002 Commonwealth of Virginia $155 $155 $155 $155 $155 $155 $927 Under/Over Debt Funded ($116) ($38) $15 $108 $165 $192 $326
Subtotal $384 $462 $515 $608 $665 $692 $3,326 Other Virginia DRPT (CMAQ Match) $1 $1 $1 $1 $1 $0 $5
Subtotal $794 $880 $941 $1,042 $1,108 $1,143 $5,907 Reimbursable Projects District of Columbia $1 $1 $1 $1 $1 $1 $6
State of Maryland $1 $1 $1 $1 $1 $1 $6 Commonwealth of Virginia $1 $1 $1 $1 $1 $1 $6 Reimbursable Projects $78 $130 $80 $77 $34 $19 $418
Subtotal $81 $133 $83 $80 $37 $22 $436 Grand Total $875 $1,013 $1,023 $1,122 $1,145 $1,165 $6,343
Assumes PRIIA is reauthorized.

WASHINGTON METROPOLITAN AREA TRANSIT AUTHORITY39
Appendix IIIA - FY2020 Jurisdictional Operating Contributions - Traditional
($ in Millions)FY2019
BaseFY2020 Capped
% Growth
FY2020 Legislative Exclusions
% Growth
FY2020 New
Initiatives%
GrowthFY2020
Total TotalDistrict of Columbia $392 $396 1.2% $16 4.2% $7 1.7% $419 7.0%
Montgomery County $182 $183 0.6% $9 4.9% $4 1.9% $195 7.5%
Prince George's County $231 $233 0.7% $9 4.0% $3 1.4% $245 6.0%
Maryland Subtotal $413 $416 0.7% $18 4.4% $7 1.6% $441 6.7%
City of Alexandria $45 $45 1.3% $2 4.8% $1 2.1% $48 8.2%Arlington County $75 $76 1.2% $4 5.6% $2 2.5% $82 9.3%City of Fairfax $3 $3 0.0% $0 5.9% $0 2.4% $3 8.3%Fairfax County $149 $154 3.3% $8 5.3% $3 2.2% $165 10.7%City of Falls Church $3 $3 2.3% $0 4.2% $0 1.7% $3 8.3%Loudoun County $0 $18 100.0% $1 100.0% $1 100.0% $20 100.0%Virginia Subtotal $275 $299 9.0% $16 5.8% $7 2.5% $322 17.2%
Total Contribution $1,079 $1,111 3.0% $51 4.7% $20 1.9% $1,182 9.5%

WASHINGTON METROPOLITAN AREA TRANSIT AUTHORITY40
Appendix IIIB - FY2020 Jurisdictional Operating Contributions - Training
($ in Millions)FY2019
BaseFY2020 Capped % Growth
FY2020 Legislative Exclusions
SL2 allocated to
FFX & LC%
Growth
FY2020 New
Initiatives%
GrowthTotal
FY2020Total
District of Columbia $392 $403 3.0% $2 $0 0.6% $5 1.3% $411 4.9%
Montgomery County $182 $187 3.0% $4 $0 2.3% $5 2.7% $197 8.1%
Prince George's County $231 $237 2.3% $4 $0 1.6% $3 1.3% $244 5.2%
Maryland Subtotal $413 $424 2.7% $8 $0 1.9% $9 2.2% $441 6.7%
City of Alexandria $45 $46 3.3% $0 $0 0.9% $1 2.2% $48 6.5%
Arlington County $75 $78 3.7% $0 $0 0.4% $1 1.3% $79 5.4%
City of Fairfax $3 $3 2.9% $0 $0 3.0% $0 4.6% $3 10.6%
Fairfax County $149 $154 3.2% $3 $18 14.0% $4 2.7% $179 19.9%
City of Falls Church $3 $3 3.9% $0 $0 1.4% $0 0.0% $3 5.3%
Loudoun County $0 $0 0.0% $0 $18 0.0% $0 0.0% $18 100.0%
Virginia Subtotal $275 $284 3.4% $3 $37 14.6% $6 2.2% $330 20.1%
Total Contribution $1,079 $1,111 3.0% $14 $37 4.7% $20 1.9% $1,182 9.5%

WASHINGTON METROPOLITAN AREA TRANSIT AUTHORITY41
Appendix IIIC - FY2020 Jurisdictional Operating Contributions - No Bus
($ in Millions)FY2019
BaseFY2020 Capped
% Growth
FY2020 Legislative Exclusions
% Growth
FY2020 New
Initiatives%
GrowthFY2020
Total TotalDistrict of Columbia $392 $397 1.5% $16 4.2% $7 1.7% $420 7.3%
Montgomery County $182 $184 1.3% $9 4.9% $4 1.9% $197 8.1%Prince George's County $231 $234 1.1% $9 4.0% $3 1.4% $246 6.5%
Maryland Subtotal $413 $418 1.2% $18 4.4% $7 1.6% $443 7.2%
City of Alexandria $45 $46 1.8% $2 4.8% $1 2.1% $49 8.7%Arlington County $75 $77 1.7% $4 5.6% $2 2.5% $83 9.8%City of Fairfax $3 $3 1.2% $0 5.9% $0 2.4% $3 9.5%Fairfax County $149 $155 4.2% $8 5.3% $3 2.2% $166 11.6%City of Falls Church $3 $3 2.9% $0 4.2% $0 1.7% $3 8.9%Loudoun County $0 $13 100.0% $1 100.0% $1 100.0% $15 100.0%Virginia Subtotal $275 $296 7.7% $16 5.8% $7 2.5% $318 15.9%
Total Contribution $1,079 $1,111 3.0% $51 4.7% $20 1.9% $1,182 9.5%