Embed Size (px)
Citation preview
research papers
Acta Cryst. (2008). D64, 287–301 doi:10.1107/S0907444907067613 287
Acta Crystallographica Section D
BiologicalCrystallography
ISSN 0907-4449
Glycerol concentrations required for the successfulvitrification of cocktail conditions in ahigh-throughput crystallization screen
Robin Kempkes,a Elizabeth
Stofko,b Kam Lamc and
Edward H. Snella,d*
aHauptman–Woodward Medical Research
Institute, 700 Ellicott Street, Buffalo, NY 14203,
USA, bCase Western Reserve University,
Cleveland, Ohio 44106, USA, cWashington and
Jefferson College, 60 South Lincoln Street,
Washington, PA 15301, USA, and dDepartment
of Structural Biology, SUNY Buffalo,
700 Ellicott Street, Buffalo, NY 14203, USA
Correspondence e-mail: [email protected]
# 2008 International Union of Crystallography
Printed in Singapore – all rights reserved
The Hauptman–Woodward Medical Research Institute runs a
high-throughput crystallization screening service in which
macromolecules are screened against 1536 potential crystal-
lization cocktails. Typically, multiple crystallization leads are
identified. With a limited amount of sample, the question
becomes ‘How many leads can be optimized and which leads
are most likely to produce X-ray diffraction data?’. In order to
prioritize the hits for optimization, the amount of glycerol
required to successfully cryocool each cocktail has been
determined for the cocktails used in the high-throughput
screen. Those hit conditions that require the minimum amount
of cryoprotectant for successful vitrification will be closer in
chemical make-up to the mother liquor. Hence, if the physical
properties of the crystals are similar, one could logically
prioritize leads that are more likely to produce diffraction
based upon the chemical similarity of the native to the cryo-
preserved mother liquor.
Received 14 November 2007
Accepted 18 December 2007
1. Introduction
High-throughput crystallization is a highly automated process;
hundreds of experiments can be conducted with a few milli-
grams of the macromolecule of interest. A high-throughput
screening service is currently offered at the Hauptman–
Woodward Medical Research Institute (HWI). Samples
solicited from the biological community are screened against
1536 different biochemical cocktails (Luft et al., 2003) using
the microbatch-under-oil crystallization method (Chayen et
al., 1992). Individual experiments are composed of 200 nl
macromolecule solution (�10 mg ml�1) and 200 nl of a crys-
tallization cocktail. Experiments are incubated at 296 K and
the outcomes are imaged for four weeks. The images are
archived and are immediately available to the investigator
providing the sample. The cocktails used are broken down into
three different groups: highly soluble salts, different mole-
cular-weight PEG combinations and commercially available
screens that complement the previous groups. Currently, the
success rate is�50%, i.e. half of the screened samples result in
a lead: a likely crystallization condition that can be optimized.
Frequently, leads are observed from several chemically
distinct cocktails. With a limited supply of macromolecule
available for crystallization, can we devise a strategy to
rationally prioritize these leads for optimization?
For X-ray structural data collection, the majority of samples
are cryocooled in order to reduce radiation damage (Garman
& Owen, 2006). Cryoprotective agents (cryoprotectants) are
typically required to eliminate crystalline ice formation. One
of these cryoprotectants is glycerol. The amounts of glycerol
needed to successfully vitrify the Hampton Research Crystal
Screen (50 different biochemical cocktails) were determined
by Garman & Mitchell (1996). A similar study expanded these
data with the addition of 48 cocktails (adding Hampton
Research Crystal Screen II) using glycerol and also PEG 400,
ethylene glycol and 1,2-propanediol as cryoprotectants for all
98 (50 + 48) cocktails (McFerrin & Snell, 2002). In both
studies, solutions were tested for successful vitrification using
X-ray diffraction. McFerrin and Snell noted that 73% of the
glycerol concentrations required to produce a visually clear
solution were successfully vitrified as determined by X-ray
diffraction. The remaining solutions required a 5% increase
(the minimum glycerol concentration step used) to be
successfully vitrified. Simple visual observation provided a
good guide to the initial cryoprotectant condition within the
sampling constraints.
We have expanded on previous studies and visually deter-
mined the concentrations of glycerol required to vitrify the
first two groups of cocktails used in the HWI high-throughput
screening laboratory. The introduction of any non-native
component into a crystal, e.g. a cryoprotective agent, has the
potential to cause damage (Mitchell & Garman, 1994). By
determining the minimum concentration of glycerol required
for successful vitrification of a lead condition, we can use this
information as one of the criteria to prioritize the leads that
are subsequently optimized, i.e. those where minimal addi-
tional of cryoprotection would be needed for data collection.
2. Experimental
The 1536-condition HWI crystallization screen can be divided
into three groups. Groups 1 and 2 were constructed using an
incomplete factorial design (Audic et al., 1997) and are
buffered with 100 mM concentrations of CAPS (pH 10.0),
TAPS (pH 9.0), Tris (pH 8.0), HEPES (pH 7.5), MOPS (pH
7.0), MES (pH 6.0), sodium acetate (pH 5.0) and sodium
citrate (pH 4.0). Group 1 cocktails are highly soluble salts (262
cocktails). They include 36 different salts (11 cations and 14
anions) at �30, 60 and 90% saturation, buffered as described.
Group 2, PEG/salt (722 cocktails), includes five different
molecular-weight PEGs (20, 8, 4, 1 kDa and 400 Da),
combined with 35 salts at 100 mM concentration and buffered
as described. Group 3 are the commercial screens (552 cock-
tails). This group is comprised of Hampton Research Natrix,
Quick, PEG/Ion, PEG Grid, Ammonium Sulfate Grid,
Sodium Chloride Grid, Crystal Screen HT, Index and SaltRx
screens. For historical reasons, the first 22 cocktails from
Hampton Research Crystal Screen Cryo are distributed within
groups 1 and 2. These and other occurrences of Hampton
Research cryocondition cocktails serve as a control during the
experimental process. The first two groups were studied by the
addition of 2.5%(w/v) increments of glycerol concentration to
identify cryoprotectant conditions. For the third group,
glycerol concentrations for Crystal Screen HT have been
described elsewhere (McFerrin & Snell, 2002). Grid Screen
Ammonium Sulfate and Grid Screen PEG/LiCl were used to
investigate the fine sampling of chemical space, comple-
menting the incomplete factorial sampling of the first two
groups. The remainder were studied in somewhat less detail.
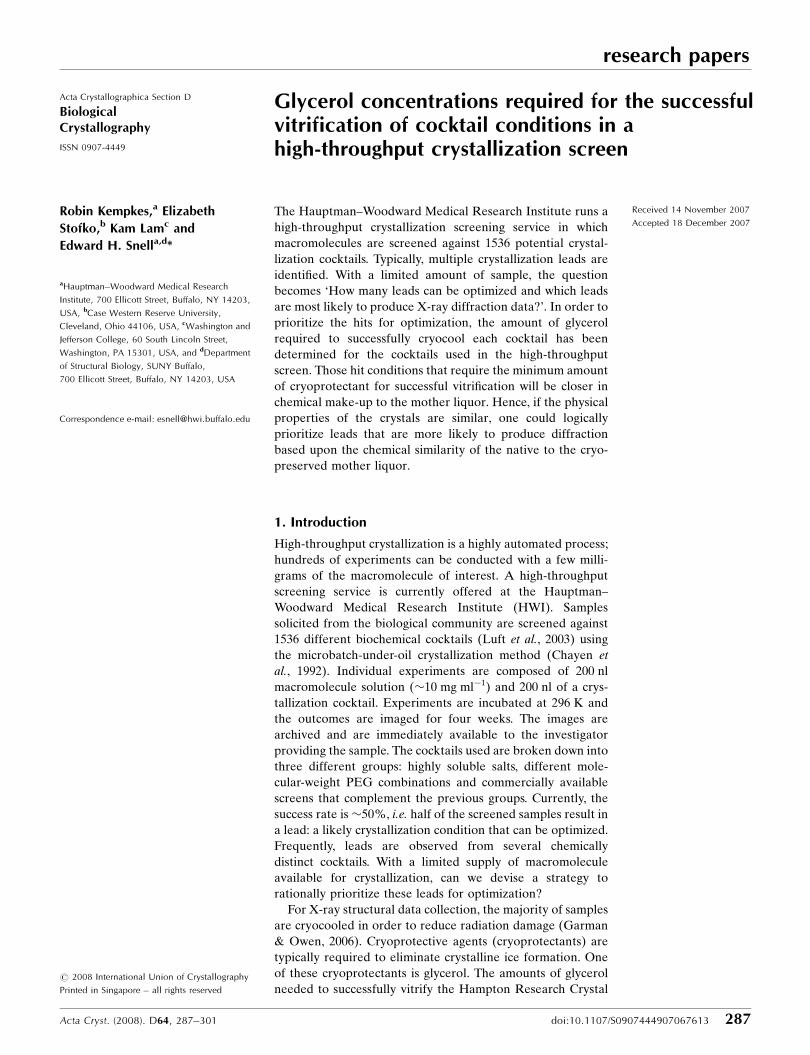
The instrumentation used consists of an offline goniometer
system with an Oxford 700 cryostream positioned to cool the
sample from directly above (Fig. 1a). Each sample was imaged
with a Navitar zoom lens coupled to a Pixelink color firewire-
linked CCD camera. Each component
could be precisely translated. A Fibre-
Lite metal halide machine-vision illu-
minator was used to illuminate the
sample from the front. To bias the
experiment towards the worst case,
large 0.7–1.0 mm Hampton Research
cryoloops mounted on magnetic heads
were used to hold the solutions.
Multiple loops were used, all of a similar
measured size. They were washed and
dried between each experiment.
In the high-throughput crystallization
screening laboratory, the crystallization
cocktail is mixed in a 1:1 ratio with the
macromolecule in buffer. For the vitri-
fication studies described here, all the
cocktails were studied at full strength
and then diluted in a 1:1 ratio with
double-distilled water (ddH2O). At full
strength, the data provide an indication
of the initial cryoprotectant properties
of the cocktail. As solutes lower the
vapor pressure of a solvent and
decrease the freezing point, the data
from the 1:1 dilution with ddH2O
research papers
288 Kempkes et al. � Vitrification of crystallization screen conditions Acta Cryst. (2008). D64, 287–301
Figure 1(a) Photograph of the experimental setup showing the video microscope lens, the fiber-opticilluminator, cryostream and goniometer mount. The instrument focused on the sample to the right-hand side is a thermal imaging camera used for other studies (Snell et al., 2002). Examples of (b) asuccessful vitrification and (c) a poor flash-cooling result are also shown.
(having no solutes) represent a worst-case scenario. A total of
10 ml solution was pipetted onto a glass microscope slide and
the loop was used to pick up solution and place it on the
goniometer with the gas stream blocked. Once on the gonio-
meter, the gas stream was swiftly unblocked to cool the
cryoloop and the solution it contained. Magnified images of
the loops were examined to determine whether the solution
had vitrified successfully (Fig. 1b) or whether crystalline ice
was present (Fig. 1c).
The first experiment, with the cocktail at full strength,
identified conditions that already had cryoprotectant proper-
ties and the second with 50% ddH2O was used as the starting
point to study the glycerol concentrations needed for vitrifi-
cation. If the 50% cocktail solution did not show successful
vitrification, further investigation of the cocktail took place.
Glycerol solutions containing 60, 55, 50, 45, 40, 35, 30, 25, 20,
15, 10 and 5%(v/v) glycerol were prepared by volumetric
dilution with ddH2O. The glycerol solution was warmed in a
water bath to reduce its viscosity and increase pipetting
accuracy. For the first 984 cocktails, each solution was pipetted
in equal volumes onto a glass microscope slide, aspirating and
dispensing the mixed drop several times. The effective
percentage of cryoprotectant was therefore from 30% to 0%
glycerol in 2.5%(v/v) steps. Starting from the highest
concentration of cryoprotectant, each solution was loaded in a
loop and cooled and then imaged until evidence of crystalline
ice was seen. The cryoprotectant concentration that remained
clear was then recorded. The initial 984 cocktails (excluding
the 22 Crystal Screen Cryo cocktails) provide an incomplete
factorial sampling of crystallization space.
A similar procedure was followed for the Hampton
Research Grid Screen Ammonium Sulfate and Grid Screen
PEG/LiCl cocktails. Sample volume can be an important
factor in cryoprotectant concentration and successful vitrifi-
cation (Chinte et al., 2005). Therefore, a single cocktail that
required a larger than average amount of cryoprotectant was
selected from the high-salt cocktails group (1.14 M ammonium
sulfate pH 6) and from each of five different molecular-weight
PEGs in the PEG group (lithium chloride pH 10, calcium
acetate pH 6.0, ammonium sulfate pH 7.5, potassium phos-
phate pH 7.0 and ammonium phosphate dibasic pH 4.0 all at
0.1 M concentration for PEGs 20, 8, 4, 1 kDa and 400 Da,
respectively). The experimental procedure was repeated in
5% steps (rather than the previous 2.5% steps) with these
cocktails, using a succession of smaller loops ranging from 1.0
to 0.05 mm across. Each loop was independently measured
using a light microscope to confirm its size.
The remaining cocktails were studied with 1:1 dilutions of
the cocktails with 20, 10 and 5%(v/v) glycerol solutions. These
cocktails (and the Ammonium Sulfate and PEG/LiCl Grid
Screens) are used as reference points with the HWI crystal-
lization screen in order to understand the behavior of the
macromolecules over fine-sampled chemical shifts, to pinpoint
the best category of potential crystallization chemicals and as
a means to sample outliers in chemical space not covered by
the 962-cocktail incomplete factorial sampled cocktails. Note
that the Crystal Screen HT has been studied in detail
elsewhere (Garman & Mitchell, 1996; McFerrin & Snell,
2002).
3. Results
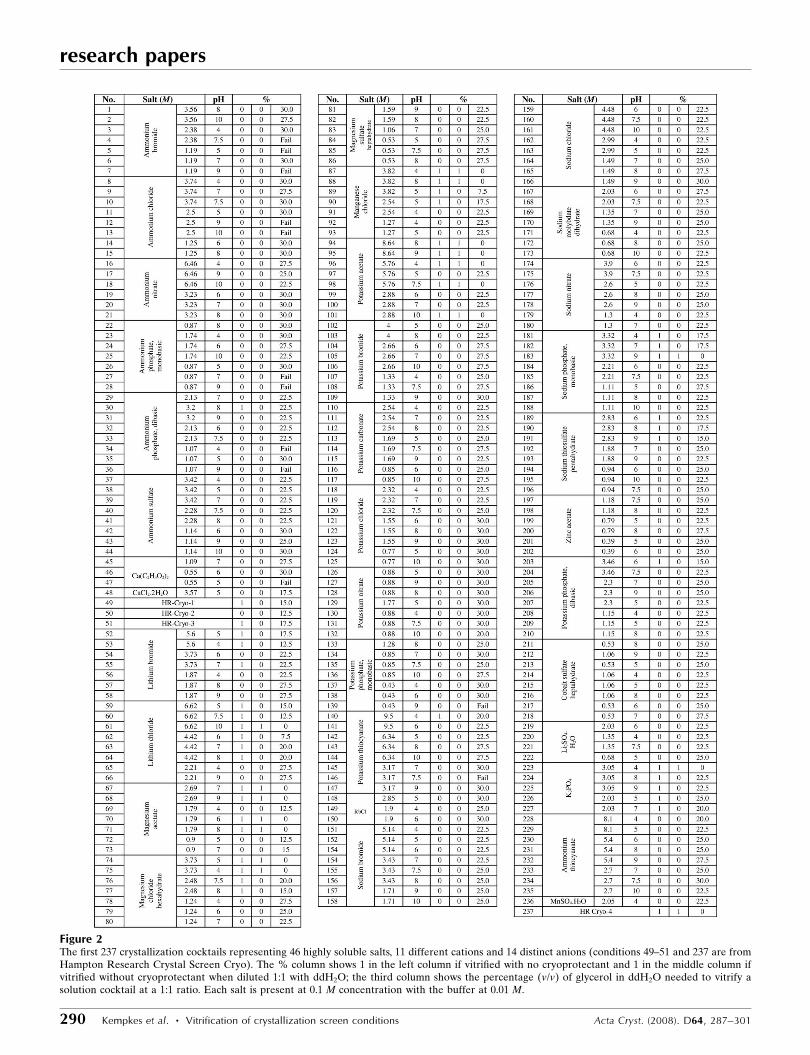
Figs. 2–7 list the cocktails and the concentrations of glycerol
required to successfully vitrify the solution. The percentage
column is divided into three sections, with the first identifying
whether or not the cocktail was successfully vitrified at 100%
concentration (without added cryoprotectant), the second if it
was successful at 50%(v/v) concentration and the third the
percentage of glycerol needed needed to vitrify a solution
containing a 1:1 dilution of the cocktail with ddH2O. In Figs. 8
and 9 the Hampton Research Grid Screen Ammonium Sulfate
and Grid Screen PEG/LiCl results are displayed in a similar
manner. Figs. 10–15 show the effect of loop size on the amount
of cryoprotectant needed for successful vitrification. Fig. 16
provides a listing of the remaining screens. For brevity, only
those conditions that displayed natural cryoprotectant quali-
ties or that were cryoprotected with 20%(v/v) glycerol or less
are displayed. Finally, Tables 1 and 2 summarize the results.
The highly soluble salts (223 cocktails; Fig. 2) required on
average the highest concentrations of cryoprotectant
[22.5%(v/v)], with the exceptions of lithium chloride, magne-
sium acetate and magnesium chloride hexahydrate at high
concentration and pH. This was also observed in the data for
100% concentration cocktail conditions, i.e. no glycerol. In
general, a higher initial salt concentration required a lower
cryoprotectant concentration, as observed by Garman (1999).
High salt concentrations as cryoprotectant agents have been
observed elsewhere (Holyoak et al., 2003; Rubinson et al.,
2000).
The PEG 20K results are shown in Fig. 3; for all the PEGs
the salt concentration was 0.1 M. For 81 cocktails containing
20.0%(v/v) PEG 20K there was little variation in the required
cryoprotectant concentration; that for glycerol averaged
23.9%. At 40%(v/v) PEG 20K (61 cocktails) the average
cryoprotectant concentration was 16.0%(v/v). Two conditions
required no cryoprotectant: ammonium bromide pH 7 and
magnesium acetate pH 9. In the case of magnesium acetate, as
the pH decreased the required concentration of cryoprotec-
tant increased [0%(v/v) at pH 9, 10%(v/v) at pH 6 and
15%(v/v) at pH 5]. Ammonium bromide was only sampled
once at 40%(v/v) PEG, so the extent of any pH trends are
unknown. For PEG 8K (Fig. 4) at 20%(v/v) concentration
(83 conditions), the average required cryoprotectant was
24.1%(v/v), similar to that for PEG 20K. PEG 8K at 40%(v/v)
(70 conditions) reduced the average cryoprotectant to 16.2%.
Again, there were a number of samples that needed no
cryoprotectant. These were ammonium chloride pH 4,
ammonium nitrate pH 7, magnesium acetate pH 7, sodium
nitrate pH 4, lithium sulfate monohydrate pH 5 and manga-
nese sulfate monohydrate pH 6. These cocktails included only
single occurrences of magnesium, sodium and manganese salts
and so no pH trends could be observed. PEG 4K (Fig. 5) at
20%(v/v) (75 conditions) required an average of 24.7%
cryoprotectant and for 40%(v/v) (73 conditions) a concen-
research papers
Acta Cryst. (2008). D64, 287–301 Kempkes et al. � Vitrification of crystallization screen conditions 289
research papers
290 Kempkes et al. � Vitrification of crystallization screen conditions Acta Cryst. (2008). D64, 287–301
Figure 2The first 237 crystallization cocktails representing 46 highly soluble salts, 11 different cations and 14 distinct anions (conditions 49–51 and 237 are fromHampton Research Crystal Screen Cryo). The % column shows 1 in the left column if vitrified with no cryoprotectant and 1 in the middle column ifvitrified without cryoprotectant when diluted 1:1 with ddH2O; the third column shows the percentage (v/v) of glycerol in ddH2O needed to vitrify asolution cocktail at a 1:1 ratio. Each salt is present at 0.1 M concentration with the buffer at 0.01 M.
research papers
Acta Cryst. (2008). D64, 287–301 Kempkes et al. � Vitrification of crystallization screen conditions 291
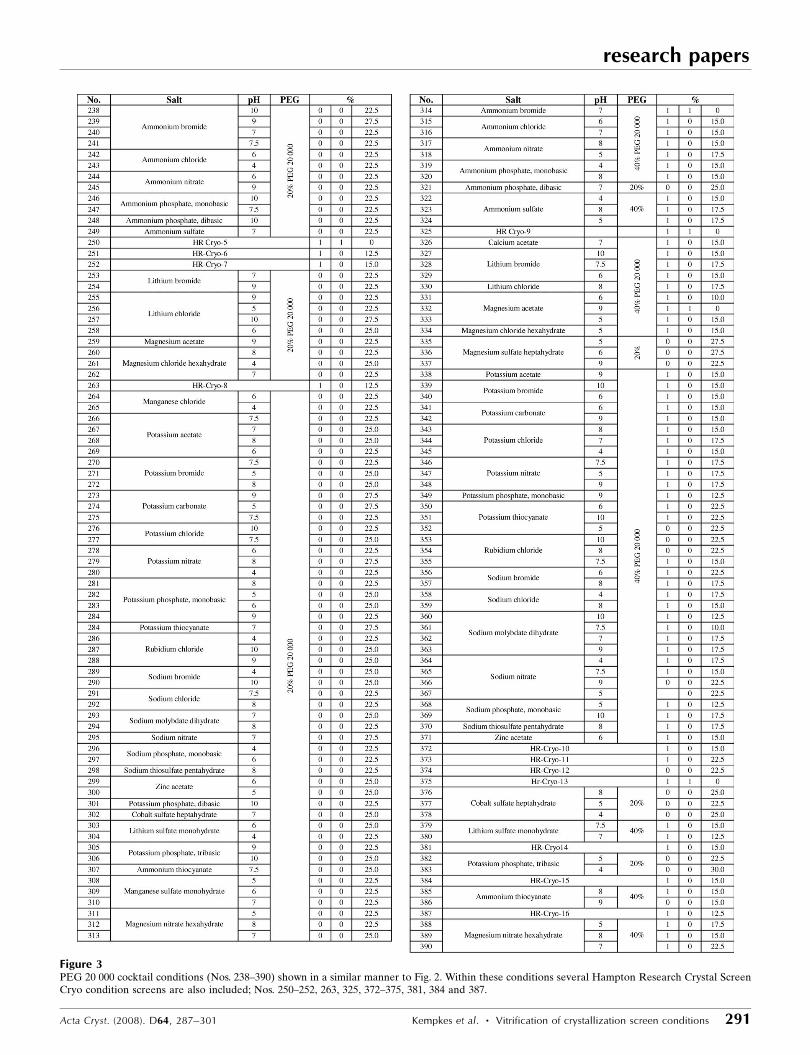
Figure 3PEG 20 000 cocktail conditions (Nos. 238–390) shown in a similar manner to Fig. 2. Within these conditions several Hampton Research Crystal ScreenCryo condition screens are also included; Nos. 250–252, 263, 325, 372–375, 381, 384 and 387.
research papers
292 Kempkes et al. � Vitrification of crystallization screen conditions Acta Cryst. (2008). D64, 287–301
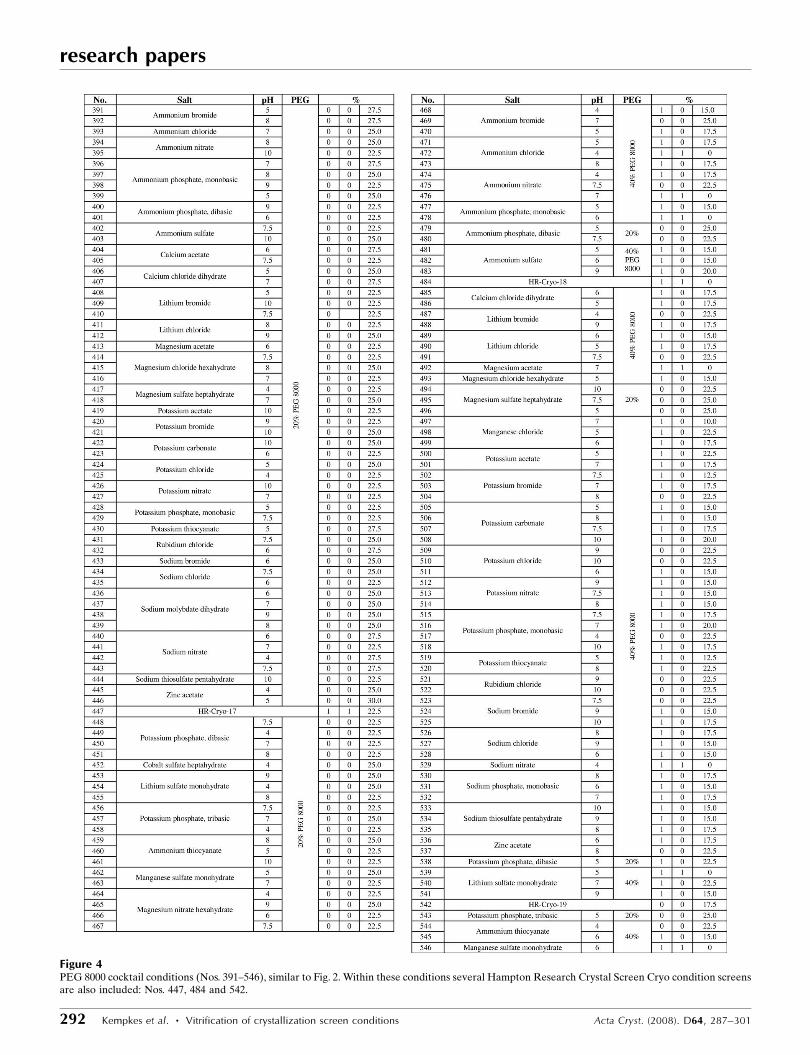
Figure 4PEG 8000 cocktail conditions (Nos. 391–546), similar to Fig. 2. Within these conditions several Hampton Research Crystal Screen Cryo condition screensare also included: Nos. 447, 484 and 542.
research papers
Acta Cryst. (2008). D64, 287–301 Kempkes et al. � Vitrification of crystallization screen conditions 293
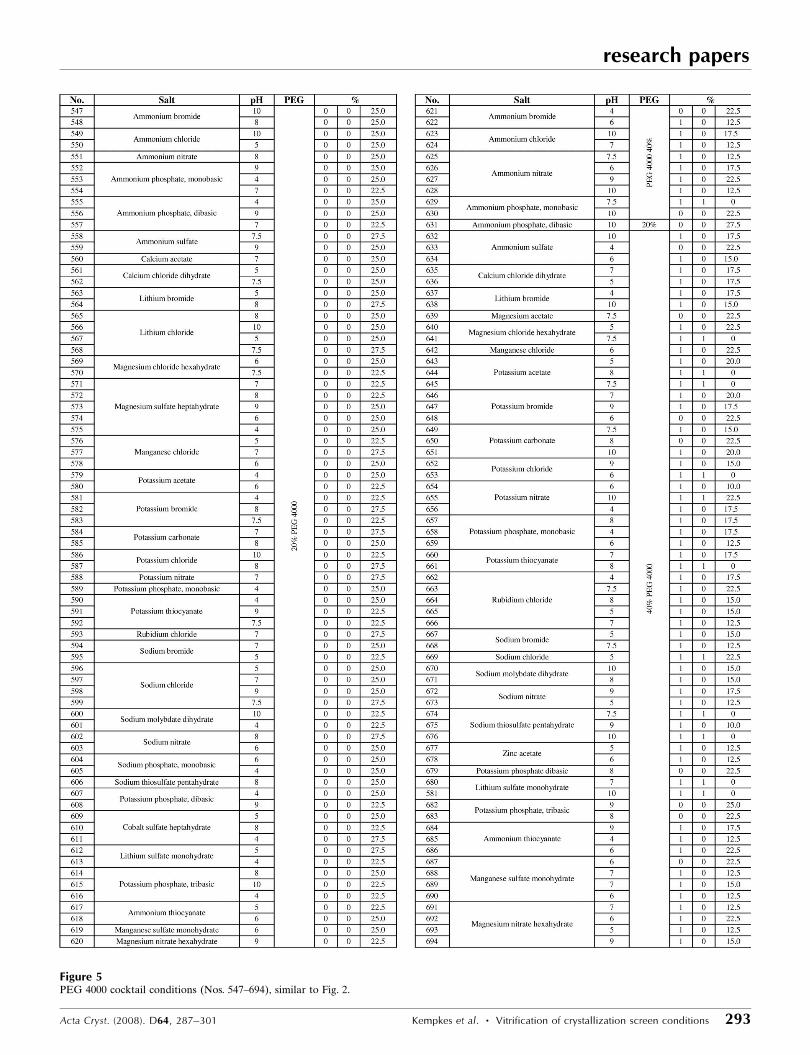
Figure 5PEG 4000 cocktail conditions (Nos. 547–694), similar to Fig. 2.
research papers
294 Kempkes et al. � Vitrification of crystallization screen conditions Acta Cryst. (2008). D64, 287–301
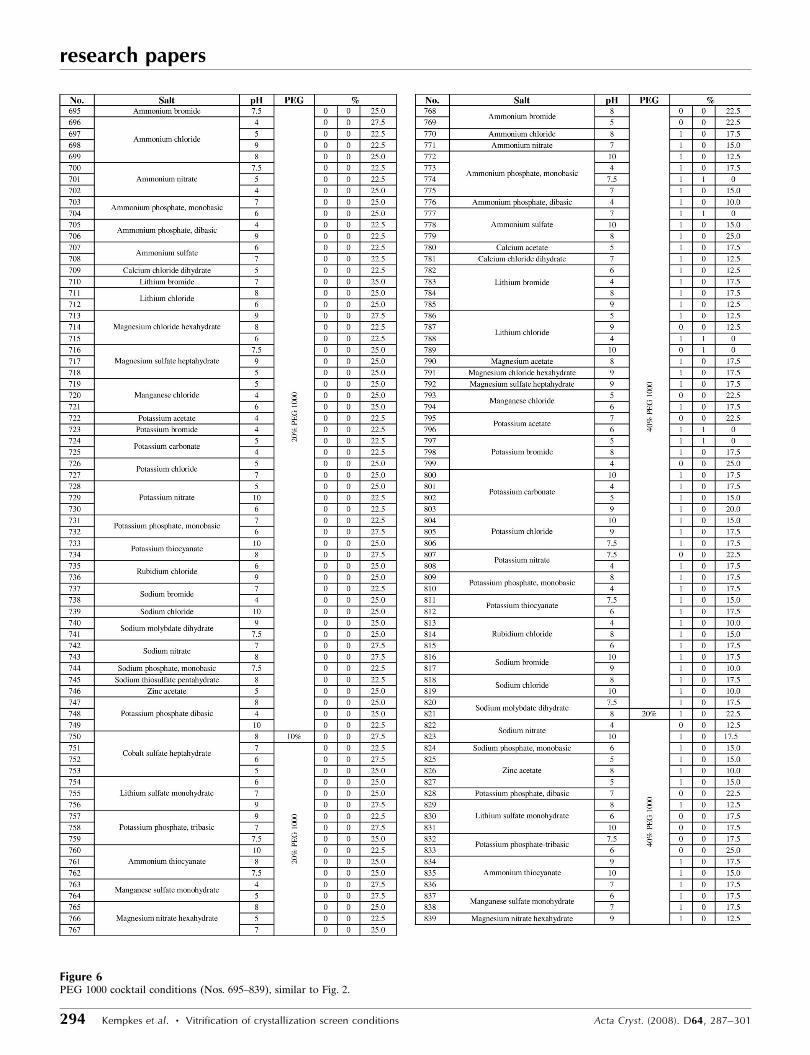
Figure 6PEG 1000 cocktail conditions (Nos. 695–839), similar to Fig. 2.
research papers
Acta Cryst. (2008). D64, 287–301 Kempkes et al. � Vitrification of crystallization screen conditions 295
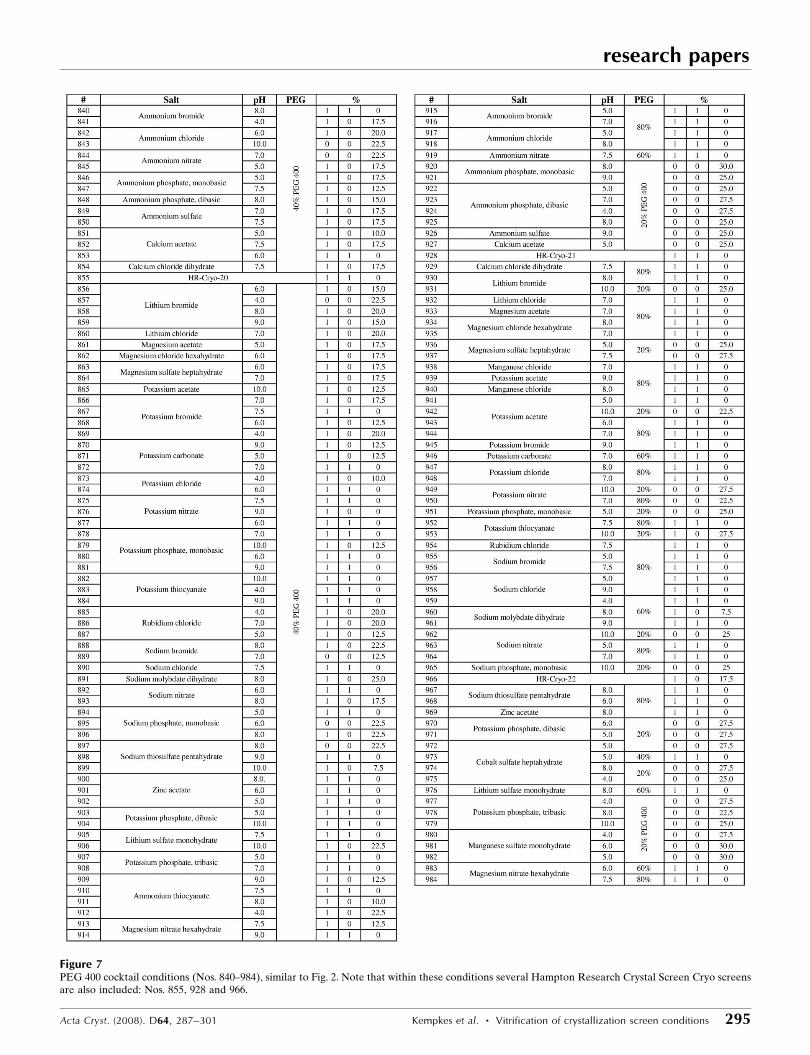
Figure 7PEG 400 cocktail conditions (Nos. 840–984), similar to Fig. 2. Note that within these conditions several Hampton Research Crystal Screen Cryo screensare also included: Nos. 855, 928 and 966.
tration of 14.9% was required. PEG 1K (Fig. 6) was similar; at
20%(v/v) PEG (72 conditions) the average cryoprotectant
concentration was 24.5% and for 40%(v/v) PEG (72 condi-
tions) it was 15.3%. The reduction in cryoprotectant concen-
tration required for vitrification of 20% and 40% PEG for the
20K, 8K, 4K and 1K PEGs were similar.
The PEG 400 group (Fig. 7) was more complex in compo-
sition and sampled 20% (28 conditions), 40% (75 conditions),
60% (seven conditions) and 80%(v/v) (32 conditions) PEG
400 with glycerol. The concentrations of glycerol required
averaged 26.3, 10.43, 1.1 and 0%(v/v), respectively. Unfortu-
nately, comparison with the other PEGs in the screen is
difficult as PEG 400 is sampled at a larger number of
concentrations but at a reduced number of chemical condi-
tions. We can say that the 20% PEG 400 conditions required
cryoprotectant concentrations comparable to similar condi-
tions in the other PEG screens. It is also noticeable that at
40% PEG 400 the concentration of cryoprotectant required is
significantly less than that of the higher molecular-weight
PEGs.
In the case of the Ammonium Sulfate Grid Screen (Fig. 8)
there was a small decrease in the cryoprotectant required with
an increasing concentration of ammonium sulfate and no
apparent pH effect. Similarly, as shown in Fig. 9, as the PEG
6000 concentration increased there is a slight decrease in the
cryoprotectant needed. The most dramatic effect arises from
research papers
296 Kempkes et al. � Vitrification of crystallization screen conditions Acta Cryst. (2008). D64, 287–301
Table 1Summary of the cryoprotection needed for the different components of the first two groups of the HWI crystallization cocktails as described in Figs. 1–7.
The data are tabulated excluding results from the Crystal Screen Cryo cocktails distributed through the first 984 cocktails. The cryoprotectant concentrations arefinal concentrations (v/v).
Cocktail and ddH2O Cocktail solution with 1:1 cryoprotectant
No. of cocktails 0% 50% 30% 25% 20% 15% 10% 5%
Salts (1–237) All 233 16.9% 5.5% 94.0% 75.5% 16.3% 10.7% 7.7% 6.9%PEG 20K (238–390) All 141 35.3% 1.3% 100% 92.9% 36.2% 24.8% 2.8% 1.4%
20% 81 0% 0% 100% 87.7% 0% 0% 0% 0%40% 60 93.3% 3.3% 100% 100% 85.0% 58.3% 6.7% 3.3%
PEG 8K (391–546) All 153 37.9% 4.6% 100% 92.8% 34.6% 19.6% 5.2% 4.6%20% 83 1.2% 0% 100% 86.7% 0% 0% 0% 0%40% 70 81.4% 10.0% 100% 100% 74.3% 42.9% 11.4% 10.0%
PEG 4K (547–694) All 148 42.6% 6.8% 100% 90.5% 37.2% 25.7% 8.1% 6.8%20% 75 0% 0% 100% 82.4% 0% 0% 0% 0%40% 73 86.3% 13.7% 100% 100% 75.3% 52.1% 16.4% 13.7%
PEG 1K (695–839) All 145† 39.6% 4.1% 100% 91.7% 42.8% 21.4% 7.6% 4.1%20% 72 0% 0% 100% 84.9% 0% 0% 0% 0%40% 72 80.3% 8.5% 100% 100% 87.3% 43.7% 15.5% 8.5%
PEG 400 (840–984) All 142 76.0% 46.5% 100% 90.1% 72.5% 59.2% 50.0% 46.5%20% 28 0% 0% 100% 51.9% 0% 0% 0% 0%40% 75 90.7% 39.5% 100% 100% 86.7% 61.3% 44.0% 38.7%60% 7 100% 85.7% 100% 100% 100% 100% 85.7% 85.7%80% 32 100% 100% 100% 100% 100% 100% 100% 100%
1–984 (962 excluding Crystal Screen Cryo) 962 39.0% 11.1% 98.8% 85.4% 37.8% 25.4% 12.9% 11.1%
† One condition is 10% PEG 1K.
Figure 8Hampton Research Grid Screen Ammonium Sulfate, cocktail Nos. 1201–1224.
Figure 9Hampton Research Grid Screen PEG/LiCl, cocktail Nos. 1105–1128.With the exception of PEG and LiCl, all chemicals are at 0.1 Mconcentration.
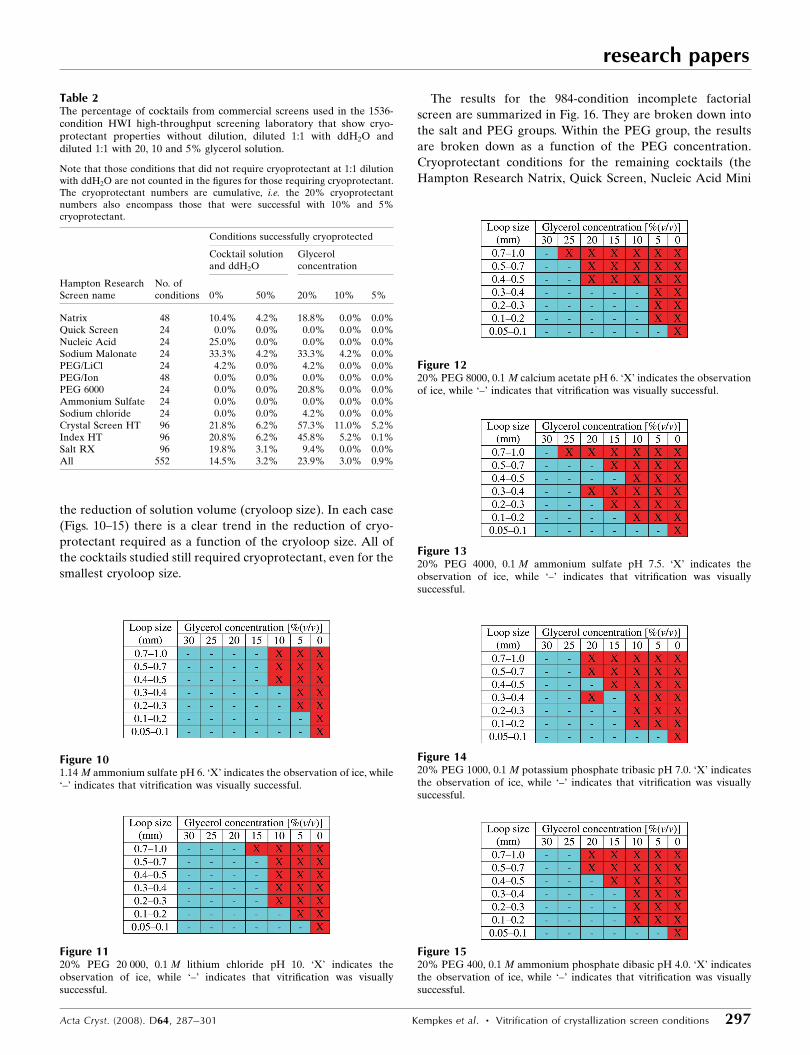
the reduction of solution volume (cryoloop size). In each case
(Figs. 10–15) there is a clear trend in the reduction of cryo-
protectant required as a function of the cryoloop size. All of
the cocktails studied still required cryoprotectant, even for the
smallest cryoloop size.
The results for the 984-condition incomplete factorial
screen are summarized in Fig. 16. They are broken down into
the salt and PEG groups. Within the PEG group, the results
are broken down as a function of the PEG concentration.
Cryoprotectant conditions for the remaining cocktails (the
Hampton Research Natrix, Quick Screen, Nucleic Acid Mini
research papers
Acta Cryst. (2008). D64, 287–301 Kempkes et al. � Vitrification of crystallization screen conditions 297
Table 2The percentage of cocktails from commercial screens used in the 1536-condition HWI high-throughput screening laboratory that show cryo-protectant properties without dilution, diluted 1:1 with ddH2O anddiluted 1:1 with 20, 10 and 5% glycerol solution.
Note that those conditions that did not require cryoprotectant at 1:1 dilutionwith ddH2O are not counted in the figures for those requiring cryoprotectant.The cryoprotectant numbers are cumulative, i.e. the 20% cryoprotectantnumbers also encompass those that were successful with 10% and 5%cryoprotectant.
Conditions successfully cryoprotected
Cocktail solutionand ddH2O
Glycerolconcentration
Hampton ResearchScreen name
No. ofconditions 0% 50% 20% 10% 5%
Natrix 48 10.4% 4.2% 18.8% 0.0% 0.0%Quick Screen 24 0.0% 0.0% 0.0% 0.0% 0.0%Nucleic Acid 24 25.0% 0.0% 0.0% 0.0% 0.0%Sodium Malonate 24 33.3% 4.2% 33.3% 4.2% 0.0%PEG/LiCl 24 4.2% 0.0% 4.2% 0.0% 0.0%PEG/Ion 48 0.0% 0.0% 0.0% 0.0% 0.0%PEG 6000 24 0.0% 0.0% 20.8% 0.0% 0.0%Ammonium Sulfate 24 0.0% 0.0% 0.0% 0.0% 0.0%Sodium chloride 24 0.0% 0.0% 4.2% 0.0% 0.0%Crystal Screen HT 96 21.8% 6.2% 57.3% 11.0% 5.2%Index HT 96 20.8% 6.2% 45.8% 5.2% 0.1%Salt RX 96 19.8% 3.1% 9.4% 0.0% 0.0%All 552 14.5% 3.2% 23.9% 3.0% 0.9%
Figure 101.14 M ammonium sulfate pH 6. ‘X’ indicates the observation of ice, while‘–’ indicates that vitrification was visually successful.
Figure 1120% PEG 20 000, 0.1 M lithium chloride pH 10. ‘X’ indicates theobservation of ice, while ‘–’ indicates that vitrification was visuallysuccessful.
Figure 1220% PEG 8000, 0.1 M calcium acetate pH 6. ‘X’ indicates the observationof ice, while ‘–’ indicates that vitrification was visually successful.
Figure 1520% PEG 400, 0.1 M ammonium phosphate dibasic pH 4.0. ‘X’ indicatesthe observation of ice, while ‘–’ indicates that vitrification was visuallysuccessful.
Figure 1420% PEG 1000, 0.1 M potassium phosphate tribasic pH 7.0. ‘X’ indicatesthe observation of ice, while ‘–’ indicates that vitrification was visuallysuccessful.
Figure 1320% PEG 4000, 0.1 M ammonium sulfate pH 7.5. ‘X’ indicates theobservation of ice, while ‘–’ indicates that vitrification was visuallysuccessful.
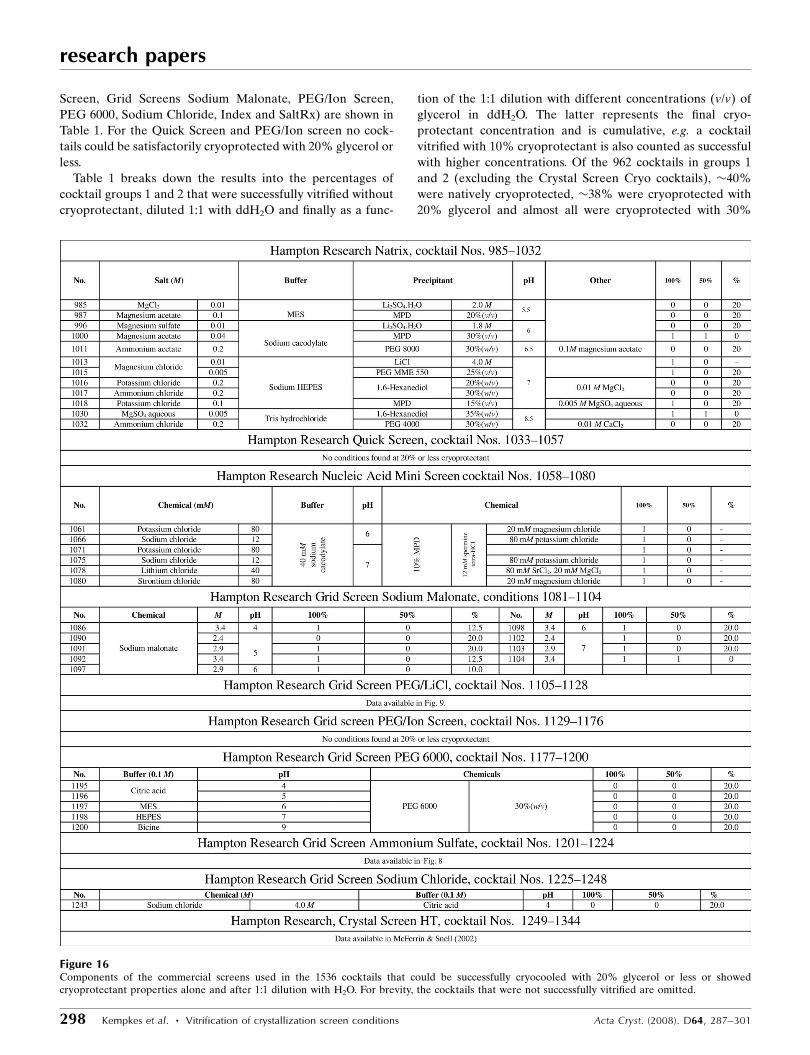
Screen, Grid Screens Sodium Malonate, PEG/Ion Screen,
PEG 6000, Sodium Chloride, Index and SaltRx) are shown in
Table 1. For the Quick Screen and PEG/Ion screen no cock-
tails could be satisfactorily cryoprotected with 20% glycerol or
less.
Table 1 breaks down the results into the percentages of
cocktail groups 1 and 2 that were successfully vitrified without
cryoprotectant, diluted 1:1 with ddH2O and finally as a func-
tion of the 1:1 dilution with different concentrations (v/v) of
glycerol in ddH2O. The latter represents the final cryo-
protectant concentration and is cumulative, e.g. a cocktail
vitrified with 10% cryoprotectant is also counted as successful
with higher concentrations. Of the 962 cocktails in groups 1
and 2 (excluding the Crystal Screen Cryo cocktails), �40%
were natively cryoprotected, �38% were cryoprotected with
20% glycerol and almost all were cryoprotected with 30%
research papers
298 Kempkes et al. � Vitrification of crystallization screen conditions Acta Cryst. (2008). D64, 287–301
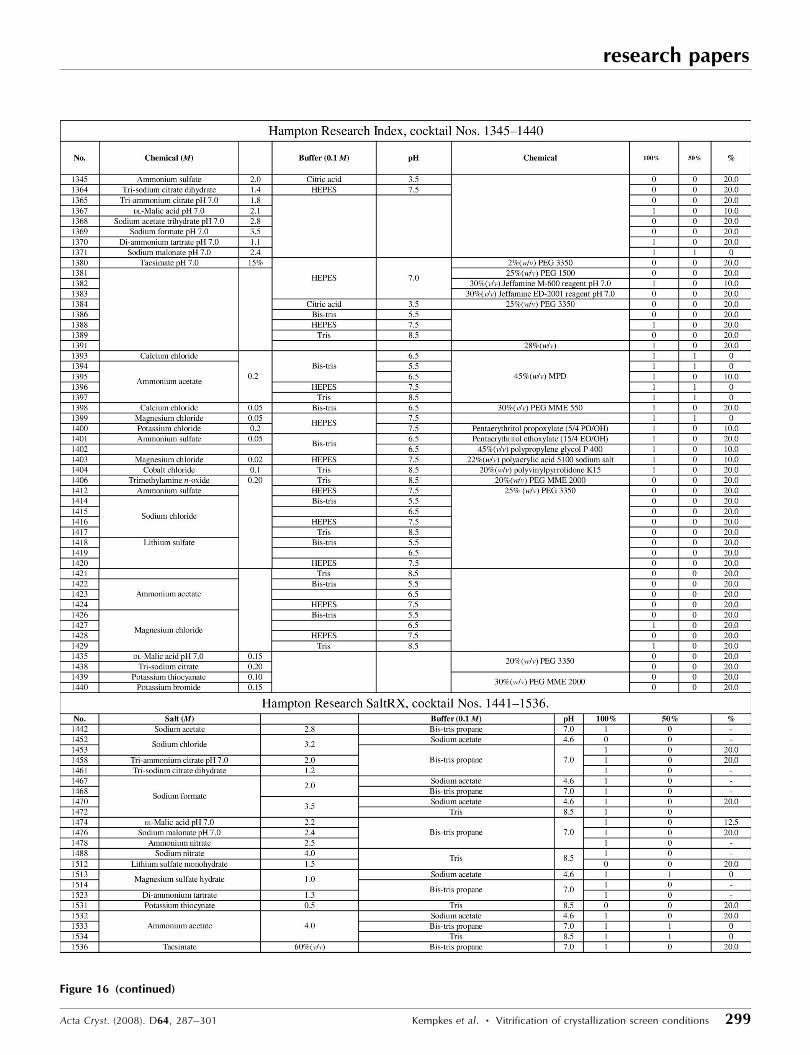
Figure 16Components of the commercial screens used in the 1536 cocktails that could be successfully cryocooled with 20% glycerol or less or showedcryoprotectant properties alone and after 1:1 dilution with H2O. For brevity, the cocktails that were not successfully vitrified are omitted.
research papers
Acta Cryst. (2008). D64, 287–301 Kempkes et al. � Vitrification of crystallization screen conditions 299
Figure 16 (continued)
glycerol. There was a sharp increase in cryoprotection going
from 20% to 30% glycerol. The commercial screens (Table 2)
were not as well suited to cryoprotection, with only 14.5%
natively cryoprotected and 24% protected with 20% glycerol.
This should not be construed as a criticism of the commercial
screens, since cryoprotection was not a factor in their
design.
4. Discussion
Cryocooling for X-ray data collection requires transforming
the crystal and any mother liquor surrounding it into an
amorphous form, i.e. vitrification. Vitrifying pure water, even
for the smallest volumes, requires cooling to below 136 K
(Mayer, 1991) in less than 10�4 s (Bruggeller & Mayer, 1980;
Mayer, 1988). Glycerol is thought to work as a cryoprotectant
by causing bulk water depletion and hydrogen-bond linear-
ization and by increasing alkyl backbone interactions within
the macromolecule (Dashnau et al., 2006). There are many
cryoprotectants available, but in addition to its cryoprotective
properties glycerol is an effective enhancer of both macro-
molecular structural order and stabilizes against noncovalent
modification (Gekko & Timasheff, 1981; Priev et al., 1996;
Sousa, 1995). Practically, glycerol can be formulated as a
component in the storage-buffer component and on crystal-
lization it can be readily incorporated into the crystal lattice,
effectively displacing water (Charron et al., 2002). The Hetero-
compound Information Centre (HIC-Up; Kleywegt, 2007) lists
over 2280 macromolecules in the Protein Data Bank (PDB;
Berman et al., 2000) in which glycerol is observed within the
structure. Ethylene glycol is the next most common cryo-
protectant and is observed in over 700 structures. Similarly, a
survey of crystallization reports published in Acta Crystallo-
graphica Section D in 2000 and 2001 showed that glycerol was
used in 50% and ethylene glycol was used in 10% of cases
(Garman & Doublie, 2003). This does not necessarily imply
that glycerol is the best cryoprotectant to use. For reasons of
convenience it is often the first; if it works, no further opti-
mization is carried out (Garman & Doublie, 2003).
McFerrin & Snell (2002) determined the amounts of
glycerol, PEG 400, ethylene glycol and 1,2-propanediol
needed to successfully vitrify the 98 Hampton Research
Crystal Screen I and II conditions. In comparing the concen-
tration of glycerol required for vitrification versus other
cryoprotectants, there were differences in a small number of
samples, e.g. Crystal Screen I condition No. 44 (0.2 M
magnesium formate) required 50% glycerol but only 35%,
30% and 30% PEG 400, ethylene glycol and 1,2-propanediol,
respectively. However, the average magnitudes of the differ-
ence in cryoprotectant concentration when compared with
glycerol were 4.0%, 3.2% and 5.9% for PEG 400, ethylene
glycol and 1,2-propanediol, respectively. The data for glycerol
can thus be used as a guide for the concentration of these
cryoprotectants. McFerrin and Snell also used (2R,3R)-(�)-
2,3-butanediol for the nine conditions under study that
required the highest concentration of glycerol. On average,
10.6% less butanediol than glycerol was required for vitrifi-
cation.
The cryoprotective properties of glycerol, methanol,
2-propanol, sucrose, xylitol, dextrose, trehalose, ethylene
glycol, PEG 200, PEG 2K, PEG 20K, dimethyl sulfoxide
(DMSO), 2-methyl-2,4-pentanediol (MPD) and salt (NaCl)
with pure water have been systematically studied as a function
of volume from 1 nl to 20 ml. Cryoprotectant conditions were
determined for plunge-cooling into liquid nitrogen (Berejnov
et al., 2006). The concentration required for vitrification
decreased with volume, especially in the range �5–0.1 ml. This
range includes the typical volumes held in a sample loop and
the observation is similar to previous observations that smaller
loops require less cryoprotectant for vitrification (Chinte et al.,
2005) and is empirically well known. Berejnov et al. (2006)
note the presence of three regimes in the cooling process:
large volume and therefore slow cooling rate where the critical
concentration is nearly constant, intermediate volumes where
the concentration shows a sharp decrease with volume and
small volumes where the cooling rate saturates and the critical
cryoprotectant concentration levels off. From Figs. 10–15 it is
clear that typical crystallographic samples are in the inter-
mediate regime. The results of Berejnov and coworkers also
illustrate that there are cryoprotectants, i.e. 2-propanol, MPD
and dextrose, that successfully vitrify solutions at significantly
lower concentrations than glycerol. Our results are in agree-
ment with Berejnov et al. (2006) and Chinte et al. (2005):
smaller volumes require less cryoprotectant. However, the
crystal volumes required for X-ray diffraction coupled with
currently available cooling technologies make it impossible to
rapidly cool pure H2O in the time required for vitrification, i.e.
in less than 10�4 s, even for the smallest cases (Bruggeller &
Mayer, 1980; Mayer, 1988). Unlike Chinte et al. (2005), we do
not observe any evidence indicating that the concentration of
cryoprotectant needed tends to be zero at the smallest loop
size. This may be a consequence of the fact that we chose
worst-case cocktails while Chinte et al. (2005) used a random
sampling of conditions.
Cryocooling samples requires both a good cryoprotectant
and good experimental technique and there are many excel-
lent articles that cover these in detail (Pflugrath, 2004; Garman
& Schneider, 1997; Garman & Owen, 2006; Garman, 1999;
Rodgers, 1997; Garman & Doublie, 2003). Garman & Owen
(2006) make a number of suggestions for the choice of cryo-
protectant. For two-thirds of cases they suggest that 15–25%
glycerol is appropriate. For conditions with PEGs less than 4K,
increasing the PEG concentration or adding other low-mole-
cular-weight PEGs is effective. PEGs greater than 4K can be
cryoprotected with lower molecular-weight PEGs and crys-
tallization conditions that already contain MPD can be cryo-
protected by increasing the MPD concentration. Finally, those
with salt that were not protected with glycerol can be cryo-
protected with ethylene glycol, with a mixture of sugars, by
increasing the salt concentration or by exchanging the salt for
an organic solvent. While there are many cryoprotectants,
given the ability of glycerol to form ordered conformations
within the crystal structure (Charron et al., 2002) and its
research papers
300 Kempkes et al. � Vitrification of crystallization screen conditions Acta Cryst. (2008). D64, 287–301
stabilizing effect (Sousa, 1995) it seems prudent to incorporate
at least a small amount during the crystallization step or
earlier unless there is the potential for competition with a
ligand of interest. For penetrating cryoprotectants, adding
them before or during the crystallization step prevents
possible disruption to the lattice by addition of the cryo-
protectant after crystals have formed (Pflugrath, 2004).
5. Conclusion
In terms of high-throughput crystallization-condition
screening, the data presented here provide a criterion for
prioritizing subsequent optimization of crystallization condi-
tions. However, it is important to note that the data represent
a worst-case scenario for vitrification; a dilution of the cocktail
with glycerol solution was used rather than replacement of the
water with glycerol and larger than typical sample volumes
were examined. Replacing water in the cocktail with the
cryoprotectant agent maintains the original cocktail compo-
sition at the same concentration and thereby minimizes
deleterious effects to the crystal (unlike the dilution used
here). This is the optimum and recommended method to
produce a good cryoprotectant solution (Garman, 1999). In
terms of volume, a balance is required between the reduction
in cryoprotectant needed owing to sample size and practical
considerations for collecting X-ray data. The optimum
concentration required for the collection of the best X-ray
data may not be the same as that which is just sufficient for
vitrification (Mitchell & Garman, 1994). Similarly, annealing
techniques that could be used to improve crystal quality
(Hanson et al., 2003) have the potential to work well with a
higher than required cryoprotectant concentration but will not
work so well if the concentration is too low (Juers & Matthews,
2004). The data presented here provide a starting point for the
optimization of cryoprotectant concentrations under similar
biochemical conditions.
We would like to thank Erie County New York for their
support of ES and KL in the HWI summer intern program.
Joseph Luft is thanked for critical reading of the manuscript
and the staff of the HWI high-throughput laboratory are
thanked for all their help and comments. Dr Elspeth Garman
is acknowledged for useful discussions. Support from the John
R. Oishei Foundation and NIH U54 GM074899 is acknowl-
edged.
References
Audic, S., Lopez, F., Claverie, J. M., Poirot, O. & Abergel, C. (1997).Proteins, 29, 252–257.
Berejnov, V., Husseini, N. S., Alsaied, O. A. & Thorne, R. E. (2006). J.Appl. Cryst. 39, 244–251.
Berman, H. M., Westbrook, J., Feng, Z., Gilliland, G., Bhat, T. N.,Weissig, H., Shindyalov, I. N. & Bourne, P. E. (2000). Nucleic AcidsRes. 28, 235–242.
Bruggeller, P. & Mayer, E. (1980). Nature (London), 288, 569–571.Charron, C., Kadri, A., Robert, M.-C., Giege, R. & Lorber, B. (2002).
Acta Cryst. D58, 2060–2065.Chayen, N. E., Shaw Stewart, P. D. & Blow, D. M. (1992). J. Cryst.
Growth, 122, 176–180.Chinte, U., Shah, B., DeWitt, K., Kirschbaum, K., Pinkerton, A. A. &
Schall, C. (2005). J. Appl. Cryst. 38, 412–419.Dashnau, J. L., Nucci, N. V., Sharp, K. A. & Vanderkooi, J. M. (2006).
J. Phys. Chem. B, 110, 13670–13677.Garman, E. (1999). Acta Cryst. D55, 1641–1653.Garman, E. F. & Doublie, S. (2003). Methods Enzymol. 368, 188–216.Garman, E. F. & Mitchell, E. P. (1996). J. Appl. Cryst. 29, 584–587.Garman, E. F. & Owen, R. L. (2006). Acta Cryst. D62, 32–47.Garman, E. F. & Schneider, T. R. (1997). J. Appl. Cryst. 30, 211–237.Gekko, K. & Timasheff, S. N. (1981). Biochemistry, 20, 4667–4676.Hanson, B. L., Harp, J. M. & Bunick, G. J. (2003). Methods Enzymol.
368, 217–235.Holyoak, T., Fenn, T. D., Wilson, M. A., Moulin, A. G., Ringe, D. &
Petsko, G. A. (2003). Acta Cryst. D59, 2356–2358.Juers, D. H. & Matthews, B. W. (2004). Acta Cryst. D60, 412–421.Kleywegt, G. J. (2007). Acta Cryst. D63, 94–100.Luft, J. R., Collins, R. J., Fehrman, N. A., Lauricella, A. M., Veatch, C.
K. & DeTitta, G. T. (2003). J. Struct. Biol. 142, 170–179.McFerrin, M. B. & Snell, E. H. (2002). J. Appl. Cryst. 35, 538–545.Mayer, E. (1988). CryoLett. 9, 66–77.Mayer, E. (1991). J. Mol. Struct. 250, 403–411.Mitchell, E. P. & Garman, E. F. (1994). J. Appl. Cryst. 27, 1070–1074.Pflugrath, J. W. (2004). Methods, 34, 415–423.Priev, A., Almagor, A., Yedgar, S. & Gavish, B. (1996). Biochemistry,
35, 2061–2066.Rodgers, D. W. (1997). Methods Enzymol. 276, 183–203.Rubinson, K. A., Ladner, J. E., Tordova, M. & Gilliland, G. L. (2000).
Acta Cryst. D56, 996–1001.Snell, E. H., Judge, R. A., Larson, M. & van der Woerd, M. J. (2002).
J. Synchrotron Rad. 9, 361–367.Sousa, R. (1995). Acta Cryst. D51, 271–277.
research papers
Acta Cryst. (2008). D64, 287–301 Kempkes et al. � Vitrification of crystallization screen conditions 301