Embed Size (px)
Citation preview

GLYCEMIC RESPONSE TO MEAL LENGTH IN HORSES
Except where a reference is made to the work of others, the work described in this thesis is my own or was done in collaboration with my advisory committee. This thesis does not
include any proprietary or classified information.
_________________________________________ Jinger Bland
Certificate of Approval: ______________________________ ______________________________ Cynthia A. McCall Elizabeth L. Wagner, Chair Professor Assistant Professor Animal Science Animal Science ______________________________ ______________________________ Russell B. Muntifering George T. Flowers Professor Dean Animal Science Graduate School
GLYCEMIC RESPONSE TO MEAL LENGTH IN HORSES
Jinger Bland
A Thesis
Submitted to
the Graduate Faculty of
Auburn University
in Partial Fulfillment of the
Requirements for the
Degree of
Master of Science
Auburn, Alabama May 9, 2009

GLYCEMIC RESPONSE TO MEAL LENGTH IN HORSES
Jinger Bland
Permission is granted Auburn University to make copies of this thesis at its discretion, upon request of individuals or institutions and at their experience. The author reserves all
publication rights.
______________________________ Signature of Author
______________________________ Date of Graduation
iii

VITA
Jinger Bland, daughter of Dr. John Bland and Lesley Slaton, was born on January
18, 1985 in Shreveport, LA. She lived in Woodworth, LA until the age of 12, at which
time she moved to Niceville, FL with her parents. After residing in Florida for one year,
she moved to Pineville, LA with her mother before moving to Texarkana, TX in 1999. As
a youth, Jinger was extremely active and competitive in swimming as well as barrel
racing and pole bending. Upon graduation from Pleasant Grove High School in 2003, she
attended Louisiana State University where she earned a Bachelor of Science in Animal,
Dairy, and Poultry Sciences in December of 2006. She then began graduate school at
Auburn University working towards a Master of Science in Animal Sciences,
concentrating on equine nutrition.
iv

THESIS ABSTRACT
GLYCEMIC RESPONSE TO MEAL LENGTH IN HORSES
Jinger Bland
Master of Science, May 9, 2009 (B.S., Louisiana State University, 2006)
47 Typed Pages
Directed by Elizabeth L. Wagner
Cereal grains are an ideal feedstuff for horses with high energy demands because
of their high soluble carbohydrate content. However, consumption of a single meal high
in soluble carbohydrates causes an immediate increase in blood glucose. This increase
could be problematic for horses with certain health conditions such as insulin resistance
or laminitis. Because some horses require additional energy for growth, performance,
pregnancy or lactation, it becomes difficult to completely remove cereal grains from their
diet. Therefore, new feeding management strategies are needed to attenuate the blood
glucose response to meals high in soluble carbohydrates. The objective of this study was
to assess the glycemic response to a concentrate meal based on time required to consume
v

that meal as measured by peak plasma glucose and insulin concentrations, glucose and
insulin areas under the curve, and time to peak plasma glucose and insulin. Eight mature,
idle horses were used in an experiment consisting of eight 7 d periods in which treatment
combinations were systematically arranged in a 2 × 4 factorial of feeds and meal
portions. Horses were offered approximately 4 Mcal of oats or textured sweet feed twice
daily at 0600 and 1800 h. Horses were offered their respective concentrate in 1, 2, 3, or 4
equal portions in 15 min intervals, thereby restricting rate of intake of the concentrate.
Blood was collected via indwelling jugular catheters at the evening feeding on d 7 of
each period, with a baseline sample collected 30 min prior to feeding (1750 h), then every
30 min post-feeding until 0000 h. Plasma glucose and insulin concentrations were
determined, and resulting data were analyzed by the GLM procedure of SAS. Time to
peak plasma insulin was longer (P < 0.05) for horses consuming oats, but there were no
other significant differences for concentrate type, portions, or treatment interactions for
glucose and insulin. A period effect (P < 0.05) was noted for peak plasma glucose and
time to peak plasma glucose. There was a trend (P < 0.10) toward a period effect for
glucose area under the curve, but no period effects were observed for measures of insulin.
A horse effect (P < 0.05) was also noted for peak plasma glucose and insulin as well as
glucose and insulin area under the curve (AUC). Glucose and insulin responses to a
concentrate meal were not altered by time to consume the meal in the present study.
vi

ACKNOWLEDGEMENTS
The author wishes to thank her major professor, Dr. Elizabeth Wagner, for her
assistance, patience, and guidance throughout the work on this project and manuscript.
Without her help, she never would have been able to accomplish this goal. She would
also like to thank Drs. Cynthia McCall and Russell Muntifering for their help as
committee members. She also wishes to thank Dr. Wendell McElhenney for his
assistance with statistical analysis.
The author also wishes to express her gratitude for those who participated in the
blood collection period of this project: Whitney Brown, Teresa Fenn, Judson “Kyle”
Grubbs, Lindsay Henderson, Erica Hobbs, Mike Huggins, Grace Owen, Shayna Penn,
William “Cobie” Rutherford, Jordan Towns, and Patty Tyler. Without their sacrifice, this
project never could have been completed. She also wishes to thanks Ashley Bruce for her
assistance with data input.
Finally, the author wishes to thank her family, Dr. John and Valerie Bland and
George, Reda, and Lesley Slaton, for their continual love, support, and encouragement
throughout her entire academic career.
vii

Style manual or journal used: ___________Journal of Animal Science_______________
Computer software used: ______________Microsoft Office Word 2003______________
viii

TABLE OF CONTENTS
REVIEW OF LITERATURE ..............................................................................................1 MATERIALS AND METHODS.......................................................................................12 RESULTS AND DISCUSSION........................................................................................16 CONCLUSIONS................................................................................................................25 LITERATURE CITED ......................................................................................................27 APPENDICES ...................................................................................................................34 Appendix 1: Feeding rotations throughout the duration of the study ....................35 Appendix 2: Laboratory analyses for oats and sweet feed ....................................36
Appendix 3: Ingredient composition of Nutrena® Triumph® textured sweet feed..........................................................................................37
ix

LIST OF FIGURES AND TABLES
Figure 1 Mean plasma glucose concentrations for horses consuming a meal* of sweet feed offered in 1, 2, 3, or 4 equal portions ..................................17 Figure 2 Mean plasma glucose concentrations for horses consuming a meal* of oats offered in 1, 2, 3, or 4 equal portions .............................................18 Figure 3 Mean plasma insulin concentrations for horses consuming a meal* of sweet feed offered in 1, 2, 3, or 4 equal portions ..................................18 Figure 4 Mean plasma insulin concentrations for horses consuming a meal* of oats offered in 1, 2, 3, or 4 equal portions .............................................19 Table 1 Mean peak glucose concentrations (mg·dL-1) for horses consuming a meal of oats or sweet feed offered in 1, 2, 3, or 4 equal portions..............20 Table 2 Mean peak insulin concentrations (µU·mL-1) for horses consuming a meal of oats or sweet feed offered in 1, 2, 3, or 4 equal portions..............20 Table 3 Mean time to peak glucose concentrations (h) for horses consuming a meal of oats or sweet feed offered in 1, 2, 3, or 4 equal portions ...........21 Table 4 Mean time to peak insulin concentrations (h) for horses consuming a meal of oats or sweet feed offered in 1, 2, 3, or 4 equal portions..............21 Table 5 Glucose area under the curve (mg·dL-1·h-1) for horses consuming a meal of oats or sweet feed offered in 1, 2, 3, or 4 equal portions..............22 Table 6 Insulin area under the curve (µU·mL-1·h-1) for horses consuming a meal of oats or sweet feed offered in 1, 2, 3, or 4 equal portions..............22
x

1
REVIEW OF LITERATURE
Horses have evolved to be continuous grazers. Feral horses generally spend 65%
of their time grazing low quality, high fiber forage (Laut et al., 1984). In the wild they
have adapted to a diet consisting of forages with relatively large amounts of water,
soluble proteins, lipids, sugars and structural carbohydrates, but very little starch (Frape,
2004). Domesticated horses, however, are often managed differently. Meal feedings
generally are restricted for various reasons (most often being the caretaker’s schedule),
and increased energy requirements for production and/or performance often result in the
feeding of high-concentrate rations of grains or grain by-products to horses (Massey et
al., 1985), with pasture turnout restricted in many cases.
Common diets fed to horses seldom contain more than 5% fat and 7-12% protein
(Frape, 2004), so these represent minor sources of energy relative to carbohydrates.
Recently, however, some manufacturers have begun to develop higher-fat and fiber,
lower-starch feeds that with time and further research could become the new trend for
horse diets. Most of the energy in grains is typically found as starch, and a diet containing
30% starch (3.4 g starch/ kg BW/ meal) is generally considered to be a high-starch diet
(NRC, 2007). Typical grain-based mixes can contain as much as 30-50% starch (NRC,
2007). In contrast to ruminants, horses are able to hydrolytically digest

2
and absorb digestive end-products prior to post-gastric fermentation (Argenzio and Hintz,
1970). Carbohydrates digested and absorbed as monosaccharides in the small intestine
yield more energy for metabolism than those digested by microbial fermentation, with the
amount of starch ingested in a single meal possibly affecting the percentage of starch that
disappears before reaching the large intestine (NRC, 2007). Potter et al. (1992) reported
that about 80% of the starch was digested and absorbed before it reached the terminal
ileum when a small amount of oats was fed to horses. However, when a large amount of
oats was fed, only around 58% of the starch was digested before reaching the ileum. If
levels of dietary carbohydrates exceed the capacity of the equine small intestine to digest
and absorb them, they will spill over into the hindgut. Potter et al. (1992) suggested that a
starch intake of 3.5 to 4.0 g/kg BW is the upper limit for the small intestine for starch
digestion. Starch spill-over can alter the microbial populations and the metabolic products
of the cecum, and can predispose the horse to gastrointestinal disorders (Dyer et al.,
2002). Any gut dysfunction in a horse is threatening because it can precede colic, which
is the main cause of equine mortality (Hintz and Cymbaluk, 1994). A lower limit of
starch intake has been suggested for feeding horses prone to developing laminitis (Frape,
2004).
Carbohydrate digestion and fermentation yield predominantly glucose and acetic,
propionic and butyric volatile fatty acids (VFA), all of which are readily absorbed into
the equine bloodstream. It has been suggested that the proportion of digestive end-
products absorbed as glucose or VFA and lactic acid may be influenced by the extent of
prececal, or maybe even preileal, digestion (Frape, 2004). Glinsky et al. (1976) indicated
that VFA from the cecum may be sufficient to supply up to 30% of a horse’s energy
3
needs at maintenance, while Vermorel et al. (1997) proposed that consuming a diet
composed primarily of hay might meet more than 80% of the energy needs from VFA.
However, it is important to note that not all carbohydrates are fermented at the same rate
or produce the same proportions of VFA (NRC, 2007).
Glucose is the principle form of carbohydrate used to produce ATP. Cells can
acquire glucose from the circulation or from intracellular glycogen stores. Because of
this, healthy horses and ponies typically sustain a blood plasma glucose concentration
within certain limits. Ralston (2002) indicated that fasting blood plasma glucose
concentrations in horses are usually between 60 and 90 mg·dL-1, while fasting blood
plasma insulin concentrations are typically between <5 and 20 µIU. This blood glucose
concentration is the expression of a balance of glycogen breakdown (glycogenolysis) and
glycogen synthesis (glycogenesis), and the production of glucose from other sources such
as amino acids, lactic acid and propionate through gluconeogenesis. Red blood cells lack
mitochondria, so they are totally dependent on substrate-level phosphorylation. As a
result, these cells depend almost entirely on glucose as a source of energy producing
lactate as an end-product of glycolysis. The clearance of glucose from blood results
mainly from uptake by the liver and muscle cells, where it is then converted to glycogen
and fat (Frape, 2004). The muscle is conservative with its glycogen reserves such that
glycogen is only available to the muscle as a fuel source, not to other tissues. However,
glycogen stored in the liver may be broken down to allow glucose utilization by other
tissues (NRC, 2007).
The process of converting blood glucose into glycogen in various body tissues is
stimulated by the anabolic hormone insulin, which activates enzymes directed towards
4
storage in response to a rise in blood glucose. Inversely, insulin inhibits glucose
breakdown. By stimulating uptake in tissues, insulin prevents glucose from being
excreted in urine, thus lowering blood glucose concentration. Insulin also enhances fat
metabolism, or lipolysis, by stimulating lipoprotein lipase in the adipose tissue. The
effects of insulin are counterbalanced by other hormones such as glucagon,
glucocorticoids, catecholamines, epinephrine and norepinephrine (Frape, 2004). In this
manner, the system is maintained in a state of dynamic equilibrium. The type of diet
consumed can influence fluctuations between resting and peak levels of glucose (and
insulin). Equine diets containing more grain and less roughage tend to lead to higher
peaks and lower troughs. Gordon and McKeever (2005) suggested that the concurrent
ingestion of high-fiber hay might actually slow down the absorption of glucose in the
gastrointestinal tract, as illustrated by the lack of a substantial postprandial increase in
both glucose and insulin.
There are two procedures commonly used to evaluate glucose response in horses.
The first is known as the glucose tolerance test, which measures plasma glucose and
insulin responses to a glucose challenge (oral or intravenous). This technique provides
information about the animal’s glucose metabolism. Another process, known as the
glycemic index, measures plasma glucose and insulin responses to a meal. This method
provides information about the feed, but not necessarily the animal.
The glycemic index has been widely used in human nutrition, especially for
diabetics, to formulate diets that have a low glycemic impact (Wolever et al., 1991). In
horses, it has been used to describe meal-related responses of blood glucose and insulin
to different diets (Stull and Rodiek, 1988; Williams et al., 2001). The glycemic index has
5
been defined as the incremental area under the blood glucose response curve of a 50 g
carbohydrate portion of test food, expressed as a percentage of the blood glucose
response curve to the same amount of carbohydrate from a standard food consumed by
the same individual (FAO/WHO, 1998). For humans, the 50 g carbohydrate portion
should contain 50 g of available carbohydrate, with the standard food being either white
bread or glucose (FAO/WHO, 1998). The methods used in equine studies have been
extremely variable, making it difficult to interpret results across the board (NRC, 2007).
Factors affecting glycemic index include meal size, concentrations of hydrolyzable
carbohydrates, fat and fiber, processing, intake time, gastric emptying, digestibility and
rate of absorption (Hoffman et al., 2003b). A glycemic index developed for horses and
ponies needs to account for feed differences when they are mixed with other ingredients
(i.e., not fed alone) because this method is routine in the equine industry.
Plasma glucose response to a meal is generally measured as the area under the
curve (AUC). The more rapidly glucose is cleared (the greater the tolerance), the smaller
the area. Horses and ponies tend to have a lower glucose tolerance than humans or pigs,
but a slightly greater one than ruminants. However, there are variations in tolerance
among equines. For example, some hot-blooded horses such as Thoroughbreds generally
have a higher glucose tolerance than ponies because ponies tend to secrete less insulin
and their tissues may be less sensitive (more resistant) to insulin (Frape, 2004), although
there can be considerable adaptation to diets.
Glucose conservation has been shown to be favored when animals are deprived of
glucogenic precursors, such as with feed restriction (Waghorn et al., 1987). The horse
may change its pattern of glucose metabolism so that it partially relies on the metabolism

6
of other substrates (Evans, 1971). When they are well fed, less adaptation to glucose
conservation may occur (Powell et al., 2000). Therefore, a more rapid decline in plasma
glucose concentrations may occur when adequate intakes are provided (McNiven, 1984).
For example, when subjected to a glucose infusion, fasted ponies were less sensitive to
the action of insulin than normally fed ponies. A larger insulin response was necessary to
affect glucose uptake (Argenzio and Hintz, 1970; 1971). Powell et al. (2000) also
suggested that diet adaptation may play a role. These researchers indicated that, during
short-term feed restriction, glucose uptake could be slowed following feeding in working
horses adapted to a high-roughage diet. Sticker et al. (1995) showed that mares on long-
term dietary energy and protein restriction were able to gradually adjust to that restriction
by increasing plasma glucose concentrations, regardless of intake. Jacobs and Bolton
(1992) indicated that horses adapted to pasture had a higher response to an oral glucose
dose and 1.8 times as much glucose AUC than horses fed a typical stable diet of hay and
commercial feed. The horses fed the stable diet consumed about 3.5 times as much
hydrolyzable carbohydrate as the pasture horses, resulting in a higher glycemic index that
influenced their response to the oral glucose challenge. An adaptation to meals with a
higher glycemic index may have enhanced the ability of the stabled horses to clear
glucose at a much faster rate than the horses accustomed to a natural pasture grazing
pattern. Also, Ralston (2002) hypothesized that the time between feedings, and possibly
the fasting that occurs before a feeding, can affect glucose and insulin responses.
Despite appearing healthy, horses adapted to high-glycemic feeds may exhibit
changes in altered insulin sensitivity and compensation. Diets rich in simple sugars have
been associated with insulin resistance in several animal and human studies (Bessesen,

7
2001; Storlien et al., 2000), so the common management practice of feeding starch-rich
cereal grains in two meals per day may actually promote insulin resistance in some
horses.
While horses very rarely develop insulin-dependent diabetes, noninsulin-
dependent diabetes (insulin resistance) does occur. Insulin resistance has been generally
defined as a state in which normal concentrations of insulin fail to elicit a normal
physiological response (Kahn, 1978), and is fundamental in the pathology of type II
diabetes in humans. Resistance can refer to inefficient insulin signaling at the cell surface
(low insulin sensitivity) or disruption of insulin signaling pathways within the cell
(insulin ineffectiveness) (Kronfeld, et al., 2005). Insulin resistance has been associated
with a variety of equine disorders, such as obesity and laminitis (Jeffcott et al., 1986; Pass
et al., 1998), and may play a role in colic (Hudson et al., 2001), exertional
rhabdomyolysis (Valentine et al., 2001), and osteochondrosis dissecans (Ralston, 1996).
Frost et al. (1996) demonstrated that consumption of a diet with a low glycemic
index appeared to elevate insulin sensitivity in human heart-disease patients. Ingestion of
another low-glycemic-index diet resulted in a higher disposition index (an index that
describes ß-cell responsiveness and accounts for the influence of both endogenous insulin
secretion and insulin sensitivity, Hoffman et al., 2003a) and tended to improve insulin
sensitivity in humans with insulin resistance (Wolever and Mehling, 2002).
Adaptation to a high-glycemic diet is associated with increased insulin resistance
and a compensatory increase in insulin secretion (Treiber et al., 2005). A study by
Hoffman et al. (2003a) used the minimal model, a mathematical tool that provides a
quantitative measure of insulin sensitivity, to examine glucose-insulin dynamics in obese
8
vs. non-obese geldings. Results showed that obese geldings were insulin resistant,
indicating that they seemed to rely primarily on glucose-mediated glucose disposal. The
researchers also noted that feeding a diet rich in sugar and starch decreased the insulin
sensitivity of all horses (obese and non-obese), with that sensitivity approximately 80%
lower in obese horses. These results are similar to a reported 76% reduction in insulin
sensitivity in obese vs. normal-weight humans (Lee et al., 1992). The horses also had
lower acute insulin responses to glucose (endogenous insulin secretion in response to a
glucose dose) and lower disposition indices when fed a high sugar-starch diet. The lower
disposition index suggests less ß-cell responsiveness. This study ultimately demonstrated
that the maintenance of body condition and avoidance of grain-based meals rich in sugar
and starch should be beneficial in decreasing the risk of developing insulin resistance and
associated metabolic disorders in horses, especially for horses at risk for these conditions.
Because of the innate differences in grains commonly fed to horses, the
availability of glucose after ingestion of a grain meal may vary. Previous studies
performed in horses have compared the effect of ingestion of varying amounts of grains
or concentrates on plasma glucose and serum insulin concentrations (Pagan et al., 1999;
Ralston, 1992; Stull and Rodiek, 1988; Williams et al., 2001). These studies showed that
ingestion of grain or concentrate meals results in moderate to marked hyperglycemia and
hyperinsulinemia between 1 and 3 hours after eating. However, these studies compared
ingestion of different grains or concentrates as equal-weight or isocaloric meals, which
did not result in ingestion of equal amounts of starch and sugar.
Several studies using horses or ponies with ileal or cecal fistulae have determined
that small-intestinal starch digestibility depends on its botanical origin and prior physical

9
or thermal treatment (Healy et al., 1995; Meyer et al., 1993). De Fombelle et al. (2004)
indicated that prececal starch disappearance was most affected by the botanical source of
starch. Still, there is conflicting evidence for the difference in small-intestinal starch
digestibility among various cereal grains such as corn, oats, and barley (De Fombelle et
al., 2001; Meyer et al., 1993; Potter et al., 1992; Radicke et al., 1991). Despite possible
differences in starch digestibility among different grains observed in previous studies, the
glycemic response assessed as glucose AUC did not differ among corn, oat groats, or
barley in comparison to an intragastric glucose infusion based on equal amounts of
hydrolyzable carbohydrates in a study by Jose-Cunilleras et al. (2004). Plasma glucose
concentration peaked in all 4 treatments by 1.5 to 2 hours after feeding, and remained
higher than baseline throughout 8 hours for oat groats and barley. For corn-fed and
glucose-administered horses, plasma glucose returned to baseline by 5 to 6 hours post-
feeding. The shape of the glycemic responses after glucose administration and corn
ingestion were similar and had larger fluctuations in plasma glucose compared with oats
and barley. It is important to note that the rate of ingestion was unequal among the grains.
A slower meal consumption in oat groats-fed horses than corn-fed horses may explain the
lower glycemic peak and extended clearance time for oat groats compared with corn.
The normal feeding pattern of horses and ponies is one of small meals at frequent
intervals. In today’s equine industry, however, many horses consume grain meals once or
twice daily. Steelman et al. (2006) performed a study in which horses received the same
amount of concentrate per day, allocated into meals fed 2, 3, or 4 times per day. Results
showed that peak glucose concentration, mean concentrations of glucose, as well as
glucose AUC were all greater in horses fed twice daily. No differences were observed

10
between the 3× and 4× daily schedules, which indicates that the larger amounts of
concentrate fed per meal twice daily resulted in a larger plasma glucose response than the
smaller amounts fed either three or four times per day. Smaller, more frequent meals
allow the small intestine to continually, and maximally, digest and absorb carbohydrates
resulting in a more constant glycemic response. Large, infrequent meals can overload the
capacity of the small intestine, causing an excess of undigested carbohydrate to enter the
cecum where the microflora convert it to VFAs and lactic acid. This meal situation
results in a more dynamic glycemic response with rapid, high peaks and broad, low
troughs.
Considering the negative consequences and disadvantageous economic costs of
overfeeding starch, it is valuable to establish what levels can be safely fed in a meal-
feeding situation. Trials conducted with different sizes of horses and ponies ingesting
various levels of starch suggest that single-meal starch intakes exceeding 0.2 to 0.4% of
body weight vastly increase the amount of starch presented to the cecum and large
intestine (Potter et al., 1992; Meyer et al., 1993; Kienzle, 1994). High-quality forage diets
and diets containing significant amounts of digestible fiber and added fat reduce the need
for starch as an energy source (NRC, 2007). Results from a study by Treiber et al. (2005)
showed a tendency for a lower glucose response to fat-added feed vs. a traditional starch
concentrate over 30 days.
The glycemic responses to the ingestion of different diets in horses are complex.
Blood glucose and insulin levels appear to be alterable through dietary manipulation, but
individual horse responses to meal-fed concentrates will vary. Additional influences, such
as the form and processing of feedstuffs, will alter the suggested recommendations for
11
limiting the starch levels of meals, as well as the amounts fed per meal and the meal
frequency. Because some horses require additional energy for growth, performance,
pregnancy or lactation, it becomes difficult to completely remove cereal grains from their
diet. Therefore, new feeding management strategies are needed to attenuate the blood
glucose response to a soluble carbohydrate-rich meal.
If daily schedules of horse owners are highly restricted, it is oftentimes most
feasible to meal-feed horses once or twice per day. These meals are generally large,
concentrate meals. As previously stated, these large, infrequent meals are not the best
feeding protocol for horses in regard to glycemic and insulinemic responses. The
objective of this study was to use concentrate feeds that are commonly fed to horses to
assess the glycemic and insulinemic responses to a meal based on the time allowed to
consume that particular meal. Perhaps by reducing the rate of intake of a large
concentrate meal, the caretaker could easily prevent extremely dynamic glycemic and
insulinemic responses.

12
MATERIALS AND METHODS
Eight mature, idle horses were used in the present study. Ages ranged from 4 to
14 yr, with an average of 6.25 yr. Five were American Quarter Horses (four mares and
one gelding), one mare was an Arabian, one gelding was an Appaloosa, and one gelding
was an Arabian x Appaloosa cross. Body weights (BW) averaged 504 ± 82 kg. The
animals were maintained at the Auburn University Horse Unit according to a protocol
that was approved by the Institutional Animal Care and Use Committee. Horses had
access to pasture containing predominantly Coastal bermudagrass (Cynodon dactylon),
and were allowed ad libitum access to clean, fresh water with meal feedings twice daily.
Initially, horses were randomly allocated to different treatments for the first week
of the project, and then systematically assigned to a 2 × 4 factorial arrangement of feeds
and meal portions consisting of eight 7 d periods (Appendix 1). Approximately 4 Mcal
DE of Nutrena® Racehorse Oats or Nutrena® Triumph® textured sweet feed (Appendix 2)
was offered twice daily at 0600 and 1800 h. The approximate 8 Mcal DE fed per day
represents roughly half of the daily Mcal DE required by a 500 kg adult horse at
maintenance (NRC, 2007). The amount of feed offered was calculated from DE content
based on vendor information for the sweet feed and tabular values for oats (NRC, 2007).
The textured sweet feed contained approximately 10% CP, 4% crude fat, and 8% crude
13
fiber according to the manufacturer’s label. Horses were placed in individual stalls and
offered their respective meal in 1, 2, 3, or 4 equal portions in 15 min intervals.
On d 7 of each period, horses were fasted in individual stalls for 6 h beginning at
1200 h prior to feeding the test diet. They were allowed ad libitum access to fresh water.
Jugular-vein catheters were inserted 2 h prior to the initial baseline blood collection. Prior
to insertion, the hair on the collection area of the neck was shaved with standard
grooming clippers, and the insertion site was disinfected using a 3 × 3 surgical scrub
procedure with Betadine® and isopropyl alcohol. One and one-half cc of Lidocaine® was
administered subcutaneously at the catheter-insertion site. A 14GA × 140mm jugular-
vein catheter (Abbocath®-T Radiopaque FEP I.V. Catheter) was inserted, and an
extension set (Hospira® 7in extension set with Option-Lok®) attached. Super glue® was
used to anchor the catheter port to the animal’s neck. Gauze squares were placed over the
insertion site, and Elasticon® elastic tape was wrapped around the horse’s neck to ensure
that the catheter and extension set remained clean and in place.
A baseline blood sample was collected at 1730 h, 30 min prior to the initial
evening feeding at 1800 h, with sequential samples collected every 30 min after the initial
feeding for 6 h (1830, 1900, 1930, 2000, 2030, 2100, 2130, 2200, 2230, 2300, 2330, and
0000 h). Five cc of blood was collected and discarded, followed by collection of 20 cc.
The extension set and catheter were then flushed with 7 cc of a heparinzed saline solution
(0.9 % NaCl) to prevent the formation of blood clots. Each blood sample was
immediately transferred into 2 tubes containing a glycolytic inhibitor (sodium fluoride)
and 2 tubes with sodium heparin for analysis of glucose and insulin concentrations,
respectively.

14
Blood samples were cooled in ice water for 15 min prior to centrifugation. An
IEC® Centra CL2 (Thermo Electron Corp., Milford, MA) centrifuge was used to spin
samples for 10 min at 1560 × g. Plasma was separated into microcentrifuge tubes and
frozen at -20°C prior to laboratory analyses of glucose and insulin concentrations.
Plasma samples were thawed at room temperature. Glucose was analyzed using
an automated glucose and L-lactate analyzer (YSI 2300 Stat Plus Analyzer, Yellow
Springs, OH), while insulin samples were analyzed using radioimmunoassay (Coat-A-
Count Insulin, Dept. of Anatomy and Physiology and Pharmacology, Auburn University
College of Veterinary Medicine). Duplicates were run of each sample for each assay.
On each blood collection day, samples of each feed were collected for subsequent
laboratory analysis. DM was determined using the procedure of the Association of
Official Analytical Chemists (1995) in which samples were dried in an oven at 65°C for
72 h. Samples were ground using a Wiley Mill with a screen size of 1.0 mm.
Concentrations of NDF and ADF were determined by sequential fractionation using a
heat-stable amylase according to procedures of Van Soest et al. (1991). Megacalories of
DE were then calculated for each concentrate feed using the following formula (NRC,
2007).
DE (Mcal/kg) = 4.07 – 0.055 × (%ADF)
Data for blood plasma values were analyzed using the Proc GLM procedure of
SAS with classes of horse, period, feed, and portion, using a P < 0.05 level of
significance to determine differences in the peak concentration, time to peak

15
concentration, and area under the curve (AUC) for both glucose and insulin. AUC was
calculated using the trapezoidal method. A simple one-way ANOVA was used to analyze
data from the feed samples with a P < 0.05 level of significance.
16
RESULTS AND DISCUSSION
One horse did not consume its experimental diet during the first wk of the project,
so its treatment was repeated for that particular mare on wk 9 of the project. In the
statistical analysis, data from wk 9 was treated as if from wk 1 for this particular horse.
Another horse had to be sedated with xylazine for catheterization throughout the study.
This horse was catheterized first (approximately 5 h before the baseline sample) to allow
sufficient time for effects of the xylazine to dissipate prior to blood collection. All horses
consumed their meals in fewer than 10 min for all feedings throughout the study. Except
for the one horse during wk 1, there were no feed refusals during the course of the study.
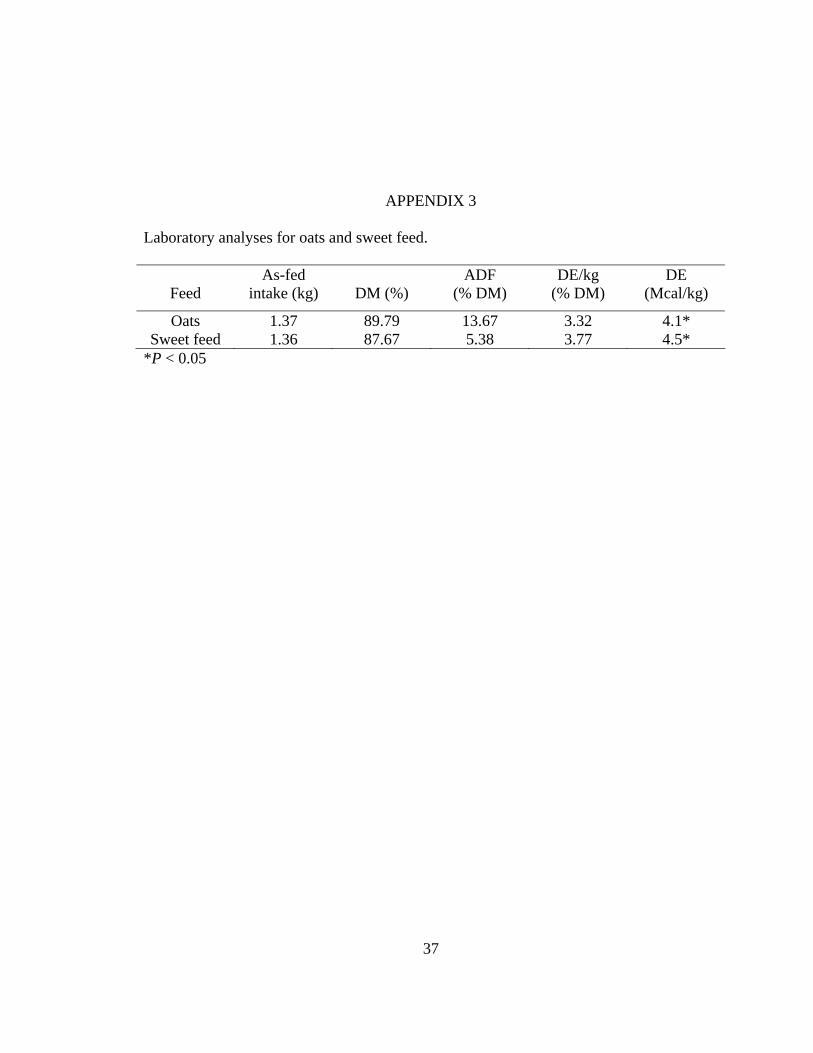
Laboratory analysis of experimental feeds revealed that estimated DE consumed
per meal differed (P < 0.05) between oats and sweet feed (Appendix 3). Horses fed oats
consumed 4.1 Mcal DE per meal, whereas those fed sweet feed consumed 4.5 Mcal DE.
Although these values are dissimilar, they only differ from their mean by less than 5%.
No difference (P < 0.05) was found for peak glucose concentration based on the
number of portions fed or concentrate type (Figures 1 and 2). For time to peak glucose,
there was no difference among the number of portions or type of concentrate consumed.
Glucose AUC (mg·dL-1·h-1) also was not different among meal portion offered or type of
concentrate fed.

There was no difference for peak insulin concentration (µU·mL-1) throughout the
study based on the number of portions offered or type of concentrate fed (Figures 3 and
4). For time to peak insulin, there were no differences among portions fed. However,
there was a difference (P < 0.05) between oats and sweet feed for time to peak insulin
concentration, with oats having a longer time to peak. Portions and concentrate type did
not differ for insulin AUC (µU·mL-1·h).
Figure 1. Mean plasma glucose concentrations for horses consuming a meal* of sweet
feed offered in 1, 2, 3, or 4 equal portions.
60.00
70.00
80.00
90.00
100.00
110.00
120.00
130.00
1730 1830 1900 1930 2000 2030 2100 2130 2200 2230 2300 2330 2400
T im e (h )
[glu
cose
] mg•
dL-1
1x2x3x4x
*The initial offering of concentrate occurred at 1800 hrs.
17

Figure 2. Mean plasma glucose concentrations for horses consuming a meal* of oats
offered in 1, 2, 3, or 4 equal portions.
60 .00
70 .00
80 .00
90 .00
100 .00
110 .00
120 .00
130 .00
1730 1830 1900 1930 2000 2030 2100 2130 2200 2230 2300 2330 2400
T im e (h )
[glu
cose
] mg•
dL-1
1x2x3x4x
*The initial offering of concentrate occurred at 1800 hrs.
Figure 3. Mean plasma insulin concentrations for horses consuming a meal* of sweet
feed offered in 1, 2, 3, or 4 equal portions.
0 . 0 0
2 0 . 0 0
4 0 . 0 0
6 0 . 0 0
8 0 . 0 0
1 0 0 . 0 0
1 2 0 . 0 0
1 7 3 0 1 8 3 0 1 9 0 0 1 9 3 0 2 0 0 0 2 0 3 0 2 1 0 0 2 1 3 0 2 2 0 0 2 2 3 0 2 3 0 0 2 3 3 0 2 4 0 0
T i m e (h )
[insu
lin] µ
U•m
L-1
1 x2 x3 x4 x
*The initial offering of concentrate occurred at 1800 hrs.
18

Figure 4. Mean plasma insulin concentrations for horses consuming a meal* of oats
offered in 1, 2, 3, or 4 equal portions.
0 .0 0
2 0 .0 0
4 0 .0 0
6 0 .0 0
8 0 .0 0
1 0 0 .0 0
1 2 0 .0 0
1 7 3 0 1 8 3 0 1 9 0 0 1 9 3 0 2 0 0 0 2 0 3 0 2 1 0 0 2 1 3 0 2 2 0 0 2 2 3 0 2 3 0 0 2 3 3 0 2 4 0 0
T im e (h )
[insu
lin] µ
U•m
L-1
1 x2 x3 x4 x
*The initial offering of concentrate occurred at 1800 hrs.
Peak concentrations of glucose and insulin were not altered by time allowed to
consume a concentrate meal in the present study (Tables 1 and 2). Times to peak
concentrations of glucose and insulin were not affected by time allowed to consume a
concentrate meal (Tables 3 and 4). However, time to peak plasma insulin was longer (P <
0.05) for horses consuming oats than sweet feed (Table 4). The area under the time ×
concentration curve for glucose and insulin was not affected by time to consume a
concentrate meal (Tables 5 and 6). These results indicate that extending concentrate
intake up to 1 h was not sufficient to alter measures of glycemic response in the present
study.
19

20
Table 1. Mean peak glucose concentrations (mg·dL-1) for horses consuming a meal of oats or sweet feed offered in 1, 2, 3, or 4 equal portions. # Portions Oats Sweet Feed Mean1
LSMean SE LSMean SE LSMean SE 1 126.13 ± 4.01 122.14 ± 4.01 124.13 ± 2.83 2 115.75 ± 4.01 120.55 ± 4.01 118.15 ± 2.83 3 118.25 ± 4.01 116.23 ± 4.01 117.24 ± 2.83 4 124.76 ± 4.01 122.88 ± 4.01 123.82 ± 2.83
Mean2 121.22 ± 2.00 120.45 ± 2.00 1 Mean of oats and sweet feed based on portion. 2 Mean of portions based on concentrate type. Table 2. Mean peak insulin concentrations (µU·mL-1) for horses consuming a meal of oats or sweet feed offered in 1, 2, 3, or 4 equal portions. # Portions Oats Sweet Feed Mean1
LSMean SE LSMean SE LSMean SE 1 77.60 ± 12.28 62.20 ± 12.28 69.90 ± 8.68 2 65.49 ± 12.28 78.63 ± 12.28 72.06 ± 8.68 3 66.99 ± 12.28 74.16 ± 12.28 70.58 ± 8.68 4 82.78 ± 12.28 89.03 ± 12.28 85.90 ± 8.68
Mean2 73.21 ± 6.14 76.00 ± 6.14 1 Mean of oats and sweet feed based on portion. 2 Mean of portions based on concentrate type.

21
Table 3. Mean time to peak glucose concentrations (h) for horses consuming a meal of oats or sweet feed offered in 1, 2, 3, or 4 equal portions. # Portions Oats Sweet Feed Mean1
LSMean SE LSMean SE LSMean SE 1 1.94 ± 0.23 1.94 ± 0.23 1.94 ± 0.17 2 2.00 ± 0.23 2.19 ± 0.23 2.09 ± 0.17 3 1.94 ± 0.23 2.31 ± 0.23 2.13 ± 0.17 4 2.81 ± 0.23 2.13 ± 0.23 2.47 ± 0.17
Mean2 2.17 ± 0.12 2.14 ± 0.12 1 Mean of oats and sweet feed based on portion. 2 Mean of portions based on concentrate type. Table 4. Mean time to peak insulin concentrations (h) for horses consuming a meal of oats or sweet feed offered in 1, 2, 3, or 4 equal portions. # Portions Oats Sweet Feed Mean1
LSMean SE LSMean SE LSMean SE 1 2.44 ± 0.30 1.81 ± 0.30 2.13 ± 0.21 2 2.69 ± 0.30 2.00 ± 0.30 2.34 ± 0.21 3 2.38 ± 0.30 2.06 ± 0.30 2.22 ± 0.21 4 2.63 ± 0.30 2.44 ± 0.30 2.53 ± 0.21
Mean*2 2.53 ± 0.15 2.08 ± 0.15 * Means in row differ (P < 0.05) 1 Mean of oats and sweet feed based on portion. 2 Mean of portions based on concentrate type.

22
Table 5. Glucose AUC (mg·dL-1·h-1) for horses consuming a meal of oats or sweet feed offered in 1, 2, 3, or 4 equal portions. # Portions Oats Sweet Feed Mean1
LSMean SE LSMean SE LSMean SE 1 598.86 ± 14.07 576.03 ± 14.07 587.44 ± 9.95 2 575.59 ± 14.07 557.94 ± 14.07 566.77 ± 9.95 3 579.04 ± 14.07 558.59 ± 14.07 568.81 ± 9.95 4 585.29 ± 14.07 580.65 ± 14.07 582.97 ± 9.95
Mean2 584.70 ± 7.03 568.30 ± 7.03 1 Mean of oats and sweet feed based on portion. 2 Mean of portions based on concentrate type. Table 6. Insulin AUC (µU·mL-1·h-1) for horses consuming a meal of oats or sweet feed offered in 1, 2, 3, or 4 equal portions. # Portions Oats Sweet Feed Mean1
LSMean SE LSMean SE LSMean SE 1 220.06 ± 27.69 165.12 ± 27.69 192.54 ± 19.58 2 195.92 ± 27.69 149.33 ± 27.69 172.62 ± 19.58 3 195.07 ± 27.69 176.75 ± 27.69 185.91 ± 19.58 4 227.03 ± 27.69 229.38 ± 27.69 228.20 ± 19.58
Mean2 209.52 ± 13.85 180.12 ± 13.85 1 Mean of oats and sweet feed based on portion. 2 Mean of portions based on concentrate type.

23
A period effect (P < 0.05) was found for peak glucose concentration and time to
peak glucose concentration. There was also a trend toward a period effect (P < 0.10) for
glucose AUC. No period effects were observed for any measures of insulin. The observed
period effect for glucose was not surprising given the study took place over the duration
of eight weeks. While environmental factors were controlled as best as possible, they
could have affected glucose responses by increasing cortisol levels as a result of stress
from daily activity around the barns or inclement weather.
A horse effect (P < 0.05) was found for peak glucose concentration and glucose
AUC. There was also a horse effect for peak insulin concentration and insulin AUC. The
observed horse effect was expected, as there is always individual variation among
subjects. However, it is interesting to note that there was no subject variation (P < 0.05)
for times to peak glucose or insulin.
One factor that may have affected the results of this study is cortisol. Research
has shown that cortisol displays a normal diurnal rhythm with concentrations highest in
early morning and lowest in the evening (Irvine and Alexander, 1994; Cartmill et al.,
2003; Gordon and McKeever, 2005, 2006; Storer et al., 2007). This study utilized
evening blood collections, and it would be expected to see declining cortisol
concentrations during this time of day. However, cortisol is known as the “stress
hormone” because its concentrations increase during stressful circumstances. Activity
around the barn or catheterization could have stressed the horses, causing an increase in
cortisol concentrations. Ralston (2002) indicated that the glycemic response to a meal is
dramatically influenced by circulating cortisol concentrations in horses. Because cortisol
indirectly leads to an increase in circulating blood glucose, this could have affected the

24
results. Perhaps utilizing morning blood draws would have somewhat countered this
effect. If cortisol concentrations are already peaking, stress may not influence blood
glucose concentrations as much. It might have also been beneficial to insert catheters the
night prior to a morning feeding and blood collection. This would not only allow horses
to adapt to their stalled environment, but also allow their stress from catheterization to
decrease overnight.
It has been suggested that time of day is a factor when evaluating glycemic and
insulinemic responses (Williamson et al., 2008). Ralston (2002) indicated that horses had
lower (P < 0.005) insulin responses in the afternoon than in the morning, even though
glucose concentrations did not differ. Follow-up studies found that the length of fast and
plasma cortisol concentrations were more highly correlated with the associated glucose
and insulin responses to a meal of grain than the actual time of day. It has also been
suggested that horses are much more stressed during a daytime fast verses a nighttime
fast. An attempt should be made to avoid any stimuli that could arouse behavioral or
physiological effects that could cause a defensive endocrine response (Gordon and
McKeever, 2006).

25
CONCLUSIONS
The hypothesis that time to consume a concentrate meal would alter the glycemic
response to that meal was not validated in the present study. Neither the number of
portions fed, or concentrate type had any significant effects on peak glucose
concentration (mg·dL-1), time to peak glucose concentration (h), or glucose AUC (mg·dL-
1·h-1). There were also no significant differences for peak insulin concentration (µU·mL-1)
or insulin AUC (µU·mL-1·h-1) based on portions fed or type of concentrate. However,
there was a significant difference (P < 0.05) for time to peak insulin (h) between
concentrate type, with oats having a longer time to peak that sweet feed.
These results indicate that extending concentrate intake up to 1 h was not
sufficient to alter measures of glycemic response in the present study. It is possible that
the amount of concentrate fed per meal was not sufficient to overload the capacity of the
equine small intestine for starch digestion and absorption. Perhaps by increasing the
amount of concentrate fed per meal or extending the amount of time allowed to consume
a given meal, the glycemic response would be alterable.
Low-glycemic diets based on the glycemic index (GI) have been recommended
for the avoidance and management of a variety of diseases in humans that involve insulin
resistance, such as diabetes mellitus type II and coronary heart disease. Further research
is needed to examine the GI of feedstuffs commonly fed to horses. This will aid in the
26
control of a marked postprandial hyperglycemia and hyperinsulinemia, which can be
devastating to horses with certain chronic metabolic problems associated with insulin
resistance, as well as digestive disturbances related to rapid fermentation of starch in the
hindgut.

27
LITERATURE CITED
Argenzio, R.A. and H.F. Hintz. 1970. Glucose tolerance and effect of volatile fatty acid
on plasma glucose concentration in ponies. J. Anim. Sci. 30: 514-518.
Argenzio, R.A. and H.F. Hintz. 1971. Volatile fatty acid tolerance and effect of glucose
and VFA on plasma insulin levels in ponies. J. Nutr. 101: 723-730.
Association of Official Analytical Chemists. 1995. Official Methods of Analysis, 16th ed.
Association of Official Analytical Chemists, Washington, D.C.
Bessesen, D.H. 2001. The role of carbohydrates in insulin resistance. J. Nutr. 131: 2782S-
2786S.
Cartmill, J.A., D.L. Thompson Jr., W.A. Storer, L.R. Gentry, and N.K. Huff. 2003.
Endocrine responses in mares and geldings with high body condition scores
grouped by high vs. low resting leptin concentrations. J. Anim. Sci. 81: 2311-
2321.
De Fombelle, L. Veiga, C. Drogoul, and V. Julliand. 2004. Effect of diet composition and
feeding pattern on the prececal digestibility of starches from diverse botanical
origins measured with the mobile nylon bag technique in horses. J. Anim. Sci. 82:
3625-3634.

28
Dyer, J., E. Jernandez-Castano Merediz, K.S.H. Salmon, C.J. Proudman, G.B. Edwards,
and S.P. Shirazi-Beechey. 2002. Molecular characterization of carbohydrate
digestion and absorption in equine small intestine. Equine Vet. J. 34(4): 349-358.
Evans, J.W. 1971. Effect of fasting, gestation, lactation and exercise on glucose turnover
in horses. J. Anim. Sci. 33: 1001-1004.
FAO/WHO (Food and Agriculture Organization/World Health Organization). 1998.
Carbohydrates in human nutrition (FAO Food and Nutrition Paper 66). Available
at http://www.fao.org/docrep/W8079E/w8079e00.htm. Accessed September 15,
2008.
Frape, David. 2004. Equine Nutrition and Feeding. 3rd ed. Blackwell Pub. Ltd., Oxford,
UK.
Frost, G., B. Keogh, D. Smith, K. Akinsanya, and A. Leeds. 1996. The effect of low-
glycemic carbohydrates on insulin and glucose response in vivo and in vitro in
patients with coronary heart disease. Metabolism. 45: 669-672.
Glinsky, M.J., R.M. Smith, H.R. Spires, and C.L. Davis. 1976. Measurement of colatile
fatty acid production rates in the cecum of the pony. J. Anim. Sci. 42: 1465-1470.
Gordon, M.E. and K.H. McKeever. 2005. Diurnal variation of ghrelin, leptin, and
adiponectin in Standardbred mares. J. Anim. Sci. 83: 2365-2371.
Gordon, M.E. and K.H. McKeever. 2006. Oral and intravenous carbohydrate challenges
decrease active ghrelin concentrations and alter hormones related to control of
energy metabolism in horses. J. Anim. Sci. 84: 1682-1690.

29
Healy, H.P., P.D. Siciliano, and L.M. Lawrence. 1995. Effect of concentrate form on
blood and gastric fluid variables in ponies. Page 256 in Proc. 14th Equine Nutr.
Physiol. Symp., Ontario, Canada.
Hintz, H.F. and N.F. Cymbaluk. 1994. Nutrition of the horse. Ann. Rev. Nutr. 14: 243-
267.
Hoffman, R.M., R.C. Boston, D. Stefanovski, D.S. Kronfeld, and P.A. Harris. 2003a.
Obesity and diet affect glucose dynamics and insulin sensitivity in Thoroughbred
geldings. J. Anim. Sci. 81: 2333-2342.
Hoffman, R.M., D.S. Kronfeld, W.L. Cooper, and P.A. Harris. 2003b. Glucose clearance
in grazing mares is affected by diet, pregnancy, and lactation. J. Anim. Sci. 81:
1764-1771.
Hudson, J.M., N.D. Cohen, P.G. Gibbs, and J.A. Thompson. 2001. Feeding practices
associated with colic in horses. J. Amer. Vet. Med. Assoc. 219: 1419-1425.
Irvine, C.H. and S.L. Alexander. 1994. Factors affecting the circadian rhythm in plasma
cortisol concentrations in the horse. Domest. Anim. Endocrinol. 11: 227-238.
Jacobs, K.A. and J.R. Bolton. 1992. Effect of diet on the oral glucose tolerance test in the
horse. J. Am. Vet. Med. Assoc. 180: 884-886.
Jeffcott, L.B., J.R. Field, J.G. McLean, and K. O’Dea. 1986. Glucose tolerance and
insulin sensitivity in ponies and Standardbred horses. Equine Vet. J. 18: 97-101.
Jose-Cunilleras, E., L.E. Taylor, and K.W. Hinchcliff. 2004. Glycemic index of corn, oat
groats and rolled barley in horses. J. Anim. Sci. 82: 2623-2629.
Kahn, C.R. 1978. Insulin resistance, insulin insensitivity, and insulin unresponsiveness: a
necessary distinction. Metabolism. 27: 1893-1902.

30
Kienzle, E. 1994. Small intestinal digestibility of starch in the horse. Revue Med. Vet.
145: 199-204.
Kronfeld, D.S., K.H. Treiber, T.M. Hess, and R.C. Boston. 2005. Insulin resistance in the
horse: Definition, detection, and dietetics. J. Anim. Sci. 83: 22-31.
Laut, J.E., K.A. Houpt, H.F. Hintz, and T.R. Houpt. 1984. The effects of caloric dilution
on meal patterns and food intake of ponies. Physiol. & Behavior. 35: 549-554.
Lee, A., M. Ader, G.A. Bray, and R.N. Bergman. 1992. Diurnal variation in glucose
tolerance: cyclic suppression of insulin action and insulin secretion in normal-
weight, but not obese, subjects. Diabetes. 41: 750-759.
Massey, K.J., G.D. Potter, G.T. Schelling, and W.L. Jenkins. 1985. Prececal, postileal
and total tract starch digestion in ponies fed at varying intervals. Page 42 in Proc.
9th Equine Nutr. Physiol. Symp., East Lansing, MI.
McNiven, M.A. 1984. The effect of body fatness of energetic efficiency and fasting heat
production in adult sheep. Br. J. Nutr. 51: 297-304.
Meyer, H., S. Radicke, E. Kienzle, S. Wilke, and D. Kleffken. 1993. Investigations on
preileal digestibility of oats, corn and barley starch in relation to grain processing.
Page 92 in Proc. 13th Equine Nutr. Physiol. Symp., Gainesville, FL.
NRC. 2007. National Research Council. 6th ed. Natl. Acad. Press, Washington, DC.
Pagan, J.D., P.A. Harris, M.A.P. Kennedy, N. Davidson, and K.E. Hoekstra. 1999. Feed
type and intake affects glycemic response in thoroughbred horses. Page 149 in
Proc. 16th Equine Nutr. Physiol. Symp., Raleigh, NC.

31
Pass, M.A., S. Pollitt, and C.C. Pollitt. 1998. Decreased glucose metabolism causes
separation of hoof lamellae in vitro: A trigger for laminitis? Equine Vet. J. 26:
133-138.
Potter, G.D., F.F. Arnold, D.D. Househoulder, D.H. Hansen, and K.M. Brown. 1992.
Digestion of starch in the small or large intestine of the equine. Page 107 in Proc.
1st Eur. Conf. Horse Nutr., Dijon, France.
Powell, D.M., L.M. Lawrence, B.P. Fitzgerald, K. Danielson, A. Parker, P. Siciliano, and
A. Crum. 2000. Effect of short-term feed restriction and calorie source on
hormonal and metabolic responses in geldings receiving a small meal. J. Anim.
Sci. 78: 3107-3113.
Radicke, S., E. Kienzle, and H. Meyer. 1991. Preilieal apparent digestibility of oats and
corn starch and consequences for cecal metabolism. Page 43 in Proc. 12th Equine
Nutr. Physiol. Symp. Versailles, KY.
Ralston, S.L. 1992. Effect of soluble carbohydrate content of pelleted diets on
postprandial glucose and insulin profiles in horses. Pferkeheilkunde. 8: 112-115.
Ralston, S.L. 1996. Hyperglycemia/hyperinsulinemia after feeding a meal of grain to
young horses with osteochondritis dissecans (OCD) lesions. Pferkeheilkunde. 12:
320-322.
Ralston, S.L. 2002. Insulin and glucose regulation. Vet. Clin. Equine. 18: 295-304.
Steelman, S.M., E.M. Michael-Eller, P.G. Gibbs, and G.D. Potter. 2006. Meal size and
feeding frequency influence serum leptin concentration in yearling horses. J.
Anim. Sci. 84: 2391-2398.

32
Sticker, L.S., D.L. Thompson, Jr., L.D. Bunting, J.M. Fernandez, and C.L. DePew. 1995.
Dietary protein and(or) energy restriction in mares: Plasma glucose, insulin,
nonesterified fatty acid, and urea nitrogen responses to feeding, glucose, and
epinephrine. J. Anim. Sci. 73:136-144.
Storer, W.A., D.L. Thompson Jr., C.A. Walker, and J.A. Cartmill. 2007. Hormonal
patterns in normal and hyperleptinemic mares in response to three common
feeding-housing regimens. J. Anim. Sci. 85: 2873-2881.
Storlien, L.H., J.A. Higgins, T.C. Thomas, M.A. Brown, H.Q. Wang, X.F. Huang, and
P.L. Else. 2000. Diet composition and insulin action in animal models. Br. J.
Nutr. 83: S85-S90.
Stull, C.L. and A.V. Rodiek. 1988. Responses of blood glucose, insulin and cortisol
concentrations to common equine diets. J. Nutr. 118: 206-213.
Treiber, K.H., R.C. Boston, D.S. Kronfeld, W.B. Staniar, and P.A. Harris. 2005. Insulin
resistance and compensation in Thoroughbred weanlings adapted to high-
glycemic meals. J. Anim. Sci. 83: 2357-2364.
Valentine, B.A., R.J. Van Saun, K.N. Thompson, and H.F. Hintz. 2001. Role of dietary
carbohydrate and fat in horses with equine polysaccharide storage myopathy. J.
Amer. Vet. Med. Assoc. 219: 1537-1544.
Van Soest, P.J., J.B. Robertson, and B.A. Lewis. 1991. Methods for dietary fiber, neutral
detergend fiber, and nonstarch polysaccharides in relation to animal nutrition. J.
Dairy Sci. 74: 3583-3597.
Vermorel, M., W. Martin-Rosset, and J. Vernet. 1997. Energy utilization of twelve forage
or mixed diets for maintenance by sport horses. Livest. Prod. Sci. 47: 157-167.

33
Waghorn, G.C., D.S. Flux, and M.J. Ulyatt. 1987. Effects of dietary protein and energy
intakes on growth hormone, glucose tolerance and fatty acid synthesis in young
wether sheep. Anim. Prod. 44: 143-152.
Williams, C.A., D.S. Kronfeld, W.B. Staniar, and P.A. Harris. 2001. Plasma glucose and
insulin responses of thoroughbred mares fed a meal high in starch and sugar or fat
and fiber. J. Anim. Sci. 79: 2196-2201.
Williamson, L.M., W.B. Staniar, and R.J. Geor. 2008. Glycemic and insulinemic
responses differ in the morning verses the afternoon. J. Anim. Sci. 86: E-Suppl. 2
Wolever, T.M.S. and C. Mehling. 2002. High-carbohydrate-low-glycemic index dietary
advice improves glucose disposition index in subjects with impaired glucose
tolerance. Br. J. Nutr. 87: 477-487.
Wolever, T.M.S., D.J.A. Jenkins, A.L. Jenkins, and R.G. Josse. 1991. The glycemic
index: methodology and clinical implications. Amer. J. Clin. Nutr. 54: 846-854.

34
APPENDICES

35
APPENDIX 1
Feeding rotations throughout the duration of the study.
Week Oats Textured Sweet Feed
1× 2× 3× 4× 1× 2× 3× 4×
1 Rose Flaxen Cricket Roan* Ellie Casper Moon Blue
2 Blue Rose Flaxen Cricket Roan Ellie Casper Moon
3 Moon Blue Rose Flaxen Cricket Roan Ellie Casper
4 Casper Moon Blue Rose Flaxen Cricket Roan Ellie
5 Ellie Casper Moon Blue Rose Flaxen Cricket Roan
6 Roan Ellie Casper Moon Blue Rose Flaxen Cricket
7 Cricket Roan Ellie Casper Moon Blue Rose Flaxen
8 Flaxen Cricket Roan Ellie Casper Moon Blue Rose
9 Roan*
*This horse did not consume the treatment diet during week 1, so this horse × diet was repeated on week 9.

36
APPENDIX 2
Ingredient composition of Nutrena® Triumph® textured sweet feed.
Ingredient
Whole oats*
Wheat midds*
Winterlass (molasses)
Corn chops
Corn germ
Crimped oats
Peanut hulls
CaCO3
Salt
Cottonseed meal
Calcium propionate
Trace mineral premix
Vitamin A
*Together, whole oats and wheat midds comprise over half of the total feed composition.
37
APPENDIX 3
Laboratory analyses for oats and sweet feed.
Feed
As-fed intake (kg)
DM (%)
ADF (% DM)
DE/kg (% DM)
DE (Mcal/kg)
Oats 1.37 89.79 13.67 3.32 4.1* Sweet feed 1.36 87.67 5.38 3.77 4.5*
*P < 0.05