Embed Size (px)
Citation preview
Diploma Thesis
Glycemic control with GlucoTab using insulin degludec
in non-critically ill patients with type 2 diabetes at the
general ward
submitted by
Lirie Bytyqi
to obtain the academic degree of
Doctor of Medicine (Drin. med. univ.)
at the
Medical University of Graz
conducted at the
Department of Internal Medicine -
Division of Endocrinology and Diabetology
under guidance of
Assoc. Prof.in Priv.-Doz.in Dr.in med. univ. Julia Mader
Priv.-Doz. Dr. med. univ. Dr. scient. med. Felix Aberer
Graz, 14th of July 2021
i
Statutory Declaration
I hereby declare that I have authored this diploma thesis fully on my own, that I
have not used any other than the declared sources, and that I have explicitly
marked all material which has been quoted either literally or by content from the
used sources.
Graz, 14th of July 2021 Lirie Bytyqi eh

ii
Acknowledgements
During the writing process of this thesis, I have received much help and support
from many sides, for which I am incredibly thankful.
Firstly, I would like to thank my supervisors Assoc. Prof.in Priv.-Doz.in Dr.in med.
univ. Julia Mader, who always responds in record time and was incredibly helpful
in creating this thesis, and Priv.-Doz. Dr. med. univ. Dr. scient. med. Felix Aberer
for his guidance and help. Thank you both for your hard work.
Thank you to the team of the Division of Endocrinology and Diabetology for their
outstanding work, too.
Huge thanks go out to my loved ones, the handful of special people in my life that
make it worth living:
I don’t know where I would be today without my best friend Rike, who always
seems to have the right words in every situation and never fails to make me laugh.
You are golden. Thank you for everything you have done for me.
My friends Michelle and Melisa deserve a big thank you for always being there if I
need someone to talk to. I can’t imagine what I would do without you.
Special thanks go out to my brother Kujtim, who in his infinite wisdom somehow
always knows the answer to my questions. I’m so glad to have you as my little
brother, no matter how annoying you sometimes are, but that is your job after all.
And last, but definitely not least, I would like to thank my parents for always
supporting me in every way that they could, so I was able to focus on achieving
my dreams, no matter how big.
You all make me a better, happier person and I love you.
iii
Table of Content
Acknowledgements ................................................................................................. ii Table of Content ..................................................................................................... iii Glossary and Abbreviations..................................................................................... v Table of Figures ................................................................................................... viii List of Tables .......................................................................................................... ix Zusammenfassung .................................................................................................. x Abstract ................................................................................................................. xii 1 Introduction ..................................................................................................... 1 2 Diabetes mellitus type 2 .................................................................................. 2
2.1 Epidemiology ............................................................................................. 2 2.2 Etiology and Pathophysiology ................................................................... 3 2.3 Clinical Manifestation ................................................................................ 4 2.4 Complications ............................................................................................ 5
2.4.1 Acute complications ............................................................................ 5 2.4.2 Chronic complications ......................................................................... 6
2.5 Diagnostic work ups .................................................................................. 9 2.5.1 Blood glucose management ............................................................. 10 2.5.2 HbA1c ................................................................................................ 10 2.5.3 Oral Glucose Tolerance Test ............................................................ 11 2.5.4 Other Tests ....................................................................................... 12
2.6 Treatment ................................................................................................ 12 2.6.1 Lifestyle Adjustment and patient education ...................................... 13 2.6.2 Pharmacological Treatment .............................................................. 13 2.6.3 Complications of insulin treatment .................................................... 19
2.7 Inpatient diabetes management .............................................................. 21 3 Clinical Study ................................................................................................ 23
3.1 Material ................................................................................................... 23 3.1.1 Product of investigation GlucoTab® ................................................. 23 3.1.2 Insulin degludec (Tresiba®) .............................................................. 24 3.1.3 Insulin aspart (NovoRapid®) ............................................................. 25 3.1.4 Non-investigational medical devices ................................................. 26
3.2 Methods .................................................................................................. 26 3.2.1 Use of GlucoTab® with insulin degludec .......................................... 26
3.3 Study Objectives and Endpoints ............................................................. 27 3.3.1 Primary Objective ............................................................................. 27 3.3.2 Secondary Objective ......................................................................... 27 3.3.3 Primary Endpoint .............................................................................. 27 3.3.4 Secondary Endpoints ........................................................................ 28
3.4 Study Population ..................................................................................... 29 3.4.1 Inclusion criteria ................................................................................ 29 3.4.2 Exclusion criteria ............................................................................... 30
3.5 Study Design ........................................................................................... 30 3.6 Study Procedures .................................................................................... 31
3.6.1 Screening ......................................................................................... 31 3.6.2 Treatment Period .............................................................................. 31 3.6.3 Withdrawal of individual patients ....................................................... 33
3.7 Assessments ........................................................................................... 34 3.7.1 Blood glucose measurements........................................................... 34 3.7.2 Insulin dose ...................................................................................... 34
iv
3.7.3 Vital Signs ......................................................................................... 34 3.7.4 Laboratory Screening and Safety Parameters .................................. 35 3.7.5 Concomitant medication ................................................................... 35 3.7.6 Source Documents ........................................................................... 35
4 Safety Reporting ........................................................................................... 36 4.1 Adverse events / Adverse device effects ................................................. 36 4.2 Serious adverse events / Serious adverse device effects ....................... 36 4.3 Data Management ................................................................................... 37
4.3.1 Data Collection ................................................................................. 37 4.3.2 Source documentation ...................................................................... 38
4.4 Quality Control and Quality Assurance .................................................... 38 4.4.1 Personnel training ............................................................................. 38 4.4.2 Recruitment and consent .................................................................. 38 4.4.3 Insurance .......................................................................................... 39
5 Statistical Analysis ........................................................................................ 39 5.1 Analysis principles ................................................................................... 39 5.2 Study Hypothesis .................................................................................... 39 5.3 Statistical Methods .................................................................................. 40 5.4 Sample size calculations ......................................................................... 41
6 Results .......................................................................................................... 42 6.1 General Information ................................................................................. 42
6.1.1 Timeline ............................................................................................ 42 6.1.2 Study participants ............................................................................. 42 6.1.3 Demographic data ............................................................................ 43 6.1.4 Deviation from Clinical Investigation Plan ......................................... 45
6.2 Summary of adverse events .................................................................... 45 6.2.1 Summary of serious adverse (device) events ................................... 48 6.2.2 Summary of system malfunctions and anomalies ............................. 48
6.3 Efficacy .................................................................................................... 48 6.3.1 Primary Endpoint .............................................................................. 48 6.3.2 Secondary Endpoint ......................................................................... 48
6.4 Safety ...................................................................................................... 54 6.4.1 Hypoglycemic episodes .................................................................... 54 6.4.2 Blood glucose measurements overall ............................................... 54 6.4.3 Insulin therapy .................................................................................. 54
6.5 Usability ................................................................................................... 56 6.5.1 Adherence to the GlucoTab® suggestions ....................................... 56 6.5.2 Corrections of doses ......................................................................... 56
7 Conclusion .................................................................................................... 58 7.1 Potential positive effects of the GlucoTab® system ................................ 58
7.1.1 Improved glycemic control with reduced risk for hypoglycemia ........ 58 7.2 Potential risks of the GlucoTab® system ................................................. 59
7.2.1 Hypoglycemic events ........................................................................ 59 7.2.2 Hyperglycemic events ....................................................................... 59 7.2.3 Adherence to GlucoTab® suggestions ............................................. 60
8 Bibliography .................................................................................................. 62
v
Glossary and Abbreviations
% Percent
© Copyright
® Registered trademark
°C Degrees Celsius
ACE Angiotensin Converting Enzyme
ADA American Diabetes Association
ADE Adverse Device Effect
AE Adverse Event
BG Blood Glucose
BMI Body Mass Index
CE Conformité Européenne (Certification that a product
meets all legal requirements to be sold in the European
Economic Area)
CGM Continuous Glucose Monitoring
CRF Case Report Form
CT Computed Tomography (scan)
DMP Data Management Plan
vi
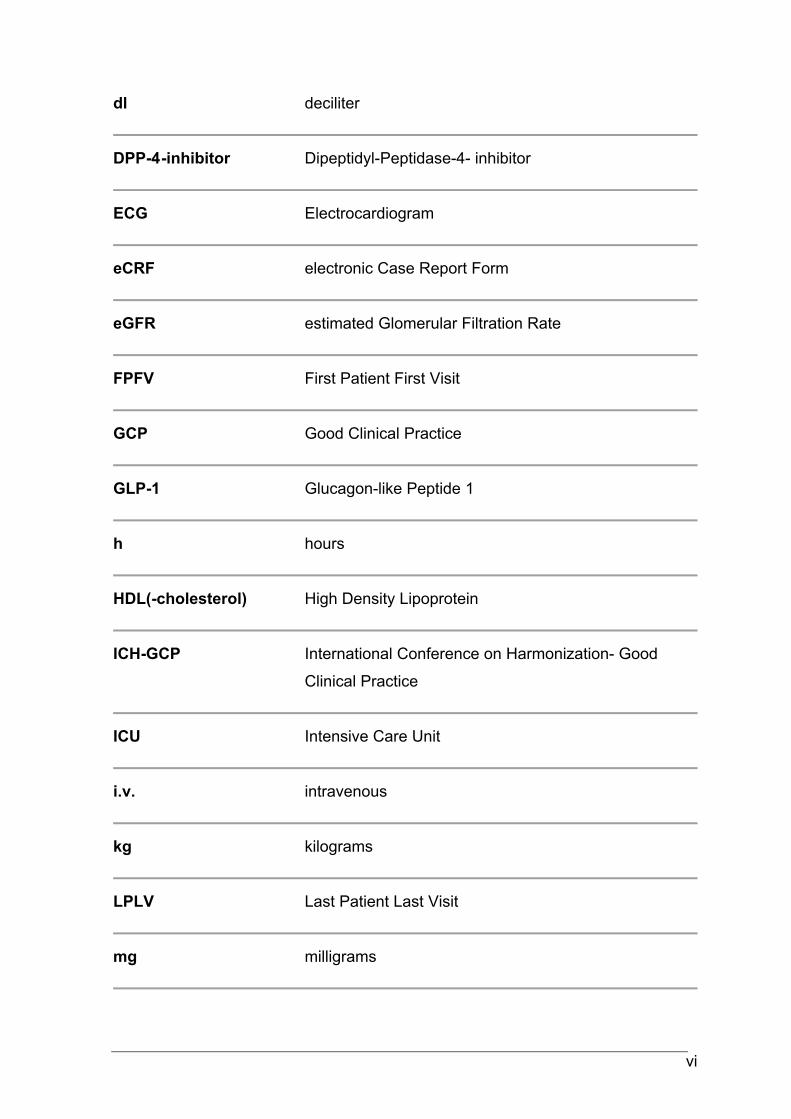
dl deciliter
DPP-4 -inhibitor Dipeptidyl-Peptidase-4- inhibitor
ECG Electrocardiogram
eCRF electronic Case Report Form
eGFR estimated Glomerular Filtration Rate
FPFV First Patient First Visit
GCP Good Clinical Practice
GLP-1 Glucagon-like Peptide 1
h hours
HDL(-cholesterol) High Density Lipoprotein
ICH-GCP International Conference on Harmonization- Good
Clinical Practice
ICU Intensive Care Unit
i.v. intravenous
kg kilograms
LPLV Last Patient Last Visit
mg milligrams
vii
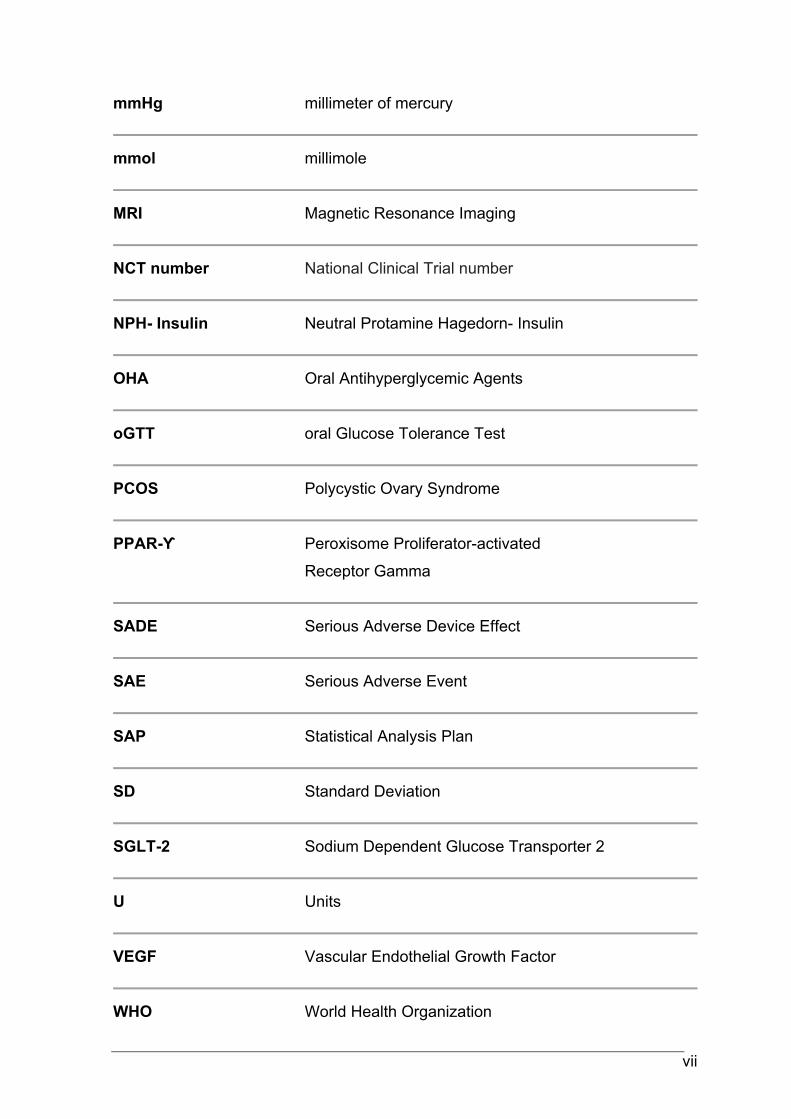
mmHg millimeter of mercury
mmol millimole
MRI Magnetic Resonance Imaging
NCT number National Clinical Trial number
NPH- Insulin Neutral Protamine Hagedorn- Insulin
OHA Oral Antihyperglycemic Agents
oGTT oral Glucose Tolerance Test
PCOS Polycystic Ovary Syndrome
PPAR-ϒ Peroxisome Proliferator-activated
Receptor Gamma
SADE Serious Adverse Device Effect
SAE Serious Adverse Event
SAP Statistical Analysis Plan
SD Standard Deviation
SGLT-2 Sodium Dependent Glucose Transporter 2
U Units
VEGF Vascular Endothelial Growth Factor
WHO World Health Organization
viii
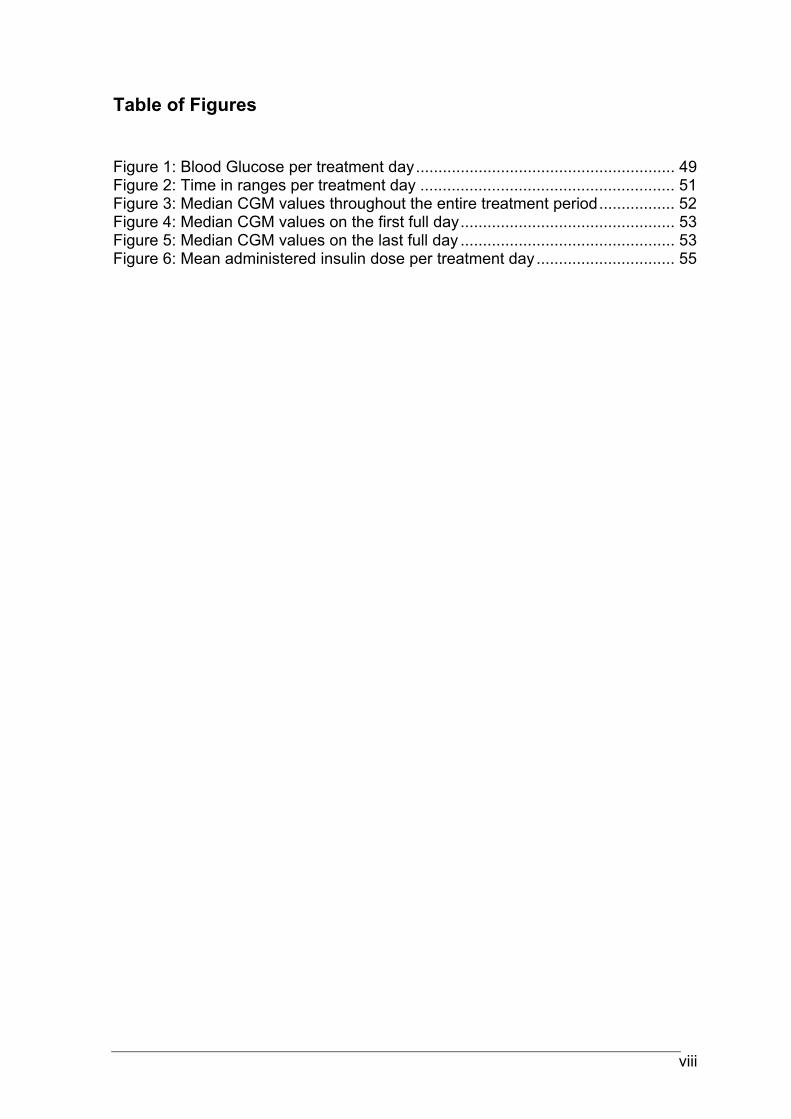
Table of Figures
Figure 1: Blood Glucose per treatment day .......................................................... 49 Figure 2: Time in ranges per treatment day ......................................................... 51 Figure 3: Median CGM values throughout the entire treatment period ................. 52 Figure 4: Median CGM values on the first full day ................................................ 53 Figure 5: Median CGM values on the last full day ................................................ 53 Figure 6: Mean administered insulin dose per treatment day ............................... 55
ix
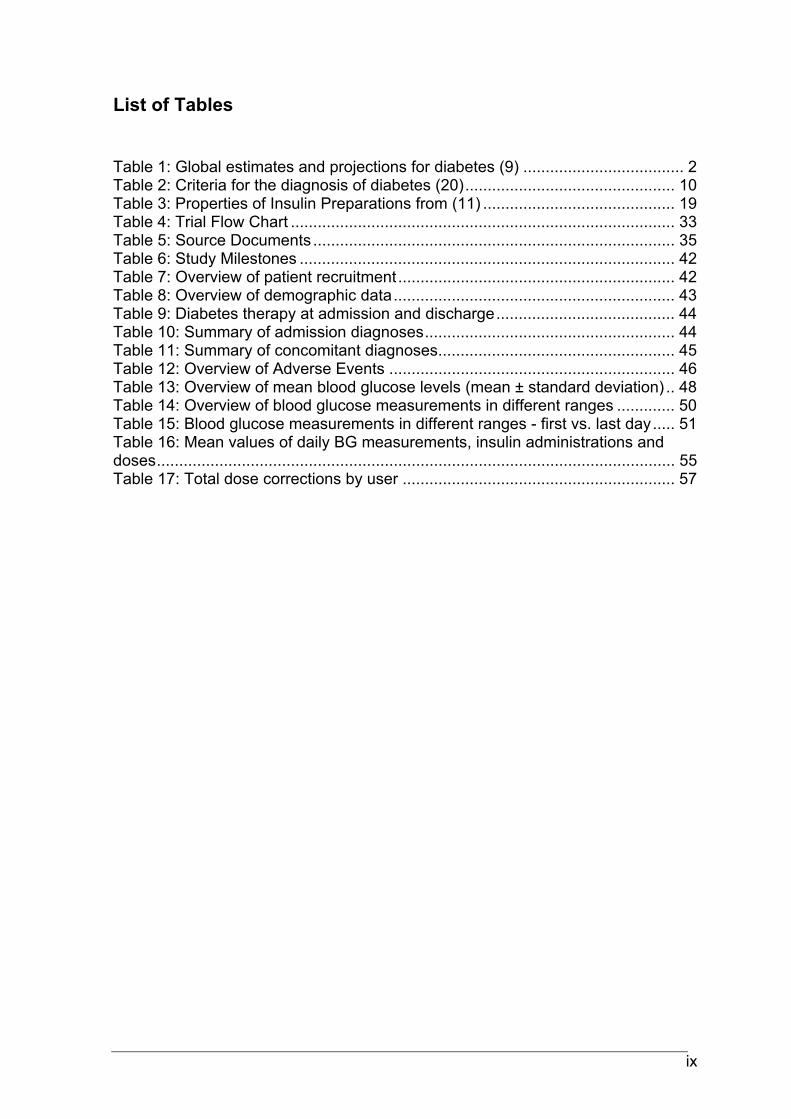
List of Tables
Table 1: Global estimates and projections for diabetes (9) .................................... 2 Table 2: Criteria for the diagnosis of diabetes (20) ............................................... 10 Table 3: Properties of Insulin Preparations from (11) ........................................... 19 Table 4: Trial Flow Chart ...................................................................................... 33 Table 5: Source Documents ................................................................................. 35 Table 6: Study Milestones .................................................................................... 42 Table 7: Overview of patient recruitment .............................................................. 42 Table 8: Overview of demographic data ............................................................... 43 Table 9: Diabetes therapy at admission and discharge ........................................ 44 Table 10: Summary of admission diagnoses ........................................................ 44 Table 11: Summary of concomitant diagnoses ..................................................... 45 Table 12: Overview of Adverse Events ................................................................ 46 Table 13: Overview of mean blood glucose levels (mean ± standard deviation) .. 48 Table 14: Overview of blood glucose measurements in different ranges ............. 50 Table 15: Blood glucose measurements in different ranges - first vs. last day ..... 51 Table 16: Mean values of daily BG measurements, insulin administrations and doses .................................................................................................................... 55 Table 17: Total dose corrections by user ............................................................. 57
x
Zusammenfassung
Einleitung: Eine gute Blutzuckereinstellung ist eng mit klinischen Outcomes bei
Patienten mit Diabetes verknüpft. Mithilfe eines Systems zur
Entscheidungsunterstützung (GlucoTab®) wurde in früheren Studien die
Blutzuckereinstellung erleichtert. In dieser Studie wurde die Diabeteseinstellung
unter Nutzung des GlucoTab®- Systems mit einem neuen Basalinsulinanalogon
untersucht. (1–3)
Zielsetzung: Das Ziel dieser klinischen Studie war die Wirksamkeit, Sicherheit
und Benutzerfreundlichkeit des GlucoTab®- Systems in Kombination mit dem
ultra-langwirksamen Basalinsulin degludec und dem kurzwirksamen Insulin aspart
bei stationären Patient*innen mit Diabetes mellitus Typ 2 zu untersuchen.
Methoden: GlucoTab® wurde für die Behandlung von 30 stationären nicht-
intensivpflichtigen Patient*innen mit bekanntem Diabetes mellitus Typ 2 oder neu
aufgetretener Hyperglykämie auf der Bettenstation der klinischen Abteilung für
Endokrinologie und Diabetologie der Medizinischen Universität Graz eingesetzt.
Das GlucoTab®- System wurde mit Insulin degludec (Tresiba®, ein ultra-
langwirksames Basalinsulin) und Insulin aspart (NovoRapid®, ein kurzwirksames
Bolusinsulin) betrieben. Blutzuckermessungen wurden mittels „Point of Care
Testing“ vor Mahlzeiten und zur Schlafenszeit durchgeführt. Zudem wurde
verblindetes kontinuierliches subkutanes Glukose-Monitoring (CGM) mithilfe des
Abbott FreeStyle Libre Pro Flash Glucose Monitoring System angewandt.
Ergebnisse: 52,2 ± 10,2% (n=377) aller gemessenen Blutzuckerwerte (insgesamt
722) lagen im Zielbereich von 70 – 140 mg/dl. Die Rate an Hypoglykämien war
gering, mit 1,25% der Messungen <70 mg/dl und 0,28% <54 mg/dl. Es kam zu
keiner schweren Hypoglykämie. Die durch den Algorithmus vorgeschlagenen
Insulindosen wurden in 93,6% der Fälle ab dem ersten Studientag eingehalten.
Die Rate an Korrekturen durch die Benutzer*innen war ebenfalls gering, mit einer
durchschnittlichen Korrektur von -0,8 ±1,7 Einheiten für Bolusinsulin und 0,0 ± 0,2
Einheiten für Basalinsulin.
xi
Schlussfolgerung: Die Therapieunterstützung mithilfe des GlucoTab®- Systems
mit Insulin degludec im Krankenhaus konnte sicher und effektiv erreicht werden.
xii
Abstract
Introduction: Glycemic control is tightly linked to clinical outcomes in patients with
diabetes. Using a clinical decision support system (GlucoTab®) improved glycemic
control in previous studies, therefore we studied the effects of using
GlucoTab® with a novel basal insulin analogue. (1–3)
Objective: The aim of this clinical trial was to investigate and analyze the clinical
efficacy, safety, and usability of GlucoTab® for glycemic control, specifically in
combination with the ultralong-acting basal insulin degludec and the rapid-acting
insulin aspart in hospitalized patients with diabetes mellitus type 2.
Methods: GlucoTab® was used for diabetes management on 30 non-critically ill
hospitalized patients at the Division of Endocrinology and Diabetology at the
Department of Internal Medicine in Graz to investigate the efficacy of the system
when used with insulin degludec. GlucoTab® uses an algorithm to support the
management of patients with diabetes using insulin degludec (Tresiba®,
an ultralong-acting basal insulin analogue) and insulin aspart (NovoRapid®,
a rapid-acting insulin analogue). Blood glucose checks were performed pre-meal
and at bedtime, as well as blinded continuous subcutaneous glucose monitoring
(using the Abbott FreeStyle Libre Pro Flash Glucose Monitoring System) to better
understand glycemic excursions over time.
Results: The blood glucose target range of 70 – 140 mg/dl was achieved with
52.2 ± 10.2% (n=377) of blood glucose measurements falling into that range from
a total of 722 measurements. The rate of hypoglycemia was low, with only 1.25%
of blood glucose measurements at <70 mg/dl, 0.28% <54 mg/dl and no severe
hypoglycemic event. The adherence to the GlucoTab® suggestions was high
(93.6% adherence since study start) and the number of dose corrections was low,
with -0.8 ±1.7 U for bolus insulin and 0.0 ± 0.2 U for basal insulin.
Conclusion: Treatment support using the GlucoTab® system with Insulin
Degludec in a hospital setting is safe and effective.
1
1 Introduction
Diabetes mellitus, or commonly known as diabetes, is a group of metabolic
diseases that plays an increasingly important role in our current society. Most
people have either heard of diabetes, know someone who suffers from it, or are
even affected by the disease or its complications themselves. In Europe alone,
there are around 60 million people affected by it, a number that makes up around
7% of the overall European population. (4)
As with a lot of other diseases, diabetes, even more so type 2 diabetes
specifically, is highly linked to lifestyle factors and genetics. For patients with
diabetes, the goal is to keep the blood glucose levels under control, as high blood
glucose leads to an array of potential problems, specifically damaging the large
and small blood vessels and nerves. This can lead to diabetic retinopathy,
nephropathy, neuropathy, and many other complications further down the line. (5)
Careful management of patients with diabetes or hyperglycemia in the hospital is
essential, seeing as these are risk factors for both mortality and adverse events
during their hospital stay. Blood glucose management is not an easy task for the
medical staff. Decision support systems that work via specific algorithms that
provide suggestions for insulin dosing have started to gain traction, potentially
aiding in overcoming insufficient in-hospital diabetes management. (6,7)
The goal of this study is to evaluate the efficacy of an already existing decision
support system (GlucoTab®) with a new type of ultra-long-acting insulin (insulin
degludec, Tresiba®). For this, a collective of 30 patients, both male and female,
with type 2 diabetes or new-onset hyperglycemia that requires subcutaneous
insulin therapy, regardless of the diagnosis that led to their hospital admission,
have been included in this study.
But what exactly is diabetes and what factors contribute to this disease?
2
2 Diabetes mellitus type 2
As opposed to the lack of endogenous insulin secretion in diabetes mellitus type 1,
type 2 diabetes is marked by a relative absence of the blood glucose-lowering
hormone insulin, which usually happens as a combination of insulin resistance in
the receptors in the body and an impaired secretion of insulin in the β-cells of the
pancreas.
While the beta cells of the pancreas still produce insulin, the body is unable to
respond adequately to it. Over time, the high demand for insulin can result in
failure of secretion in the pancreas. Diabetes mellitus type 2 was more commonly
found in older adults, giving it the name “adult-onset diabetes”. Nowadays, there is
a rising number of affected children and younger adults, since the disease is linked
with genetical factors, obesity, as well as an unbalanced diet and lack of
movement. (5,8,9)
2.1 Epidemiology
As of 2019, the global number of people afflicted with both type 1 and type 2
diabetes was estimated to be around 463 million in people aged 20-79 years. This
equals about 9.3% of all adults worldwide, most of which live in low- to middle-
income countries. It is estimated that this number will further continue to rise over
the years. (9)
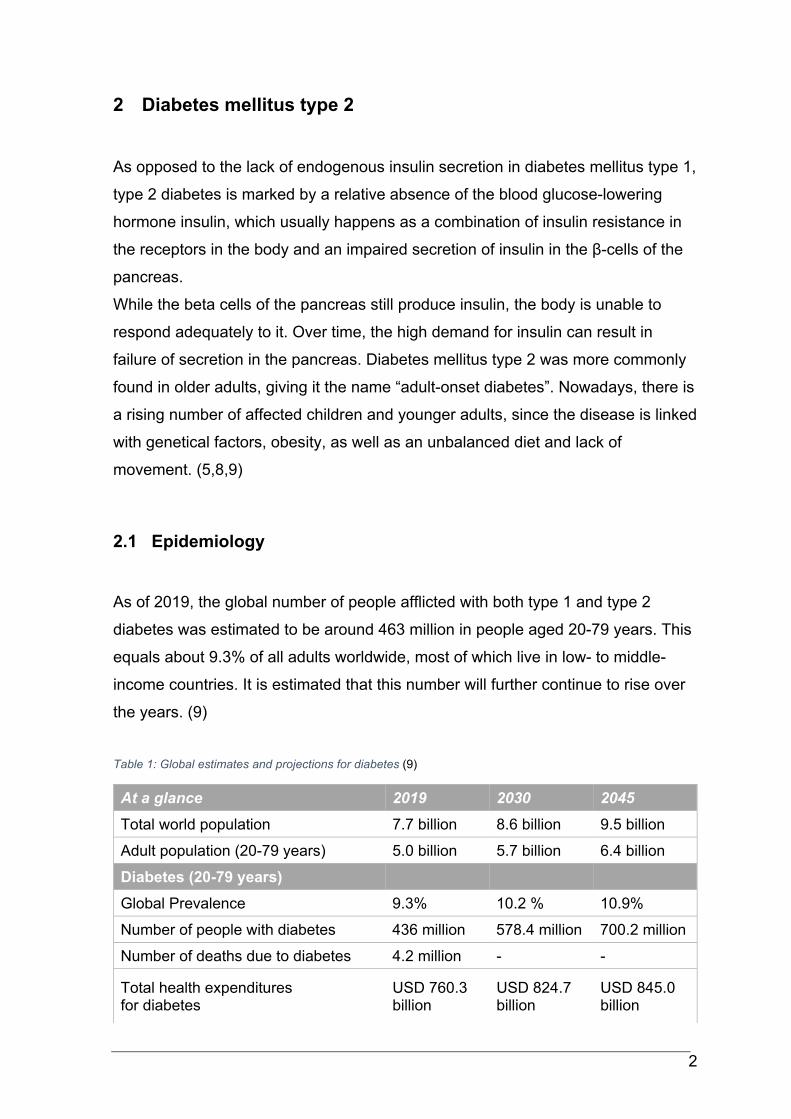
Table 1: Global estimates and projections for diabetes (9)
At a glance 2019 2030 2045
Total world population 7.7 billion 8.6 billion 9.5 billion
Adult population (20-79 years) 5.0 billion 5.7 billion 6.4 billion
Diabetes (20-79 years)
Global Prevalence 9.3% 10.2 % 10.9%
Number of people with diabetes 436 million 578.4 million 700.2 million
Number of deaths due to diabetes 4.2 million - -
Total health expenditures for diabetes
USD 760.3 billion
USD 824.7 billion
USD 845.0 billion
3
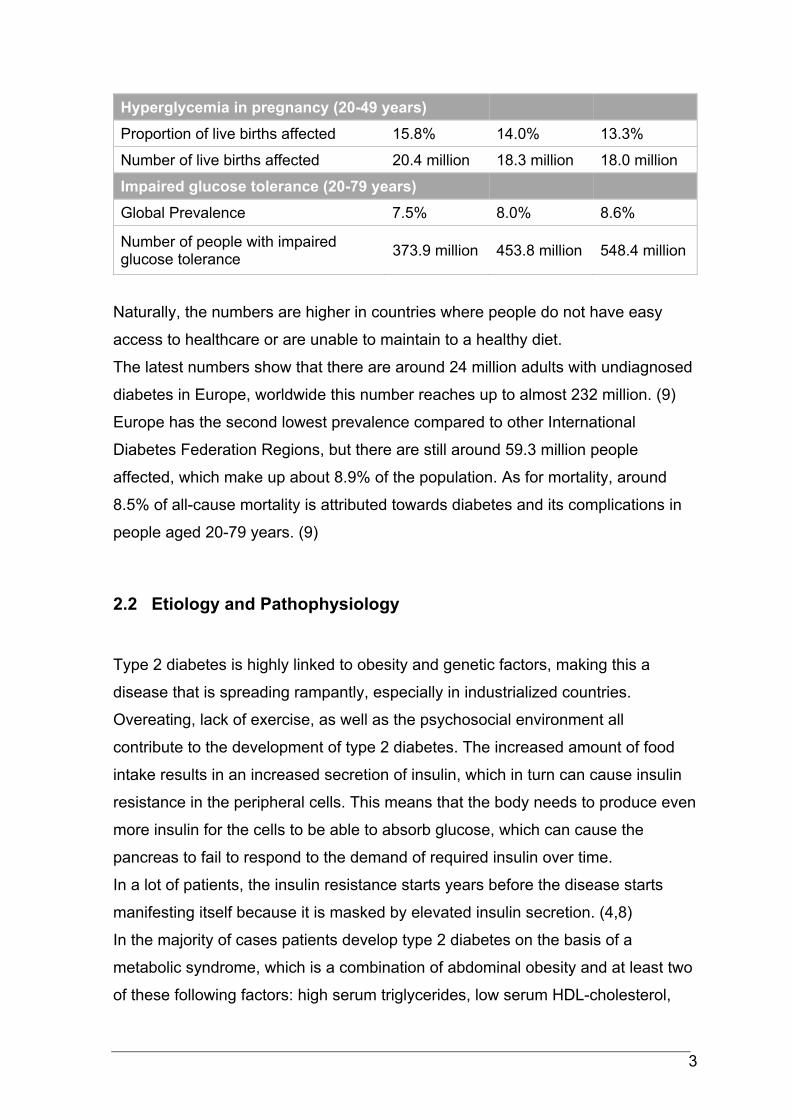
Hyperglycemia in pregnancy (20-49 years)
Proportion of live births affected 15.8% 14.0% 13.3%
Number of live births affected 20.4 million 18.3 million 18.0 million
Impaired glucose tolerance (20-79 years)
Global Prevalence 7.5% 8.0% 8.6%
Number of people with impaired glucose tolerance
373.9 million 453.8 million 548.4 million
Naturally, the numbers are higher in countries where people do not have easy
access to healthcare or are unable to maintain to a healthy diet.
The latest numbers show that there are around 24 million adults with undiagnosed
diabetes in Europe, worldwide this number reaches up to almost 232 million. (9)
Europe has the second lowest prevalence compared to other International
Diabetes Federation Regions, but there are still around 59.3 million people
affected, which make up about 8.9% of the population. As for mortality, around
8.5% of all-cause mortality is attributed towards diabetes and its complications in
people aged 20-79 years. (9)
2.2 Etiology and Pathophysiology
Type 2 diabetes is highly linked to obesity and genetic factors, making this a
disease that is spreading rampantly, especially in industrialized countries.
Overeating, lack of exercise, as well as the psychosocial environment all
contribute to the development of type 2 diabetes. The increased amount of food
intake results in an increased secretion of insulin, which in turn can cause insulin
resistance in the peripheral cells. This means that the body needs to produce even
more insulin for the cells to be able to absorb glucose, which can cause the
pancreas to fail to respond to the demand of required insulin over time.
In a lot of patients, the insulin resistance starts years before the disease starts
manifesting itself because it is masked by elevated insulin secretion. (4,8)
In the majority of cases patients develop type 2 diabetes on the basis of a
metabolic syndrome, which is a combination of abdominal obesity and at least two
of these following factors: high serum triglycerides, low serum HDL-cholesterol,
4
high blood pressure, and elevated blood glucose. This syndrome is arguably the
biggest risk factor for diabetes, especially because it occurs at an increasingly
younger age. (4,10)
A few pathophysiological processes happen in the body that make up type 2
diabetes, some of which are reversible especially in the early stages of the
disease. With type 2 diabetes, the prandial secretion of insulin is dysfunctional,
which results in hyperglycemia. As a contributing factor to this, the secretion of the
blood glucose-raising hormone glucagon, which is produced in the α-cells of the
pancreatic islets, is insufficiently suppressed despite high glucose levels. (10)
Periodically high levels of insulin cause the insulin receptors to lose sensitivity to it,
which causes the body to produce even more insulin to compensate, creating a
vicious circle. (8,10)
Another problem arises when the insulin-producing β-cells of the pancreas go into
apoptosis, which again results in hyperglycemia. Coupled with insulin resistance
and a reduced secretion and efficacy of incretins, which are hormones that
regulate the postprandial release of insulin, the body fails to keep the blood
glucose levels at a normal level. (10)
2.3 Clinical Manifestation
Type 2 diabetes starts off as a silent disease with symptoms that are not very
obvious or impressive. While type 1 diabetes usually presents in younger people
(usually between the ages of 15 to 25) with more fulminant symptoms, the
progression of type 2 diabetes usually is quite slow and unremarkable.
Most patients are over the age of 40 years old and obese, a lot of the time the
diagnosis is established at screenings performed during routine medical checkups.
Often, symptoms are unspecific, ranging from fatigue and a decline in
performance to the more classic polyuria, polydipsia, and weight loss. Some
patients also suffer from pruritus, bacterial infections of the skin, paresthesia and
pain in the legs, or loss of libido.
5
If the disease has been present for a longer period of time before the diagnosis is
made, several secondary problems can present in the patient, the most common
being polyneuropathy, peripheral arterial disease, or retinopathy. (8,10)
2.4 Complications
The reason why it is so important to keep blood glucose levels under control is that
many complications can arise from diabetes. Some of them present acutely, while
many happen slowly over time, but they all play a big role in disease management.
2.4.1 Acute complications
One of the most serious acute complications in patients is diabetic coma, a
metabolic derailment that is considered a medical emergency.
The reason why this happens is usually infection and/or inadequate insulin
therapy. There are two sub-forms of diabetes-associated coma: Ketoacidotic
coma, commonly associated with type 1 diabetes, and hyperosmolar coma, which
occurs in patients with type 2 diabetes. (8)
Ketoacidotic coma develops over a shorter period, usually over 24 hours.
Symptoms like vomiting or nausea often occur, as well as exsiccosis and
tachycardia. The complete lack of insulin as well as the secretion of
counterregulatory hormones leads to gluconeogenesis, glycogenolysis, and an
increased production of ketone bodies through lipolysis in the liver. In severe
cases, patients can develop Kussmaul respiration (deep, rapid, labored breathing)
and the typical fruity fetor on their breath. (8,11)
In case of ketoacidotic coma, the removal of ketone bodies and the substitution of
insulin, fluids and electrolytes are to be initiated immediately. (8)
Contrary to ketoacidotic coma, hyperosmolar coma develops more slowly, over the
course of several days or even weeks, and dehydration is mainly at the forefront.
Blood glucose levels of 1000 mg/dl or higher are common, as most of the time,
this is a result of inadequate treatment or undiagnosed type 2 diabetes. (12)
6
Due to the continued production of insulin, excessive lipolysis and the production
of ketone bodies is thwarted. Patients often present with extreme exsiccosis and
typical symptoms of diabetes like polyuria and polydipsia. This happens because
of hyperosmolarity that is caused by elevated blood glucose. In turn, the kidneys’
transport limits for glucose are exceeded, meaning that the excess glucose has to
be eliminated via the urine. This results in osmotic diuresis with loss of water and
electrolytes. (13)
Some patients with severe hyperglycemia suffer from neurological effects and
even seizures, the final stage being the name-giving comatose stadium. Mortality
for diabetic coma lies between 5-15%, although only around 1% of patients with
type 2 diabetes experience hyperosmolar coma. (8,12,13)
Treatment for this complication consists mostly of administration of fluids,
balancing out electrolytes and gradual blood glucose lowering via insulin, as well
as patient monitoring. It is important to note that the replenishment of fluids should
be done gradually, as to prevent a quick change in osmolarity. This could
potentially lead to an osmotic gradient between extracellular and subarachnoid
space, resulting in brain edema. Therefore, as a rule for diabetic coma, blood
glucose should not be lowered by more than 50% in 4-8 hours. (8,12)
2.4.2 Chronic complications
Vascular complications make up the biggest part of diabetes mortality, with around
70-80% of patients with diabetes succumbing to problems with the large and small
blood vessels, which affect a multitude of organs.
Both macro- and microangiopathy can become a big problem if a patient is not
well controlled in their blood glucose levels, with microangiopathy being
specifically associated with diabetes. The risks for stroke, myocardial infarction,
and peripheral arterial disease are increased in patients with diabetes mellitus,
even more so if the patients also suffer from further comorbidities like metabolic
syndrome contributing to detrimental outcomes. (8,10)
7
2.4.2.1 Macroangiopathy
With the larger blood vessels also being affected, coronary heart disease,
ischemic stroke, and peripheral arterial disease are common in patients with
diabetes. “Silent” myocardial infarctions occur more often in these patients, which
is why it is important to do regular electrocardiograms (ECGs) and checkups.
Around 75% of patients with diabetes die from cardiovascular complications,
although it is to be noted that diabetes and cardiovascular disease go hand in
hand. (8,10)
2.4.2.2 Microangiopathy
This process of non-enzymatic glycosylation of proteins (hemoglobin, serum
proteins, basal membranes) occurs because of chronic hyperglycemia, which
changes the capillary basal membranes of the vessels. This results in
dysfunctional oxygen transportation and a change in blood flow.
Hypertension and smoking further negatively influence this process. (8,13)
2.4.2.2.1 Diabetic retinopathy
Diabetic retinopathy describes changes in the retina of the eye caused by
angiogenic growth factors. Risk factors include chronic hyperglycemia, as well as
hormonal changes (in puberty or pregnancy), hypertension, and hyperlipidemia.
Rapid lowering of the HbA1c levels (start of intensive insulin therapy or a switch
from oral to insulin therapy) is another risk factor of early worsening of diabetic
retinopathy. (4,10)
This is most likely due to high doses of insulin acting synergistically with vascular
endothelial growth factor (VEGF), a protein expressed by ischemic retina that
spurs on blood vessel growth. Therefore, vascular proliferation is triggered, which
worsens diabetic retinopathy in patients with pre-existing retinal abnormality. (14)
This form of microvascular long-term complication correlates with the duration of
diabetes and metabolic control. Because of the long latency period where type 2
diabetes remains undiagnosed, complications like diabetic retinopathy have
8
already started when the disease starts manifesting itself. Diabetic retinopathy,
other than glaucoma, is the most common reason for non-traumatic blindness in
adults in industrialized countries. It is also the earliest symptom of
microangiopathy. (8,10,13,15)
Every % of HbA1c that is lowered in a patient results in 30-40% lower risk of
developing retinopathy. (16)
Around one third of all type 2 patients show signs of retinopathy at the time of the
diabetes diagnosis, and for many, it can develop over the course of the disease,
which is why regular ophthalmological checkups are recommended. (4,10)
2.4.2.2.2 Diabetic neuropathy
The impairment of nerve tissue is dependent on disease duration, patient age,
nicotine abuse, as well as metabolic adjustment, and several other risk factors. It
is still unclear as to what exactly happens, but diabetic neuropathy primarily affects
peripheral sensibility, the vegetative system, as well as reflexes. (10,13,17)
Around 50% of patients with diabetes show typical signs of polyneuropathy, most
of which include somatosensory disorder, numbness, reduced perception of
vibration, neuropathic pain, and changes in the skin (like discoloration, dryness,
loss of hair, and sweat secretion). (4,17)
Around 80% of cases are classified as peripheral sensorimotor polyneuropathy,
while autonomic neuropathy, which affects the vegetative nervous system, makes
up the second-largest group of neuropathic disorders. The latter can cause
arrhythmia and ventricular fibrillation, which can lead to sudden cardiac death. (10)
Furthermore, diabetic neuropathy often leads to diabetic foot syndrome, in which
local traumata to the feet (ill-fitting shoes, wrong/ lack of podiatric care, lack of
hygiene) can become infected and ulcerate. This is worsened by the fact that
wound healing is impaired in patients with diabetes, so the ulcers heal slower. In
the worst-case scenario, amputation can become necessary. Diabetic foot
syndrome is the most common chronic complication of diabetes in patients.
(8,10,17)
9
2.4.2.2.3 Diabetic nephropathy
Another potential complication in patients with insufficiently controlled diabetes is
diabetic nephropathy, which has become the most common reason for
hemodialysis and the leading cause of chronic kidney disease. About one fourth of
all dialysis patients suffer from diabetic nephropathy, which comes with a high
mortality rate of 23% survival over a span of 5 years. (8,10)
Around 10% of patients with type 2 diabetes develop this complication, which can
manifest itself as proteinuria (specifically microalbuminuria in the early stages),
hypertension, and a decreased estimated glomerular filtration rate (eGFR). (8,10)
The reason for this kidney disease is the development of glomerular lesions, which
includes diffuse and nodular mesangial expansion, as well as the thickening of the
glomerular basal membrane. In later stages, diffuse nodular glomerulosclerosis
can occur, which are known as Kimmelstiel-Wilson nodules. In many cases, this is
combined with arteriosclerotic changes to the blood vessels, which add to the
nephropathy. (8,18)
As with most of the other potential complications of diabetes, this, too, can be
controlled with lifestyle interventions, keeping the blood glucose levels under
control, as well as optimization of blood pressure. (19)
The sooner therapy with angiotensin-converting-enzyme (ACE) -inhibitors in
(borderline) hypertonic patients begins, the more progression of diabetic
nephropathy towards terminal kidney failure and dialysis will be prevented. It also
lowers cardiovascular complications and mortality in total. (10,19)
2.5 Diagnostic work ups
Taking a patient’s history is essential to get closer to a working hypothesis and a
potential diagnosis of any disease, especially one that is so heavily dependent on
lifestyle factors and genetics. In patients who are likely to develop or suffer from
type 2 diabetes, it is important to ask about the most common symptoms like
polyuria, polydipsia, and weight loss. Family history, previous pregnancies and
complications of those as well as potential symptoms of complications of diabetes
10
can also lead one towards a diagnosis. To solidify this, there are several tests that
can rule out or establish the diagnosis of diabetes mellitus. (8)
2.5.1 Blood glucose management
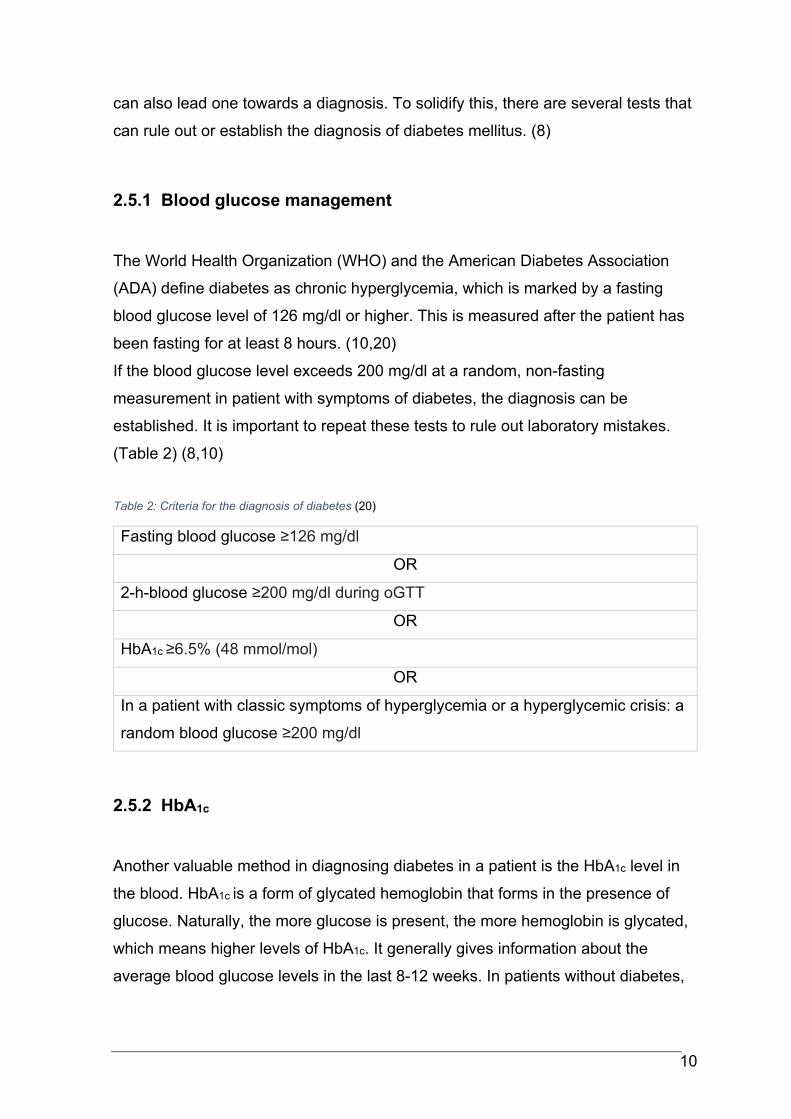
The World Health Organization (WHO) and the American Diabetes Association
(ADA) define diabetes as chronic hyperglycemia, which is marked by a fasting
blood glucose level of 126 mg/dl or higher. This is measured after the patient has
been fasting for at least 8 hours. (10,20)
If the blood glucose level exceeds 200 mg/dl at a random, non-fasting
measurement in patient with symptoms of diabetes, the diagnosis can be
established. It is important to repeat these tests to rule out laboratory mistakes.
(Table 2) (8,10)
Table 2: Criteria for the diagnosis of diabetes (20)
Fasting blood glucose ≥126 mg/dl
OR
2-h-blood glucose ≥200 mg/dl during oGTT
OR
HbA1c ≥6.5% (48 mmol/mol)
OR
In a patient with classic symptoms of hyperglycemia or a hyperglycemic crisis: a
random blood glucose ≥200 mg/dl
2.5.2 HbA1c
Another valuable method in diagnosing diabetes in a patient is the HbA1c level in
the blood. HbA1c is a form of glycated hemoglobin that forms in the presence of
glucose. Naturally, the more glucose is present, the more hemoglobin is glycated,
which means higher levels of HbA1c. It generally gives information about the
average blood glucose levels in the last 8-12 weeks. In patients without diabetes,
11
the normal levels of HbA1c are 5.7% (38.8 mmol/mol) or lower. Diabetes is
diagnosed from a level of 6.5% (47.5 mmol/mol) or higher. (4,8,10)
Levels ranging from 5.7% to 6.5% are categorized as a higher risk for diabetes,
which is why additional testing for fasting blood glucose and an oral glucose
tolerance test (oGTT) are recommended. (21)
HbA1c levels can be falsely elevated in patients suffering from advanced kidney
disease, chronic alcohol abuse, hyperlipoproteinemia, or in the latter stages of
pregnancy. They can also be falsely lower than they really are after blood
transfusions or in patients with shortened erythrocyte life span because of
hemolysis or hemoglobinopathy. In the first half of pregnancy, the levels can also
be lower than expected. (10,20)
It is a more convenient form of diagnostics because it is less dependent on the
patient and fasting, while also being less sensitive to potential value-changing
factors like stress, illness, or diet changes. On the other hand, there are many
other factors mentioned above that can falsely alter the levels of HbA1c in the
blood. (20,21)
2.5.3 Oral Glucose Tolerance Test
An oral glucose tolerance test (oGTT) can be scheduled if the fasting glucose
levels are abnormal, when certain risk factors are present, including obesity or
polycystic ovary syndrome (PCOS), or in patients with suspected gestational
diabetes. For the test, the fasting patient must ingest a load of 75g of glucose
orally at once. The blood glucose is measured at the beginning of the test, as well
as 2h later. Blood glucose levels of 200mg/dl or higher after 2 hours would be
classified as pathologic. (8,10)
12
2.5.4 Other Tests
There are other clinical tests that can rule out diabetes or help to distinguish
between type 1 and type 2, although generally they are not as important or as
significant as the aforementioned ones.
Glucose levels can be measured in the urine via test strips, although this has lost
importance since blood glucose measurements have become very simple, fast,
and accessible.
Under normal circumstances, there should be little to no glucose in the urine,
because it gets reabsorbed by the kidneys. When blood glucose levels surpass
the renal threshold of 180 mg/dl, glucose is expelled through the urine. This highly
depends on whether the kidneys are affected by the disease or are dysfunctional
for other reasons. Therefore, the lack of glucose in the urine cannot rule out
diabetes mellitus. (8,10)
The level of C-peptide, which is a marker for active insulin secretion, can also be
measured in the blood. In patients with manifest type 1 diabetes, C-peptide is
nearly untraceable, because the pancreas does not produce insulin.
Contrary to that, in type 2 diabetes C-peptide levels are usually above the normal
range. With longer disease duration and declining beta-cell function they can be
normal or even below the normal range. (8,22)
2.6 Treatment
One relevant goal in the treatment of patients with type 2 diabetes is to establish
good glycemic control (HbA1c <53-58 mmol/mol) and prevent potential future
complications of the disease, as well as dealing with manifest complications. One
of the main issues and risk factors is obesity, which means that measures to keep
that under control are one of the corner stones of diabetes treatment. (23,24)
Treatment goals however are largely dependent on patient age and comorbidities.
The older a patient is and the more and severe comorbidities they have, the less
stringent glycemic control is required.
13
2.6.1 Lifestyle Adjustment and patient education
As type 2 diabetes is a chronic disease and a result of western lifestyle, diabetes
education and measures to adjust lifestyle are essential.
On top of a regulated diet, physical activity is a big part of diabetes treatment. A
medium to high intensity workout of 150 minutes per week with additional muscle
strengthening would be ideal to influence a patient’s health positively, although for
most of them, that is quite hard to achieve. Along with improving insulin resistance
and secretion, it lowers cardiovascular risk. (25)
A key factor in compliance is patient education, which includes providing
information about the condition in words that laypeople can understand, as well as
giving reasons for why the lifestyle changes are necessary and must be kept up
long-term. (8)
2.6.2 Pharmacological Treatment
As with any other disease, it is crucial to customize the therapy to each patient,
depending on individual needs and preexisting conditions.
The main goals for pharmacological treatment are to prevent complications of
hyperglycemia, to reduce or eliminate symptoms as well as to preserve the quality
of life. The goal is to keep the HbA1c-levels below 53-58 mmol/mol (7.0-7.5%) to
prevent macro- and microvascular complications. In older, multimorbid patients, a
HbA1c of 64 mmol/mol, (8%) or higher might be acceptable, depending on
comorbidities, life expectancy and risk of hypoglycemia. (26,27)
2.6.2.1 Oral antihyperglycemic agents
The first line oral antihyperglycemic agent (OHA) for the treatment of type 2
diabetes is metformin because it is highly efficient in decreasing HbA1c, affordable,
safe, and has shown a preferable outcome in cardiovascular events. Metformin
prevents gluconeogenesis, thus improving peripheral insulin sensitivity. (26,27)
14
In many patients, metformin monotherapy, along with the previously mentioned
lifestyle changes, enables sufficient glycemic control. (26)
Combination therapy usually becomes necessary after a few years because
diabetes is a progressive disease. It is advised to add other agents to metformin
step-by-step as needed, until sufficient glycemic control is achieved. (10,27,28)
Depending on the comorbidities of patients, there are a number of different OHAs
that can be used:
The sodium glucose linked transporter (SGLT2) in the kidneys is responsible for
the majority of the renal glucose reabsorption. These transporters are blocked by
SGLT2- inhibitors, a commonly used OHA, which cause controlled glucosuria and
thus lower blood glucose. Furthermore, they cause a decrease in HbA1c and blood
pressure, and they lower the risk of cardiovascular events. They are associated
with weight loss (-2-3kg). On the other hand, SGLT-2 inhibitors can be the reason
for frequent urogenital infections. (26)
Glucagon-like Peptide-1 (GLP-1) agonists mimic the effects of the natural protein
in the body, which causes the glucose-dependent pancreatic insulin production to
increase. They also delay gastric emptying, inhibit the release of glucagon, and
cause a feeling of satiation. They differ from OHA because they are injected
subcutaneously, similar to insulin. Depending on the substance, administration is
required from daily to once a week. They, too, can cause weight loss and a
reduction of cardiovascular risk, although gastrointestinal side effects like nausea
and vomiting can occur. (26)
Dipeptidyl-Peptidase-IV (DPP-4) inhibitors prevent natural GLP-1 from breaking
down and thus have similar effects as GLP-1 agonists. None of the previously
mentioned agents cause hypoglycemia. DPP-4-inhibitors do not have a positive
effect on body weight. They often are used in combination with metformin or other
OHAs because of their low effect as monotherapy. (26)
Sulfonylurea reduces HbA1c by up to 1.5% through stimulation of pancreatic
insulin secretion. However, they are putting patients at an increased risk of
hypoglycemia as they increase insulin secretion from the islet cells irrespective of
the patient’s current blood glucose. Patients are also at risk of gaining weight
when therapy with sulfonylurea is initiated due to the increased endogenous
insulin levels and potentially snacking against impending hypoglycemia. (26,29)
Thiazolidinediones are agonists of peroxisome proliferator-activated
15
receptor gamma (PPAR-ϒ), which they bind to in order to improve insulin
sensitivity. Unwanted side effects of this drug include weight gain and a higher risk
of edema because of fluid retention. Therefore, heart failure is a big
contraindication for the use of thiazolidinedione, as well as liver dysfunction. Bone
fractures can occur more frequently in menopausal women. (26,29,30)
It should be noted that thiazolidinedione and sulfonylurea are not state of the art
OHA therapy anymore.
No matter the choice of OHA, it is very important to take each patient and their
needs into consideration when prescribing drugs.
Every non-insulin agent that is added to metformin lowers the HbA1c by
approximately 0.7-1%. Every 3-6 months, glycemic control measured by HbA1c
shall be reevaluated and if the HbA1c- target has not been achieved,
antihyperglycemic therapy needs to be adjusted. (27)
In patients with blood glucose levels higher than 300 mg/dl or with a HbA1c of over
10% (86 mmol/mol), or if the patient shows symptoms of hyperglycemia, it is
advisable to initiate insulin therapy. (27)
2.6.2.2 Insulin
Insulin is the only hormone in the body that can lower blood glucose. It is crucial in
the therapy of diabetes or hyperglycemia, especially since as the disease
progresses, many patients have to add insulin therapy to their existing therapy
regimen. Usually, the indication for this is inadequate glycemic control with OHAs
and lifestyle modifications. Another factor would be intolerance or
contraindications for OHAs. Insulin therapy might also be initiated intermittently
around surgeries or during acute medical conditions. (28)
It is important to train and educate patients when it comes to insulin treatment.
Self-monitoring of blood glucose, diet, hypoglycemia, and the correct
administration are essential aspects that the patient should be taught about. (27)
Insulin is administered subcutaneously, preferably into the abdominal area, the
thigh, or the upper arm. To reduce the risk of lipodystrophy, injection sites should
be switched regularly (see 2.6.3). (31)
16
There are three main types of insulin that are available for the treatment of
diabetes mellitus: rapid-acting insulin, basal insulin, and premixed insulin. Insulin
can be injected via insulin pens (most common form), insulin syringes or insulin
pumps (rapid-acting insulin only). (10,28)
The insulins used in this study will be discussed in more detail in chapter 3.1.2 and
3.1.3.
2.6.2.2.1 Rapid-acting insulins
Rapid-acting insulins are administered at mealtimes to cover the blood glucose
peaks that follow.
These agents take effect around 5-15 minutes after application, peak in about 30-
90 minutes post-injection, and last for around 3-5 hours, depending on what
specific compound is used. They are well suited to be used for lowering (post-)
prandial blood glucose spikes due to their quick onset and short duration. (32,33)
One of two categories for these types of agents is regular insulin, which is
becoming more and more obsolete with the availability of modern rapid acting
insulin analogues as they are relatively slow in the on- and offset of insulin action.
That is why rapid-acting insulin analogues are more commonly used nowadays.
They include insulin aspart (NovoRapid®, Novo Nordisk, Denmark), insulin
glulisine (Apidra®, Sanofi-Aventis, France), and insulin lispro (Humalog®, Eli-Lilly,
USA). (10)
A subgroup includes ultra-rapid-acting insulins, which as the name suggests, have
a shorter onset of action than rapid-acting insulins.
They are meant to mimic the fast onset of action of physiological insulin secretion
with this faster onset time, thus reducing postprandial glucose excursions. They
are absorbed quicker subcutaneously to achieve better control of postprandial
plasma glucose levels.
This is most valuable to patients with reoccurring postprandial hyperglycemic
episodes. Insulin lispro (Lyumjev®, Eli-Lilly, USA) and insulin aspart (Fiasp®,
Novo Nordisk, Denmark) are part of this group. (34,35)
17
2.6.2.2.2 Basal insulins
2.6.2.2.2.1 Intermediate-acting basal insulins
By combining Insulin with protamine or zinc, or by changing the structure or
concentration of the hormone, the duration of its effect can be prolonged. They
can be administered into the subcutaneous adipose tissue of the abdomen or
thigh. The goal for these was to flatten the response curve, as well as to increase
the time of effectiveness, which reduces the number of injections and broadens
the time frame in which they should be administered. (10,28)
NPH-insulin (Neutral Protamine Hagedorn insulin) is one of these agents. It has to
be brought into suspension before application, which is why it can cause more
hyper- and hypoglycemia than other drugs. The effect starts at around 60 minutes
after administration, lasting from 9 – 18 hours. Usually, two injections per day are
required to cover a 24-hour period. (10)
2.6.2.2.2.2 Long-acting basal insulin analogues
Long- and ultra-long-acting basal insulins are another form of insulin analogues
that stem from changes in structure, amino-acid sequence, or concentration, which
makes them last around 20 – 28 hours. They are meant to recreate the constant
levels of insulin in between meals and at nighttime, while the long acting time
lowers the number of injections needed for the patient. Insulin glargine (Lantus®,
Sanofi, France) and insulin detemir (Levemir®, Novo Nordisk, Denmark) are both
long-acting insulin analogues. While they are quite different on a molecular level,
they share a lot of improved pharmacodynamic characteristics. They both have a
reduced variability compared to NPH insulin and a reduced risk of nocturnal
hypoglycemia. (10,33,36)
2.6.2.2.2.3 Ultra-long-acting basal insulin analogues
These insulin analogues have an even longer duration of insulin action than all the
other previously mentioned ones. Insulin degludec (Tresiba®, Novo Nordisk,
Denmark) and a higher concentrated insulin glargine (Toujeo®, Sanofi, France)
18
have been developed to last longer and to further simplify diabetes therapy by
requiring fewer injections. Insulin degludec has a half-life of >25 hours, which is
around twice the time of the long-acting insulin glargine that comes up to around
12 hours half-life. The reduced risk of nocturnal hypoglycemia, the longer duration
of insulin action that is similar to physiological basal insulin, as well as the flexibility
of injection times are all factors that contribute to these analogues being favored.
(33,37)
2.6.2.2.3 Premixed insulins
This form of insulin covers both basal and prandial insulin demand and is usually
administered 2-3 times a day.
Premixed insulins are best suited for elderly patients or patients for whom a simple
regimen with a reduced number of injections per day is recommended, as well as
patients with a set schedule who consume meals regularly. The effect of premixed
analogues is closer to the physiological response, which is why it can be
administered directly before or after a meal, whereas premixed human insulin has
to be administered 30 minutes in advance. (10,28,33)
NovoMix® and IDegAsp (Ryzodeg®, Novo Nordisk, Denmark) are examples of
premixed insulins. NovoMix contains insulin aspart and insulin aspart protamine,
which is longer acting. It is available as NovoMix 30 (30% insulin aspart, 70%
insulin aspart protamine), NovoMix 50 (50%/50% mix of both agents) and NovoMix
70 (70% insulin aspart and 30% insulin aspart protamine). NovoMix 30 may be
used in children over the age of 10, while the other two may only be used in
adults. IDegAsp is a newer agent, a combination of the ultra-long-acting insulin
degludec and the rapid-acting insulin aspart. It is suitable for patients over the age
of 2 years. (38,39)
19
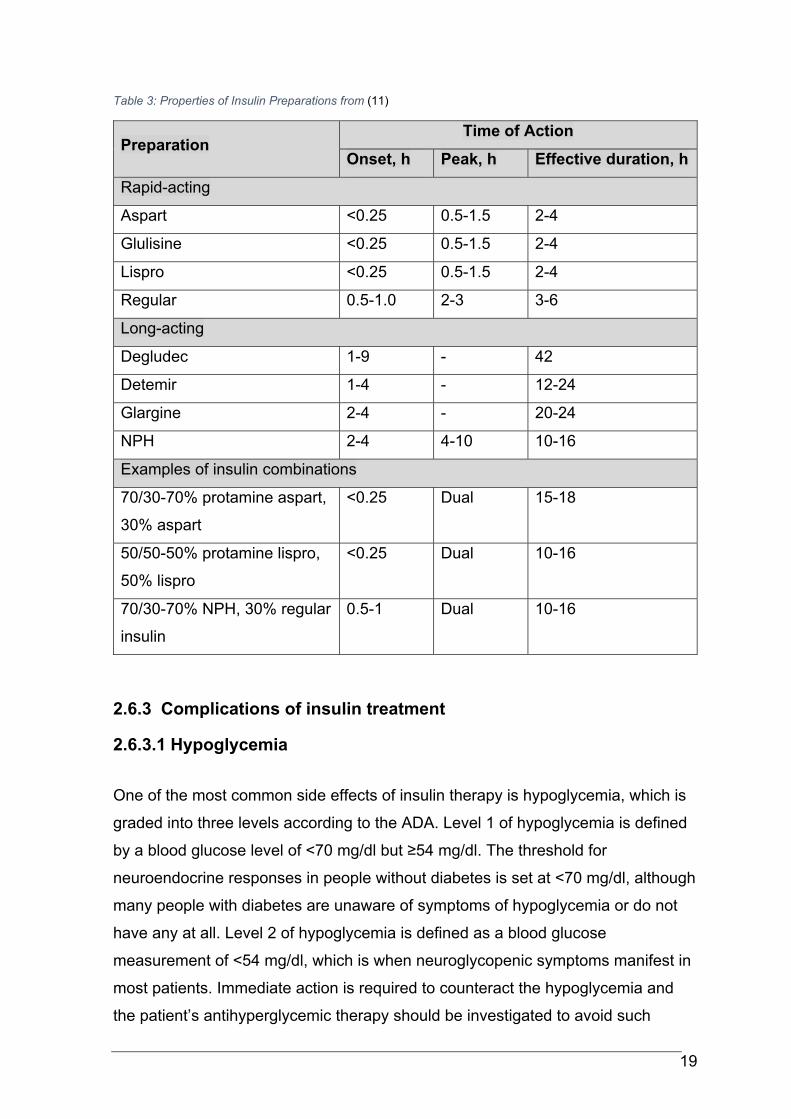
Table 3: Properties of Insulin Preparations from (11)
Preparation Time of Action
Onset, h Peak, h Effective duration, h
Rapid-acting
Aspart <0.25 0.5-1.5 2-4
Glulisine <0.25 0.5-1.5 2-4
Lispro <0.25 0.5-1.5 2-4
Regular 0.5-1.0 2-3 3-6
Long-acting
Degludec 1-9 - 42
Detemir 1-4 - 12-24
Glargine 2-4 - 20-24
NPH 2-4 4-10 10-16
Examples of insulin combinations
70/30-70% protamine aspart,
30% aspart
<0.25 Dual 15-18
50/50-50% protamine lispro,
50% lispro
<0.25 Dual 10-16
70/30-70% NPH, 30% regular
insulin
0.5-1 Dual 10-16
2.6.3 Complications of insulin treatment
2.6.3.1 Hypoglycemia
One of the most common side effects of insulin therapy is hypoglycemia, which is
graded into three levels according to the ADA. Level 1 of hypoglycemia is defined
by a blood glucose level of <70 mg/dl but ≥54 mg/dl. The threshold for
neuroendocrine responses in people without diabetes is set at <70 mg/dl, although
many people with diabetes are unaware of symptoms of hypoglycemia or do not
have any at all. Level 2 of hypoglycemia is defined as a blood glucose
measurement of <54 mg/dl, which is when neuroglycopenic symptoms manifest in
most patients. Immediate action is required to counteract the hypoglycemia and
the patient’s antihyperglycemic therapy should be investigated to avoid such
20
events in the future. In some cases, patients fail to recognize symptoms of
hypoglycemia, which most likely is caused by hypoglycemia unawareness, leading
them to experience hypoglycemic events more frequently.
Level 3 of hypoglycemia is considered a severe event with altered mental and/or
physical functions. At this stage, a patient requires help from a third person to deal
with the symptoms and treatment. (24)
Hypoglycemia can occur for a myriad of reasons, whether it be a change in diet or
missed meals, excessive physical activity, stress, and acute illness. An
administration of excess insulin or newly started blood glucose-lowering
medication can also play a role, though they occur less frequently. (40–42)
Some risk factors for it that are often prevalent in hospitalized patients include
older age, kidney failure, previous insulin therapy, change in nutritional intake like
fasting periods before surgery, interruption of glucose monitoring, and the failure to
adjust therapy. (43)
Typical symptoms include palpitations, sweating, tremor, and hunger. Often,
patients have difficulty thinking or experience confusion during hypoglycemic
events, in more severe cases it can even lead to seizures, coma, or death. Poor
glycemic control can lead to postoperative infections and even kidney injury, with
hypoglycemia being associated with increased morbidity and mortality in
hospitalized patients. (40–44)
Preventing hypoglycemic events is a priority in diabetes therapy, which is why it is
important to take risk factors into account. Clinical decision support tools can
further facilitate glycemic control while raising the target levels of blood glucose for
patients at risk for hypoglycemia can also help in prevention. Furthermore, less
intense treatment with glucose-lowering therapy also reduces hypoglycemic
events. (40,41)
2.6.3.2 Lipodystrophy
Another potential risk of insulin therapy is lipodystrophy at the injection sites, which
is the most common cutaneous complication of insulin injection. This can result
from inappropriate needle length for the subcutaneous tissue depth, a lack of
rotation of injection sites, or from not changing needles between injections. Often,
21
patients are not educated well enough on proper injection techniques, which is
why this is such a common complication. Lipodystrophy occurs in around 50% of
patients and can manifest itself as lipohypertrophy or as lipoatrophy. The former
presents itself as a thickened, “rubbery” lesion in the subcutaneous tissue, while
the latter is a scarring lesion as the result of fatty tissue atrophy. The exact
etiology is still unclear. The problem with lipodystrophy is that it impairs the
absorption of insulin by up to 25%, which can result in poor glycemic control.
Patients tend to favor areas with lipodystrophy, mostly because injections into
those areas are less painful or because of habit, which is why patient education is
important. Properly rotating injection sites, using larger injection areas, and
reusing needles less frequently are good approaches to avoid the development of
lipodystrophy. (31,45)
2.7 Inpatient diabetes management
The number of people with diabetes is globally rising every year, so naturally, the
number of inpatients with hyperglycemia is rising, too. This is also because acute
infection, high levels of stress, or surgeries can all result in elevated blood glucose
as a form of imbalance in glucose metabolism. Hormonal, metabolic, and
inflammatory dysregulation are key factors in the management of hospitalized
patients, with the prevalence of hyperglycemia in these patients stepping in at
around 20-40%, even up to 70% in intensive care units. (7)
It is essential to keep blood glucose levels in adequate control since high blood
glucose is a risk factor for both mortality and adverse effects like infections or
postoperative complications. Every 40 mg/dl over the level of normoglycemia
(<110 mg/dl) raises the risk for postoperative infections by 30%. (43)
Patients with hyperglycemia increase treatment cost and are at risk of having
extended hospital stays. Acute and long-term complications can also factor into
this, seeing as hyperglycemic coma or iatrogenic hypoglycemia, as well as micro-
and macrovascular complications, can all be reasons for hospital admissions.
(6,7,43)
22
Studies have shown that it is most beneficial for the patients to keep the blood
glucose levels between 140 – 180 mg/dl and to start administering insulin in case
of prolonged hyperglycemia during the hospital stay. (6,7)
A test to check HbA1c levels should be performed in patients with preexisting
diabetes or new-onset hyperglycemia unless a test result within the last 3 months
is available. (6)
To avoid hypo- or hyperglycemic periods, blood glucose should be measured
much more frequently than in the home setting. The glycemic targets strongly
depend on the patient and factors like their comorbidities, the reason for their
hospitalization, their weight, and the medication they take. Insulin therapy in
hospitalized patients is often quite a challenge, especially for medical staff. It
requires frequent blood glucose measurements, adequate insulin dose calculation,
and correct timing of the injection in relation to meals. (7)
As intravenous (i.v.) insulin is easier to control due to its short half-life (<15
minutes) it is the preferred way to control blood glucose levels in critically ill
patients treated at intensive care units (ICU). Critically ill patients often require an
array of different medications and monitoring, which makes the flexibility of i.v.
insulin a necessity, although the downside of this is the high demand for nursing
support. As for general non-critically ill patients, subcutaneous injection of basal
insulin coupled with prandial insulin at mealtimes is the most effective and safe
treatment. In patients with regular adequate oral intake, this basal-bolus insulin
therapy is preferred, seeing as it improves glycemic control and reduces the
number of postoperative complications, especially wound infections. In patients
with reduced or lack of oral intake due to acute illness, lack of appetite, medical
procedures, or surgical interventions, the preferred treatment is basal insulin to
cover basal insulin requirements with rapid-acting insulin administered as
correction doses or with meals. In general, insulin therapy is favored in a hospital
setting since there is only limited data available on oral antihyperglycemic agents
and their safety and efficacy. Insulin however does not have drug interactions,
which makes it safe to use in patients with preexisting medication or with
medications rapidly being added, changed, or discontinued. (43,44)
One big challenge remains hypoglycemia and the management of it. It occurs in
around 30% of hospitalized patients and is a common complication of insulin
therapy. Insulin therapy requires individual customization, monitoring of the
23
patient, and dose titration, which is why hyper- and hypoglycemia are fairly
common in inpatients. (43,46)
Until recently, blood glucose monitoring has been manual labor, with data written
into patient charts to keep track of everything. Nowadays, electronic systems have
been introduced to hospital life. This simplifies diabetes therapy and prevents
mistakes. In Europe, GlucoTab® is the software used specifically for this reason
(see 3.1.1). (4)
3 Clinical Study
This study was conducted to evaluate the efficacy of the GlucoTab® system in
combination with a new ultra-long-acting insulin degludec in non-critically ill
patients with type 2 diabetes or newly diagnosed hyperglycemia requiring
subcutaneous insulin therapy. A log file was created to keep track of the insulin
pens that were used, as well as the patients they were used on, the date and time.
A signature of the person allocating the pen to the patient was required.
3.1 Material
3.1.1 Product of investigation GlucoTab®
GlucoTab® is a diabetes management system with a decision support component
for subcutaneous insulin therapy in inpatients with type 2 diabetes. It is a mobile
computerized system that provides help in two major categories: for one, it offers
automated workflow support that assists healthcare professionals in treatment
workflow organization. This includes a display for open tasks, providing visual
proof of blood glucose levels and documentation thereof, as well as of nutrition
and insulin doses. The other main objective of the GlucoTab® system is to provide
two standardized recommendations for the total daily insulin dose, which are
based on a basal-bolus insulin titration protocol that the leading physician has
prescribed. This works via a basal-bolus insulin dosing algorithm that is set to
achieve fasting blood glucose values of less than 140 mg/dl, which are determined
by age, body weight, and renal function. (1,2)
24
GlucoTab® also suggests doses for individual insulin administrations before
meals, at bedtime, and immediately after blood glucose measurements, if
required. After these suggestions are confirmed, authorized personnel administer
the insulin subcutaneously. The system also comes with safety features that
consider if the patient ate anything, the amount of bolus insulin that is still active in
the patient’s system from a previous dose (“insulin on-board”), as well as a
reduction of bolus insulin if the previous administration of it was delayed. However,
healthcare professionals do have the final say in treatment and can override the
system anytime. (1)
The algorithm for the dose has been tested in a clinical trial ClinDiab-02
(NCT01407289), a modification of it has also been tested in the ClinDiab-03 trial
(NCT01766752), as well as the safety, efficacy, and usability of the GlucoTab®
system in type 2 diabetes patients in the ClinDiab-04 trial (NCT01932775).
As for now, the only basal insulins that can be used with GlucoTab® are insulin
glargine and insulin glargine U300. With this study, the main objective was to use
insulin degludec as the basal insulin, which has not been approved for dose
titration with GlucoTab® yet. Because of the qualities that insulin degludec has
shown in extensive clinical studies (longer duration of action with less variability in
plasma insulin exposure, as well as fewer hypoglycemic episodes), it could
improve glycemic management even further. (47,48)
3.1.2 Insulin degludec (Tresiba®)
Insulin degludec is an analogue of ultra-long-acting human insulin which is used to
establish glycemic control diabetes mellitus in patients 1 year of age or older. It
should be injected once a day at any time of day, the time of the day thereafter
should remain approximately the same (± 4 hours). Dose adjustments may be
needed depending on physical activity, changes in meal intake, changes in
renal/hepatic functions, or in phases of acute illness. (49)
Insulin degludec provides continuous and stable insulin replacement with a flat
curve with only one injection over a period of 24 hours. This is possible due to
prolonged and stable insulin absorption in the body, which results in an ultra-long
lasting and flat glucose-lowering profile. (50)
25
The half-life of insulin degludec exceeds 25h as compared to around 12h for
insulin glargine, reaching a steady state within 3 days of administration. The
duration of action exceeds 42h, making it an ultra-long-acting basal insulin, on top
of being more stable in glucose-lowering effect than insulin glargine. (37)
The reason why Insulin degludec was chosen to be used in this study is that
compared to insulin glargine U100, which was previously used with the
GlucoTab® system, it showed a reduced rate of symptomatic hypoglycemic
events. (51)
Compared to insulin glargine U300, the rates of hypoglycemia were not
significantly lower with insulin degludec U200, however, there was a lower rate of
nocturnal symptomatic hypoglycemia, as well as general severe hypoglycemia
with degludec U200 vs. glargine U300. (52)
Therefore, insulin degludec may be an alternative for patients who are prone to
hypoglycemia using insulin glargine. (53)
This is a relevant reason to use insulin degludec within this study since severe
hypoglycemia is linked to higher subsequent all-cause mortality. (42,54)
3.1.3 Insulin aspart (NovoRapid®)
Insulin aspart is a rapid-acting insulin analogue. It is used for the treatment of
diabetes mellitus in adults, adolescents, and children over the age of one. It is
usually used in combination with an intermediate- or long-acting insulin, while
measuring the blood glucose levels frequently to adjust the dose of insulin to
assure optimal glycemic control. Because of the relatively fast onset of insulin
action of insulin aspart, it should be injected right before having a meal.
Additionally, it can be used to correct elevated blood glucose levels throughout the
day whenever required. (55)
26
3.1.4 Non-investigational medical devices
3.1.4.1 FreeStyle Libre Pro Flash Glucose Monitoring System
The FreeStyle Libre Pro Flash Glucose Monitoring System by Abbott Diabetes
Care (California, USA) was the non-investigational product used for blinded
continuous glucose monitoring (CGM). It is CE-certified and marketed and
registered for the use of measuring and recording glucose values in patients with
diabetes or hyperglycemia. The sensor of the FreeStyle Libre Pro was inserted at
the beginning of the treatment period, changed after a maximum of 14 days, and
removed and reinserted if patients required medical imaging (X-rays, CTs or
MRIs). In case of accidental removal, the sensor was replaced as well. The
continuous glucose data were analyzed retrospectively, and no treatment was
based on the data. (56)
3.1.4.2 Accu-Chek® Inform II
The Accu-Chek Inform II is a blood glucose monitoring system produced by Roche
Diagnostics (Switzerland) and was used in this study to quantitatively measure
blood glucose. Capillary blood was used on test strips with this point of care-
device, the measurements were performed by the nurse on duty. Capillary glucose
measurements were performed 4-times daily (pre-meal and bedtime). Additional
measurements could be performed by the nurse on duty if deemed necessary.
(57)
3.2 Methods
3.2.1 Use of GlucoTab® with insulin degludec
The goal of this study was to evaluate the efficacy and safety of the GlucoTab®
system in combination with the newer ultra-long-acting basal insulin degludec.
This was performed on patients with type 2 diabetes or with newly diagnosed
hyperglycemia requiring subcutaneous insulin therapy in a hospital setting. Insulin
aspart was used as rapid-acting insulin analogue. (2)
27
In order to be able to use the GlucoTab® system with insulin degludec, it had to be
proven that this was a safe and efficient combination that could benefit patients.
Patients that were discharged from the hospital or that ended their participation in
the study were adjusted back to their pre-existing diabetes medication or
potentially received an adjusted treatment plan according to their treating
physicians. After the end of the trial, there were no further consequences for the
patients regarding the study or their therapy.
3.3 Study Objectives and Endpoints
3.3.1 Primary Objective
The main objective of this study was to evaluate the efficacy of the GlucoTab®
system for glycemic management using insulin degludec in non-critically ill
patients with type 2 diabetes at the general ward.
3.3.2 Secondary Objective
To investigate safety, usability, and further efficacy parameters of the
GlucoTab system using insulin degludec
Hypoglycemia rates
Time in target (100-140mg/dl)
Glucose variability as assessed by continuous glucose monitoring
Insulin doses (total, basal, bolus)
3.3.3 Primary Endpoint
The primary endpoint of the study was to calculate the mean percentage of blood
glucose measurements in the target range of 70 - 140 mg/dl, as calculated by all
premeal and bedtime glucose values measured ≥ 24 hours after start of therapy.
28
3.3.4 Secondary Endpoints
Safety
Number of hypoglycemic episodes requiring third party help
Number of blood glucose measurements per day
Number of missed blood glucose measurements per day
Number of additionally required blood glucose measurements
Insulin dose - basal, bolus and corrective insulin dose per day
Number of insulin injections per day
Number and reasons for non-performance of insulin injections per day
Relevant concomitant medication (corticosteroids, parenteral nutrition, oral
hypoglycemic agents)
Usability
Adherence to the insulin dose suggestion of the GlucoTab® system
Efficacy
Mean daily blood glucose as calculated by premeal and bedtime blood
glucose values: Overall and per treatment day
Mean pre-breakfast blood glucose, mean pre-lunch blood glucose, mean
pre-dinner blood glucose, mean bedtime blood glucose
Mean pre-enrolment blood glucose
Number and percentage of the following ranges:
o 0 – <40 mg/dl
o 40 - <70 mg/dl
o 70 - <100 mg/dl
o 100 - <140 mg/dl
o >140 - <180 mg/dl
o 180 - <300 mg/dl
o ≥ 300 mg/dl
Time of glucose measurements (Abbott FreeStyle Libre Pro Flash Glucose
Monitoring System) in the following ranges:
o 0 – <40 mg/dl
29
o 40 - <70 mg/dl
o 70 - <100 mg/dl
o 100 - <140 mg/dl
o >140 - <180 mg/dl
o 180 - <300 mg/dl
o ≥ 300 mg/dl
Based on the secondary endpoints, it can be determined whether the GlucoTab®
system is safe to use for patients and other users, if the system is easily usable,
and if the system is able to bring the blood glucose levels back to an acceptable
range.
3.4 Study Population
The study recruited both male and female patients suffering from type 2 diabetes
or with newly diagnosed hyperglycemia that requires subcutaneous insulin
therapy, regardless of the diagnosis that led to the hospital admission. A total of 30
patients were planned to be included in the study.
3.4.1 Inclusion criteria
The following criteria had to be fulfilled to be eligible for study participation.
Informed consent given by the patients after being informed of the nature
and progression of the study
Patients aged 18 years or older, regardless of gender
A diagnosis of type 2 diabetes (previously treated with diet and/or lifestyle
changes, oral anti-diabetic drugs, non-insulin injected anti-diabetic
medication, insulin therapy or any combination of the four) or newly
diagnosed hyperglycemia requiring subcutaneous insulin therapy
30
3.4.2 Exclusion criteria
If any of these criteria were met, the patients were excluded from study
participation.
Type 1 diabetes or gestational diabetes
Any disease or condition that could potentially interfere with the study trial
or the safety of the patient, as judged by the investigator or treating
physician
Continuous subcutaneous insulin infusion
Extreme hyperglycemic episodes (ketoacidosis, hyperosmolar state) that
would require intravenous insulin therapy
Pregnancy
Mental conditions that lead to incapability of the patient to give consent
Potential or confirmed allergy to insulin degludec or insulin aspart
Continuous parenteral nutrition
Participation in another trial which could potentially influence the software
algorithm
3.5 Study Design
This study was conducted as an open non-controlled, single-center, single-arm
prospective pilot study. It included a total of 30 eligible patients that were
hospitalized at the general ward of the Division of Endocrinology and Diabetology
at the Medical University of Graz who required subcutaneous insulin therapy
regardless of their primary medical conditions and who consented to participate.
The investigational treatment was using the GlucoTab® system with insulin
degludec as the long-acting basal insulin and insulin aspart as bolus insulin
postprandially and to correct elevated blood glucose levels.
31
3.6 Study Procedures
3.6.1 Screening
For every potential admitted patient, a physician went and explained the nature,
purpose and risks of the study and provided the patient with a copy of the patient
information sheet. After informed consent had been obtained and the inclusion and
exclusion criteria have been evaluated, screening information has been obtained.
A patient number was assigned to the patient in ascending order at the ward.
Demography (date of birth, sex, ethnicity), admission diagnosis, medical history,
diabetes history, and diabetes therapy were assessed. Body measurements (body
weight, height, and body mass index (calculated as
²), vital signs
(diastolic and systolic blood pressure, pulse, body temperature), renal function
parameters and routine laboratory parameters (HbA1c, creatinine level, blood
glucose) as recorded in the patient file were documented. A urine pregnancy test
in female participants of childbearing potential was also performed. Patients who
complied with all the inclusion and exclusion criteria were included in the study,
while screened patients who did not comply with all inclusion and exclusion criteria
were not.
3.6.2 Treatment Period
The use of certain OHAs (glinides, sulfonylureas, and glitazones) were stopped,
while metformin, SGLT2-inhibitors, GLP-1 analogues, and DPP-4-inhibitors were
continued under the discretion of the treating physician. Insulin therapy was
adjusted according to the GlucoTab® system with the incorporated software
algorithm. Participants were treated with the GlucoTab® and its integrated
algorithm for basal bolus therapy using insulin degludec and insulin aspart. The
algorithm has been tested previously using insulin glargine and glargine U300 and
has shown to safely establish glycemic control. (1,2)
Insulin therapy prescription for the next 24 hours is suggested once daily by the
GlucoTab® system by taking previous insulin doses, glucose readings, patient
age, renal function, and insulin sensitivity into account. The goal of the GlucoTab®
system is to maintain fasting and pre-meal glucose concentrations between 70 –
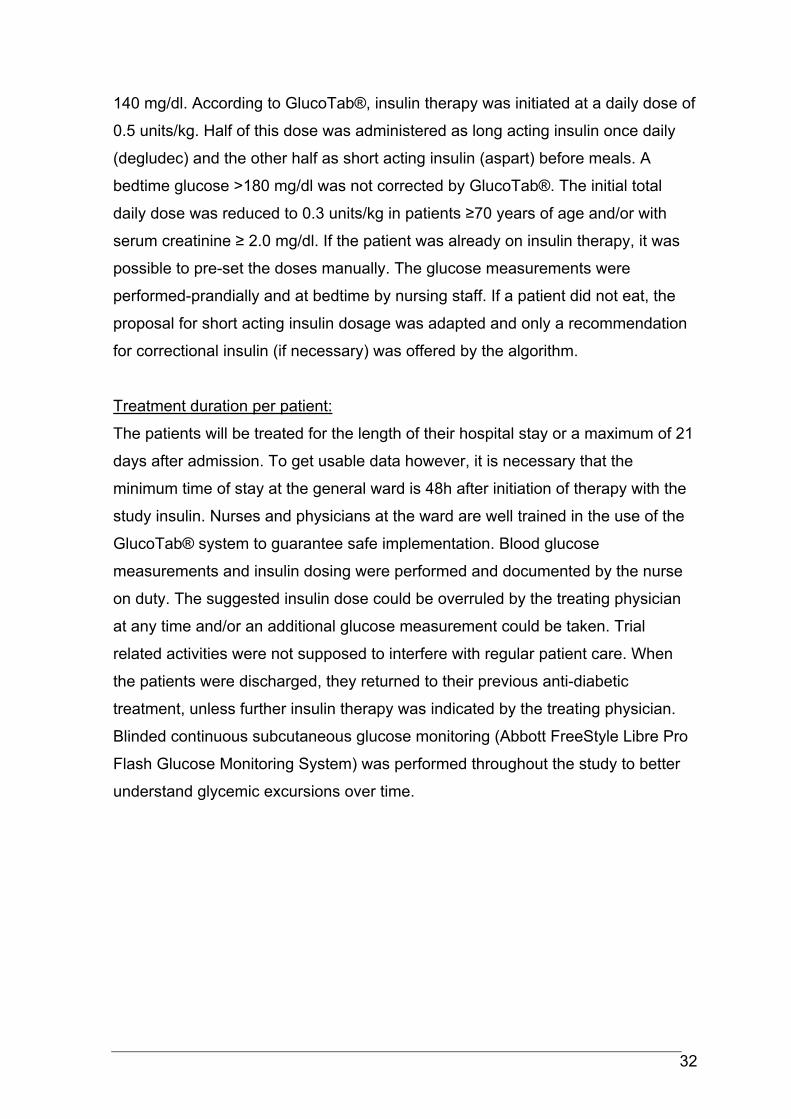
32
140 mg/dl. According to GlucoTab®, insulin therapy was initiated at a daily dose of
0.5 units/kg. Half of this dose was administered as long acting insulin once daily
(degludec) and the other half as short acting insulin (aspart) before meals. A
bedtime glucose >180 mg/dl was not corrected by GlucoTab®. The initial total
daily dose was reduced to 0.3 units/kg in patients ≥70 years of age and/or with
serum creatinine ≥ 2.0 mg/dl. If the patient was already on insulin therapy, it was
possible to pre-set the doses manually. The glucose measurements were
performed-prandially and at bedtime by nursing staff. If a patient did not eat, the
proposal for short acting insulin dosage was adapted and only a recommendation
for correctional insulin (if necessary) was offered by the algorithm.
Treatment duration per patient:
The patients will be treated for the length of their hospital stay or a maximum of 21
days after admission. To get usable data however, it is necessary that the
minimum time of stay at the general ward is 48h after initiation of therapy with the
study insulin. Nurses and physicians at the ward are well trained in the use of the
GlucoTab® system to guarantee safe implementation. Blood glucose
measurements and insulin dosing were performed and documented by the nurse
on duty. The suggested insulin dose could be overruled by the treating physician
at any time and/or an additional glucose measurement could be taken. Trial
related activities were not supposed to interfere with regular patient care. When
the patients were discharged, they returned to their previous anti-diabetic
treatment, unless further insulin therapy was indicated by the treating physician.
Blinded continuous subcutaneous glucose monitoring (Abbott FreeStyle Libre Pro
Flash Glucose Monitoring System) was performed throughout the study to better
understand glycemic excursions over time.
33
Table 4: Trial Flow Chart
Visit No. 1 2 3
Visit Name Screening Study Treatment Discharge
Informed consent X
In/Exclusion criteria X
Demography X
Admission diagnosis X
Diagnosis of diabetes X
Concomitant diagnosis X
Withdrawal criteria X
Body measurements (body
weight, height, BMI) X
Vital signs X
Pregnancy test X
Rout. laboratory assessment
(creatinine, HbA1c) X
Blood glucose (capillary) X X
Glucose sensor insertion X
Continuous glucose monitoring X
Glucose sensor removal X
Adverse events X
Concomitant medication X
Diabetes therapy X X X
Usability parameters X X X
End of trial X
3.6.3 Withdrawal of individual patients
In accordance with the Declaration of Helsinki and other applicable regulations, a
patient has the right to withdraw from the study at any time and for any reason
without prejudice to their future medical care by the physician or at the institution.
The patient will receive the same medical care than before their entrance in the
34
study. Patients who drop out will be replaced until a total of 30 evaluable patients
is achieved.
Specific criteria for withdrawal:
Patients may be removed from the study if any of the following events occur
Significant protocol violation or non-compliance
Refusal of the patient to continue treatment and/or observations
Decision by the investigator or treating physician that termination is in the
patient’s best medical interest
3.7 Assessments
3.7.1 Blood glucose measurements
Capillary blood glucose was analyzed using a point of care device (AccuChek®
Inform, Roche Diabetes Care). No extra training for the use of the bedside blood
glucose analyzers was needed since those were already in use at the study site.
The measurement was taken by the nurse on duty. Blood glucose was analyzed
four times a day (pre-meal and bedtime). If a patient did not eat, the suggestion for
bolus insulin dosage was adapted and only a recommendation for correctional
insulin (if necessary) was offered by the algorithm.
3.7.2 Insulin dose
The insulin dose was derived from the individual insulin need, was determined by
the GlucoTab® system, and was documented in the system and on the source
data form of the patient.
3.7.3 Vital Signs
The following vital signs were measured routinely and documented at the ward
Diastolic and systolic blood pressure (mmHg)
Heart rate (beats per min) and body temperature (°C).
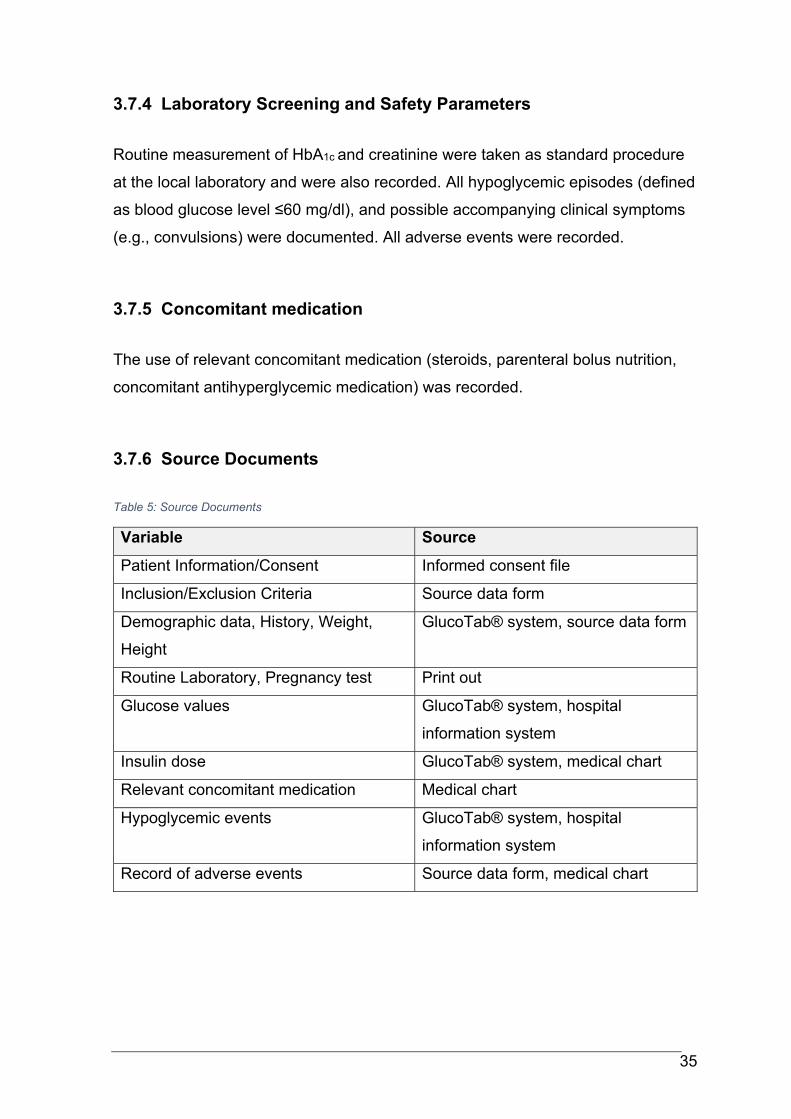
35
3.7.4 Laboratory Screening and Safety Parameters
Routine measurement of HbA1c and creatinine were taken as standard procedure
at the local laboratory and were also recorded. All hypoglycemic episodes (defined
as blood glucose level ≤60 mg/dl), and possible accompanying clinical symptoms
(e.g., convulsions) were documented. All adverse events were recorded.
3.7.5 Concomitant medication
The use of relevant concomitant medication (steroids, parenteral bolus nutrition,
concomitant antihyperglycemic medication) was recorded.
3.7.6 Source Documents
Table 5: Source Documents
Variable Source
Patient Information/Consent Informed consent file
Inclusion/Exclusion Criteria Source data form
Demographic data, History, Weight,
Height
GlucoTab® system, source data form
Routine Laboratory, Pregnancy test Print out
Glucose values GlucoTab® system, hospital
information system
Insulin dose GlucoTab® system, medical chart
Relevant concomitant medication Medical chart
Hypoglycemic events GlucoTab® system, hospital
information system
Record of adverse events Source data form, medical chart
36
4 Safety Reporting
4.1 Adverse events / Adverse device effects
Hypoglycemic episodes without third party help that occur during the observation
were not recorded as adverse events since they were corrected as part of the
study procedures. Adverse events (AEs) are defined as any undesirable
experience occurring to a subject during a clinical trial, whether or not considered
related to the method under investigation. An adverse device effect (ADE) is an
AE that is (possibly or probably) related to the use of a medical device. All AEs /
ADEs reported spontaneously by the subject or observed by the investigator or
their staff were recorded. Hyperglycemic episodes were documented in the CRF,
but not in the adverse events section.
4.2 Serious adverse events / Serious adverse device effects
A serious adverse event (SAE) is any unwanted medical occurrence or effect that
results in death regardless of the dose
is life threatening (at the time of the event)
requires hospitalization or prolongation of existing inpatients’ hospitalization
results in persistent or significant disability or incapacity
is a congenital anomaly or birth defect
is a new event of the trial likely to affect the safety of the subjects, such as
an unexpected outcome of an adverse reaction.
A serious adverse device effect (SADE) is an ADE that
shows a (possible or probable) relationship to the investigational device
AND
has resulted in one or more criteria characteristic of a SAE OR
might have led to one or more criteria characteristic of a SAE
o if suitable action had not been taken OR
o if intervention had been made OR
o if circumstances had been less fortunate.
37
All SAEs and SADEs had to be reported, all adverse events were followed up on
throughout the course of the clinical trial.
4.3 Data Management
The investigator had to ensure the accuracy, completeness, legibility, and
timeliness of data reported in the GlucoTab® system, the eCRF and all required
reports. Any change or correction had to be dated, initialed, and explained (if
necessary), while leaving the original entry unobscured (for both written and
electronic changes). Data reported on the eCRF that are derived from source
documents had to be consistent with the source documents, in case of any
discrepancies, they had to be explained. The eCRF within the application Phoenix
Clinical Trial Management Software (www. phoenixctms.org), which was
developed at the Medical University of Graz, was used.
All data management procedures were detailed in a separate specifically identified
document known as the Data Management Plan (DMP).
4.3.1 Data Collection
The investigator had to maintain required records for all study subjects. Data for
this study was recorded in the GlucoTab® system, the subject's source data form
and on electronic Case Report Forms (eCRFs). Data in the eCRF were
documented anonymously to protect personal data.
Allocation of subject numbers:
Division of Endocrinology and Diabetology: E-201, E-202, etc.
38
4.3.2 Source documentation
Investigators had to keep accurate separate records of all subjects' visits, making
sure to include all pertinent study related information. A statement was issued
indicating that the subjects have been enrolled in this clinical study and have
provided written Informed Consent. Any adverse events were thoroughly
documented.
4.4 Quality Control and Quality Assurance
4.4.1 Personnel training
4.4.1.1 Study-related training
Prior to enrolling any participants, an initiation visit was conducted. Key personnel
such as the study coordinator, investigators or other applicable personnel attended
this visit. During this meeting, participants were briefed about the protocol, study
specific procedures, source data forms and eCRF. Additionally, all study related
staff documented in the “Log-of-staff” sheet were trained in all study related
procedures by the study coordinator. All clinical staff must provide certified
knowledge in GCP. The study training has been recorded as part of the Trial
Master File. The study was performed according to Good Clinical Practice and the
Declaration of Helsinki.
4.4.1.2 Investigational product related training
The intended workflow of the GlucoTab system was presented to the end users,
including the main operation functions and how to use the GlucoTab® system to
perform blood glucose management.
4.4.2 Recruitment and consent
It was the responsibility of the investigator to obtain oral and written informed
consent. In obtaining and documenting informed consent, the investigator had to
39
comply with applicable regulatory documents and adhere to the ICH- GCP
guidelines and to the requirements in the Declaration of Helsinki. The investigator
had to fully inform (orally and written) the participants of all aspects of the
observation study.
All patients had to be fully informed about the study, in language and terms they
were able to understand. Prior to a patient’s participation, the written informed
consent form had to be signed and personally dated by the patient and by the
person who conducted the informed consent discussion. A copy of the signed and
dated written informed consent form was provided to the patient.
4.4.3 Insurance
Insurance for all patients included in the study was contracted.
5 Statistical Analysis
5.1 Analysis principles
All analyses were conducted on an intention-to-treat basis.
Missing values were not put in unless specified otherwise.
P-values were not adjusted for multiplicativity
5.2 Study Hypothesis
We expected the mean percentage of blood glucose measurements in the target
range 70 to 140 mg/dl to be greater than the criterion value of 42%.
Results of a current clinical trial showed that the percentages of glucose readings
within the target range between 70 and 140 mg/dL were achieved in 42% of the
BG measurements using a basal-bolus algorithm. (58)
40
5.3 Statistical Methods
The statistical analysis was performed after all the completed, corrected and
amended case report forms and data from the GlucoTab® system are available.
For numerical parameters, means ± standard deviations or medians and
interquartile ranges were used to describe the outcome data. For categorical data,
proportions were used to describe the outcome data. Results were presented
graphically when it was possible.
Primary analysis:
For the primary analysis, let pi denote the percentage that, for the i-th subject, a
premeal or bedtime blood glucose value measured ≥ 24 hours after start of
therapy is in the target range 70 to 140 mg/dl. Furthermore, let us assume a
population mean p and a standard deviation σ such that pi ~ N(p,σ). Then the
above test problem can be stated as: H0: p ≤ 42; H1: p > 42.
The unknown parameter pi can be estimated as p̂i= ni /Ni * 100, where:
ni is the number of blood glucose (BG) values of the i-th subject in the target
range 70 to 140 mg/dl (restricted to BG measurements ≥ 24 hours after
start of therapy)
Ni is the total number of BG values of the i-th subject (restricted to
measurements ≥ 24 hours after start of therapy).
To estimate the population mean p, we computed a weighted mean with the total
number of BG measurements Ni as weights: p̂ = 1/N * ∑ p̂iNi = 1/N ∑ ni, with
N=N1+…+NI. Therefore, to test whether the population mean p exceeds the
criterion value 42, we applied a one-sample t-test, weighted by the total number of
BG measurements per subject. The level of significance was set to 5%.
Explorative analyses:
All secondary parameters will be analyzed by descriptive statistical methods.
Exploratory statistical analyses will be performed. The level of significance will be
set to 5% in all explorative analyses. A detailed description of the statistical
41
analysis will be presented in the statistical analysis plan (SAP), which will be
finalized prior to data analysis.
5.4 Sample size calculations
The sample size calculation is based on results of the ClinDiab-04 trial
(NCT01932775), where the GlucoTab system was used to guide the glycemic
management process on four different general wards in the Departments of
Internal Medicine and Surgery. For patients at the Division of Endocrinology and
Metabolism, the mean percentage of blood glucose measurements in the target
range 70 to 140 mg/dl was equal to 52.3 ± 20.7. (1)
As opposed to the ClinDiab-04 trial (where insulin glargine was used as basal
insulin), the novel ultra-long-acting basal insulin degludec was used. It was
assumed that insulin degludec leads to comparable glycemic control with reduced
rates of hypoglycemia. Thus, for sample size calculation, we assumed that the
weighted estimate of the population mean p is equal to 52.3 ± 20.7.
A one-tailed one-sample t-test, weighted by the total number of BG measurements
per subject, with a significance of 5% and a power of 80% would require a total of
27 patients to appropriately test the study hypothesis.
It is important to note here that, in calculating the primary endpoint, only the blood
glucose measurements were considered that were taken ≥ 24 hours after the
initiation of therapy. To make sure that the calculation of the primary endpoint was
based on the blood glucose data of at least 27 patients, the total number of
patients was increased to 30.
Sample size calculation was performed by using SAS 9.2
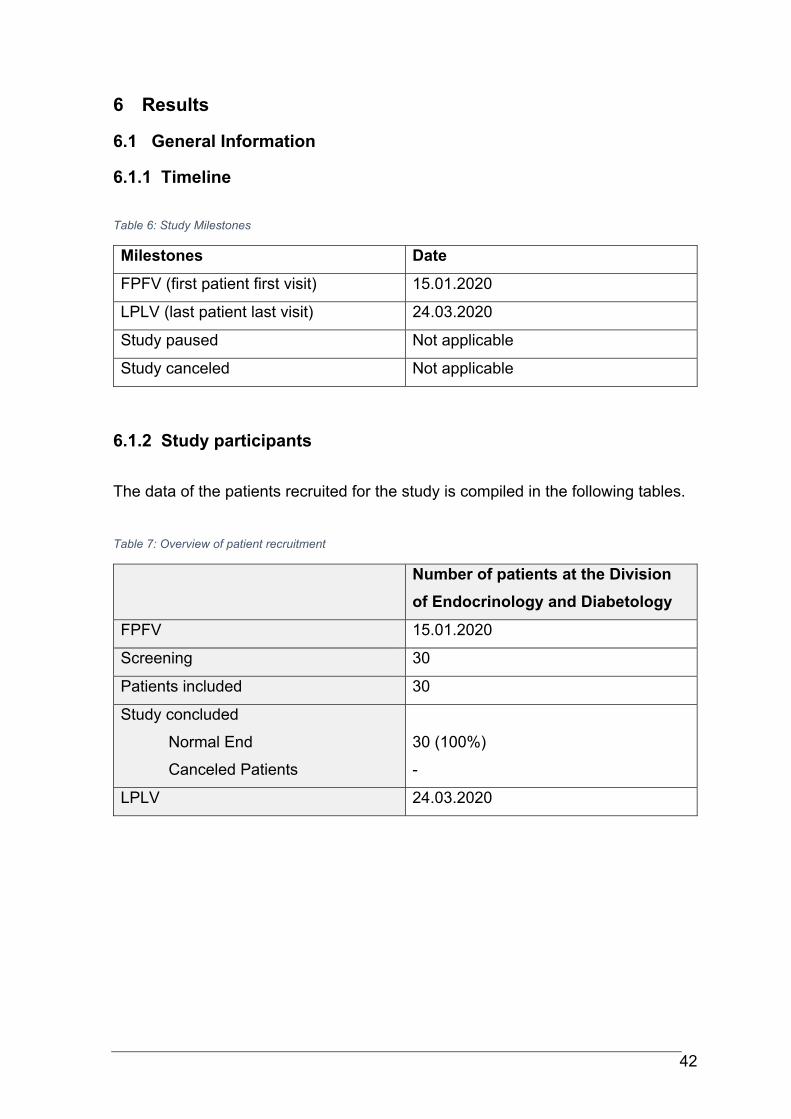
42
6 Results
6.1 General Information
6.1.1 Timeline
Table 6: Study Milestones
Milestones Date
FPFV (first patient first visit) 15.01.2020
LPLV (last patient last visit) 24.03.2020
Study paused Not applicable
Study canceled Not applicable
6.1.2 Study participants
The data of the patients recruited for the study is compiled in the following tables.
Table 7: Overview of patient recruitment
Number of patients at the Division
of Endocrinology and Diabetology
FPFV 15.01.2020
Screening 30
Patients included 30
Study concluded
Normal End
Canceled Patients
30 (100%)
-
LPLV 24.03.2020
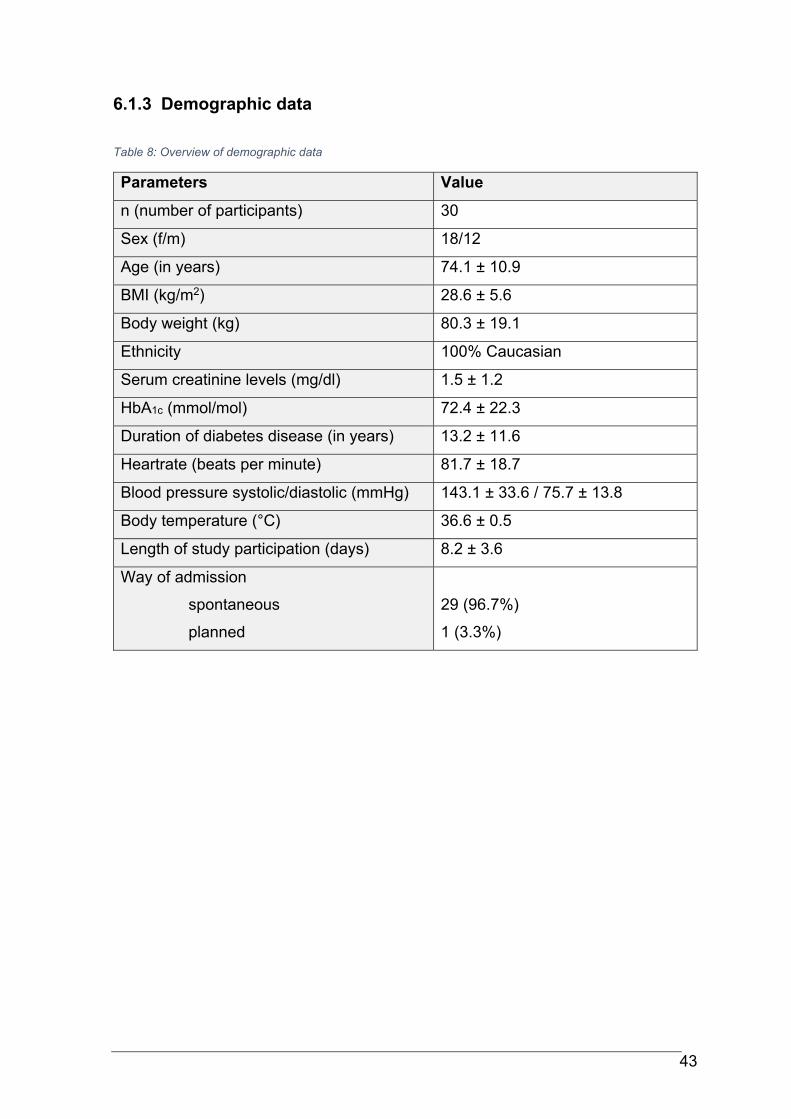
43
6.1.3 Demographic data
Table 8: Overview of demographic data
Parameters Value
n (number of participants) 30
Sex (f/m) 18/12
Age (in years) 74.1 ± 10.9
BMI (kg/m2) 28.6 ± 5.6
Body weight (kg) 80.3 ± 19.1
Ethnicity 100% Caucasian
Serum creatinine levels (mg/dl) 1.5 ± 1.2
HbA1c (mmol/mol) 72.4 ± 22.3
Duration of diabetes disease (in years) 13.2 ± 11.6
Heartrate (beats per minute) 81.7 ± 18.7
Blood pressure systolic/diastolic (mmHg) 143.1 ± 33.6 / 75.7 ± 13.8
Body temperature (°C) 36.6 ± 0.5
Length of study participation (days) 8.2 ± 3.6
Way of admission
spontaneous
planned
29 (96.7%)
1 (3.3%)
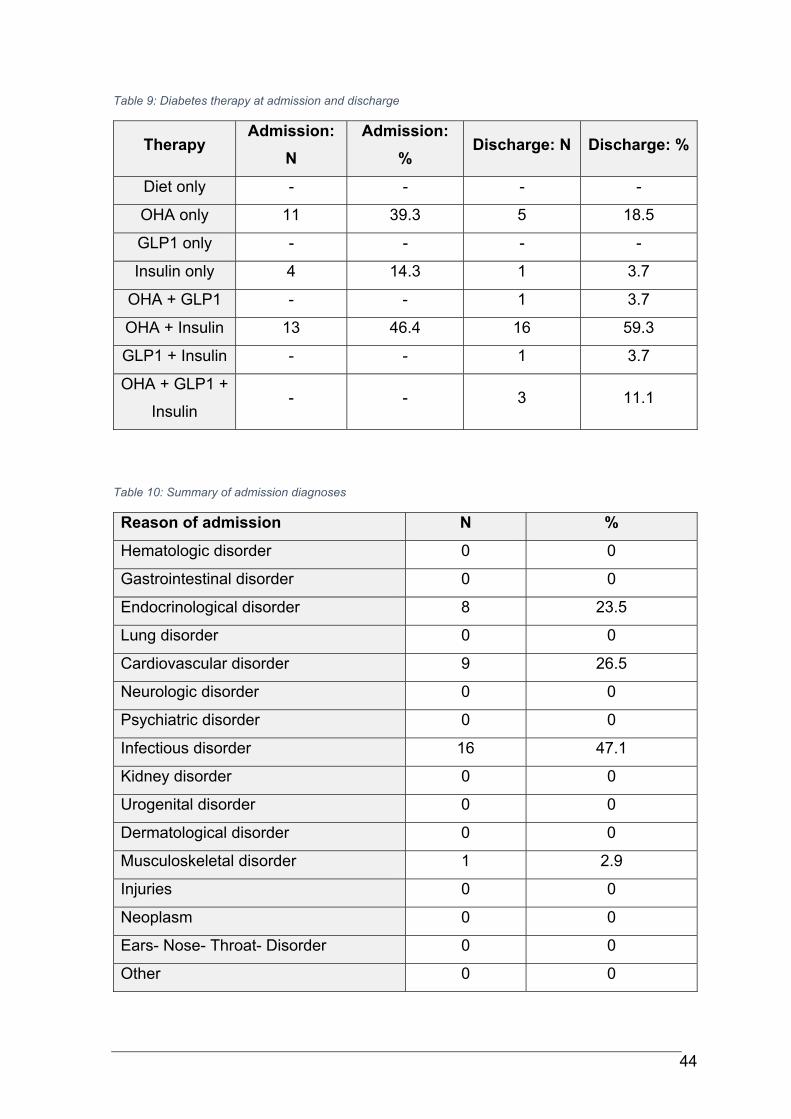
44
Table 9: Diabetes therapy at admission and discharge
Therapy Admission:
N
Admission:
% Discharge: N Discharge: %
Diet only - - - -
OHA only 11 39.3 5 18.5
GLP1 only - - - -
Insulin only 4 14.3 1 3.7
OHA + GLP1 - - 1 3.7
OHA + Insulin 13 46.4 16 59.3
GLP1 + Insulin - - 1 3.7
OHA + GLP1 +
Insulin - - 3 11.1
Table 10: Summary of admission diagnoses
Reason of admission N %
Hematologic disorder 0 0
Gastrointestinal disorder 0 0
Endocrinological disorder 8 23.5
Lung disorder 0 0
Cardiovascular disorder 9 26.5
Neurologic disorder 0 0
Psychiatric disorder 0 0
Infectious disorder 16 47.1
Kidney disorder 0 0
Urogenital disorder 0 0
Dermatological disorder 0 0
Musculoskeletal disorder 1 2.9
Injuries 0 0
Neoplasm 0 0
Ears- Nose- Throat- Disorder 0 0
Other 0 0
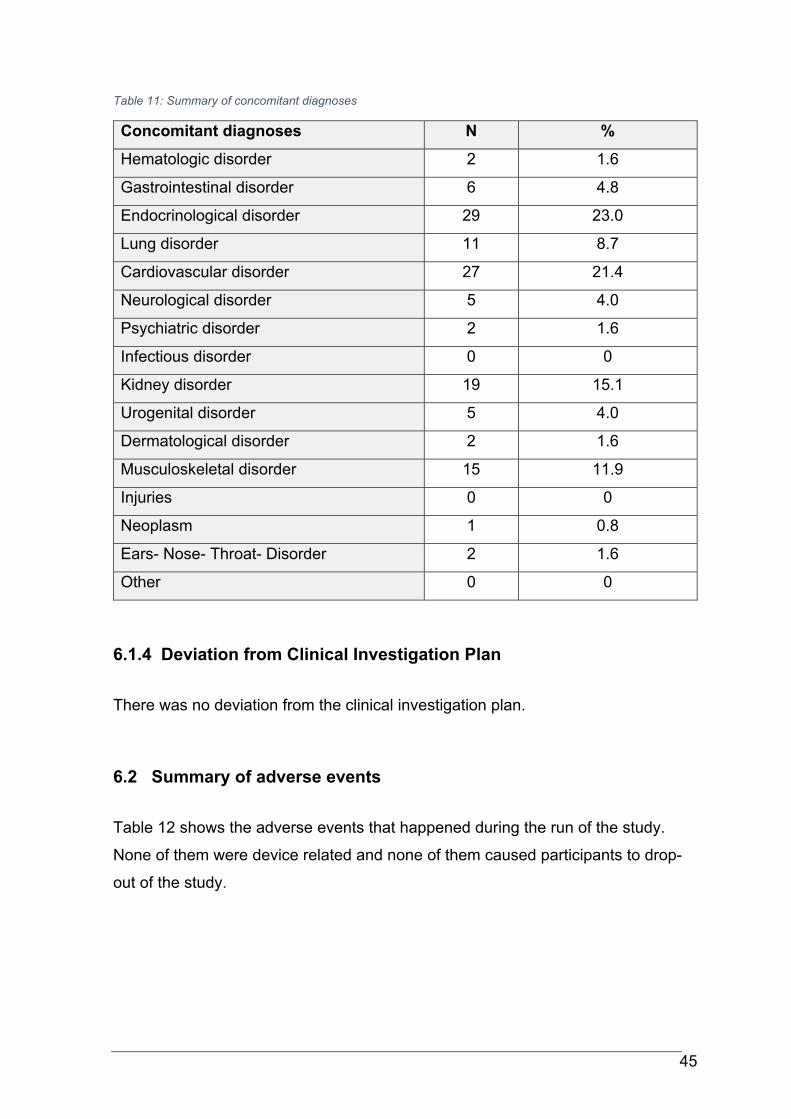
45
Table 11: Summary of concomitant diagnoses
Concomitant diagnoses N %
Hematologic disorder 2 1.6
Gastrointestinal disorder 6 4.8
Endocrinological disorder 29 23.0
Lung disorder 11 8.7
Cardiovascular disorder 27 21.4
Neurological disorder 5 4.0
Psychiatric disorder 2 1.6
Infectious disorder 0 0
Kidney disorder 19 15.1
Urogenital disorder 5 4.0
Dermatological disorder 2 1.6
Musculoskeletal disorder 15 11.9
Injuries 0 0
Neoplasm 1 0.8
Ears- Nose- Throat- Disorder 2 1.6
Other 0 0
6.1.4 Deviation from Clinical Investigation Plan
There was no deviation from the clinical investigation plan.
6.2 Summary of adverse events
Table 12 shows the adverse events that happened during the run of the study.
None of them were device related and none of them caused participants to drop-
out of the study.
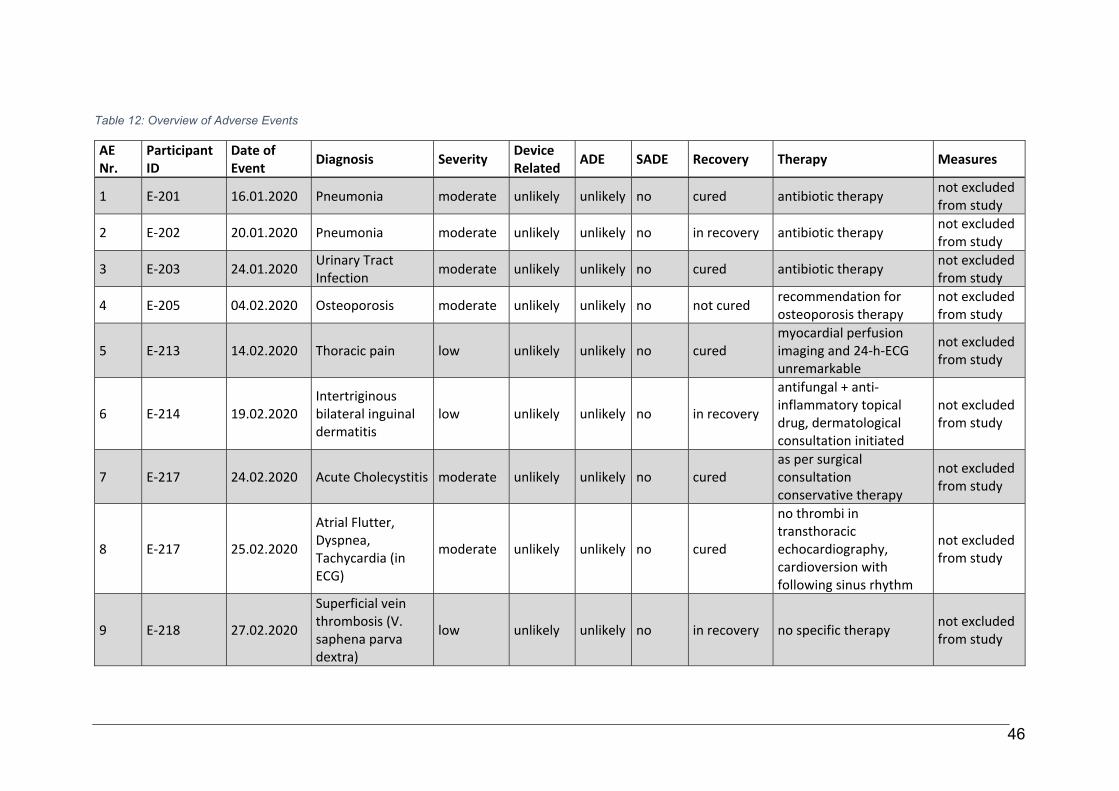
46
Table 12: Overview of Adverse Events
AE Nr.
Participant ID
Date of Event Diagnosis Severity Device
Related ADE SADE Recovery Therapy Measures
1 E‐201 16.01.2020 Pneumonia moderate unlikely unlikely no cured antibiotic therapy not excluded from study
2 E‐202 20.01.2020 Pneumonia moderate unlikely unlikely no in recovery antibiotic therapy not excluded from study
3 E‐203 24.01.2020 Urinary Tract Infection
moderate unlikely unlikely no cured antibiotic therapy not excluded from study
4 E‐205 04.02.2020 Osteoporosis moderate unlikely unlikely no not cured recommendation for osteoporosis therapy
not excluded from study
5 E‐213 14.02.2020 Thoracic pain low unlikely unlikely no cured myocardial perfusion imaging and 24‐h‐ECG unremarkable
not excluded from study
6 E‐214 19.02.2020 Intertriginous bilateral inguinal dermatitis
low unlikely unlikely no in recovery
antifungal + anti‐inflammatory topical drug, dermatological consultation initiated
not excluded from study
7 E‐217 24.02.2020 Acute Cholecystitis moderate unlikely unlikely no cured as per surgical consultation conservative therapy
not excluded from study
8 E‐217 25.02.2020
Atrial Flutter, Dyspnea, Tachycardia (in ECG)
moderate unlikely unlikely no cured
no thrombi in transthoracic echocardiography, cardioversion with following sinus rhythm
not excluded from study
9 E‐218 27.02.2020
Superficial vein thrombosis (V. saphena parva dextra)
low unlikely unlikely no in recovery no specific therapy not excluded from study
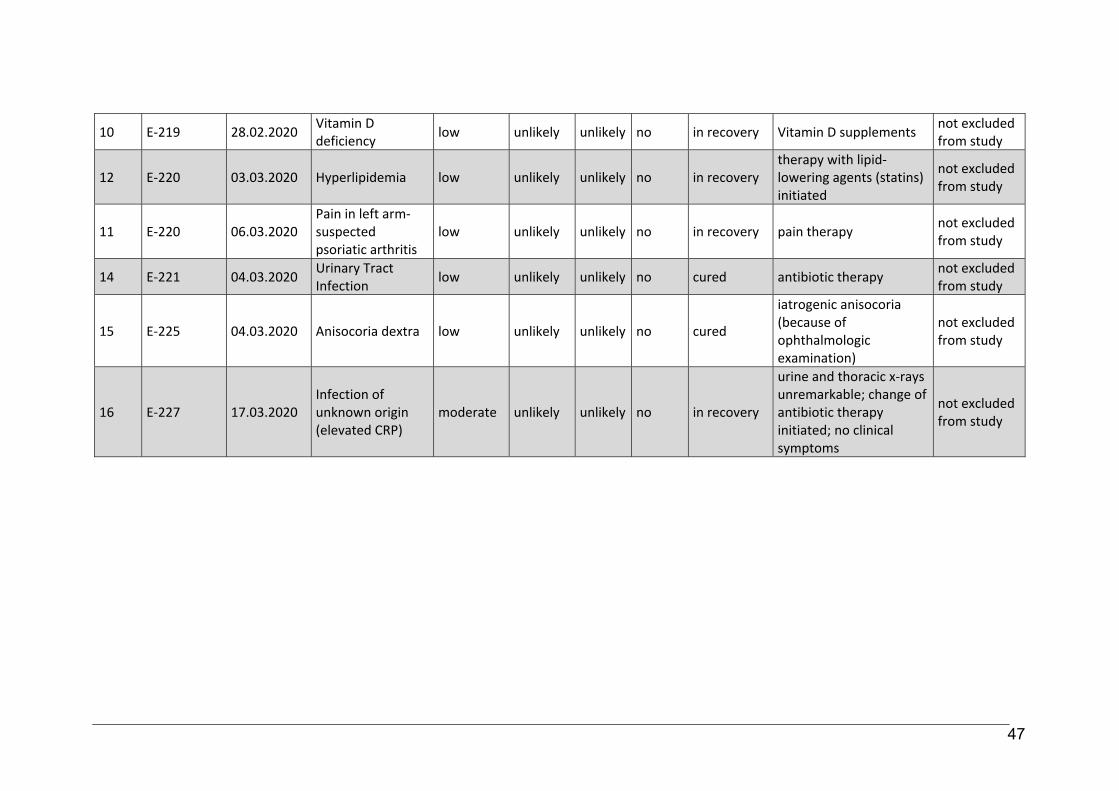
47
10 E‐219 28.02.2020 Vitamin D deficiency
low unlikely unlikely no in recovery Vitamin D supplements not excluded from study
12 E‐220 03.03.2020 Hyperlipidemia low unlikely unlikely no in recovery therapy with lipid‐lowering agents (statins) initiated
not excluded from study
11 E‐220 06.03.2020 Pain in left arm‐ suspected psoriatic arthritis
low unlikely unlikely no in recovery pain therapy not excluded from study
14 E‐221 04.03.2020 Urinary Tract Infection
low unlikely unlikely no cured antibiotic therapy not excluded from study
15 E‐225 04.03.2020 Anisocoria dextra low unlikely unlikely no cured
iatrogenic anisocoria (because of ophthalmologic examination)
not excluded from study
16 E‐227 17.03.2020 Infection of unknown origin (elevated CRP)
moderate unlikely unlikely no in recovery
urine and thoracic x‐rays unremarkable; change of antibiotic therapy initiated; no clinical symptoms
not excluded from study
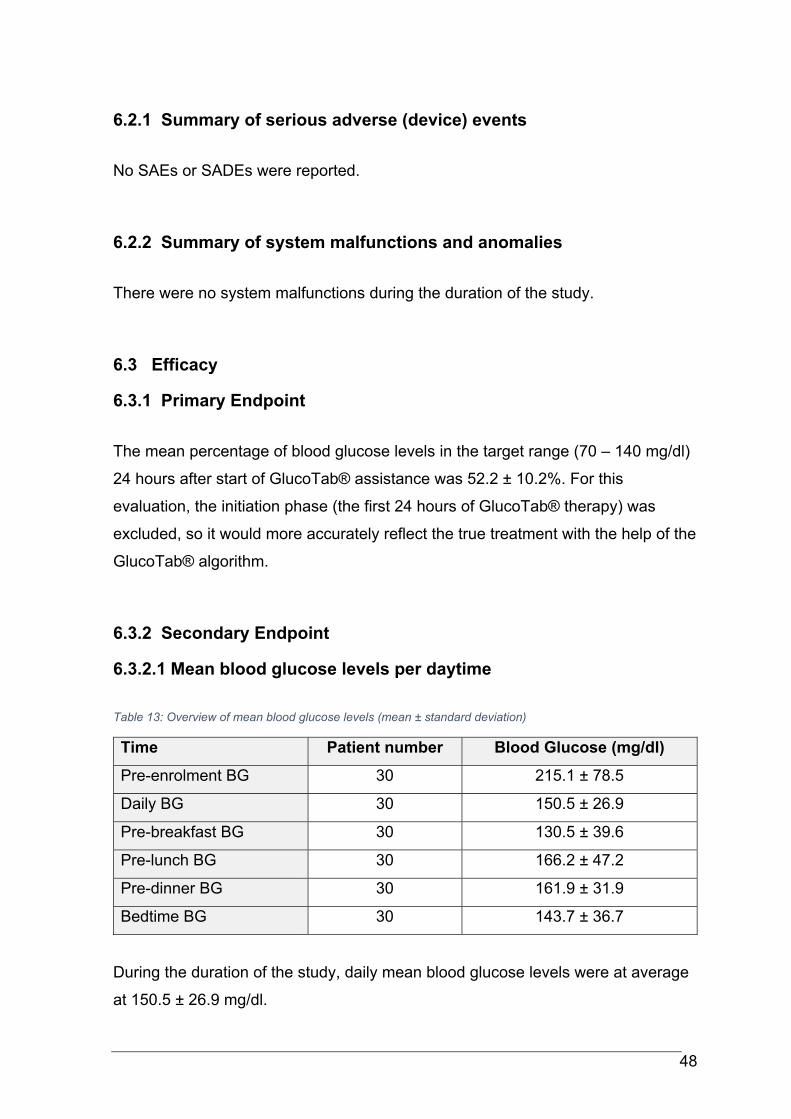
48
6.2.1 Summary of serious adverse (device) events
No SAEs or SADEs were reported.
6.2.2 Summary of system malfunctions and anomalies
There were no system malfunctions during the duration of the study.
6.3 Efficacy
6.3.1 Primary Endpoint
The mean percentage of blood glucose levels in the target range (70 – 140 mg/dl)
24 hours after start of GlucoTab® assistance was 52.2 ± 10.2%. For this
evaluation, the initiation phase (the first 24 hours of GlucoTab® therapy) was
excluded, so it would more accurately reflect the true treatment with the help of the
GlucoTab® algorithm.
6.3.2 Secondary Endpoint
6.3.2.1 Mean blood glucose levels per daytime
Table 13: Overview of mean blood glucose levels (mean ± standard deviation)
Time Patient number Blood Glucose (mg/dl)
Pre-enrolment BG 30 215.1 ± 78.5
Daily BG 30 150.5 ± 26.9
Pre-breakfast BG 30 130.5 ± 39.6
Pre-lunch BG 30 166.2 ± 47.2
Pre-dinner BG 30 161.9 ± 31.9
Bedtime BG 30 143.7 ± 36.7
During the duration of the study, daily mean blood glucose levels were at average
at 150.5 ± 26.9 mg/dl.
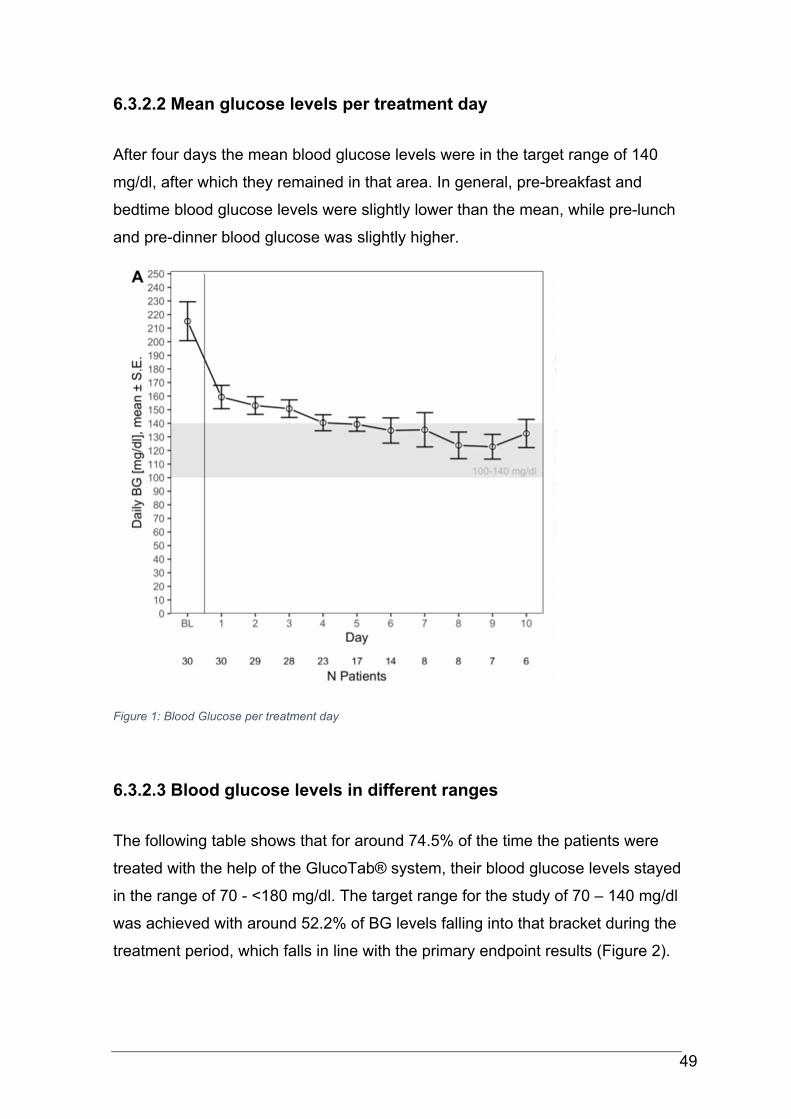
49
6.3.2.2 Mean glucose levels per treatment day
After four days the mean blood glucose levels were in the target range of 140
mg/dl, after which they remained in that area. In general, pre-breakfast and
bedtime blood glucose levels were slightly lower than the mean, while pre-lunch
and pre-dinner blood glucose was slightly higher.
Figure 1: Blood Glucose per treatment day
6.3.2.3 Blood glucose levels in different ranges
The following table shows that for around 74.5% of the time the patients were
treated with the help of the GlucoTab® system, their blood glucose levels stayed
in the range of 70 - <180 mg/dl. The target range for the study of 70 – 140 mg/dl
was achieved with around 52.2% of BG levels falling into that bracket during the
treatment period, which falls in line with the primary endpoint results (Figure 2).
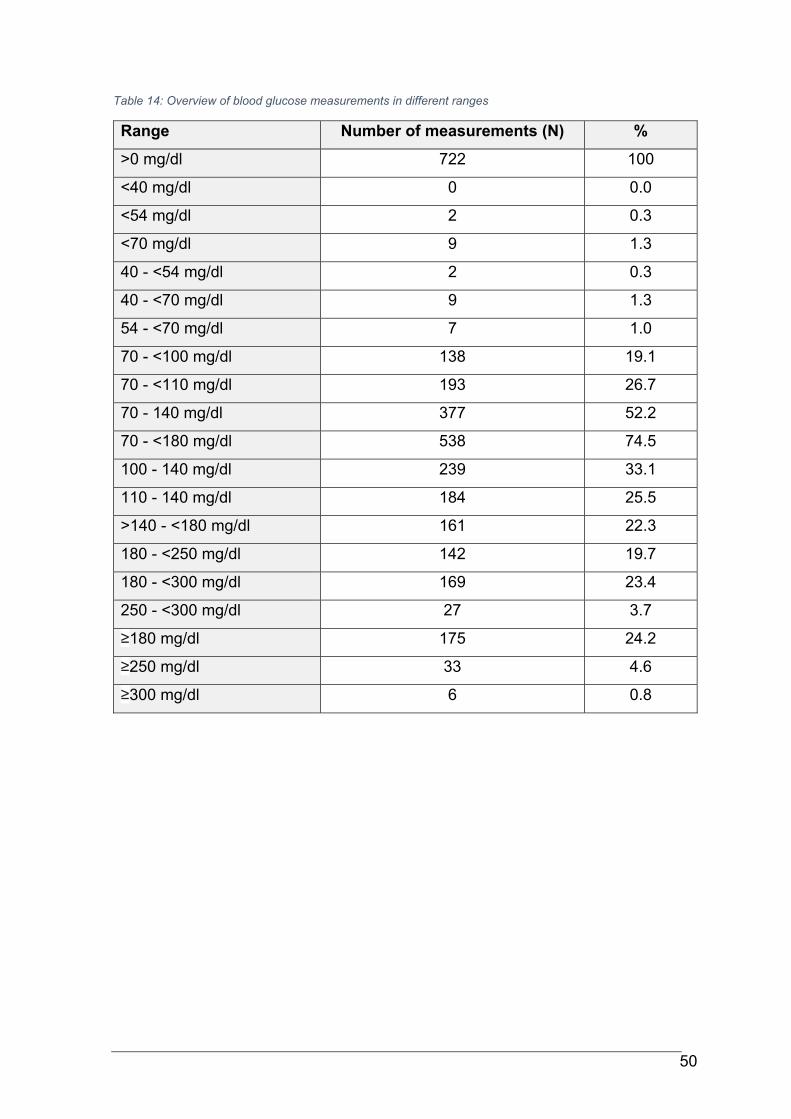
50
Table 14: Overview of blood glucose measurements in different ranges
Range Number of measurements (N) %
>0 mg/dl 722 100
<40 mg/dl 0 0.0
<54 mg/dl 2 0.3
<70 mg/dl 9 1.3
40 - <54 mg/dl 2 0.3
40 - <70 mg/dl 9 1.3
54 - <70 mg/dl 7 1.0
70 - <100 mg/dl 138 19.1
70 - <110 mg/dl 193 26.7
70 - 140 mg/dl 377 52.2
70 - <180 mg/dl 538 74.5
100 - 140 mg/dl 239 33.1
110 - 140 mg/dl 184 25.5
>140 - <180 mg/dl 161 22.3
180 - <250 mg/dl 142 19.7
180 - <300 mg/dl 169 23.4
250 - <300 mg/dl 27 3.7
≥180 mg/dl 175 24.2
≥250 mg/dl 33 4.6
≥300 mg/dl 6 0.8
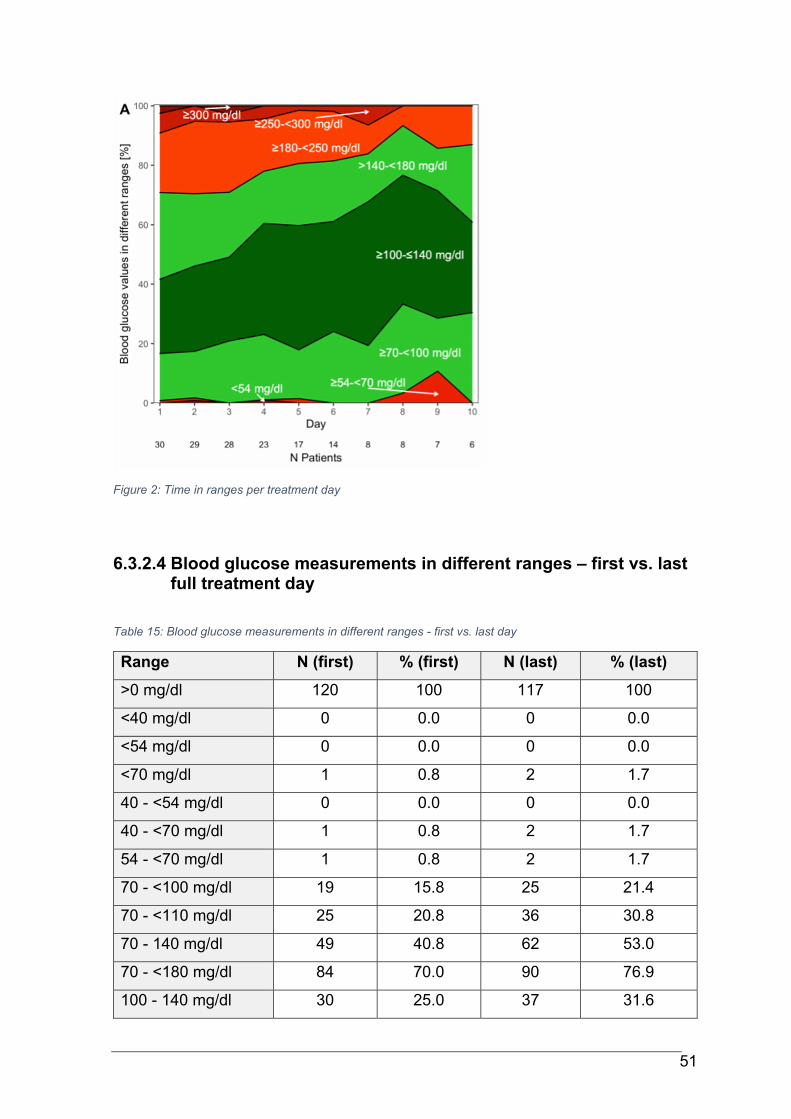
51
Figure 2: Time in ranges per treatment day
6.3.2.4 Blood glucose measurements in different ranges – first vs. last full treatment day
Table 15: Blood glucose measurements in different ranges - first vs. last day
Range N (first) % (first) N (last) % (last)
>0 mg/dl 120 100 117 100
<40 mg/dl 0 0.0 0 0.0
<54 mg/dl 0 0.0 0 0.0
<70 mg/dl 1 0.8 2 1.7
40 - <54 mg/dl 0 0.0 0 0.0
40 - <70 mg/dl 1 0.8 2 1.7
54 - <70 mg/dl 1 0.8 2 1.7
70 - <100 mg/dl 19 15.8 25 21.4
70 - <110 mg/dl 25 20.8 36 30.8
70 - 140 mg/dl 49 40.8 62 53.0
70 - <180 mg/dl 84 70.0 90 76.9
100 - 140 mg/dl 30 25.0 37 31.6
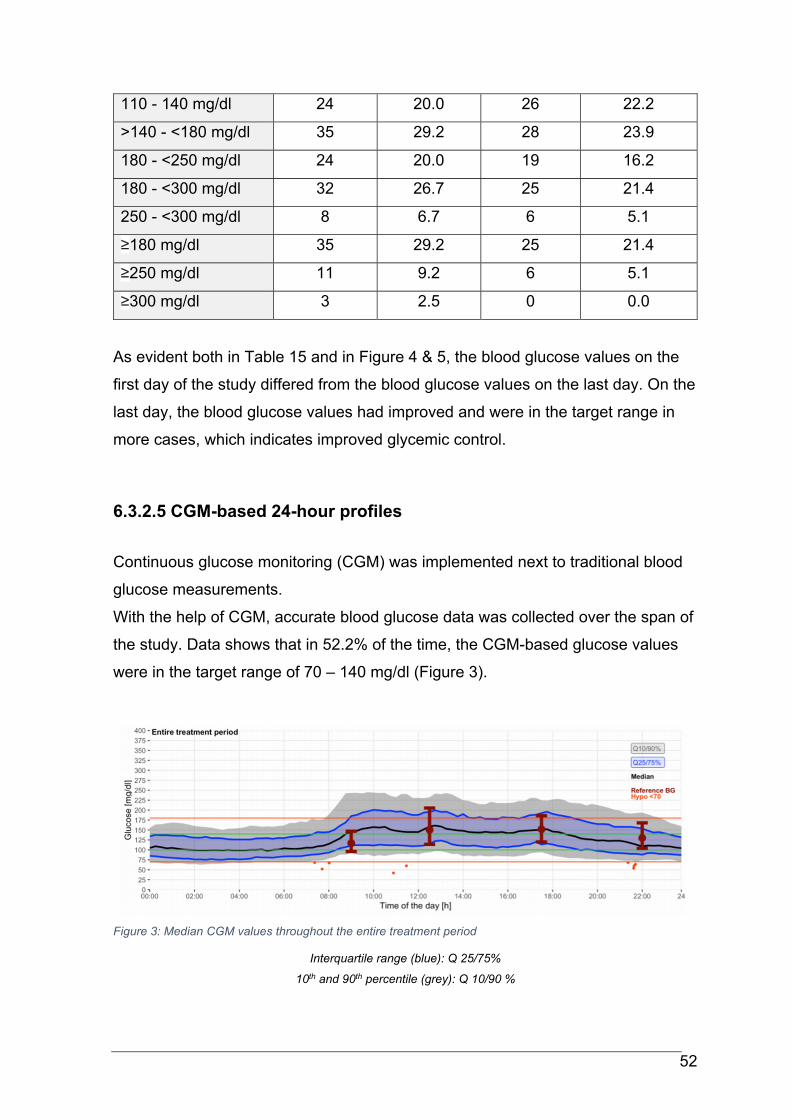
52
110 - 140 mg/dl 24 20.0 26 22.2
>140 - <180 mg/dl 35 29.2 28 23.9
180 - <250 mg/dl 24 20.0 19 16.2
180 - <300 mg/dl 32 26.7 25 21.4
250 - <300 mg/dl 8 6.7 6 5.1
≥180 mg/dl 35 29.2 25 21.4
≥250 mg/dl 11 9.2 6 5.1
≥300 mg/dl 3 2.5 0 0.0
As evident both in Table 15 and in Figure 4 & 5, the blood glucose values on the
first day of the study differed from the blood glucose values on the last day. On the
last day, the blood glucose values had improved and were in the target range in
more cases, which indicates improved glycemic control.
6.3.2.5 CGM-based 24-hour profiles
Continuous glucose monitoring (CGM) was implemented next to traditional blood
glucose measurements.
With the help of CGM, accurate blood glucose data was collected over the span of
the study. Data shows that in 52.2% of the time, the CGM-based glucose values
were in the target range of 70 – 140 mg/dl (Figure 3).
Figure 3: Median CGM values throughout the entire treatment period
Interquartile range (blue): Q 25/75%
10th and 90th percentile (grey): Q 10/90 %
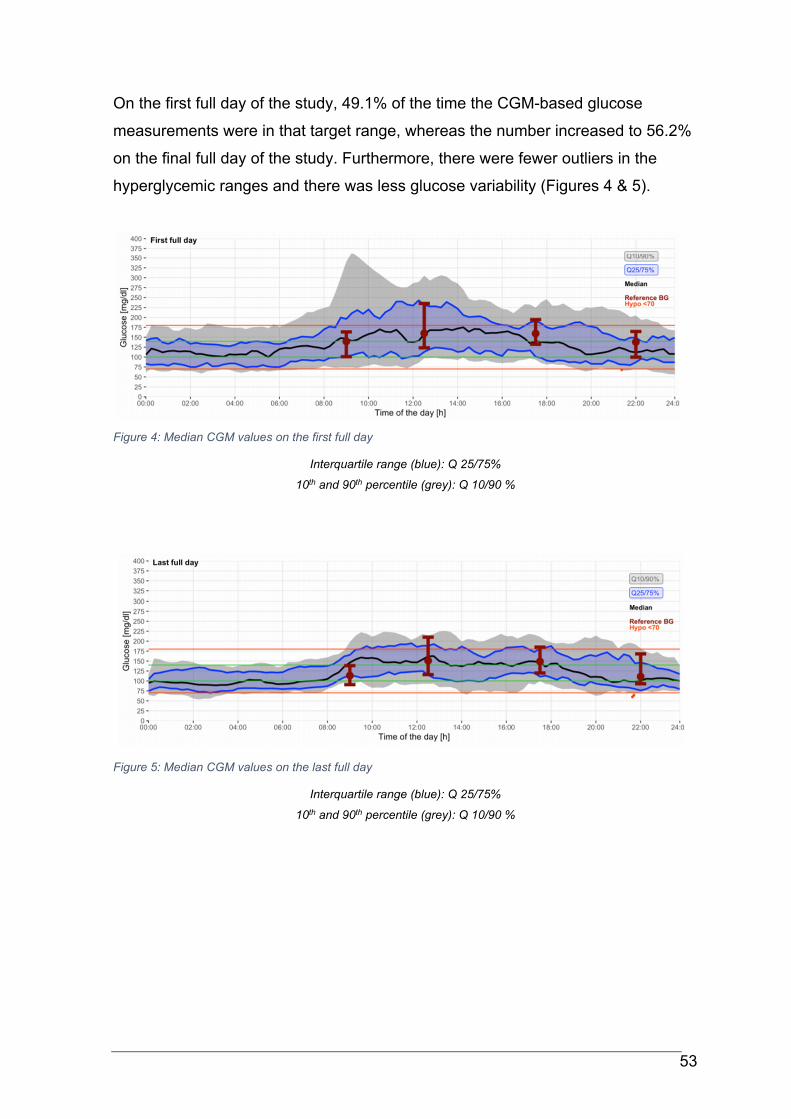
53
On the first full day of the study, 49.1% of the time the CGM-based glucose
measurements were in that target range, whereas the number increased to 56.2%
on the final full day of the study. Furthermore, there were fewer outliers in the
hyperglycemic ranges and there was less glucose variability (Figures 4 & 5).
Figure 4: Median CGM values on the first full day
Interquartile range (blue): Q 25/75%
10th and 90th percentile (grey): Q 10/90 %
Figure 5: Median CGM values on the last full day
Interquartile range (blue): Q 25/75%
10th and 90th percentile (grey): Q 10/90 %
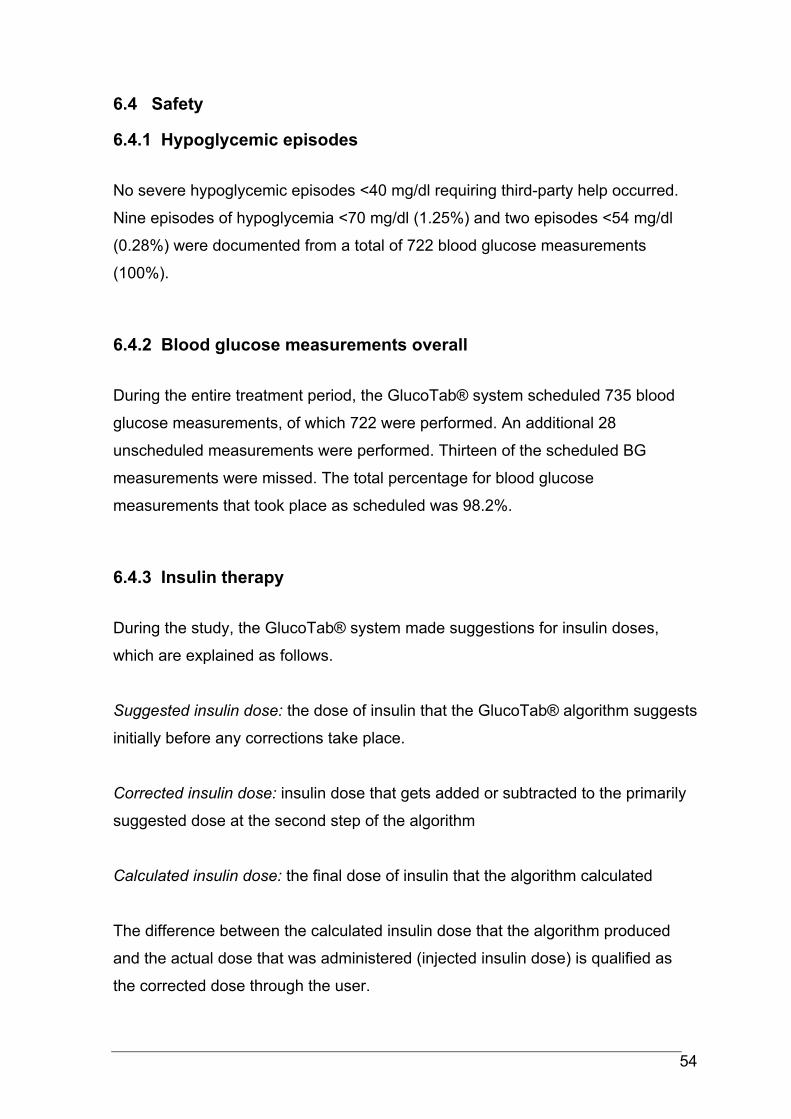
54
6.4 Safety
6.4.1 Hypoglycemic episodes
No severe hypoglycemic episodes <40 mg/dl requiring third-party help occurred.
Nine episodes of hypoglycemia <70 mg/dl (1.25%) and two episodes <54 mg/dl
(0.28%) were documented from a total of 722 blood glucose measurements
(100%).
6.4.2 Blood glucose measurements overall
During the entire treatment period, the GlucoTab® system scheduled 735 blood
glucose measurements, of which 722 were performed. An additional 28
unscheduled measurements were performed. Thirteen of the scheduled BG
measurements were missed. The total percentage for blood glucose
measurements that took place as scheduled was 98.2%.
6.4.3 Insulin therapy
During the study, the GlucoTab® system made suggestions for insulin doses,
which are explained as follows.
Suggested insulin dose: the dose of insulin that the GlucoTab® algorithm suggests
initially before any corrections take place.
Corrected insulin dose: insulin dose that gets added or subtracted to the primarily
suggested dose at the second step of the algorithm
Calculated insulin dose: the final dose of insulin that the algorithm calculated
The difference between the calculated insulin dose that the algorithm produced
and the actual dose that was administered (injected insulin dose) is qualified as
the corrected dose through the user.
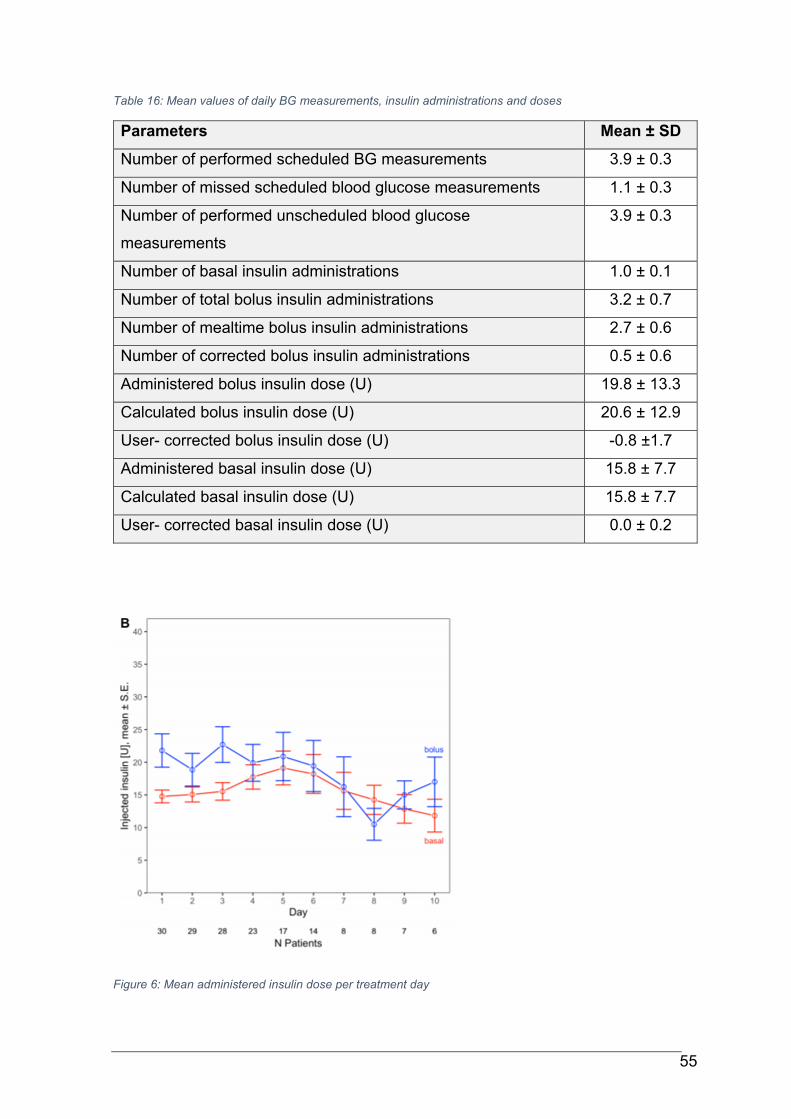
55
Table 16: Mean values of daily BG measurements, insulin administrations and doses
Parameters Mean ± SD
Number of performed scheduled BG measurements 3.9 ± 0.3
Number of missed scheduled blood glucose measurements 1.1 ± 0.3
Number of performed unscheduled blood glucose
measurements
3.9 ± 0.3
Number of basal insulin administrations 1.0 ± 0.1
Number of total bolus insulin administrations 3.2 ± 0.7
Number of mealtime bolus insulin administrations 2.7 ± 0.6
Number of corrected bolus insulin administrations 0.5 ± 0.6
Administered bolus insulin dose (U) 19.8 ± 13.3
Calculated bolus insulin dose (U) 20.6 ± 12.9
User- corrected bolus insulin dose (U) -0.8 ±1.7
Administered basal insulin dose (U) 15.8 ± 7.7
Calculated basal insulin dose (U) 15.8 ± 7.7
User- corrected basal insulin dose (U) 0.0 ± 0.2
Figure 6: Mean administered insulin dose per treatment day
56
Table 16 shows the mean number of insulin doses/units administered throughout
the study, while Figure 6 is a visual representation of the mean injected basal and
bolus insulin doses that were administered.
6.5 Usability
6.5.1 Adherence to the GlucoTab® suggestions
The adherence to the insulin dose suggestion of the GlucoTab® system was high,
with 93.6% of all suggested total daily doses being adhered to from study start,
and 94.2% of all suggestions starting from the first full day of the study.
From the first full day of the study, the GlucoTab® system suggested 185 doses
for basal insulin, of which 184 were administered, marking an adherence of 99.5%.
For bolus insulin from the first full study day, the GlucoTab® system suggested an
insulin dose 586 times, while 500 doses were administered as suggested, setting
the adherence at 85.0%.
6.5.2 Corrections of doses
The lowest percentage for adherence was on the day the study started (with an
adherence of 76.3%). The first and last day of the study have to be taken into
consideration as the users were unsure of previous or continued patient treatment
and thus were more careful in administering insulin.
As for basal insulin doses, only 2.3% of suggested doses were not administrated
as suggested by the algorithm over the whole study period, even less than that
with 0.5% from the first full day of the study.
Of all suggested bolus insulin doses, 16.3% were adjusted by the user over the
whole study period, while 14.97% were corrected from the first full day of the
study. Adherence was lowest for bedtime suggestions. This was mostly because
the suggested doses were low (approximately 1U of insulin) that the nurse on duty
cancelled the recommended administration.
Throughout the study, the number of adjustments was highest on the first study
day (with a total of 28.6%).
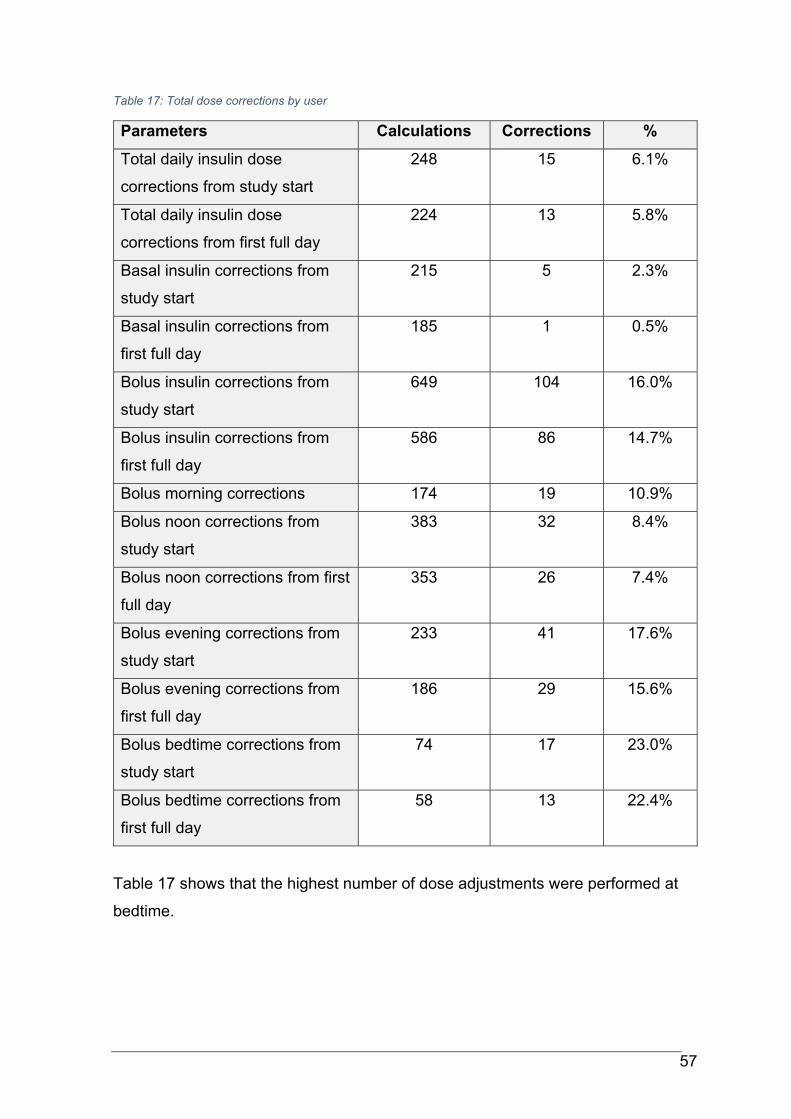
57
Table 17: Total dose corrections by user
Parameters Calculations Corrections %
Total daily insulin dose
corrections from study start
248 15 6.1%
Total daily insulin dose
corrections from first full day
224 13 5.8%
Basal insulin corrections from
study start
215 5 2.3%
Basal insulin corrections from
first full day
185 1 0.5%
Bolus insulin corrections from
study start
649 104 16.0%
Bolus insulin corrections from
first full day
586 86 14.7%
Bolus morning corrections 174 19 10.9%
Bolus noon corrections from
study start
383 32 8.4%
Bolus noon corrections from first
full day
353 26 7.4%
Bolus evening corrections from
study start
233 41 17.6%
Bolus evening corrections from
first full day
186 29 15.6%
Bolus bedtime corrections from
study start
74 17 23.0%
Bolus bedtime corrections from
first full day
58 13 22.4%
Table 17 shows that the highest number of dose adjustments were performed at
bedtime.
58
7 Conclusion
In total, the data indicates that the use of the GlucoTab® system for workflow and
decision-making support results in good glycemic control with a low number of
hypoglycemic events. With the GlucoTab® system being readily available in a
clinical setting, as well as the high adherence of clinical staff towards dose
suggestions, it is a useful tool to help manage patients with diabetes and new-
onset hyperglycemia, especially on wards where staff is not as familiar with the
management.
7.1 Potential positive effects of the GlucoTab® system
Studies have shown that using a computerized decision support system improves
inpatient diabetes care, with better blood glucose in target ranges and lower mean
blood glucose levels without causing an increase in hypoglycemia. (1,2)
The GlucoTab® system used in this study provides suggestions for basal and
bolus insulin doses. It has shown good usability and its suggestions were well
accepted by users (see 6.5) while maintaining safety during use (see 6.4).
7.1.1 Improved glycemic control with reduced risk for hypoglycemia
Inadequate glycemic control is associated with bad clinical outcome, including risk
of infections, higher all-cause morbidity and mortality. The ideal target range for
premeal blood glucose for hospitalized patients was set at 140 – 180 mg/dl by the
ADA, with a more stringent goal of 110 – 140 mg/dl for selected patients if this
goal can be achieved without significant hypoglycemia. (6)
In this study 52.2 ± 10.2% of measured blood glucose values were in the range of
70 – 140 mg/dl. In 74.5% of the time that patients were treated with the support of
the GlucoTab® algorithm, the measured blood glucose levels stayed in the range
of 70 - <180 mg/dl, in 33.1% they even fell in the tighter range of 100-140 mg/dl.
59
When comparing the first full treatment day of the study to the last, it becomes
evident that blood glucose values improved by using the algorithm (see 6.3.2.4
and 6.3.2.5). On the first day, 49.1% of the CGM values landed in the target range
of 70 – 140 mg/dl, while the number increased to 56.2% on the last day.
7.2 Potential risks of the GlucoTab® system
7.2.1 Hypoglycemic events
Nine episodes of hypoglycemia <70 mg/dl occurred during this study, which makes
up 1.25% of all blood glucose measurements. Two episodes of glucose <54 mg/dl
were recorded, which accounts for 0.28% of the measurements. No hypoglycemic
event <40 mg/dl or hypoglycemic episode that required third party assistance
occurred (see 6.4.1) The number of hypoglycemic events were comparable to
similar studies or even lower. (1–3,58–60)
7.2.2 Hyperglycemic events
Only 0.8% of all blood glucose measurements were ≥300 mg/dl, which is less than
a recent study conducted with the GlucoTab® system and insulin glargine U300,
where 1.7% of blood glucose measurements were ≥300 mg/dl. (2)
It can be said that the rate of hyperglycemic events was not higher than in
comparable studies, like Neubauer et. al. [2015] where 2.7% of blood glucose
values were at ≥300 mg/dl, or Aberer et. al. [2019] with 1.7% at that range. (1,2)
During the duration of the study, daily mean blood glucose levels were on average
at 150.5 ± 26.9 mg/dl. Furthermore, comparing the mean blood glucose values
(see 63.2.4) as well as the CGM measurements (see 6.3.2.5) from the first day of
the study to the last, it is obvious that glycemic control improved during the study.
60
7.2.3 Adherence to GlucoTab® suggestions
The medical staff worked well with the GlucoTab® system and accepted the
suggested insulin doses in most cases (see 6.5). Of all suggested total daily
insulin doses, 93.6% were adhered to from study start. The first and final day of
the study were the ones with the lowest adherence (of 76.3%). Most of the
corrections on those days took place because the users were unsure about the
specifics of medication the patients had already taken or insulin injections that had
been performed before the study, as well as being careful on the last day as to not
negatively affect the patients for when they return home.
As for suggested doses that were not administered, this mostly occurred at
bedtime where the suggested dose was as low as 1U, which medical staff decided
to skip as the benefits did not outweigh the burden of insulin injection.
The mean user-corrected doses were low: with -0.8 ±1.7 U for bolus insulin and
0.0 ± 0.2 U for basal insulin. Once again, this finding is comparable to similar
studies. (1–3)
The GlucoTab® system scheduled 735 blood glucose measurements throughout
the treatment period, of which 722 were performed. In addition to that, 28
unscheduled measurements were performed, whereas thirteen scheduled
measurements were missed. In total, the percentage of blood glucose
measurements that were performed as scheduled was 98.2%, which shows high
adherence to the suggestions of the algorithm.
The adherence for basal insulin administration was 99.5%, for bolus insulin it was
85.0% (both excluding the first study day). Adherence to bolus insulin was similar
to studies like Neubauer et. al. [2015] and Aberer et. al. [2019], although
adherence to bolus insulin was slightly lower in this study. (1,2)
There were no technical problems, system malfunctions or anomalies. In addition
to that, there were no adverse events related to the device (see 6.2) and no
serious adverse events or serious adverse device effects.
These numbers tell us that the GlucoTab® system offers good assistance in a
clinical setting and that it was made use of frequently. The blood glucose
measurements as well as the insulin injections were largely performed and
61
documented as suggested by the GlucoTab® system, which falls in line with
previously conducted studies. (1–3)
Therefore, it is safe to say that the GlucoTab® system was incorporated well into
the daily hospital routine and was accepted well by medical staff.
62
8 Bibliography
1. Neubauer KM, Mader JK, Höll B, Aberer F, Donsa K, Augustin T, et al.
Standardized Glycemic Management with a Computerized Workflow and
Decision Support System for Hospitalized Patients with Type 2 Diabetes on
Different Wards. In: Diabetes Technology and Therapeutics. Mary Ann
Liebert Inc.; 2015. p. 685–92.
2. Aberer F, Lichtenegger KM, Smajic E, Donsa K, Malle O, Samonigg J, et al.
GlucoTab-guided insulin therapy using insulin glargine U300 enables
glycaemic control with low risk of hypoglycaemia in hospitalized patients with
type 2 diabetes. Diabetes, Obesity and Metabolism. 2019 Mar 1;21(3):584–
91.
3. Spat S, Donsa K, Beck P, Höll B, Mader JK, Schaupp L, et al. A Mobile
Computerized Decision Support System to Prevent Hypoglycemia in
Hospitalized Patients with Type 2 Diabetes Mellitus. Journal of Diabetes
Science and Technology. 2017 Jan 1;11(1):20–8.
4. Schmutterer I, Delcour J, Griebler R (Hrsg. ), Wien: Bundesministerium für
Gesundheit und Frauen. Österreichischer Diabetesbericht 2017 [Internet].
Available from: www.bmgf.gv.at
5. Bilous R, Donnelly R. Handbook of Diabetes, Fourth Edition. 2019.
6. Diabetes care in the hospital: Standards of medical care in diabetes-2021.
Diabetes Care. 2021 Jan 1;44:S211–20.
7. Mader JK, Brix J, Aberer F, Vonbank A, Resl M, Pieber TR, et al. Hospital
diabetes management (Update 2019). Wiener Klinische Wochenschrift.
2019 May 1;131:200–11.
8. Arastéh K, Baenkler H, Bieber C et al. Hrsg 4. , überarbeitete Auflage. Duale
Reihe Innere Medizin. Stuttgart: Thieme; 2018. 691–718.
9. International Diabetes Federation. IDF Diabetes Atlas, 9th edn. Brussels,
Belgium: 2019. [Internet]. [cited 2021 May 26]. Available from:
https://www.diabetesatlas.org
10. Herold Gerd. Innere Medizin 2020. Walter de Gruyter GmbH & Co KG.
2020;722–50.
63
11. Kasper DL, Fauci AS, Hauser SL, Longo DL 1., Jameson JL, Loscalzo J.
Harrison’s principles of internal medicine, 19e. Vol. 1. No. 2. McGraw Hill
Education, 2015. :2850–83.
12. Hien P, Böhm B, Böhm B, Claudi-Böhm S, Krämer C, Kohlhas K. Diabetes-
Handbuch. Diabetes-Handbuch. Springer Berlin Heidelberg; 2013. 82–83.
13. Silbernagl S, Lang F. Taschenatlas Pathophysiologie. Taschenatlas
Pathophysiologie. Georg Thieme Verlag; 2019. 324–329.
14. Jingi AM, Tankeu AT, Ateba NA, Noubiap JJ. Mechanism of worsening
diabetic retinopathy with rapid lowering of blood glucose: The synergistic
hypothesis. BMC Endocrine Disorders. 2017 Oct 10;17(1).
15. Radda S, Bolz M, Egger S, Gasser-Steiner V, Kralinger M, Mennel S, et al.
Diagnosis, treatment and monitoring of diabetic eye disease (Update 2019).
Wiener Klinische Wochenschrift. 2019 May 1;131:164–8.
16. Cheung N, Mitchell P, Wong TY. Diabetic retinopathy. The Lancet [Internet].
2010;376:124–36. Available from: www.thelancet.com
17. Lechleitner M, Abrahamian H, Francesconi C, Kofler M, Sturm W, Köhler G.
Diabetic neuropathy and diabetic foot syndrome (Update 2019). Wiener
Klinische Wochenschrift. 2019 May 1;131:141–50.
18. Qi C, Mao X, Zhang Z, Wu H. Classification and differential diagnosis of
diabetic nephropathy. Vol. 2017, Journal of Diabetes Research. Hindawi
Limited; 2017.
19. Sourij H, Edlinger R, Prischl FC, Auinger M, Kaser S, Horn S, et al. Diabetic
kidney disease (Update 2019): Position paper of the Austrian Diabetes
Association and the Austrian Society for Nephrology. Wiener Klinische
Wochenschrift. 2019 May 1;131:151–63.
20. American Diabetes Association. 2. Classification and diagnosis of diabetes:
Standards of Medical Care in Diabetes—2021. Diabetes Care. 2021 Jan
1;44:S15–33.
21. Harreiter J, Roden M. Diabetes mellitus—Definition, classification, diagnosis,
screening and prevention (Update 2019). Wiener Klinische Wochenschrift.
2019 May 1;131:6–15.
22. Renz-Polster H, Steffen Krautzig, Jörg Braun. Basislehrbuch Innere Medizin:
kompakt-greifbar-verständlich. Elsevier Health Sciences Germany. 2012.
S732-769
64
23. Toplak H, Leitner DR, Harreiter J, Hoppichler F, Wascher TC, Schindler K,
et al. “Diabesity”—Obesity and type 2 diabetes (Update 2019). Wiener
Klinische Wochenschrift. 2019 May 1;131:71–6.
24. Glycemic targets: Standards of medical care in diabetes−2021. Diabetes
Care. 2021 Jan 1;44:S73–84.
25. Francesconi C, Niebauer J, Haber P, Weitgasser R, Lackinger C. Lifestyle:
physical activity and training as prevetion and therapy of type 2 diabetes
mellitus (Update 2019). Wiener Klinische Wochenschrift. 2019 May
1;131:61–6.
26. Clodi M, Abrahamian H, Brath H, Brix J, Drexel H, Fasching P, et al.
Antihyperglycemic treatment guidelines for diabetes mellitus type 2 (Update
2019). Wiener Klinische Wochenschrift. 2019 May 1;131:27–38.
27. American Diabetes Association. 9. Pharmacologic approaches to glycemic
treatment: Standards of Medical Care in Diabetes—2021. Diabetes Care.
2021 Jan 1;44:S111–24.
28. Lechleitner M, Clodi M, Abrahamian H, Brath H, Brix J, Drexel H, et al.
Insulin therapy of type 2 diabetes mellitus (Update 2019). Wiener Klinische
Wochenschrift. 2019 May 1;131:39–46.
29. Krentz AJ. Drug Therapy for Type 2 Diabetes Pocket Reference. S32-47
30. Hofmann F, Editorial Board Beavo MJ, Ganten WD, J-A Karlsson B, Michel
SM, Page AC, et al. Handbook of Experimental Pharmacology- Diabetes-
Perspectives in Drug Therapy [Internet]. Available from:
http://www.springer.com/series/164
31. Pozzuoli GM, Laudato M, Barone M, Crisci F, Pozzuoli B. Errors in insulin
treatment management and risk of lipohypertrophy. Acta Diabetologica.
2018 Jan 1;55(1):67–73.
32. American Diabetes Association- Insulin Basics [Internet]. [cited 2021 Jun
30]. Available from: https://www.diabetes.org/healthy-living/medication-
treatments/insulin-other-injectables/insulin-basics
33. Crasto W, Jarvis J, Davies MJ. Handbook of Insulin Therapies. 2016.
34. Avgerinos I, Papanastasiou G, Karagiannis T, Michailidis T, Liakos A,
Mainou M, et al. Ultra-rapid-acting insulins for adults with diabetes: A
systematic review and meta-analysis. 2021;
65
35. Owens DR, Bolli GB. The continuing quest for better subcutaneously
administered prandial insulins: a review of recent developments and
potential clinical implications. Vol. 22, Diabetes, Obesity and Metabolism.
Blackwell Publishing Ltd; 2020. p. 743–54.
36. Niswender KD. Basal insulin: Physiology, pharmacology, and clinical
implications. Postgraduate Medicine. 2011 Jul;123(4):17–26.
37. Haahr H, Heise T. A Review of the Pharmacological Properties of Insulin
Degludec and Their Clinical Relevance. Vol. 53, Clinical Pharmacokinetics.
Springer International Publishing; 2014. p. 787–800.
38. CHMP. NovoMix, INN-insulin aspart [Internet]. Available from:
www.ema.europa.eu/contact
39. CHMP. Ryzodeg; INN-insulin degludec / insulin aspart [Internet]. Available
from: www.ema.europa.eu/contact
40. Belinda P. Childs AMC, Nathaniel G. Clark MMR, Daniel J. Cox P, Philip E.
Cryer M (chair), Stephen N. Davis M, Monica M. DiNardo MCC, et al.
Defining and Reporting Hypoglycemia in Diabetes- A report from the
American Diabetes Association Workgroup on Hypoglycemia. 2005.
41. Silbert R, Salcido-Montenegro A, Rodriguez-Gutierrez R, Katabi A, McCoy
RG. Hypoglycemia Among Patients with Type 2 Diabetes: Epidemiology,
Risk Factors, and Prevention Strategies. Vol. 18, Current Diabetes Reports.
Current Medicine Group LLC 1; 2018.
42. Pieber TR, Marso SP, McGuire DK, Zinman B, Poulter NR, Emerson SS, et
al. DEVOTE 3: temporal relationships between severe hypoglycaemia,
cardiovascular outcomes and mortality. Diabetologia. 2018 Jan 1;61(1):58–
65.
43. Lansang MC, Umpierrez GE. Inpatient hyperglycemia management: A
practical review for primary medical and surgical teams. Vol. 83, Cleveland
Clinic journal of medicine. 2016. p. S34–43.
44. Gupta T, Hudson M. Update on glucose management among noncritically ill
patients hospitalized on medical and surgical wards. Journal of the
Endocrine Society. 2017;1(4):247–59.
45. Blanco M, Hernández MT, Strauss KW, Amaya M. Prevalence and risk
factors of lipohypertrophy in insulin-injecting patients with diabetes. Diabetes
and Metabolism. 2013 Oct;39(5):445–53.
66
46. Gerard SO, Ritchie J. Challenges of inpatient glycemic control. Journal of
Nursing Care Quality. 2017;32(3):267–71.
47. Billings LK, Doshi A, Gouet D, Oviedo A, Rodbard HW, Tentolouris N, et al.
Efficacy and Safety of IDegLira Versus Basal-Bolus Insulin Therapy in
Patients With Type 2 Diabetes Uncontrolled on Metformin and Basal Insulin;
DUAL VII Randomized Clinical Trial. Diabetes Care. 2018 Feb 26;dc171114.
48. Marso SP, McGuire DK, Zinman B, Poulter NR, Emerson SS, Pieber TR, et
al. Efficacy and Safety of Degludec versus Glargine in Type 2 Diabetes.
New England Journal of Medicine. 2017 Aug 24;377(8):723–32.
49. Tresiba® - Novo Nordisk Prescribing information [Internet]. 2019 [cited 2021
Jun 16]. Available from: https://www.novonordiskmedical.com/our-
products/tresiba.html
50. Heise T, Nosek L, Bøttcher SG, Hastrup H, Haahr H. Ultra-long-acting
insulin degludec has a flat and stable glucose-lowering effect in type 2
diabetes. Diabetes, Obesity and Metabolism. 2012;14(10):944–50.
51. Wysham C, Bhargava A, Chaykin L, de La Rosa R, Handelsman Y, Troelsen
LN, et al. Effect of insulin degludec vs insulin glargine U100 on
hypoglycemia in patients with type 2 diabetes the SWITCH 2 randomized
clinical trial. JAMA - Journal of the American Medical Association. 2017 Jul
4;318(1):45–56.
52. Philis-Tsimikas A, Klonoff DC, Khunti K, Bajaj HS, Leiter LA, Hansen M v, et
al. Risk of hypoglycaemia with insulin degludec versus insulin glargine U300
in insulin-treated patients with type 2 diabetes: the randomised, head-to-
head CONCLUDE trial. [cited 2021 May 25]; Available from:
https://doi.org/10.1007/s00125-019-05080-9
53. Jinxin WZ, Xiaodong T, Chen ZH. Insulin Degludec, a Novel Ultra-Long-
Acting Basal Insulin versus Insulin Glargine for the Management of Type 2
Diabetes: A Systematic Review and Meta-Analysis. Diabetes Therapy
[Internet]. Available from: https://doi.org/10.6084/
54. Yun JS, Park YM, Han K, Cha SA, Ahn YB, Ko SH. Severe hypoglycemia
and the risk of cardiovascular disease and mortality in type 2 diabetes: A
nationwide population-based cohort study. Cardiovascular Diabetology.
2019 Aug 14;18(1).
67
55. NovoRapid® - Novo Nordisk Pro Prescribing information [Internet]. 2020
[cited 2021 Jun 15]. Available from:
https://www.novonordiskpro.de/content/dam/Germany/AFFILIATE/www-
novonordiskpro-de/de_de/diabetes/fi/FI_NovoRapid.pdf
56. FreeStyle Libre by Abbott [Internet]. [cited 2021 Jun 28]. Available from:
https://www.freestyle.abbott/in-en/home.html
57. ACCU-CHEK ® Inform II BLOOD GLUCOSE MONITORING SYSTEM
Operator’s Manual.
58. Umpierrez GE, Smiley D, Hermayer K, Khan A, Olson DE, Newton C, et al.
Randomized study comparing a basal-bolus with a basal plus correction
insulin regimen for the hospital management of medical and surgical
patients with type 2 diabetes: Basal plus trial. Diabetes Care.
2013;36(8):2169–74.
59. Umpierrez GE, Smiley D, Jacobs S, Peng L, Temponi A, Mulligan P, et al.
Randomized study of basal-bolus insulin therapy in the inpatient
management of patients with type 2 diabetes undergoing general surgery
(RABBIT 2 surgery). Diabetes Care. 2011 Feb;34(2):256–61.
60. Umpierrez GE, Smiley D, Zisman A, Prieto LM, Palacio A, Ceron M, et al.
Randomized study of basal-bolus insulin therapy in the inpatient
management of patients with type 2 diabetes (RABBIT 2 Trial). Diabetes
Care. 2007 Sep;30(9):2181–6.
![What’s New in the Medication€¦ · new basal insulins. ... •Insulin naïve T2DM patients randomized 1:1 to glargine U-300 or degludec U-100 [n = 463] •Noninferiority for glycemic](https://img.pdfslide.us/doc/110x75/5f0bdc737e708231d4329358/whatas-new-in-the-medication-new-basal-insulins-ainsulin-nave-t2dm-patients.jpg)