Embed Size (px)
Citation preview
Gluten Investigation
Gluten Investigation
Gluten Packet• Page 1• Making observations:
– What did you notice about the different gluten balls while you were making them?
– What did you wonder about?• What makes for a good scientific
observation?
Gluten Packet• Page 1-2• Identifying Variables
– What is the independent variable?– What is the dependent variable?– Which variables were kept constant?– What was used as the control?
Gluten Packet• Page 3• Hypothesis Statements
– Write out your predictions about the amount of gluten that would be in each of the three flours.
– Write these statements in the “IF – THEN” format (“IV – DV).
• Why do you think this?
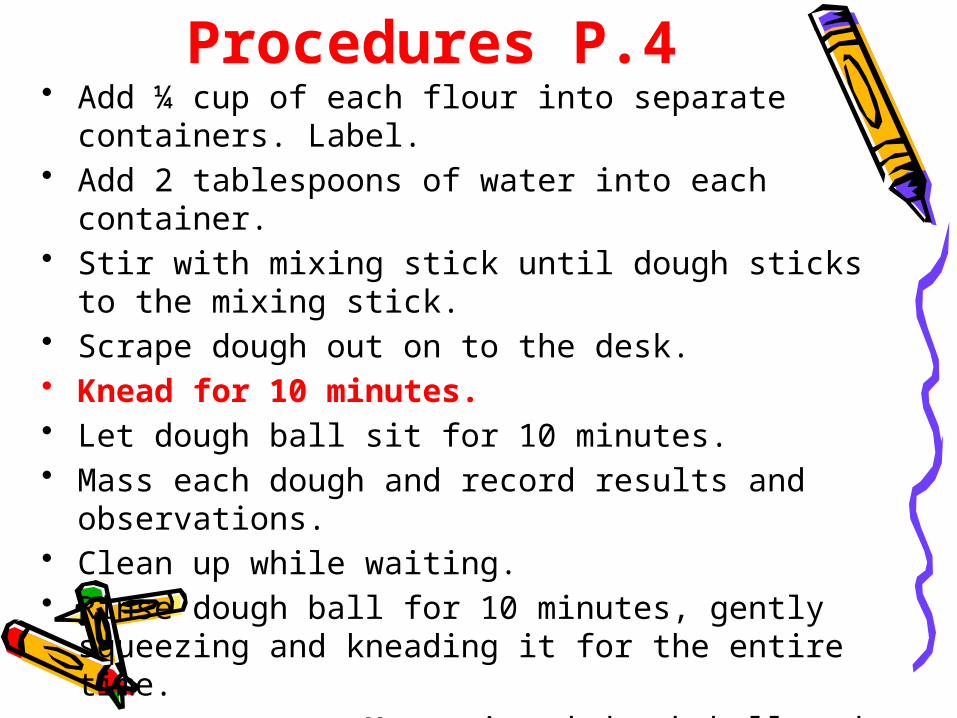
Procedures P.4• Add ¼ cup of each flour into separate containers.
Label.• Add 2 tablespoons of water into each container.• Stir with mixing stick until dough sticks to the
mixing stick.• Scrape dough out on to the desk.• Knead for 10 minutes.• Let dough ball sit for 10 minutes.• Mass each dough and record results and
observations.• Clean up while waiting.• Rinse dough ball for 10 minutes, gently squeezing
and kneading it for the entire time.• Mass rinsed dough ball and record
results.• Record observations.
Gluten Packet• Page 5• Materials and Amounts
– Bread Flour– Whole Wheat Flour– All-purpose Flour– Containers– Water– Mixing Sticks– Timers
Journal Questions• 16 Oct 2012• Reflect on the inquiry investigation
completed yesterday. – What did you and your group do well?– What could you and your group have
done better?– How do you feel the activity went? Did
you enjoy doing it? Why?– In general, how is science going for you
this year? –
Data• Page 6• Data Table
– Flours used– Mass of each dough ball before rinsing– Mass of each dough ball after rinsing– Total change in mass– Percent gluten – Observations during the entire process
Journal Question• 22 Oct 2012, P.• What does it mean for data to be:
– Precise (precision)– Accurate (accuracy)– Reproducible (reproducibility)
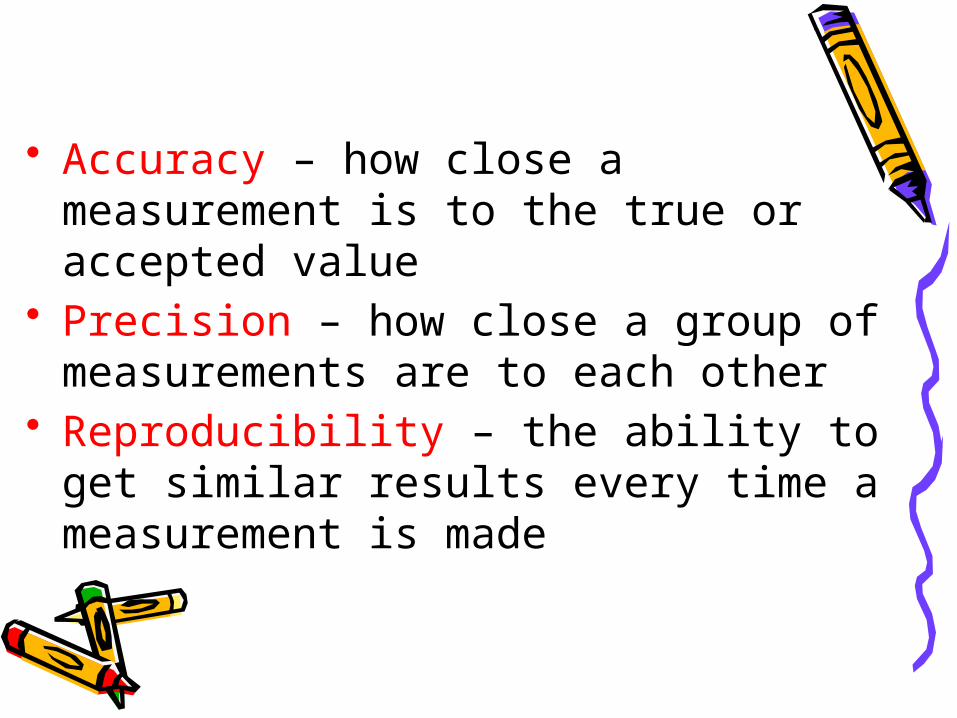
• Accuracy – how close a measurement is to the true or accepted value
• Precision – how close a group of measurements are to each other
• Reproducibility – the ability to get similar results every time a measurement is made
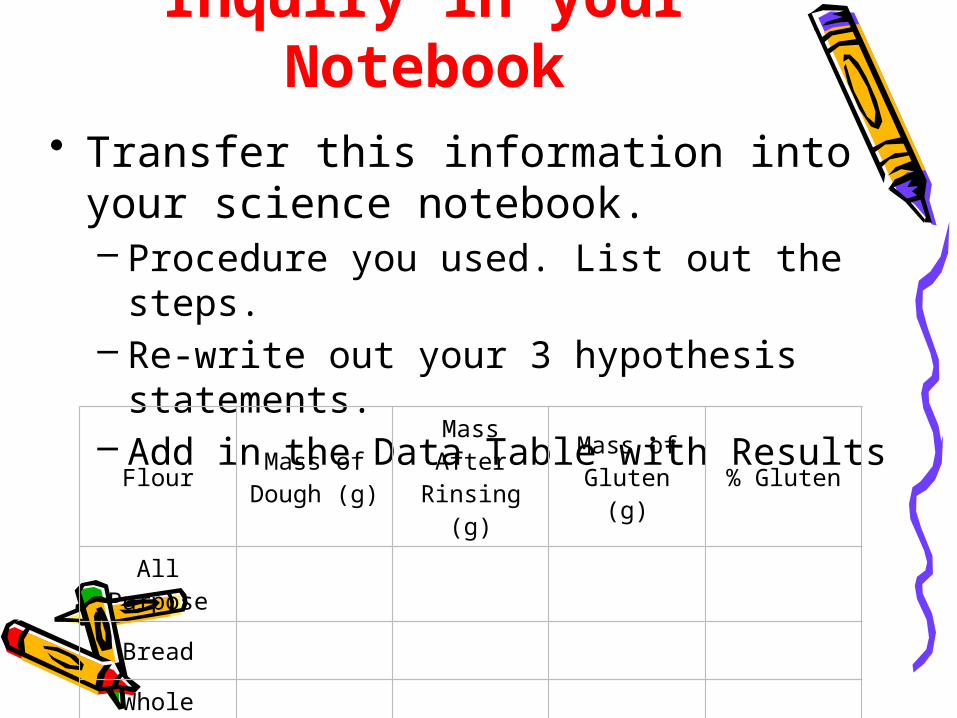
Inquiry in your Notebook
• Transfer this information into your science notebook.– Procedure you used. List out the steps.– Re-write out your 3 hypothesis
statements.– Add in the Data Table with Results
Flour Mass of Dough (g)
Mass After Rinsing (g)
Mass of Gluten (g) % Gluten
All Purpose
Bread
Whole Wheat
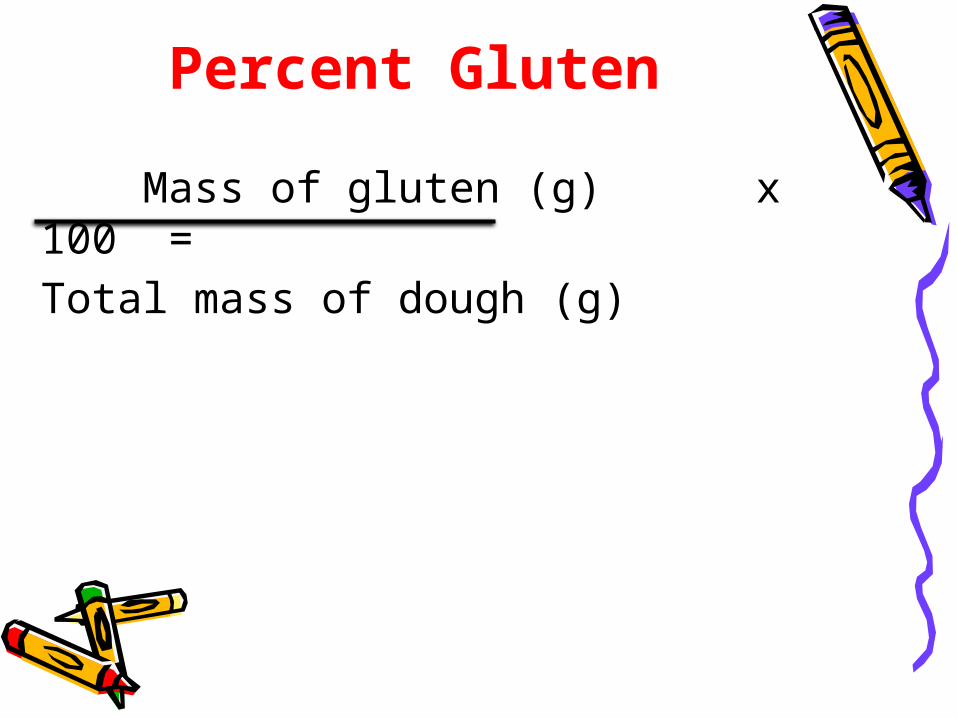
Percent Gluten
Mass of gluten (g) x 100 =Total mass of dough (g)
Journal Question• 23 Oct 2012, P. • Looking at the class data, were the
results precise, accurate, or reproducible? Why or why not?– Answer for each term.
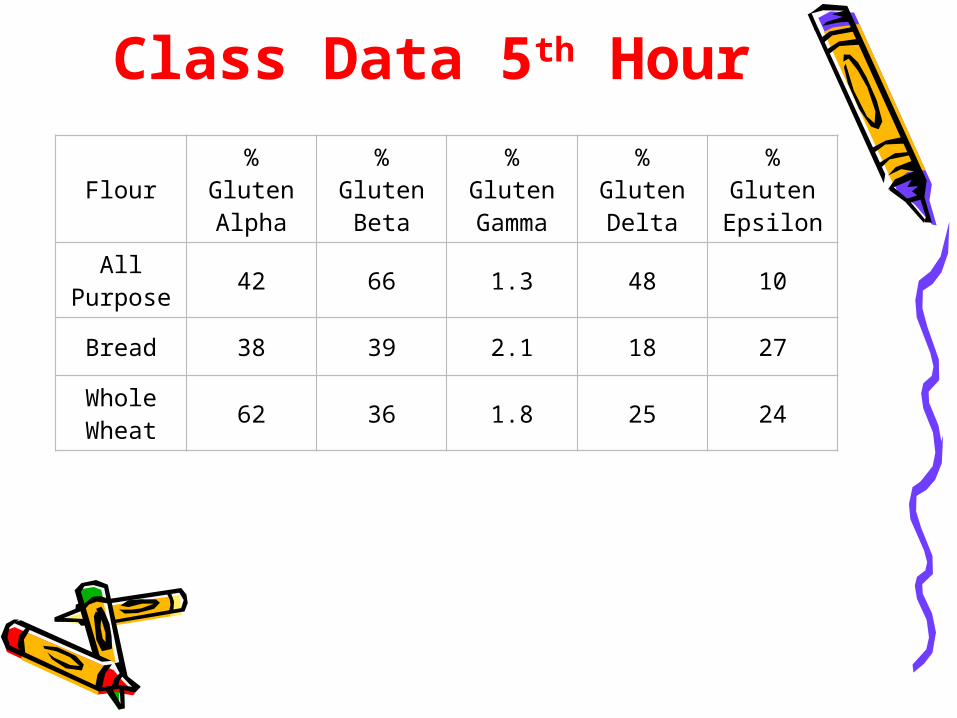
Class Data 5th Hour
Flour % GlutenAlpha
% GlutenBeta
% GlutenGamma
% GlutenDelta
% GlutenEpsilon
All Purpose 42 66 1.3 48 10
Bread 38 39 2.1 18 27
Whole Wheat 62 36 1.8 25 24
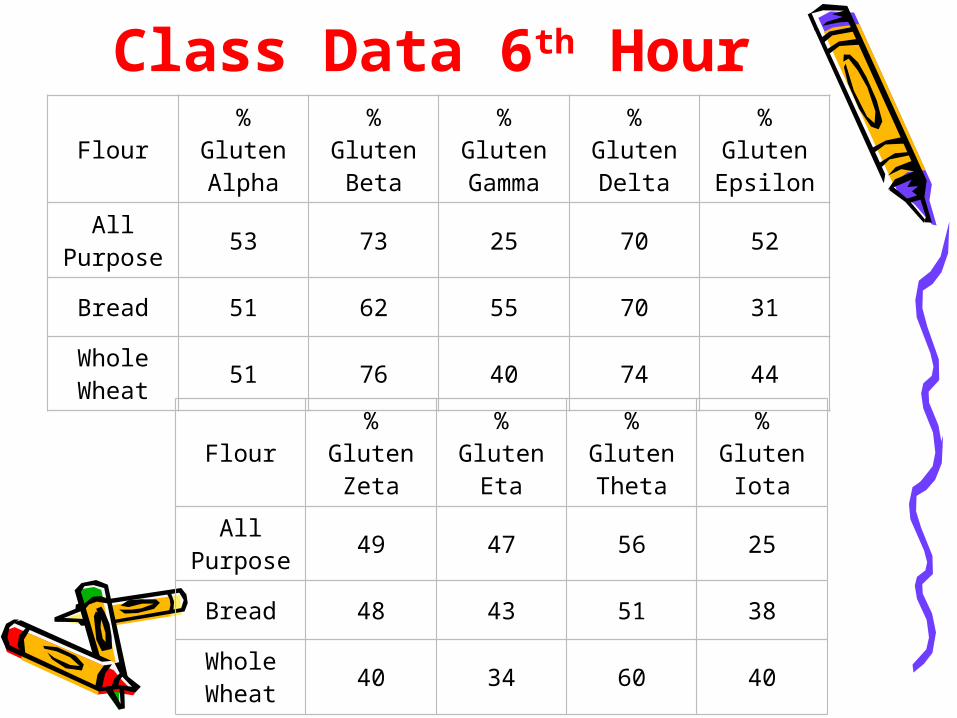
Class Data 6th HourFlour % Gluten
Alpha% Gluten
Beta% GlutenGamma
% GlutenDelta
% GlutenEpsilon
All Purpose 53 73 25 70 52
Bread 51 62 55 70 31
Whole Wheat 51 76 40 74 44
Flour % GlutenZeta
% GlutenEta
% GlutenTheta
% GlutenIota
All Purpose 49 47 56 25
Bread 48 43 51 38
Whole Wheat 40 34 60 40
Gluten Packet• Page 6• Analyzing Results
– Rank the three flours from highest to lowest gluten content.
Gluten Packet• Page 7• Drawing Conclusions
– The hypothesis that ______________ was/was not supported by the experimental data. The data showed that _______________
________________________________– Do this for all three hypothesis
statements.– What information is important to include
when analyzing your results?
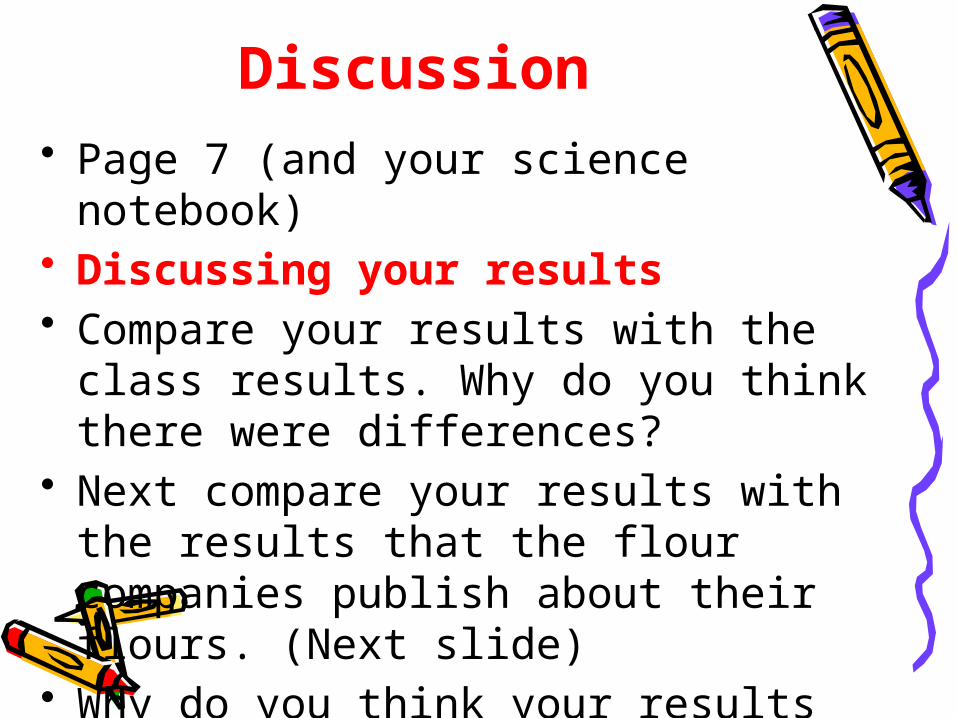
Discussion• Page 7 (and your science notebook)• Discussing your results• Compare your results with the class
results. Why do you think there were differences?
• Next compare your results with the results that the flour companies publish about their flours. (Next slide)
• Why do you think your results were different than the published results?
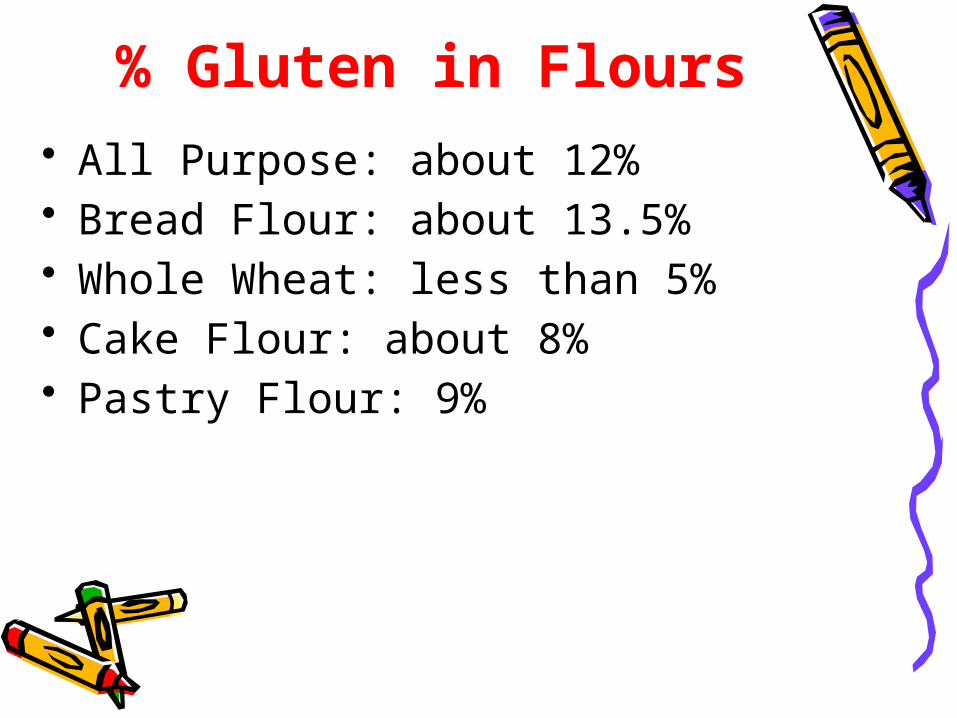
% Gluten in Flours• All Purpose: about 12%• Bread Flour: about 13.5%• Whole Wheat: less than 5%• Cake Flour: about 8%• Pastry Flour: 9%
Journal Questions• 24 Oct 2012• Describe what it felt like to work
with the whole wheat dough and rinse it.
• Do not use any words that would convey a bias to a reader.
Reflections• Page 8• Reflecting on the investigation
– If this investigation was to be done again, what would be done differently and why?
– What were the major sources of error that affected the results? How were the results affected?• Consider the major assumption we made in
calculating the % gluten . . . (that everything left after the 10 minute rinsing period was gluten). Did this turn out to be a valid assumption or was it a major source of error?
– What other questions could be investigated?
Introduction• The introduction to a scientific report
sets up your experiment for the reader.
• It describes:– what the experiment is about (Purpose)– why it is important to study the subject
(Real-world applications)– what is already known about the
subject (background information)– and what you expect the results to show
(hypothesis)
Introduction• The first several paragraphs
describe subject of the investigation and what is already known about it (background).– What is gluten?– What does gluten do?– Where is gluten found?– Why is gluten important in flour?– Why do different kinds of flour have
differing amounts of gluten?– -What happens to a person if they
are allergic to gluten?
Introduction• The next few paragraphs describe the
experiment by stating the purpose of the investigation and how the results were collected, recorded, and analyzed.– The purpose of this investigation was to
find out __________________________.– The variable being tested was __________.– Briefly, the procedure was that for each of
the three flours used, ________________. – The amount of gluten was determined by
__.• Dough balls were massed both ____________. • Mass data was used to calculate percent
gluten.
Introduction• The final paragraph
– Therefore, the purpose of this investigation was to determine the amount of gluten found in three different flours and predict which _____________.
– Restate the independent and dependent variables being tested.
– Restate the predicted results.