Embed Size (px)
Citation preview
Foods 2014, 3, 13-29; doi:10.3390/foods3010013
foods ISSN 2304-8158
www.mdpi.com/journal/foods
Article
Gluten Detection and Speciation by Liquid Chromatography
Mass Spectrometry (LC-MS/MS)
Stephen Lock
AB SCIEX, Pheonix House, Centre Park, Warrington, WA1 1RX, UK;
E-Mail: [email protected]; Tel.: +44-772-027-6948
Received: 12 October 2013; in revised form: 12 December 2013 / Accepted: 18 December 2013 /
Published: 23 December 2013
Abstract: Liquid chromatography tandem mass spectrometry (LC-MS/MS) has been used
historically in proteomics research for over 20 years. However, until recently LC-MS/MS
has only been routinely used in food testing for small molecule contaminant detection, for
example pesticide and veterinary residue detection, and not as a replacement of
microbiological food testing methods, specifically allergen analysis. Over the last couple of
years, articles have started to be published which describe the detection of allergens by
LC-MS/MS. In this article we will describe how LC-MS/MS can be applied in the area of
gluten detection and how it can be used to specifically differentiate the species of gluten used
in food, where specific markers for each variety of gluten can be simultaneously acquired
and detected at the same time. The article will discuss the effect of variety on the
peptide response observed from different wheat grain varieties and will describe the sample
preparation protocol which is essential for generating the peptide markers used
for speciation.
Keywords: gluten; speciation; LC-MS/MS
1. Introduction
Gluten is known to produce an allergic response, and intolerance to gluten leads to celiac disease.
Levels of intolerance to gluten often vary with gluten variety; this is especially relevant to the use of oats
which has a low effect on celiac suffers. Most current ELISA methodology, with the exception of assays
based on the R5 antibody [1], detect the presence of barley, rye and wheat but also oats. Assays based on
the R5 antibody are not sensitive to oats, but this assay still cannot differentiate barley, wheat and rye.
Also, all the ELISA methods that detect gluten are based on one section of the gluten protein (for example, in
OPEN ACCESS

Foods 2014, 3 14
the case of the R5 assay, the peptide sequence glutamine-glutamine-proline-phenylalanine-proline (QQPFP)
peptide epitope) and as such are susceptible to false positives and false negatives. Liquid chromatography
tandem mass spectrometry (LC-MS/MS) has the ability to detect species based on multiple markers with
multiple points of confirmation which makes it far less susceptible to producing false negatives and
positives, and gives far more confirmation in detection. Due to its very specific nature, it is also capable
of distinguishing species by using multiple peptide markers as shown previously [2–5]. A suitable
LC-MS/MS method that could offer the possibility to differentiate between gluten species with a high
degree of specificity would be beneficial to both grain producers and consumers.
In addition, legislation is changing with respect to gluten and, in the UK, one of the first allergen
limits came into effect on 1 January 2012 [6,7]. On this date the laws governing food labeling were
changed such that three different terms can now be used:
1. Gluten-free—is covered by the law and applies only to food which has 20 parts per million (ppm)
or less of gluten.
2. Very low gluten—is covered by the law and is for foods which have between 21 and 100 ppm.
3. No gluten-containing ingredients—this is not covered by the law and is for foods that are made
with ingredients that do not contain gluten and where cross contamination controls are in place.
These foods will have very low levels of gluten, but have not been tested to the same extent as
those labeled gluten-free or very low gluten.
These changes in the food labeling law have recently been followed in the US by the FDA [8]. Some
initial studies using LC-MS/MS in gluten profiling were presented in 2012 [9]. In these studies trypsin
was used as the enzyme for digestion, even though gluten proteins do not undergo a large level of trypsin
digestion (due to a low number of lysine and arginine residues) some unique marker peptides were
found. Recently, chymotrypsin has also been used as an alternative to trypsin [10] to generate a large
number of peptides for the improved detection of wheat gliadin proteins, but this method used longer
digestion times and labelling chemistry to better characterise the gluten proteins.
The purpose of this study was a follow up to the original poster presentation in 2012 [9] to investigate
a simpler approach to preparing extracts and use recent advances in LC technology to help reach
detection limits below the requirements of the current labelling legislation. One of the main purposes of
this work was to develop an approach which could analyse a sample in one day using inexpensive
available chemicals. In this study single varieties of grain which have not been first milled were ground
into flour using a commercial coffee grinder. These samples, together with commercial samples of
self-raising flour, gluten-free flour and some gluten and gluten-free foods, were extracted and then the
allergenic proteins were reduced, alkylated and digested using trypsin. In this study the extracts
produced were simply diluted into 0.1 % formic acid prior to injection and separation by reverse phase
chromatography and LC-MS/MS detection. The LC used was a Eksigent ekspert™ microLC 200
UHPLC system (Eksigent, Redwood City, CA, USA) which had been previously evaluated for the
detection of egg and milk allergens in wine [11] and had been shown to offer a 5-fold improvement in
sensitivity. The mass spectrometry methods utilised Scheduled MRM™ (an algorithm which allows the
independent monitoring of MRM transitions with a defined window around the expected retentions time
for each MRM transition which is available in the Analyst®
software version 1.5 and onwards from

Foods 2014, 3 15
AB SCIEX) for multiple peptides for each gluten species, so that presence of allergen can be
unambiguously confirmed.
2. Experimental Section
The method described is based on the classic proteomics sequencing approach which involves first
the extraction of the protein from a matrix. Once extracted, the proteins are reduced, alkylated and
digested. The extracts were finally diluted and analyzed by LC-MS/MS using an AB SCIEX QTRAP®
4500 LC/MS/MS system (AB SCIEX, Warrington, UK).
2.1. Preparation of Tryptic Digests
2.1.1. Extraction of Proteins
Markers proteins from wheat, oats, barley and rye were extracted by placing powdered sample
(0.5 g of flour or cookie which had been ground using a commercial coffee grinder) into a falcon tube
(15 mL) with extraction buffer [5 mL of a 50:50 mixture of ethanol containing 2 M urea and
50 mM 2-amino-2-hydroxymethyl-propane-1,3-diol (Tris)]. This mixture was shaken by hand
(30 s) and then heated and shaken in an orbital water bath (40 °C, 60 min).
2.1.2. Reduction and Alkylation of Proteins
Once extracted the samples were centrifuged (2500 rpm, 5 min, 20 °C). The supernatant (0.5 mL) was
then reduced by the addition of TCEP [tris(2-carboxyethyl)phosphine, 0.2 M, 50 µL, 60 °C, 60 min in a
thermal mixer] and cooled to room temperature. MMTS (methyl methanethiosulfonate, 0.2 M, 100 µL)
was added and the sample left in the dark (30 min) to alkylate the free cysteine residues.
2.1.3. Tryptic Digestion of Proteins
Once the proteins had been alkylated the sample were diluted with buffer (1.35 mL, 0.1 M ammonium
bicarbonate solution) and trypsin (80 µL, 0.5 mg/mL, Sigma Aldrich part number 93614) was added.
The proteins were then digested for one hour (Eppendorf thermal mixer model number 21516-170,
40 °C, Eppendorf, Stevenage, UK). The digestion was quenched by taking the digest extract (100 µL)
and adding 0.1% formic acid (300 µL). The sample was centrifuged (13,000 rpm, 5 min) and then the
supernatant was injected into the LC-MS/MS system.
2.2. LC-MS/MS Analysis of Tryptic Digests
All analyses was done using an Eksigent ekspert™ microLC 200 UHPLC system (Eksigent,
Redwood City, CA, USA). The extracts (10 µL injection, full loop fill mode) were separated on
a reversed-phase Triart C18 column (100 × 0.5 mm, 2.7 μm, YMC, Dinslaken, Germany) at a
temperature of 40 °C using the gradient conditions shown in Table 1 where A was water, B was
acetonitrile with both phases containing 0.1% formic acid. Micro LC was used as it had previously
been shown to improve responses in peptide analysis using electrospray ionization by over 5 fold [11].

Foods 2014, 3 16
Table 1. Gradient elution used for analysis of extracts.
Step Time (mins) Flow rate % A % B
1 1 25 μL/min 95 5
2 6 25 μL/min 75 25
3 8 25 μL/min 5 95
4 9 25 μL/min 5 95
5 9.2 25 μL/min 95 5
6 12 25 μL/min 96 5
All analyses were performed on an AB SCIEX QTRAP®
4500 LC/MS/MS system (AB SCIEX,
Warrington, UK) using electrospray ionization (ESI). The initial method development was carried out
using the MIDAS™ workflow (MRM-initiated detection and sequencing [12]) and for microLC
analysis the electrode was changed to a microLC hybrid electrode (25 μm ID) designed for
microLC [13]. For MIDAS a set of predicted MRM transitions from the known protein sequence were
used as a survey scan to trigger the acquisition of EPI spectra (acquired at a scan speed of 10,000
amu/s with dynamic fill time and rolling collision energy active and Q1 resolution set to low) an
example of this is shown in Figure 1.
Figure 1. Example of a MIDAS experiment where the top pane shows a MRM trace for a
wheat peptide from a flour extract and the bottom pane shows the triggered enhanced product
ion (EPI) spectra for the peptide which contains sequence data confirming its identity.

Foods 2014, 3 17
This MIDAS data was submitted to a database search engine for confirmation of peptide
identification and to test the feasibility of the MRM transitions for gluten and species identification.
With this workflow MRM transitions were designed without the need for synthetic peptides. In the
final micro LC method the Turbo V™ source conditions used were gas 1, gas 2 and the Curtain Gas™
interface set to 30 psi, the temperature of the source was set at 350 °C and the IS voltage was 5500 V.
The peptides were analyzed using the Scheduled MRM™ algorithm with an MRM detection window
of 60 s and a target scan time of 0.30 s. Q1 resolution was set to low and Q3 resolution was set to unit.
MRM transitions shown in Table 2 were evaluated for rye, oats, wheat and barley, and each MRM
transition used the same declustering voltage (80 V) and entrance potential (10 V). These MRM
transitions corresponded to the peptides shown in Table 3.
Table 2. MRM transitions used for triggers for generating EPI spectra and peptide detection.
Peptide
ID
Q1 mass
(amu)
Q3 Mass 1
(amu)
Q3 Mass 2
(amu)
Q3 Mass 3
(amu)
RT
(mins) CE (V) CXP (V)
Wheat 1 557.3 886.5 548.7 787.4 4.2 32 12
Wheat 2 579.4 897.6 711.5 7.5 33 12
Wheat 3 458.8 730.4 560.3 458.8 3.9 28 12
Wheat 4 594.8 792.4 978.5 538.9 7.1 34 12
Wheat 5 663.8 850.5 779.4 951.7 6.4 37 12
Wheat 6 538.3 547.3 776.4 705.4 4.1 34 12
Barley 1 835.4 947.5 1096.5 1227.6 7.4 47 10
Barley 2 336.2 515.3 554.3 497.3 5.5 13 10
Barley 3 820.4 1096.5 548.3 713.4 7.4 43 10
Barley 4 499.3 785.5 575.3 393.3 6.3 24 10
Barley 5 855.6 980.5 642.4 7.3 38 10
Oats 1 989 997.6 1084.7 1233.7 7.5 54 10
Oats 2 777.4 984.4 1112.5 1225.6 6.1 38 10
Oats 3 627.3 642.4 1012.5 5.8 33 10
Oats 4 365.1 601.2 473.1 3.8 23 10
Rye 1 937 1177.6 7.5 46 10
Rye 1 625 941.6 7.5 24 10
Rye 2 851.7 1199.7 1071.6 1210.2 7.3 43 10
Rye 3 997 1225.6 7.4 46 10
Rye 3 665 1225.6 1128.5 7.4 29 10
Rye 4 988 1197.7 1100.6 7.5 45 10
Rye 4 659 1197.7 7.5 29 10

Foods 2014, 3 18
Table 3. Marker peptides and sequence information used for gluten species markers (the
peptide information was taken from searches of the Swiss-Prot database [14]).
Species Peptide Protein Entry
number Peptide sequence
Hordeum vulgare
(barley)
1 B1-hordein P06470 TLPMMCSVNVPLYR
2 B1-hordein P06470 GVGPSVGV
3 B3-hordein P06471 TLPTMCSVNVPLYR
4 B3-hordein P06471 IVPLAIDTR
5 B3-hordein P06471 SQMLQQSSCHVLQQ
QCCQQLPQIPEQLR
Avena sativa
(oats)
1 Avenin-3 P80356 QFLVQQCSPVAVVPFLR
2 Avenin-3 P80356 SQILQQSSCQVMR
3 Avenin-3 P80356 QLEQIPEQLR
4 Avenin-3 P80356 QQCCR
Secale cereale
(rye)
1 75k gamma
secalin E5KZQ3 NVLLQQCSPVALVSSLR
2 75k gamma
secalin E5KZQ4
EGVQILLPQSHQQHVGQGAL
AQVQGIIQPQQLSQLEVVR
3 75k gamma
secalin E5KZQ5 SLVLQNLPTMCNVYVPR
4 75k gamma
secalin E5KZQ5 QCSTIQAPFASIVTGIVGH
Triticum aestivum
(wheat)
1 Glutenin, subunit
DY10 P10387 QVVDQQLAGR
2 Glutenin, subunit
PW212 P08489 IFWGIPALLK
3 Glutenin, subunit
DY10 P10387 SVAVSQVAR
4 Glutenin, subunit
DY10 P10387 LPWSTGLQMR
5 Beta-amylase P93594 YDPTAYNTILR
6 Alpha-amylase
inhibitor 0.19 P01085 EHGAQEGQAGTGAFPR
3. Results
To test this approach, several samples of grain from single varieties of wheat, rye, barley and oats,
together with commercial samples of gluten-free flour, oats cookies, gluten free cookies, wheat cookies
and a self-raising flour (from a local supermarket in the UK) were collected. Each sample of grain was
milled in a commercially available coffee bean grinder to make single variety flour, and all these
samples were extracted and analyzed using the described method. Figure 2 shows the comparisons of the
four different grain flours using a beta amylase marker peptide.

Foods 2014, 3 19
Figure 2. The comparison of separate extracts from barley, wheat, rye, oats and gluten free
flour. Here the chromatograms for three MRM transitions for a specific marker peptide from
beta amylase (wheat 5 in Table 3) have been shown for each species.
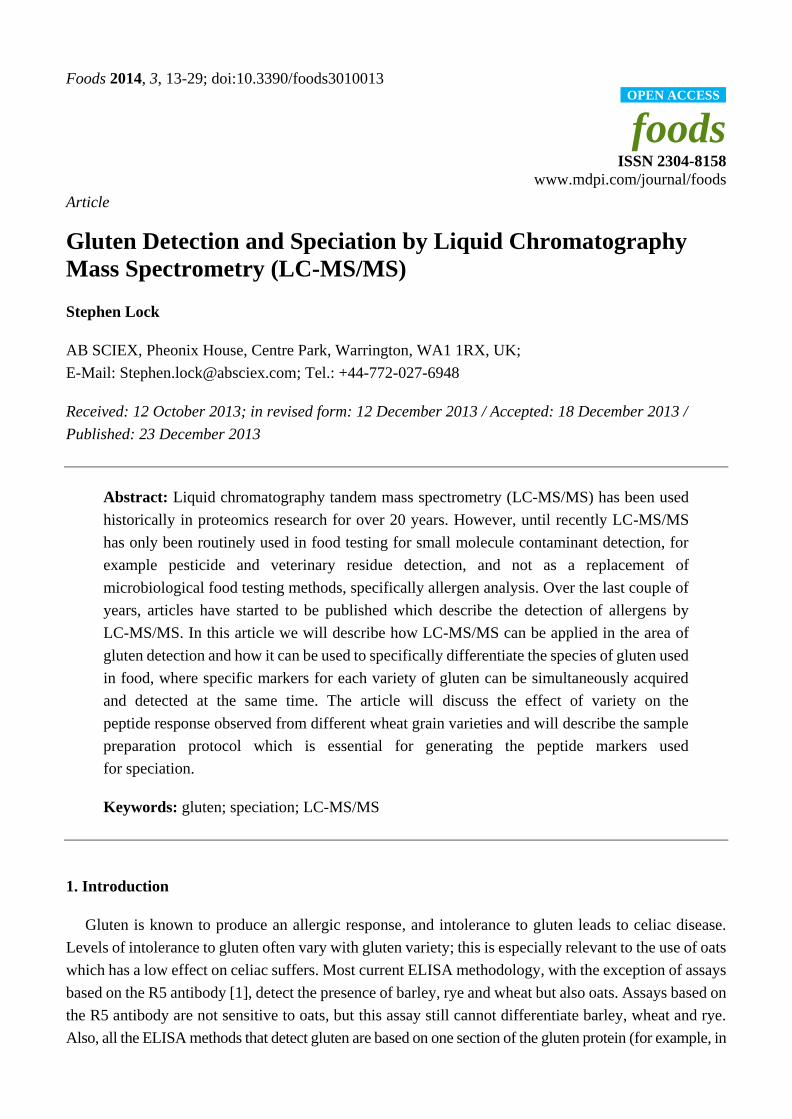
Separate marker peptides were also tested for oats, barley, wheat and rye, which were specific for
each species; these are shown in Figures 3–6.
Foods 2014, 3 20
Figure 3. The comparison of separate extracts from barley, wheat, rye, oats and gluten free
flour. Here the overlaid chromatograms for oats marker peptides (obtained from the
theoretical digestion of avenin) have been shown for flour extract for each sample.

Foods 2014, 3 21
Figure 4. The comparison of separate extracts from barley, wheat, rye and oats flour. Here
the overlaid chromatograms for barley marker peptides (obtained from the theoretical
digestion of hordein) have been shown for flour extracts for each sample.

Foods 2014, 3 22
Figure 5. The comparison of separate extracts from barley, wheat, rye and oats flour. Here
the overlaid chromatograms for rye marker peptides (obtained from the theoretical digestion
of secalin) have been shown for flour extracts for each sample.

Foods 2014, 3 23
Figure 6. The comparison of separate extracts from barley, wheat, rye, oats and gluten-free
flour. Here four separate peptide chromatograms for wheat marker peptides (obtained from
the theoretical digestion of glutenin) have been shown for the extracts of each sample.
To further evaluate this approach, three samples of single varieties of wheat grain were obtained and
extracted and compared with an extraction of gluten-free flour (a mix of tapioca, buckwheat, rice, maize
and potato flour), as well as a sample of self-raising flour obtained from a local supermarket (Figure 7).
The method was further evaluated by applying the same extraction and analysis method to a sample of
gluten-free cake mix and cookies, as well as samples of oats and wheat cookies, to see if it could be
applied to processed food (Figure 8). To assess linearity and sensitivity, samples of gluten-free flour
were spiked at different levels with gliadin protein from wheat, which had been purchased from Sigma
Aldrich (part number G3375, Figure 9).

Foods 2014, 3 24
Figure 7. The comparison of separate extracts of several samples of wheat obtained from
single variety grain samples, as well as a sample of gluten-free flour and self-raising flour
obtained from a local supermarket using the wheat peptides in Table 3.
Foods 2014, 3 25
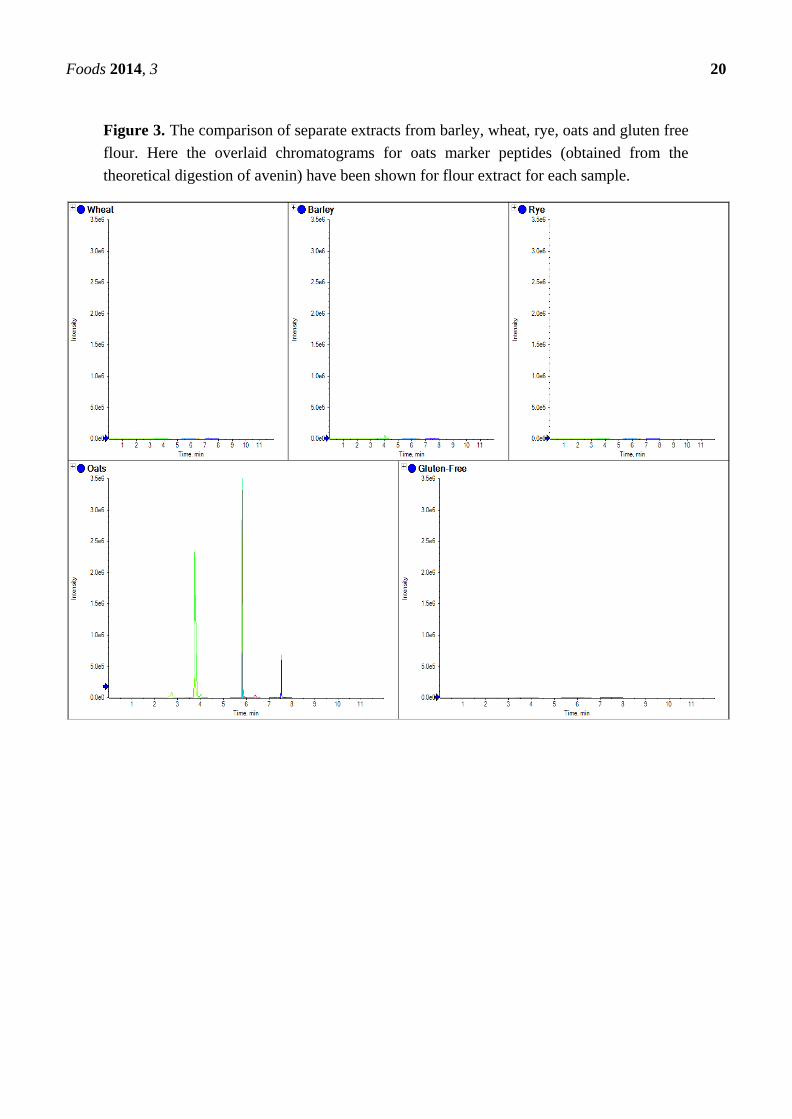
Figure 8. The comparison of extracts from several samples of food collected from a local
supermarket and analyzed for gluten markers for oats and wheat.

Foods 2014, 3 26
Figure 9. The calibration line obtained from the spiking of gliadin into gluten-free wheat
from the range of 5–200 ppm for wheat peptide 3. Inlayed in the calibration line is the
chromatogram for the 10 ppm spike of gliadin into gluten-free flour. The calibration line was
a linear 1/x fit with r = 0.9944.
4. Discussion
Similar to current R5 antibody based ELISA methods, LC-MS/MS marker peptides can be found
which are present in all gluten varieties, with the exception of oats as shown in Figure 2, where the use of
a tryptic peptide from the protein beta amylase was present in wheat, barley and rye, but absent in oats.
This marker gave a consistent MRM ratio for the three peptide MRM transitions across all three species
and is a good marker to replicate the results of R5 antibody ELISA based methods which are positive to
only wheat, rye and barley. However, LC-MS/MS differs to ELISA in that specific markers from the
individual species of oats, rye, barley and wheat can also be developed. Figures 3–6 show how
individual markers for each of these species can be used to distinguish different species by LC-MS/MS
and specifically confirm whether oats had been used as a replacement to wheat. LC-MS/MS offers an
advantage over ELISA based methods in that you can use multiple peptide markers with multiple MRMs
for each peptide to confirm the presence of the gluten species in the sample. One question that had been
asked was that if LC-MS/MS was so specific, would it be affected by the variety of the species in the
sample? To test this hypothesis, several single varieties of wheat grain were obtained from a grain
supplier. These were then ground and the resulting flour extracted to test the effect of variety of wheat on
the peptides detected. In Figure 7 the comparison of four peptide markers for wheat, across different
samples of flour, were compared. What is immediately apparent is that all the peptides are seen in all the
samples with the exception of the gluten-free flour. These wheat varieties included commercial
self-raising flour obtained from a supermarket, as well as hard and soft wheat varieties. From the peptide
responses, you can also see that the relative responses are the same for three out of the four, with only
one marker significantly higher in variety 3, but this may have been as a result of the change in matrix
interference for this particular sample. This clearly indicates that the majority of LC-MS/MS markers

Foods 2014, 3 27
which have been found are independent of variety used to produce the wheat flour and are just
species specific.
One of the important tests for the feasibility of the use of LC-MS/MS was its ability to detect gluten in
processed food. In processed food, ELISA kits have been shown to fail to pick up allergens due to
processing changes in the protein structure which then prevent the antibody binding and this leads to
false negatives [15]. Also, due to the fact that ELISA methodology just relies on one protein region,
unspecific binding has also been shown which has led to false positives in some instances [16]. In this
work, the LC-MS/MS method was applied to some cookies as well as gluten-free flour to determine its
ability to detect the markers in processed food. In Figure 8 it can clearly be seen that LC-MS/MS can
detect the markers in the processed food and distinguish between varieties. In the case of the oats cookie,
wheat and oats had been used in its manufacture and markers for both varieties were detected (barley and
rye were not present in any sample, although not shown in this figure). However, in the wheat cookie,
only wheat was used and this is the only species detected. In the gluten-free products, no gluten markers
were detected.
A final test was linearity of response and the sensitivity of the method. To test both of these,
gluten-free flour was spiked with gliadin (wheat protein obtained commercially) from a range of
5–200 ppm. A calibration line, shown in Figure 9, for one of the peptides clearly shows that the
LC-MS/MS response obtained for this wheat marker was linear—this was typical of the other markers
used for wheat—and for this marker a 10 ppm spike could be easily detected. Marker peptides therefore
could be detected at 5–10 ppm levels in the spiked sample of gluten-free flour even though the current
sample preparation used an 80-fold dilution of the original sample.
5. Conclusions
This work has demonstrated that LC-MS/MS can be used to detect gluten in processed food and food
ingredients. The work demonstrated that markers can be obtained which are specific for each individual
species of gluten. The presence of these multiple markers for individual species were not variety
dependent, as shown in a test of several single varieties of wheat flour (where all the same markers were
detected), but some were species-dependent. As well as species dependent markers, markers for proteins
that are present in rye, wheat and barley, but absent in oats, can also be added to the method to mimic the
behavior of the R5 antibody based ELISA method to generally pick up the species that are high in gluten
and affect people who suffer from Celiac disease. The method has been shown to detect levels of
5–10 ppm gluten proteins in gluten-free flour and offers an extended linear response which is envisaged
to be a lot larger than that normally obtained for ELISA assays. Further to this, as the current method
actually involves an 80-fold dilution of the sample, before injecting onto the LC-MSMS system, it offers
the potential of detecting low ppm (0.5–5 ppm) when an SPE protocol is used to collect concentrate and
purify the peptide markers.
The presence of multiple markers for each gluten variety and the potential of acquiring MRM
triggered product ion scans [12], offers multiple points for confirmation of gluten contamination and
provide confidence in the results, and reduces the risk of false positives and false negatives which can
occur in ELISA assays.

Foods 2014, 3 28
Conflicts of Interest
The authors declare no conflict of interest.
References
1. Heick, J.; Fischer, M.; Pöpping, B. First screening method for the simultaneous detection of seven
allergens by liquid chromatography mass spectrometry. J. Chromatogr. A 2011, 1218, 938–943.
2. Lock, S. Allergen Screening in Food by LC/MS/MS. In Proceedings of the 126th Annual Meeting
AOAC International, Las Vegas, NV, USA, 30 September–4 October 2012.
3. Shefcheck, K.J.; Musser, S.M. Confirmation of the allergenic peanut protein, Ara h1, in a model
food matrix using liquid chromatography/tandem mass spectrometry. J. Agric. Food Chem. 2004,
52, 2785–2790.
4. Hernando, A.; Mujico, J.R.; Mena, M.C.; Lombardía, M.; Méndez, E. Measurement of wheat gluten
and barley hordeins in contaminated oats from Europe, the United States and Canada by Sandwich
R5 ELISA. Eur. J. Gastroenterol. Hepatol. 2008, 20, 545–554.
5. Lock, S.; Lane, C.; Jackson, P.A.; Serna, A. The Detection of Allergens in Bread and Pasta by
Liquid Chromatography Tandem Mass Spectrometry. Available online: http://www.absciex.com/
Documents/Downloads/Literature/Allergens-4000-QTRAP_AB%20SCIEX_1830610–01.pdf
(accessed on 16 September 2013).
6. Food Standards Agency. Labelling of ‘Gluten-Free’ Foods. Available online:
http://www.food.gov.uk/business-industry/guidancenotes/allergy-guide/gluten/#.UiRckH9m7ps
(accessed on 1 January 2012).
7. Commission regulation (EC) No 41/2009 of 20 January 2009 Concerning the Composition and
Labeling of Foodstuffs Suitable for People Intolerant to Gluten (Text with EEA Relevance).
Available online: http://eur-lex.europa.eu/LexUriServ/LexUriServ.do?uri=CELEX:32009R0041:en:NOT
(accessed on 12 September 2013)
8. U.S. Food and Drug Administration. What Is Gluten-Free? FDA Has an Answer. Available online:
http://www.fda.gov/ForConsumers/ConsumerUpdates/ucm363069.htm (accessed on 2 August 2013).
9. Lock, S. Gluten Detection in Food by LC/MS/MS. In Proceedings of the 126th Annual Meeting
AOAC International, Las Vegas, NV, USA, 30 September–4 October 2012.
10. Rombouts, I.; Lagrain, B.; Brunnbauer, M.; Delcour, J.A.; Koehler, P. Improved Identification of
Wheat Gluten Proteins through Alkylation of Cysteine Residues and Peptide-Based Mass
Spectrometry. Available online: http://www.nature.com/srep/2013/130724/srep02279/full/
srep02279.html (accessed on 24 July 2013).
11. Lock, S. Allergen Detection in Wine by LC/MS/MS. In Proceedings of the 127th Annual Meeting
AOAC International, Chicago, IL, USA, 25–28 August 2013.
12. Champion, M.; Duchoslav, E.; Hunter, C. Targeted, Hypothesis-Driven Mass Spectrometry: MRM
Initiated Detection and Sequencing using the MIDAS™ Workflow for Faster, More Intelligent and
Sensitive Protein Discovery and Characterization; AB SCIEX: Warrington, UK, 2007.

Foods 2014, 3 29
13. Mriziq, K.; Hobbs, S.; Settineri, T.; Neyer, D. Higher Sensitivity and Improved Resolution
Microflow UHPLC with Small Diameter Turbo V™ Source Electrodes and Hardware for Use
with the Eksigent expressHT™ Ultra System. Available online: http://www.eksigent.com/
Documents/Downloads/Literature/Higher_Sens_Res_LC_Small_Diam_Electrodes_4590211–01.pdf
(accessed on 16 September 2013).
14. UniProt. Available online: http://www.uniprot.org/ (accessed on 16 September 2013).
15. Pöpping, B. No Hiding for Allergens Appropriate Extraction Methodologies. In Proceedings of the
127th Annual Meeting AOAC International, Chicago, IL, USA, 25–28 August 2013.
16. Stelk, T.; Niemann, L.; Lambrecht, D.M.; Baumert, J.L.; Taylor, S.L. An innovative sandwich
ELISA system based on an antibody cocktail for gluten analysis. J. Food Sci. 2013, 78, 1091–1093.
© 2013 by the authors; licensee MDPI, Basel, Switzerland. This article is an open access article
distributed under the terms and conditions of the Creative Commons Attribution license
(http://creativecommons.org/licenses/by/3.0/).


![As [mg kg -1 ] Arsenic speciation in seaweeds using liquid chromatography hydride generation atomic fluorescence spectrometry (HPLC-HG-AFS) Liam Morrison](https://img.pdfslide.us/doc/110x75/551b6c07550346a6148b4cd1/as-mg-kg-1-arsenic-speciation-in-seaweeds-using-liquid-chromatography-hydride-generation-atomic-fluorescence-spectrometry-hplc-hg-afs-liam-morrison.jpg)