Embed Size (px)
Citation preview
TA
ECHNOLOGICA
CTASCIENTIFIC/PROFESSIONAL JOURNAL
OF CHEMISTRY AND TECHNOLOGY
FACULTY OF TECHNOLOGY
UNIVERSITY OF TUZLA
ISSN 1840-0426 (P)ISSN 2232-7568 (E)
Vol. 12No. 1Pages 1-36June 2019Tuzla, Bosnia and Herzegovina

TA
ECHNOLOGICA
CTASCIENTIFIC/PROFESSIONAL JOURNAL
OF CHEMISTRY AND TECHNOLOGY
FACULTY OF TECHNOLOGY
UNIVERSITY OF TUZLA
ISSN 1840-0426 (P)ISSN 2232-7568 (E)
Vol. 12No. 1Pages 1-36June 2019Tuzla, Bosnia and Herzegovina
Publisher Faculty of Technology, University in Tuzla
Editor-in-Chief Vahida Selimbašić
Deputy Editor Zahida Ademović
Administrative Secretary Vedran Stuhli
Scientific Board Sadik Latifagić, Nihada Latifagić, Ranka Kubiček, Jozo Budimir, Muhamed Bijedić, Drago Šubarić (Croatia), Zoltan Zavargo (Serbia), Vahida Selimbašić
Editorial Board Midhat Jašić, Sead Ćatić, Gordan Avdić, Elvis Ahmetović, Tajana Krička (Croatia), Jovica Hardi (Croatia), Radoslav Grujić, Stanko Blatnik (Slovenia), Bruno Zelić (Croatia), Zorka Novak Pintarić (Slovenia), Branka Andričić (Croatia), Mitja Kolar (Slovenia), Vlado Guberac (Croatia), Jadranka Blaževska-Gilev (Macedonia), Matjaž Kunaver (Slovenia), Ljubica Dokić (Serbia)
Proofreader/English Language Adviser Milja Jogunčić, English teacher
Technical Editor & Layout Franc Andrejaš
Cover Illustration Derivative work: Dhatfield (talk) MM_PEF.svg: Edboas [CC BY-SA 3.0 (https://creativecommons.org/licenses/by-sa/3.0)]
Editorial Office Nermina Jahić (Technical Secretary) Faculty of Technology, University in Tuzla Univerzitetska 8, 75000 Tuzla, Bosnia and Herzegovina Phone/fax: +387 35 320 740 / +387 35 320 741
Printing ˝HARFOGRAF˝ Tuzla
Circulation 100
Technologica Acta is indexed in CAB Abstracts, COBISS, Index Copernicus Journal Master List, EBSCO, HRČAK, ROAD, Directory of Journal Quality Factor... Also recognized by Google Scholar, ResearchGate, OpenAIRE etc.
Technologica Acta is beeing published twice a year.
This number of Technologica Acta is supported by the Federal Ministry of Education, Science and Culture of Bosnia and Herzegovina

CONTENT Milena Jankulovska-Petkovska, Mirjana S. Jankulovska, Vesna Dimova Protonation of citraconic and glutaconic acid in perchloric acid media .............................................1-8
Ermina Cilović, Adelheid Brantner, Huyen Thi Tran, Jelena Arsenijević, Zoran Maksimović Methanol extracts and volatiles of telekia speciosa (Cchreb.) Baumg from Bosnia and
Herzegovina .............................................................................................................................................9-13 Mirnesa Zohorović, Franc Andrejaš, Vedran Stuhli, Jelena Bršadinac, Mirza Selimbašić, Samra Halilović Thermal pretreatment of cattle manure for enhancing biogas production ....................................15-18
Tijana Brčina, Milica Vilušić, Amel Selimović, Ljilja Bojanović Influence of production parameters and additions on sensory properties and
consumer acceptance of probiotic fresh cheese ..................................................................................19-25
Emir Horozić, Zahida Ademović, Amira Cipurković, Jasmin Suljagić, Enida Roša, Adisa Sejfić, Darja Husejnagić, Snježana Hodžić Synthesis, spectral characterization, antibacterial and antifungal activity of
copper(II) - pABA Complex ................................................................................................................27-30 OPORPH – Second notice ......................................................................................................................31-32
Instructions for Authors.......................................................................................................................33-36


M. Jankulovska-Petkovska, M. S. Jankulovska, V. Dimova, “Protonation of citraconic and glutaconic acid…”, Technologica Acta, vol. 12, no. 1, pp. 1–8, 2019. 1
ISSN 1840-0426 (P); ISSN 2232-7588 (E) http://tf.untz.ba/technologica-acta
PROTONATION OF CITRACONIC AND GLUTACONIC ACID IN PERCHLORIC ACID MEDIA ORIGINAL SCIENTIFIC PAPER
Milena Jankulovska-Petkovska1, Mirjana S. Jankulovska2�, Vesna Dimova3 DOI: 10.5281/zenodo.3267263
RECEIVED 2019-01-22
ACCEPTED 2019-04-05
1 Ss Kliment Ohridski University, Faculty of Veterinary Medicine in Bitola, Macedonia 2 Ss. Cyril and Methodius University, Faculty of Agricultural Sciences and Food in Skopje, Macedonia 3 Ss Cyril and Methodius University, Faculty of Technology and Metallurgy in Skopje, Macedonia � [email protected]
ABSTRACT: The protonation process of citraconic and glutaconic acid in perchloric acid media was followed us-
ing the method of UV spectroscopy. The observed changes in the UV spectra of investigated acids confirmed that
the protonation process in perchloric acid with concentration from 5 to 10 mol/dm3 occurred. Glutaconic acid be-
haved as weak organic base in perchloric acid media and existed in its monoprotonated form. On the other hand,
citraconic acid existed in its protonated form and as protonated anhydride at higher perchloric acid concentra-
tion. Using the absorbance data the thermodynamic dissociation constants were calculated applying the methods
of Yates and McClelland, Bunnett and Olsen, and the “excess acidity” function method. The solvatation parame-
ters m, m* and φφφφ were evaluated, as well. In order to correct the medium effect the method of characteristic vector
analysis was applied. The possible site where the protonation may take place was discussed using the partial
atomic charge values determined according to AM1 and PM3 semiempirical methods.
KEYWORDS: citraconic acid, glutaconic acid, UV spectroscopy, thermodynamic dissociation constants, AM1
and PM3 semiempirical methods
INTRODUCTION
The structural formulas of citraconic (cis-2-methyl-1,2-ethylenedicarboxylic acid) and glutaconic (pent-2-enedioic acid) acid are shown in Scheme 1.
a b c
Scheme 1. Structural formulas of trans-glutaconic (a), cis-glutaconic (b) and citraconic acid (c)
Glutaconic acid exists in two forms: cis-glutaconic and trans-glutaconic acid. In the aqueous solutions cis-glutaconic acid undergoes izomerization and it is transformed into the trans-form which is more stable [1]. Glutaconic acid is important indus-trial substance because of their wide practical appli-cation. For instance, this acid can be used as mono-mer for production of biodegradable polyesters in chemical industry. Furthermore, glutaconic acid by condensation with suitable α,ω-diaminoalkanes par-ticipate in formation of polyamides [2]. Citraconic acid is used in the production of synthetic resins and polymers [1]. When the anhydride of citraconic acid reacts with primary amines an amide bond with a terminal carboxyl group can be formed. This reaction can be reversed in acidic condition i.e. pH from 3 to
4. It suggests that this anhydride can be used to block primary amine groups in alkaline conditions when pH value is between 7 and 9 [3]. The unsaturated dicarboxylic acids were studied by many authors, and some of them investigated the acid-base behavior of citraconic and glutaconic acid [4]-[7]. The protonation process of citraconic and glutaconic acid in sulfuric acid media was studied by several authors and the dissociation constants values (pKBH
+) of protonated acids were determined, as well [5]-[8]. Knowing the pKBH
+ values of carboxylic ac-ids is important in order to understand the mecha-nisms of the reactions in which they take part [9]. However, there is no literature data about thermody-namic dissociation constants values of citraconic and glutaconic acid determined in perchloric acid media. In order to investigate the influence of the strength of the acid and its anion on the protonation process it is important to use different mineral acids for protona-tion. Taking into consideration that thermodynamic pKBH
+ values are important parameters for weak or-
ganic acids the purpose of this work was to follow the protonation process of citraconic and glutaconic acid in perchloric acid media by means of UV spec-troscopy. The changes in the spectra can be used for determination of thermodynamic dissociation con-stant values of protonated acids. At the same time, using the semiempirical AM1 and PM3 quantum

2 M. Jankulovska-Petkovska, M. S. Jankulovska, V. Dimova, “Protonation of citraconic and glutaconic acid…”, Technologica Acta, vol. 12, no. 1, pp. 1–8, 2019.
ISSN 1840-0426 (P); ISSN 2232-7588 (E) http://tf.untz.ba/technologica-acta
chemical methods the possible protonation site in the molecules of the investigated acids can be predicted [10], [11]. EXPERIMENTAL
Chemicals and equipment: The stock solutions were prepared by dissolving a known amount of the investigated acids in redistilled water. The concentra-tion of citraconic acid in the stock solutions was 9.8 10-5 mol/dm3, while that of glutaconic acid was 8.3 10-5 mol/dm3. Two series of test solutions with con-stant concentration of investigated organic acids were prepared. The concentration of perchloric acid in the test solutions was varied between 1 mol/dm3 and 11 mol/dm3. The UV spectra of the two series of solu-tions were recorded at room temperature in the wave-length region from 190 nm to 290 nm with 1 nm res-olution, 24 hours after preparation of the test solu-tions. The absorbance data at the following wave-lengths: 198, 206, 214 and 220 nm were used for cal-culation of the pKBH
+ values of glutaconic acid. The wavelengths were selected around the maximum of the absorption band. The molar absorption coefficient values of the unprotonated form of glutaconic acid were determined at perchloric acid concentration of 1 mol/dm3 from the absorbance data at the same wave-lengths. It was considered that at this mineral acid concentration glutaconic acid existed in its unproto-nated form. The molar absorption coefficient values of protonated form of glutaconic acid were deter-mined when the perchloric acid concentration was 11 mol/dm3, because the protonation process of gluta-conic acid at this concentration was completed. All used substances were of analytical grade p.a (Alka-loid and Merck). The concentration of perchloric acid was determined by titration with a standard solution of sodium hydroxide. The UV spectra were recorded on a Varian Cary spectrophotometer using quartz cell with 1 cm length, at room temperature. All calcula-tions were performed by Microsoft Excel computer program. Calculation of the pKBH
+ values: It is well
known that the investigated carboxylic acids in water behave as proton donors, while in strong mineral acid media as proton acceptors. The protonation equilibria of these substances can be presented with the equa-tion (1). B + H3O
+ → BH+ + H2O .................................... (1) The pKBH
+ values in highly acidic media can be evaluated by Hammett [12] equation (2) in the fol-lowing form:
pKBH+
= H0 + logI .....................................................(2) where, pKBH
+ is the dissociation constant of protonat-ed form of the acid, H0 is Hammett acidity function, I is a ratio between the concentration of the protonated and unprotonated form of the acid (ionization ratio). When the absorbance values of protonated and unprotonated forms are measurable the ionization ratio can be calculated as logI = c(BH+)/c(B). B is the set of primary nitroanilines that serve as reference bases which can be protonated in strongly mineral acid media. The Hammett acidity function (H0) was no valid for all types of weak bases and it was up-graded by several authors. Bunnett and Olsen [13] calculated the thermodynamic dissociation constants according to the equation (3). logI + H0 = φ[H0 +logc(H+)] + pKBH
+ ......................(3) where, φ is a parameter which characterizes the changing activity coefficient behavior of bases with changing acidity. Using the equation (3) necessity of different acid-ity functions to characterize the protonation process of different bases was reduced to one acidity func-tion, i.e., Hammett acidity function. The method of Yates and McClelland also can be used to determine the thermodynamic pKBH
+ values [14]. In this case, the calculations can be made by the equation (4). logI = -mH0 + pKBH
+ ................................................(4) A plot of logI vs. –H0 gives a straight line with slope m, whose value is about 1. Actually, the pKBH
+
values should be calculated using the acidity func-tions which make possible the best slope of the de-pendence of logI vs. H0, i.e., slope closest to unity. This suggest that the protonation process is favored compared to the solvatation process and the pKBH
+ values calculated by this method would be more ac-curate. Furthermore, the method of Cox and Yates [15], also known as the “excess acidity” function method (Eq. 5), was applied to determine the ther-modynamic pKBH
+ values and the values of the solv-atation parameter m*. logI – logcH
+ = m*X + pKBH
+ ...................................(5)
where, m
* expresses the hydrogen-bonding solvata-tion of the protonated base. X is excess acidity func-tion which represents the difference between the ob-served acidity and that which the system would have if it was ideal.

M. Jankulovska-Petkovska, M. S. Jankulovska, V. Dimova, “Protonation of citraconic and glutaconic acid…”, Technologica Acta, vol. 12, no. 1, pp. 1–8, 2019. 3
ISSN 1840-0426 (P); ISSN 2232-7588 (E) http://tf.untz.ba/technologica-acta
The excess acidity function X is defined using the obtained data of the ionization ratio of 76 weak bases in 0-78% aqueous perchloric acid solutions [16]. These bases included compounds where the protona-tion centre is the atoms of N, C, O and S. Hence, us-ing the acidity function X the values of the dissocia-tion constants for different bases could be determined in aqueous perchloric acid solutions. The “excess acidity” function method is mostly used for determi-nation of pKBH
+ values of organic bases in strong mineral acid media [16]. RESULTS AND DISCUSSION
UV spectra of citraconic and glutaconic acid: The UV spectra of citraconic and glutaconic acid were recorded at the wavelength region from 190 to 280 nm, as it is shown in the Figs. 1 and 2, respec-tively.
Fig. 1. Experimental UV spectra of citraconic acid(c = 9.8 10-5
mol/dm3) in perchloric acid media (c(HClO4) = 1 mol/dm3 (spectrum 1), c(HClO4) = 11 mol/dm3 (spectrum 11))
At lower perchloric acid concentration (below 5 mol/dm3) in the spectrum of citraconic acid a single band at 212 nm (marked with 1, in the Fig. 1) ap-peared (See Fig. 1). When the concentration of per-chloric acid increased this band shifted monotonic to 204 nm (marked with 11 in the Fig. 1) and its intensi-ty increased. At higher perchloric acid concentration a new band at 246 nm appeared. These two absorp-tion bands are due to the π→π* electron transitions. In accordance with the previous investigations [5]-[8] it was expected that the citraconic acid exists in the protonated form and protonated anhydride, as a result of partial dehydratation of the formed protonated acid [17].
It suggested that the reaction of protonation and dehydratation took place at the same time. Hence, the absorption band which appeared at 246 nm (See Fig. 1) was due to existence of the anhydride in the solu-tion. The existence of two bands in the spectrum of citraconic acid was in agreement with the literature data which confirmed that for some organic acid at higher mineral acid concentration anhydrides are formed [17], [18]. In the spectrum of glutaconic acid a single absorption band around 214 nm (marked with 1 in the Fig. 2) appeared. When the perchloric acid concentration increased the hypsochromic effect was observed, similarly as it was case with the changes in the position of the spectral band of citra-conic acid, and the intensity of this band insignifi-cantly increased. When the concentration of perchlo-ric acid was 11 mol/dm3 the band was placed at 204 nm (marked with 11 in the Fig. 2).
Fig. 2. Experimental UV spectra of glutaconic acid (c = 8.3 10-5
mol/dm3) in perchloric acid media (c(HClO4) = 1 mol/dm3
(spectrum 1), c(HClO4) = 11 mol/dm3 (spectrum 11))
On the basis of these results and previous studies [4]-[8], the existence of one isosbestic point in the UV spectra of citraconic and glutaconic acid was ex-pected. However, its position could not be estab-lished clearly, because of the influence of the solvent. In order to determine the precise position of the isos-bestic points, and to separate the influence of the sol-vent the experimental spectra were reconstructed us-ing the method of characteristic vector analysis (CVA) [19]. The obtained reconstructed spectra of citraconic and glutaconic acid are shown in the Figs. 3 and 4, respectively.

4 M. Jankulovska-Petkovska, M. S. Jankulovska, V. Dimova, “Protonation of citraconic and glutaconic acid…”, Technologica Acta, vol. 12, no. 1, pp. 1–8, 2019.
ISSN 1840-0426 (P); ISSN 2232-7588 (E) http://tf.untz.ba/technologica-acta
Fig. 3. Reconstructed UV spectra of citraconic acid (c = 9.8 10-5
mol/dm3) in perchloric acid media
Fig. 4. Reconstructed UV spectra of glutaconic acid (c = 8.3 10-5
mol/dm3) in perchloric acid media
As it can be seen from the Fig. 3, two isosbestic points existed in the spectrum of citraconic acid, the first one at 210 nm and the second one at 234 nm. It means that there were three forms able to absorb UV radiation in the system: the acid in its unprotonated form, the protonated form of the acid and the proto-nated anhydride. Because of that, it was complicated to determine the pKBH
+ values of citraconic acid. Hence, the protonation process of citraconic acid was characterized only qualitatively. The existence of one isosbestic point at 212 nm in the spectrum of gluta-conic acid (See Fig. 4) suggested that in the reaction system two forms were present, i.e., the unprotonated
and protonated form of glutaconic acid. This result was in agreement with the investigations made for similar systems [4-8]. Furthermore, the one step of protonation of glutaconic acid was confirmed with the dependence of the absorbance at 220 nm on per-chloric acid concentration. This dependence had a sigmoidal shape, i.e., sigmoidal curve, S (See Fig. 5).
Fig. 5. The dependence of the absorbance (λ = 220 nm) of glutaconic acid (c = 8.3 10-5 mol/dm3)
on perchloric acid concentration
From the Fig. 5 it could be seen that the S curve had only one step. It confirmed that only one carbox-ylic group was protonated. When the concentration of perchloric acid was below 6 mol/dm3 (H0 = -2.10) the glutaconic acid existed in its unprotonated form, while at perchloric acid concentration up to 10 mol/dm3 (H0 = -5.23) the protonated form of the acid was formed. In agreement with previous investiga-tions of similar organic acids obtained in mineral acid media and on the base of the results presented in this investigation, it was clear that in perchloric acid me-dia the protonation process of citraconic and gluta-conic acid took place [4]-[8]. Partial atomic charges: The exact place of pro-tonation of the investigated organic acid is an im-portant question. In order to establish the site of pro-tonation of some organic acids (fumaric, maleic, aco-nitic, glutaconic, citraconic and mezaconic acid) many authors used different methods such as: ultra-violet, infrared, Raman, mass and NMR spectroscopy [20]-[23]. Most of them suggested that the protona-tion takes place on the oxygen of the carbonyl group [18], [24]-[26]. The possible protonation reaction of glutaconic and citraconic acid in perchloric acid me-dia can be predicted according to the literature data and the calculated values of the partial charges using semiempirical methods [27]. In this work AM1 (Aus-tin Model 1) and PM3 (Parametric Method 3) sem-iempirical methods were used for optimization of the geometry of investigated acids [10], [11]. For that

M. Jankulovska-Petkovska, M. S. Jankulovska, V. Dimova, “Protonation of citraconic and glutaconic acid…”, Technologica Acta, vol. 12, no. 1, pp. 1–8, 2019. 5
ISSN 1840-0426 (P); ISSN 2232-7588 (E) http://tf.untz.ba/technologica-acta
purpose HyperChem computer program was used [28]. The partial atomic charges of atoms which are possible protonation centers in the molecule of the investigated acids were determined by AM1 (Austin Model 1) and PM3 (Parameterized Model 3) methods (Tables 1-3). Table 1. Atomic charges of cis-glutaconic acid calculated by AM1
and PM3 semiempirical methods
proto-nation
site AM1 PM3
1 O -0.3114 -0.3045 2 C 0.3089 0.3815 3 C -0.1560 -0.0869 4 C -0.0625 -0.0353 5 C -0.2031 -0.1940 6 C 0.3359 0.4187 7 O -0.3081 -0.3011 8 O -0.3640 -0.3971
9 O -0.3768 -0.4098
Table 2. Atomic charges of trans-glutaconic acid calculated by
AM1 and PM3 semiempirical methods
proto-nation
site AM1 PM3
1 O -0.3178 -0.3110 2 C 0.3064 0.3783 3 C -0.1455 -0.0769 4 C -0.0730 -0.0480 5 C -0.1972 -0.1909 6 C 0.3383 0.4159 7 O -0.3145 -0.3052 8 O -0.3475 -0.3826
9 O -0.3577 -0.3945
Table 3. Atomic charges of citraconic acid calculated by AM1
and PM3 semiempirical methods
proto-nation
site AM1 PM3
1 O -0.3060 -0.3003 2 C 0.3342 0.4117 3 C -0.1400 -0.1287 4 C -0.0269 -0.0372 5 C 0.3290 0.4045 6 O -0.3036 -0.2953 7 O -0.3489 -0.3895
8 O -0.3549 -0.3917
9 C -0.2030 -0.0918 According to the values of partial atomic charge (Tables 1 and 2) the protonation process of glutacon-ic acid occurred on the oxygen of the carbonyl group
which is closer to the double bond (marked with 9) probably as a result of higher electronic density on that place in the molecule. The citraconic acid was protonated on the carbonyl oxygen of the carboxylic group marked with 8 (Table 3). The similar atomic charge values were obtained for the oxygen atom of the carbonyl group which is closer to the methyl group (marked with 7) probably because of its posi-tive inductive effect. Determination of the pKBH
+ values: The proto-
nation process of glutaconic acid was quantitatively characterized with the pKBH
+ values calculated using the following methods: Bunnett and Olsen [13], Yates and McClelland [14], and Cox and Yates [15] (equations (3-5)). The pKBH
+ values could be calcu-lated using the data of the acidity functions H0 and X which are known from the literature [12], [15], [29]-[31] and the ionization ratio between the concentra-tion of protonated and unprotonated form of the acid, I. This ratio was determined from the absorbance da-ta according to Beer's law [32], [33]. Actually, the concentrations of protonated and unprotonated form of the acids were determined from absorbance data (experimental and reconstructed) using an overde-termined system of four equations (absorbance val-ues) with two unknown parameters (concentration of unprotonated and protonated form). The molar ab-sorption coefficient values (needful for calculation of the ionization ratio) were obtained by measuring the absorbance values at the concentration of perchloric acid when glutaconic acid existed in its protonated and unprotonated form. The molar absorption coeffi-cients, absorbance data, and the ionization ratio val-ues at the selected wavelengths of glutaconic acid are given in Table 1. There is no acidity functions determined when carboxylic acids were used as indicators. Thus, the pKBH
+ values could be determined using the acidity
functions obtained with compounds which are proto-nated at the same protonation center as the investi-gated acids [34]. When the method of Yates and McClelland [14] was used the calculations were made with the amide acidity function (HA) instead of H0. The pKBH
+ obtained in this way was close to those calculated according to the “excess acidity” function method [15]. Because of that, the HA acidity function was considered as more appropriate for cal-culation of the pKBH
+ values. In this case it was ex-pected that the slope parameter would have the value equal to unity. The pKBH
+ values of glutaconic acid also were determined graphically using the method of Davis and Geissman [35]. Namely, when logI = 0, it is as-

6 M. Jankulovska-Petkovska, M. S. Jankulovska, V. Dimova, “Protonation of citraconic and glutaconic acid…”, Technologica Acta, vol. 12, no. 1, pp. 1–8, 2019.
ISSN 1840-0426 (P); ISSN 2232-7588 (E) http://tf.untz.ba/technologica-acta
sumed that the acid is half protonated, then H0 = (H0)1/2. These values multiplied with the slope pa-rameter m gave the graphically value of the pKBH
+, i.e pKBH
+ = m⋅(HA)1/2. The values of the solvatation pa-rameters m, m* and φ, the correlation coefficients, the standard deviation (SD) and relative standard devia-tion (RSD) were calculated, as well. The dependence of logI on H0 is linear with slope which depend on
the method of calculation, and with an intercept equal to the graphic value of the thermodynamic dissocia-tion constant. In the “excess acidity” function method the dependence of logI – logcH
+ vs. X was linear. The dependence of logI on HA (Yates and McClelland method) and logI – logcH
+ on X (Cox and Yates method) for glutaconic acid in perchloric acid media is shown in the Figs. 6 and 7, respectively.
Table 4. The spectrophotometric data of glutaconic acid (c = 8.3 10-5 mol/dm3) in perchloric acid media,
and values of logI (reconstructed spectra)
c(HClO4) [mol/dm3]
logI A198 A205 A214 A220
1 0.5018 0.7418 0.8683 0.7924 2 0.8815 0.9953 0.8174 0.5423 3 0.7547 0.9731 0.8013 0.5747 4 0.7832 0.9942 0.8212 0.5320 5 -1.185 0.8363 1.0108 0.8573 0.4580 6 -0.731 0.7207 0.9598 0.8542 0.5325 7 -0.219 0.6871 0.8931 0.8263 0.6259 8 0.284 0.5589 0.8871 0.8488 0.6827 9 0.791 0.5280 0.8409 0.8935 0.7599 10 1.602 0.5140 0.7534 0.8672 0.7913 11 0.5087 0.7218 0.8354 0.8047 *εB 95635 104791 89528 60968
εBH+ 60234 90933 104653 95509
*The molar absorption coefficient values (ε [dm3 mol-1 cm-1]) of un-protonated and protonated form of glutaconic acid
Fig. 6. The dependence of logI on HA for glutaconic acid
Fig. 7. The dependence of logI-logcH+ on X for glutaconic acid
As it was mentioned before HA is the most ade-quate one for determination of the pKBH
+ values for dicarboxylic acids, i.e., using this function the slope value closest to unity was obtained (See Fig. 6). The values of the numerically and graphically obtained thermodynamic dissociation constants (pKBH
+) with their confidence interval at 95% confidence levels, the slope parameters (m, m* and φ) and statistical data are presented in Table 2. The thermodynamic dissociation constants (pKBH
+) determined according to Bunnett and Olsen had more negative values compared to those calcu-lated by other methods (see Table 5). As a result of different grade of solvatation of the used bases the slope parameter φ was not equal to unity. This pa-rameter had positive value which means that the solvatation of glutaconic acid was more pronounced than that of Hamett’s indicators used to set up the H0 scale [12]. The values of the solvatation parameter m* (“excess acidity” function method) for glutaconic acid were similar to those obtained for amides (m* = 0.51 ± 0.07) which additionally confirmed that the amide acidity function was the most suitable one for calculation of the pKBH
+ for this acid [13]. Therefore,

M. Jankulovska-Petkovska, M. S. Jankulovska, V. Dimova, “Protonation of citraconic and glutaconic acid…”, Technologica Acta, vol. 12, no. 1, pp. 1–8, 2019. 7
ISSN 1840-0426 (P); ISSN 2232-7588 (E) http://tf.untz.ba/technologica-acta
in Yates and McClelland’s equation (Eq. 3) HA in-stead of H0 was used [12]. As a result of that the val-ues of the slope parameter m were close to unity, and the pKBH
+ values can be considered as thermodynam-ic dissociation constants. The pKBH
+ values calculated with this method were similar to those calculated ac-cording to the “excess acidity” function method [13]. It suggested that the method of Yates and McClelland
was more reliable for determination of pKBH+ values
than the method of Bunnett and Olsen. The pKBH+
values of glutaconic acid determined in perchloric acid media were more positive compared to pKBH
+ values which we had reported in sulfuric acid media [8]. It was expected because perchloric acid is stronger than sulfuric acid as a result of the influence of the anion.
Table 5. Thermodynamic pKBH+ values of glutaconic acid
(experimental and reconstructed spectra)
experimental spectra reconstructed spectra “excess acidity” function method
pKBH+
(numerically) pKBH
+
(graphically) m
* pKBH
+
(numerically) pKBH
+
(graphically) m
*
-2.61±0.027 SD = 0.034 RSD = 1.31
-2.62 0.70 -2.66±0.017
s = 0.022 V = 0.81
-2.67 0.67
Bunnett and Olsen
pKBH+
(numerically) pKBH
+
(graphically) φ pKBH
+
(numerically) pKBH
+
(graphically) φ
-3.81±0.035 s = 0.039 V = 1.03
-3.80 0.57 -3.92±0.031
s = 0.044 V = 1.12
-3.81 0.51
Yates and McClelland
pKBH+
(numerically) pKBH
+
(graphically) m
pKBH+
(numerically) pKBH
+
(graphically) m
-2.83±0.043 s = 0.02 V = 1.22
-2.80 1.09 -2.75±0.032
s = 0.060 V = 1.11
-2.73 1.04
CONCLUSION
The protonation reaction of glutaconic acid took place in perchloric acid media, i.e., this acid existed in its protonated form at perchloric acid concentra-tion up to 10 mol/dm3. On the other side, citraconic acid at higher perchloric acid concentration existed in its protonated form and as a protonated anhydride, as well. Thus, the thermodynamic dissociation constants were determined for glutaconic acid, while the proto-nation process of citraconic acid was characterized only qualitatively. There was no significant differ-ence between the numerically and graphically calcu-lated pKBH
+ values which was statistically confirmed. The differences between the thermodynamic dissoci-ation constants obtained from the experimental and the reconstructed spectra were also insignificant. It indicated that there was a little influence of the sol-vent on the appearance of the spectra compared to the effect of the protonation reaction. The correlation coefficient values of the dependence of logI on HA (amide acidity function) or X (“excess acidity” func-tion method) used acidity function were between 0.995 and 0.998. This suggested a good correlation
between the values used for calculation of the pKBH+
and the slope parameter values obtained using the different acidity functions. REFERENCES
[1] H. Warson, C. A. Finch, Applications of synthetic resin
lattices, John Wiley & Sons Ltd., Chichester, England, Vol.135, 2001.
[2] S. Kind, W. K. Jeong, H. Schröder, C. Wittmann, “Systems-wide metabolic pathway engineering in Corynebacterium
glutamicum for bio-based production of diaminopentane”, Metab. Eng., vol. 12, pp. 341-351, 2010.
[3] M. H. Klapper, I. M. Klotz, “Acylation with dicarboxylic acid anhydrides”, Methods in Enzimol., vol. 25, pp. 531-532, 1972.
[4] I. Spirevska, L. Šoptrajanova, B. Andonovski, “Protonation of itaconic acid in sulfuric and perchloric acid”, Bull. Chem.
Technol. Macedonia, vol. 8, pp. 151-156, 1990. [5] L. Šoptrajanova, I. Spirevska, “Behaviour of citraconic and
mesaconic acid in strong acid media”, Bull. Chem. Technol.
Macedonia, vol. 10, pp. 21-26, 1991.
[6] I. Spirevska, L. Šoptrajanova, K. Jankovska, B. Andonovski, “UV study of the formation of superacids in a sulfuric acid medium”, J. Mol. Struc., vol. 293, pp. 93-96, 1993.
[7] K. Jankoska, L. Šoptrajanova, I. Spirevska, “Protonation of citraconic and mesaconic acid in aqueous and ethanolic so-

8 M. Jankulovska-Petkovska, M. S. Jankulovska, V. Dimova, “Protonation of citraconic and glutaconic acid…”, Technologica Acta, vol. 12, no. 1, pp. 1–8, 2019.
ISSN 1840-0426 (P); ISSN 2232-7588 (E) http://tf.untz.ba/technologica-acta
lutions”, Bull. Chem. Tehnol. Macedonia, vol. 18, no. 1, pp. 47-50, 1999.
[8] M. Jankulovska, L. Šoptrajanova, I. Spirevska, “Behaviour of Glutaconic and Aconitic acid in a sulfuric acid medium”, Bull. Chem. Technol. Macedonia, vol. 25, no. 2, pp. 89-97, 2006.
[9] J. Reijenga, A. van Hoof, A. van Loon, B. Teunissen, “De-velopment of Methods for the Determination of pKa Values”, Anal. Chem. Insights., vol. 8, pp. 53-71, 2013.
[10] M. J. S. Dewar, K. M. Dieter, “Evaluation of AM1 Calculat-ed Proton Affinities and Deprotonation Enthalpies”, J. Am.
Chem. Soc., vol. 108, pp. 8075-8086, 1986.
[11] J. J. P. Steawart, “Optimization of Parameters for Semi-Empirical Methods I-Method”, J. Comput. Chem., vol. 10, pp. 209-216, 1989.
[12] L. P. Hammett, A. J. Deyrup, “A series of simple basic indi-cators. I. The acidity functions of mixtures of sulfuric and perchloric acids with wather”, J. Am. Chem. Soc., vol. 54, pp. 2721-2739, 1932.
[13] J. F. Bunnett, F. P. Olsen, “Linear free energy relationships concerning equilibria in moderately concentrated mineral acids”, Can. J. Chem., vol. 44, pp. 1899-1915, 1966.
[14] K. Yates, R. A. McClelland, “Mechanisms of Ester Hydrol-ysis in Aqueous Sulfuric Acids”, J. Am. Chem. Soc., vol. 89, pp. 2686-2692, 1967.
[15] R. A. Cox, K. Yates, “Excess Acidities. A Generalized Method for the Determination of Basicities in Aqueous Acid Mixtures”, J. Am. Chem. Soc., vol. 100, pp. 3861-3867, 1978.
[16] G. Stojkovic, E. Popovski, “Determination and structural correlation of pKBH
+ for meta- and para-substituted ben-zamides in sulfuric acid solutions”, J. Serb. Chem. Soc., vol. 71, no. 10, pp. 1061-1071, 2006.
[17] A. M. Amat, G. Asensio, M. A. Miranda, M. J. Sabater, A. S. Fuentes, “Thermolysis of Unsaturated Dicarboxylic Acids in Sulfuric Acid and Oleum. A Comparison with the CIMS Fragmentation Patterns”, J. Org. Chem., vol. 53, pp. 5480-5484, 1988.
[18] J. W. Larsen, P.A. Bouis, “Protonation of Fumaric and Ma-leic Acids and Their Diethyl Derivatives”, J. Org. Chem., vol. 38, pp. 1415-1417, 1973.
[19] T. E. Edward, S. C. Wong, “Ionization of Carbonyl Com-pounds in Sulfuric Acid. Correction for Medium Effects by Characteristic Vector analysis”, J. Am. Chem. Soc., vol. 99, pp. 4229-4232, 1977.
[20] S. Hoshimo, H. Hosoya, S. Magakura, “Ultraviolet, Infrared, and Raman spectra of protonated carboxylic acids”, Can. J.
Chem., vol. 44, pp. 1961-1965, 1966.
[21] T. Birchall, R. T. Gilespie, “Nuclear magnetic resonance studies of the protonation of weak bases in fluorosulfuric ac-
id: V Ketones, Carboxylic acids, and some other oxygen ba-ses”, Can. J. Chem., vol. 43, pp. 1045-1051, 1965.
[22] R. Stewart, K. Yates, “The position of Protonation of the Carboxyl Group”, J. Am. Chem. Soc., vol. 82, pp. 4059-4061, 1960.
[23] Z. Geltz, H. Kokocinska, R. I. Zalewski, T. Krygowski, “Thermodynamics of benzoic acid protonation”, J. Chem.
Soc. Perkin Trans., vol. II, pp. 1069-1070, 1983.
[24] D. S. Noyse, H. S. Avarbook, W. L. Reed, “Isotope Effects in the Acid-catalyzed Isomerization of Cinnamic Acids”, J.
Am. Chem. Soc., vol. 84, pp. 1647-1650, 1962.
[25] G. A. Olah, A. M. White, D. H. O'Brien, “Protonated het-eroaliphatic compounds”, Chem. Rev., vol. 70, pp. 561-567, 1970.
[26] F. M. Benoit, A. G. Harison, “Predictive value of Proton Affinity. Ionization Energy Correlations Involving Oxygen-ated Molecules”, J Am. Chem. Soc., vol. 99, pp. 3980-3984, 1977.
[27] M. J. S. Dewar, E.G. Zoebisch, E. F. Healy, J. J. P. Stewart, “Devlopment and Use of Quantum Mechanical Molecular Models. 76. AM1: A New General Purpose Quantum Me-chanical Model”, J. Am. Chem. Soc., vol. 107, pp. 3902-3909, 1985.
[28] HyperChem(TM) Professional 7.51, Hypercube, Inc., 1115 NW 4th Street, Gainesville, Florida 32601, USA
[29] M. A. Poul, F. A. Long, “H0 and related indicator acidity functions”, Chem. Rev., vol. 57, pp. 1-45, 1957.
[30] K. Yates, J. B. Stevans, A. R. Katritzky, “The ionization behaviour of amides in concentrated sulphuric acids”, Can.
J. Chem., vol. 42, p. 1957-1970, 1964.
[31] K. Yates, H. Wai, G. Welch, R. A. McClelland, “Medium Dependence of Acidity Functions and Activity Coefficients in Perchloric Acid”, J. Am. Chem. Soc., vol. 95, pp. 418-426, 1973.
[32] N. Perišić–Janjić, D. Baćanović, M. Lazarević, J. Janjić, “Protonation of N-[1-(benztriazole-1-yl) methyl] benzamide derivatives and N1-(phenylaminomethyl) benztriazole deriv-atives”, Bull. Chem. Technol. Macedonia, vol. 13, pp. 91-95, 1994.
[33] D. P. Bajkin, N. U. Perišić–Janjić, “Spectrophotometric study of the protonation of some benzilomonoxime deri-vates”, J. Serb. Chem. Soc., vol. 61, pp. 17-22, 1996.
[34] A. Bagno, B. Bujnicki, S. Bertrand, C. Comuzzi, F. Dorigo, P. Janvier, G. Sccorano, “Site of protonation of carboxylic and non-carboxylic amides in the gas phase and in water”, Chem. Eur. J., vol. 5, pp. 523-536, 1999.
[35] C. T. Davis, T. A. Geissman, “Basic Dissociation Constants of Some Substituted Flavones”, J. Am. Chem. Soc., vol. 76, pp. 3507-3511, 1954.

E. Cilović, A. Brantner, H.T. Tran, J. Arsenijević, Z. Maksimović, “Methanol Extracts and Volatiles of Telekia speciosa...”, Technologica Acta, vol. 12, no. 1, pp. 9–13, 2019. 9
ISSN 1840-0426 (P); ISSN 2232-7588 (E) http://tf.untz.ba/technologica-acta
METHANOL EXTRACTS AND VOLATILES OF TELEKIA SPECIOSA (SCHREB.) BAUMG. FROM BOSNIA AND HERZEGOVINA ORIGINAL SCIENTIFIC PAPER
Ermina Cilović1�, Adelheid Brantner2, Huyen Thi Tran2, Jelena Arsenijević3, Zoran Maksimović3 DOI: 10.5281/zenodo.3268729
RECEIVED 2018-12-21
ACCEPTED 2019-03-06
1 University of Tuzla, Faculty of Pharmacy, 75000 Tuzla, Bosnia and Herzegovina 2 Department of Pharmacognosy, University of Graz, Institute of Pharmaceutical Sciences, 8010 Graz, Austria 3 Department of Pharmacognosy, University of Belgrade, Faculty of Pharmacy, 11221 Belgrade, Serbia � [email protected]
ABSTRACT: The aim of the present study was to analyse the methanol extracts from the aerial and the under-
ground parts of Telekia speciosa (Schreb.) Baumg by HPLC and determine their antioxidant capacity. In addi-
tion, volatiles from both parts of the plant were analysed. The chlorogenic acid (CGA) and caffeic acid derivatives
were present in the extracts. The CGA content was 977.8±85 mg per 100 g extract for underground and 272.0±18
mg per100 g extract for aerial parts of T. speciosa. The antioxidant capacity, determined by DPPH and FRAP
method, was on average three and a half times higher for the extract of the underground parts in comparison
with the extract of the aerial plant parts. The volatile constituents determined by GC-FID/MS were characterized
by the presence of a high concentration of oxygenated sesquiterpenes. The obtained results contribute to better
knowledge of phytochemical properties of T. speciosa, which is traditionally used in bronchial asthma therapy.
KEYWORDS: Telekia speciosa, chlorogenic acid (CGA), antioxidant capacity, volatiles
INTRODUCTION
The only representative of the genus Telekia in
the flora of Bosnia and Herzegovina (BiH) is Telekia
speciosa (Schreb.) Baumg. It inhabits wet and shady
positions in mountain woodlands. It is a perennial
herbaceous plant with alternating, wide, whole leaves
and large heterogeneous heads which can be individ-
ual or in cluster blooms. It is widespread in Eastern
and Central Europe and the Balkan Peninsula [1].
The root of T. speciosa is traditionally used as a rem-
edy for bronchial asthma in Balkan countries. In BiH,
root smoke of this plant is used in inhalations for
bronchial asthma [2].
The root of T. speciosa contains essential oil, bit-
ter compounds and inulin [3]. Phytochemical investi-
gations have revealed T. speciosa as a rich source of
sesquiterpene lactones, especially in its underground
parts [4]. Isoalantolactone is almost exclusively con-
tained in the essential oil of T. speciosa roots. It is a
sesquiterpene lactone – an eudesmanolide with an
antiproliferative and anti-inflammatory activity [5].
Sesquiterpene lactones have been found to be active
bactericidal principles, as well [6].
The aerial part extracts have been found to con-
tain fatty acids, namely palmitic, linoleic, oleic and
caproic acids [7]. Reports concerning the sterols of T.
speciosa extracts can also be found in the literature
[8]. Pseudoguaianolide - 2,3-dihydroaromaticin and
three thymol derivatives have been isolated as major
secondary metabolites from the aerial parts of metha-
nol extract of T. speciosa.
Phenol acids derivatives in earlier investigations
were isolated from an extract of T. speciosa flowers.
Those compounds were: one derivative of ferulic ac-
id [(E)-ferulic acid 4-O-β-(6-O-2-hydroxy iso-
valeryl)-glucopyranoside] and five caffeic acid deriv-
atives [(E)-caffeic acid 4-O-β-(6-O-2-
hydroxyisovaleryl)-glucopyranoside, (E)-caffeic acid
4-O-β-(6-O-3-hydroxy-2-methylpropanoyl)-
glucopyranoside, 6-O-(E)-caffeoyl-glucopyranose,
(E)-caffeic acid 4-O-β-glucopyranoside] and 5-
caffeoylquinic acid (chlorogenic acid) [9].
The aim of the present study was to identify and
quantify phenol acids in the methanol extracts of T.
speciosa aerial and underground parts and determine
the antioxidant capacity of the extracts. To the best of
our knowledge, the chemical composition of the ex-
tracts of underground parts as well as the antioxidant
capacity of the plant extracts had never been studied
before. In addition, we analyzed the volatiles of both,
aerial and underground parts.
MATERIAL AND METHODS
PLANT MATERIAL
Aerial and underground parts of T. speciosa were
collected at their specific location of Zlača, Banovići

10 E. Cilović, A. Brantner, H.T. Tran, J. Arsenijević, Z. Maksimović, “Methanol Extracts and Volatiles of Telekia speciosa...”, Technologica Acta, vol. 12, no. 1, pp. 9–13, 2019.
ISSN 1840-0426 (P); ISSN 2232-7588 (E) http://tf.untz.ba/technologica-acta
municipality (BiH) during the flowering period in
August 2015. Geographical coordinates of the loca-
tion were N44°20'22.3" E18°33'39.6". The plant ma-
terial was identified according to Flora Croatia by
authors [10] and voucher specimen was deposited at
the Department of Pharmacognosy, Faculty of Phar-
macy, the University of Tuzla. The plant material
was cleaned, cut, and dried.
REAGENTS AND CHEMICALS
All the reagents used were of analytical grade.
Folin-Ciocalteu´s phenol reagent, sodium carbonate,
sodium acetate anhydrous, and ferric (III) chloride
were obtained from Merck (Germany). HPLC-grade
acetonitrile and formic acid were purchased from
Merck. Water for HPLC was prepared by Milli-Q
Water Purification System. Methanol, 2,2-diphenyl-
1-picrylhydrazyl (DPPH) radical, 2,4,6-tris(2-
pyridyl)-s-triazine (TPTZ), ferrous (II) sulfate hep-
tahydrate, hydrochloric acid, glacial acetic acid,
HPLC-grade chlorogenic acid, caffeic acid, ellagic
acid, gallic acid, and o-coumaric acid were purchased
from Sigma-Aldrich (USA). Rutin and ferulic acid
were obtained from Carl Roth (Germany).
PLANT EXTRACTS
The dried plant material was crushed in a grinder
until powder formation. The samples were extracted
with 98% methanol on a magnetic stirrer under reflux
at 50 °C for 1 hour. The mixtures were filtered
through a filter paper (Whatman No. 1). The metha-
nol was removed by evaporation. The dried extracts
were stored in the fridge at 4 °C, in glass bottles for
further investigations.
HPLC ANALYSES
HPLC analyses of extracts (3 mg/mL in metha-
nol) were carried out using an Agilent 1260 Infinity
(Agilent Technologies, USA) system equipped with a
Agilent 1260 Infinity Quaternary Pump, Agilent
1260 Infinity Standard Autosampler, Agilent 1260
Infinity Diode Array Detector, and Agilent 1260 In-
finity Thermostatted Column Compartment. The sep-
arations were performed on a Merck LiChro-
CARTR250-4 C18 RP analytical column
(250x4.6mm i.d., 5µm). The mobile phase consisted
of 0.1% formic acid in water (solvent A) and acetoni-
trile (solvent B). The following gradient was applied:
0-15 min, linear gradient from 10% to 20% B; 15-30
min, linear gradient from 20% to 30% B; 30-35 min,
linear gradient from 30% to 40% B; 35-40 min, linear
gradient from 40% to 90% B; 40-45 min, then re-
turned to the initial conditions. The injection volume
was 10 µL; the flow rate was 0.8 mL/min. The detec-
tion wavelength was 325 nm, and the column ther-
mostat was set at 30 °C [11]. Component identifica-
tion was performed comparing their retention times
and UV spectra with those obtained from standards.
The calibration curve for chlorogenic acid was ob-
tained by the external standard method in the concen-
tration range of 15.6-500 µg/mL (y=28.93x-220.2,
R2=0.9996).
TOTAL PHENOL CONTENT AND ANTIOXIDANT CAPACITY
The total phenol content was determined by the
Folin Ciocalteu spectrophotometric method [12]. The
in vitro antioxidant capacity was evaluated by the
2,2-diphenyl-1-picrylhydrazyl (DPPH) radical assays
[13] and the ferric reducing antioxidant potential
(FRAP) [14].
ISOLATION AND GC-FID/MS ANALYSES OF ESSENTIAL
OILS
The dried aerial and underground parts of T. spe-
ciosa were subjected to hydrodistillation for 3 h using
a Clevenger-type apparatus, according to the Europe-
an Pharmacopoeia. The obtained oils were separated,
dried over anhydrous sodium sulfate, and stored at -
20º C until the analysis.
The volatile constituents were determined by the
GC-FID/MS analyses using an Agilent 6890N GC
system coupled with an Agilent 5975 MSD, FID, and
equipped with a HP-5 MS capillary column (30 m x
0.25 mm, film thickness 0.25 µm). The oven temper-
ature was programmed linearly rising from 60 to 280
ºC at 3 º min-1
and then isothermal at 280 ºC for 5
min; injector 200 ºC; FID 300 ºC; transfer-line 250
ºC; carrier gas He (1.0 mL min-1
, constant flow
mode); injection volume 1 µL of essential oil dis-
solved in ethanol; split ratio 10:1. EI Mass spectra
(70 eV) were acquired over the m/z range of 35-550.
The identification of the individual compounds
was based on the comparison of their retention times
(tR), retention indices (RIs), and mass spectra with
those obtained from authentic samples and/or listed
in the NIST, Wiley mass spectral libraries, and the
literature [15]. For the quantification, the relative ar-
ea percentages obtained by FID were used.
RESULTS AND DISCUSSION
The yields of the methanol extracts of T. speciosa
were 4.31% and 11.52% for the aerial and under-
ground parts, respectively.
The qualitative and quantitative analysis of the
extracts was performed by the RP-HPLC method.
The chlorogenic acid (CGA) and caffeic acid deriva-
E. Cilović, A. Brantner, H.T. Tran, J. Arsenijević, Z. Maksimović, “Methanol Extracts and Volatiles of Telekia speciosa...”, Technologica Acta, vol. 12, no. 1, pp. 9–13, 2019. 11
ISSN 1840-0426 (P); ISSN 2232-7588 (E) http://tf.untz.ba/technologica-acta
tives (CA derivatives) were present in the extracts. In
the aerial parts of T. speciosa except CGA, two CA
derivatives (Rt - 22.464 min and Rt - 35.631min)
were detected. In the underground parts, except
CGA, four CA derivatives (Rt - 22.464 min, Rt -
25.433 min, Rt - 35.627 min and Rt - 37.694 min)
were also present. Caffeic acid and other reference
substances used in the analyses (gallic acid, o-
coumaric acid, ferulic acid, ellagic acid and rutin)
were not detected.
The content of chlorogenic acid was determined
in the extracts (Table 1). In the extracts from the un-
derground parts of T. speciosa the CGA content was
on average three and a half times higher than the
CGA content in the extracts from the aerial parts of
T. speciosa.
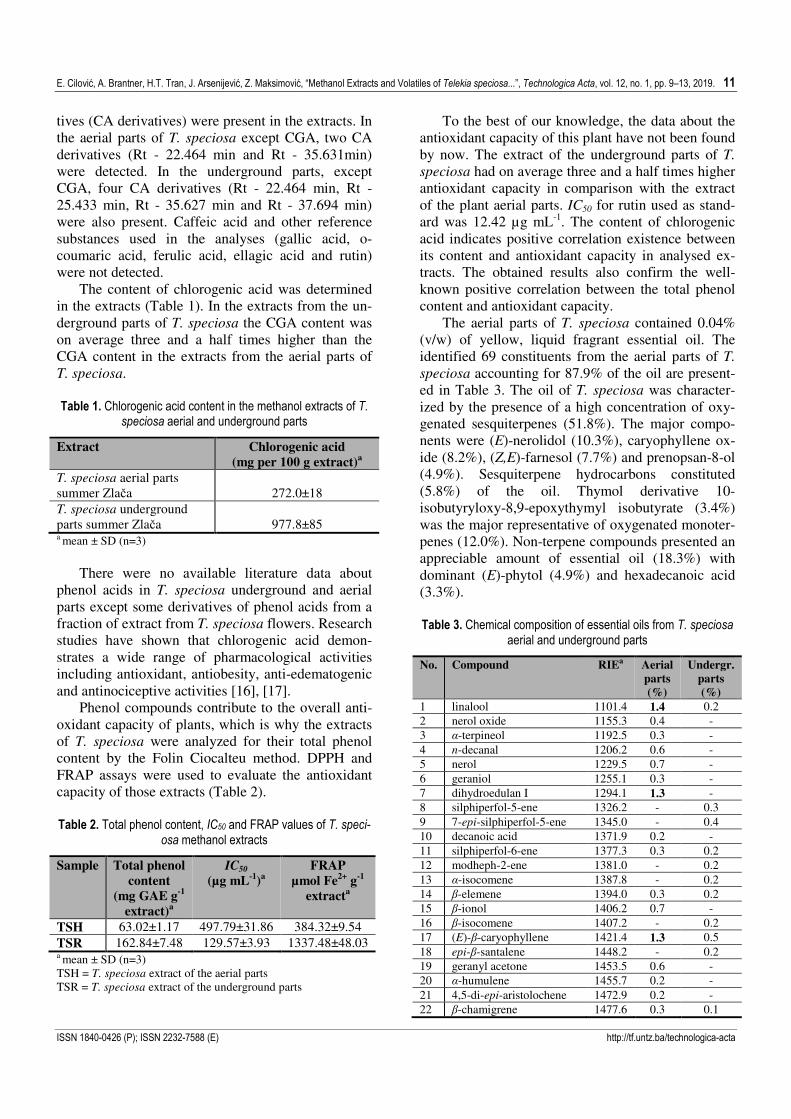
Table 1. Chlorogenic acid content in the methanol extracts of T.
speciosa aerial and underground parts
Extract Chlorogenic acid
(mg per 100 g extract)a
T. speciosa aerial parts
summer Zlača 272.0±18
T. speciosa underground
parts summer Zlača 977.8±85 a mean ± SD (n=3)
There were no available literature data about
phenol acids in T. speciosa underground and aerial
parts except some derivatives of phenol acids from a
fraction of extract from T. speciosa flowers. Research
studies have shown that chlorogenic acid demon-
strates a wide range of pharmacological activities
including antioxidant, antiobesity, anti-edematogenic
and antinociceptive activities [16], [17].
Phenol compounds contribute to the overall anti-
oxidant capacity of plants, which is why the extracts
of T. speciosa were analyzed for their total phenol
content by the Folin Ciocalteu method. DPPH and
FRAP assays were used to evaluate the antioxidant
capacity of those extracts (Table 2).
Table 2. Total phenol content, IC50 and FRAP values of T. speci-
osa methanol extracts
Sample Total phenol
content
(mg GAE g-1
extract)a
IC50
(µg mL-1
)a
FRAP
µmol Fe2+
g-1
extracta
TSH 63.02±1.17 497.79±31.86 384.32±9.54
TSR 162.84±7.48 129.57±3.93 1337.48±48.03 a mean ± SD (n=3)
TSH = T. speciosa extract of the aerial parts
TSR = T. speciosa extract of the underground parts
To the best of our knowledge, the data about the
antioxidant capacity of this plant have not been found
by now. The extract of the underground parts of T.
speciosa had on average three and a half times higher
antioxidant capacity in comparison with the extract
of the plant aerial parts. IC50 for rutin used as stand-
ard was 12.42 µg mL-1
. The content of chlorogenic
acid indicates positive correlation existence between
its content and antioxidant capacity in analysed ex-
tracts. The obtained results also confirm the well-
known positive correlation between the total phenol
content and antioxidant capacity.
The aerial parts of T. speciosa contained 0.04%
(v/w) of yellow, liquid fragrant essential oil. The
identified 69 constituents from the aerial parts of T.
speciosa accounting for 87.9% of the oil are present-
ed in Table 3. The oil of T. speciosa was character-
ized by the presence of a high concentration of oxy-
genated sesquiterpenes (51.8%). The major compo-
nents were (E)-nerolidol (10.3%), caryophyllene ox-
ide (8.2%), (Z,E)-farnesol (7.7%) and prenopsan-8-ol
(4.9%). Sesquiterpene hydrocarbons constituted
(5.8%) of the oil. Thymol derivative 10-
isobutyryloxy-8,9-epoxythymyl isobutyrate (3.4%)
was the major representative of oxygenated monoter-
penes (12.0%). Non-terpene compounds presented an
appreciable amount of essential oil (18.3%) with
dominant (E)-phytol (4.9%) and hexadecanoic acid
(3.3%).
Table 3. Chemical composition of essential oils from T. speciosa
aerial and underground parts
No. Compound RIEa Aerial
parts
(%)
Undergr.
parts
(%)
1 linalool 1101.4 1.4 0.2
2 nerol oxide 1155.3 0.4 -
3 α-terpineol 1192.5 0.3 -
4 n-decanal 1206.2 0.6 -
5 nerol 1229.5 0.7 -
6 geraniol 1255.1 0.3 -
7 dihydroedulan I 1294.1 1.3 -
8 silphiperfol-5-ene 1326.2 - 0.3
9 7-epi-silphiperfol-5-ene 1345.0 - 0.4
10 decanoic acid 1371.9 0.2 -
11 silphiperfol-6-ene 1377.3 0.3 0.2
12 modheph-2-ene 1381.0 - 0.2
13 α-isocomene 1387.8 - 0.2
14 β-elemene 1394.0 0.3 0.2
15 β-ionol 1406.2 0.7 -
16 β-isocomene 1407.2 - 0.2
17 (E)-β-caryophyllene 1421.4 1.3 0.5
18 epi-β-santalene 1448.2 - 0.2
19 geranyl acetone 1453.5 0.6 -
20 α-humulene 1455.7 0.2 -
21 4,5-di-epi-aristolochene 1472.9 0.2 -
22 β-chamigrene 1477.6 0.3 0.1

12 E. Cilović, A. Brantner, H.T. Tran, J. Arsenijević, Z. Maksimović, “Methanol Extracts and Volatiles of Telekia speciosa...”, Technologica Acta, vol. 12, no. 1, pp. 9–13, 2019.
ISSN 1840-0426 (P); ISSN 2232-7588 (E) http://tf.untz.ba/technologica-acta
No. Compound RIEa Aerial
parts
(%)
Undergr.
parts
(%)
23 thymol isobutyrate 1485.6 0.3 0.3
24 (E)-β-ionone 1487.8 0.7 -
25 neryl isobutanoate 1491.4 1.7 1.3
26 α-selinene 1498.3 0.7 0.2
27 β-bisabolene 1509.3 - 0.2
28 cameroonan-7α-ol 1512.1 0.7 -
29 modhephen-8β-ol 1515.5 0.3 0.4
30 (E)-dihydro-apofarnesal 1521.0 0.3 -
31 δ-cadinene 1525.8 1.1 -
32 cis-calamenene 1536.7 0.1 -
33 α-calacorene 1545.6 0.6 -
34 isocaryophyllene oxide 1556.5 1.5 -
35 epi-longipinanol 1562.1 0.2 -
36 (E)-nerolidol 1567.8 10.3 -
37 neryl (S)-2-methylbutyrate 1576.3 - 0.5
38 prenopsan-8-ol 1577.7 4.9 -
39 caryophyllene oxide 1587.6 8.2 1.3
40 humulene epoxide II 1612.4 0.9 0.2
41 cis-isolongifolanone 1614.3 0.5 -
42 muurola-4,10(14)-
dien-1β-ol 1631.6 0.4 -
43 α-acorenol 1634.3 - 0.1
44 caryophylla-4(12),8(13)-
dien-5- α-ol 1636.6 1.1 0.1
45 caryophylla-4(12),8(13)-
dien-5- β-ol 1640.6 2.6 -
46 β-eudesmol 1645.8 2.8 1.6
47 α-eudesmol 1653.1 0.3 -
48 atractylone 1656.3 - 0.4
49 selin-11-en-4α-ol 1657.7 0.8 0.4
50 14-hydroxy-(Z)-
caryophyllene 1667.9 0.7 0.2
51 trans-calamenen-10-ol 1670.2 0.3 -
52 14-hydroxy-9-epi-(E)-
caryophyllene 1674.5 2.0 0.7
53 cadalene 1677.7 0.6 -
54 epi-α-bisabolol 1685.2 0.5 -
55 6-methoxythymyl
isobutirate 1687.5 0.6 0.4
56 n-heptadecane 1698.4 0.7 0.2
57 δ-dodecalactone 1707.8 0.5 0.7
58 (E,Z)-farnesal 1716.3 0.7 -
59 3-methoxy-cuminyl
isobutyrate 1719.7 - 0.3
60 6-isopropenyl-4,8a-
dimethyl-1,2,3,5,6,
7,8,8a-octahydro-
naphtalen-2-ol 1723.0 - 0.3
61 (Z,E)-farnesol 1725.0 7.7 -
62 (E,E)-farnesal 1743.8 1.1 -
63 fukinone 1749.1 0.4 -
64 cyclocolorenone 1753.8 0.4 -
65 tetradecanoic acid 1765.0 1.1 -
66 α-costol 1775.4 0.6 -
67 n-octadecane 1798.4 0.3 -
68 hexahydrofarnesyl
acetone 1845.3 1.9 -
69 benzyl salicylate 1870.1 0.4 -
70 alantolactone 1902.1 - 2.4
No. Compound RIEa Aerial
parts
(%)
Undergr.
parts
(%)
71 10-isobutyryloxythymyl
isobutyrate 1917.2 1.5 0.5
72 10-isobutyryloxy-8,9-
dehydrothymyl
isobutyrate 1921.5 0.7 0.4
73 isoalantolacton 1945.9 1.9 77.2
74 hexadecanoic acid 1969.5 3.3 -
75 10-isobutyryloxy-8,9-
epoxythymyl
isobutyrate 2034.6 3.4 3.7
76 (E)-phytol 2114.8 4.9 -
77 10-isovaleryloxy-8,9-
epoxythymyl
isobutyrate 2119.1 0.6 0.2
78 pentacosane 2498.1 0.5 -
79 heptacosane 2698.0 0.3 -
80 nonacosane 2899.9 0.2 -
Total Oxygenated monoterpenes
Sesquiterpene hydrocarbons
Oxygenated sesquiterpenes
Others
87.9 96.9
12.0 8.1
5.8 3.2
51.8 85.6
18.3 0.0
RIEa – experimental retention indices
n/a – not available
„-„ - not detected
In the previous investigations, aerial parts col-
lected during the flowering time of T. speciosa from
Serbia contained 0.06% (v/w) of essential oil. Domi-
nant compounds were sesquiterpenes, non-terpene
components and oxigenated monoterpenes [4]. Fur-
thermore, leaf, stem, flower and root essential oils
were also studied. The qualitative composition of the
essential oils from the examined plant material was
similar, whereas the quantities of individual compo-
nents of the oils varied widely depending on the kind
of the plant material [18]. The results of essential oils
components obtained from the literature were similar
to our results.
The amount of the essential oil found in the un-
derground parts of T. speciosa (0.29% (v/w)) was
higher than in the aboveground parts. The oil was
yellowish with needle crystals, and of aromatic odor.
The identified 35 constituents from the underground
parts of T. speciosa accounting for 96.9% of the oil
are presented in Table 3. The oil was characterized
by the presence of high concentration of oxygenated
sesquiterpenes (85.6%) with isoalantolactone being
the major component (77.2%). β-Eudesmol (1.6%)
and caryophyllene oxide (1.3%) were also the repre-
sentatives of oxygenated sesquiterpenes in the oil of
the underground parts. Sesquiterpene hydrocarbons
constituted only (3.2%) of the oil. Thymol deriva-
tives [10-isobutyryloxy-8,9-epoxythymyl isobutyrate
(3.7%), 9-isobutyryloxythymol isobutyrate (2.4%)]
and neryl isobutanoate (1.3%) were the oxygenated
E. Cilović, A. Brantner, H.T. Tran, J. Arsenijević, Z. Maksimović, “Methanol Extracts and Volatiles of Telekia speciosa...”, Technologica Acta, vol. 12, no. 1, pp. 9–13, 2019. 13
ISSN 1840-0426 (P); ISSN 2232-7588 (E) http://tf.untz.ba/technologica-acta
monoterpenes found in appreciable amounts. They
constituted (8.1%) of the oil.
In the previous investigations, the underground
parts collected during the flowering time of T. speci-
osa from Poland and Montenegro contained 0.4% -
1.7% of essential oils. The dominant compound of
those oils was also isoalantolactone (62.3% - 95%)
[1], [18].
CONCLUSION
To the best of our knowledge, the extracts from
the aerial and underground parts of Telekia speciosa
(Schreb.) Baumg were analysed on the presence of
phenol acids by HPLC for the first time. The chloro-
genic acid and caffeic acid derivatives were detected
in the extract from the aerial and underground parts,
with a higher amount of caffeic acid derivatives and
three and a half times higher amount of the chloro-
genic acid in the underground parts.
The presence of phenol compounds contributes to
the antioxidant capacity, which was also evaluated in
the extracts for the first time, as we know. On aver-
age the three and half times higher antioxidant capac-
ity was determined for the underground parts than for
the aerial parts of T. speciosa extracts. The results for
the chemical composition of the essential oils of T.
speciosa were similar to the previously published
data.
The obtained results contribute to better
knowledge of phytochemical properties of T. speci-
osa, which is traditionally used in bronchial asthma
therapy. The recommendation for further investiga-
tions refers to the isolation of caffeic acid derivatives
using the column chromatography and the determina-
tion of their structures as known or new compounds
by comparison of their spectral data (1H NMR, UV)
with those found in the literature.
REFERENCES
[1] J. C. Chalchat, Z. Maksimovic, and S. Petrovic, "Isoalanto-
lactone, the principal constituent of the essential oil from
underground parts of Telekia speciosa (Schreb.) Baumg.,
Asteraceae," Arh.farm, vol. ED-1-2, pp. 15-23, 2004.
[2] S. Redžić, "The Ecological Aspect of Ethnobotany and Eth-
nopharmacology of Population in Bosnia and Herzegovina,"
Coll. Antropol., vol. ED-31(3), pp. 869-890, 2007.
[3] M. Marković, M. Matović, D. Pavlović, B. Zlatković, A.
Marković, B. Jotić, and V. Stankov Jovanović, "Resources
of medical plants and herbs collector´s calendar of Pirot
Country (Serbia),“ Biologica Nyssana, vol. ED-1(1-2), pp.
9-21, December 2010.
[4] N. Radulović, P. Blagojević, R. Palić, and B. Zlatković, "Volatiles of Telekia speciosa (Schreb.) Baumg. (Asterace-
ae) from Serbia," Journal of Essential Oil Research, vol.
ED-22, pp. 250-254, May/June 2010.
[5] A. Stojakowska, J. Malarz, and W. Kisiel, "Quantitative
analysis of sesquiterpene lactones and thymol derivatives in
extracts from Telekia speciosa," Phytochemistry Letters,
vol. ED-11, pp. 378-383, 2015.
[6] Z. Stojanović-Radić, Lj. Čomić, N. Radulović, P. Blago-
jević, M. Denić, A. Miltojević, J. Rajković, and T.
Mihajilov-Krstev, "Antistaphylococcal activity of Inula he-
lenium L. root essential oil: eudesmane sesquiterpene lac-
tones induce cell membrane damage." Eur. J. Clin. Microbi-
ol. Infect. Dis., vol. ED-31, pp. 1015-1025, 2012.
[7] I. Orhan and B. Sener, "Comparative fatty acid analysis of
Telekia speciosa," Chemistry of Natural Compounds, vol.
ED-39(3), pp. 244-245, 2003.
[8] D. Deliorman, F. Ergun, and M. Koyuncu, "Sterols of Tele-
kia speciosa," Chemistry of Natural Compounds, vol. ED-
38(2), pp. 201, 2002.
[9] A. Stojakowska, J. Malarz, M. Zylewski, and W. Kisiel,
"Acylated hydroxycinnamic acid glucosides from flowers of
Telekia speciosa," Phytochemistry Letters, vol. ED-12, pp.
257-261, 2015.
[10] R. Domac, Flora Croatia, Ed. Zagreb: School Book, 2002.
[11] H. T. Tran, "Isolation of main components and method de-
velopment for quantification of flower buds of Lonicera ja-
ponica," Master´s degree, Department of Pharmacognosy,
University of Medicine and Pharmacy, Ho Chi Minh city,
Vietnam, 2013.
[12] A. Gokbulut, O. Ozhan, B. Satilmis, K. Batcioglu, S. Gunal,
and E Sarer, "Antioxidant and Antimicrobial Activities, and
Phenolic Compounds of Selected Inula species from Tur-
key," Natural Product Comunications, vol. ED-8(4), pp.
475-478, 2013.
[13] L. L. Mensor, F. S. Menezes, G. G. Leitao, A. S. Reis, T. C.
dos Santos, C. S. Coube, and S. G. Leitao, "Screening of
Brazilian plant extracts for antioxidant activity by the use of
DPPH free radical method," Phytother. Res., vol. ED-15, pp.
127-130, 2001.
[14] S. Pavičić, Z. Kukrić, Lj. T. Trifunović, A. N. Davidović et
al., "Antioxidative and antimicrobial activity of Reynoutria
japonica," Hem. Ind., vol. ED-63(5), pp. 427-432, 2009.
[15] R. P. Adams, Identification of Essential Oil Components by
Gas Chromatography/Mass Spectrometry, 4th ed. Allured
Publishing Corporation: Carol Stream, IL, 2001.
[16] A. Cho, S. Jeon, and M. Kim, "Chlorogenic acid exhibits
anti-obesity property and improves lipid metabolism in
high-fat diet-induced-obese mice," Food Chem. Toxicol.,
vol. ED-48, pp. 937-943, 2010.
[17] M. D. Santos, M. C. Almeida, N. P. Lopes, and G. E. P.
Souza, "Evaluation of the anti-inflammatory, analgesic and
antipyretic activities of the natural polyphenol chlorogenic
acid," Biol. Pharm. Bull., vol. ED-29, pp. 2236-2240, 2006.
[18] A. Wajs-Bonikowska, A. Stojakowska, and D. Kalemba,
"Chemical Composition of Essential Oils from a Multiple
Shoot Culture of Telekia speciosa and Different Plant Or-
gans," Natural Product Communications, vol. ED-7(5), pp.
625-628, 2012.
ACKNOWLEDGEMENT
This research was financially supported by the
Scholarship Foundation of the Republic of Austria
(Grant No.ICM-2016-03154).

14 Technologica Acta, vol. 12, no. 1, 2019.
ISSN 1840-0426 (P); ISSN 2232-7588 (E) http://tf.untz.ba/technologica-acta

M. Zohorović, F. Andrejaš, V. Stuhli, J. Bršadinac, M. Selimbašić, S. Halilović, “Thermal pretreatment of cattle...”, Technologica Acta, vol. 12, no. 1, pp. 15–18, 2019. 15
ISSN 1840-0426 (P); ISSN 2232-7588 (E) http://tf.untz.ba/technologica-acta
THERMAL PRETREATMENT OF CATTLE MANURE FOR ENHANCING BIOGAS PRODUCTION ORIGINAL SCIENTIFIC PAPER
Mirnesa Zohorović1�, Franc Andrejaš1, Vedran Stuhli1, Jelena Bršadinac1, Mirza Selimbašić1, Samra Halilović2 DOI: 10.5281/zenodo.3268736
RECEIVED 2019-02-07
ACCEPTED 2019-05-13
1 Faculty of Technology, University of Tuzla, Bosnia and Herzegovina 2 Institute for Chemical Engineering, Tuzla, Bosnia and Herzegovina � [email protected]
ABSTRACT: The low degradability of waste materials containing lignocellulosic material is one of the factors
that hinder the production of biogas. The increased need for advanced techniques in the anaerobic digestion pro-
cess has led to the use of different pretreatment raw materials prior to the anaerobic digestion process in order to
increase the yield of biogas. In order to maximize the yield of biogas from cattle manure in a mixture with waste
sludge, the anaerobic digestion process was performed at mesophilic conditions for 54 days. As pretreatment, the
thermal treatment of cattle manure at temperatures of 55 and 70 °C was applied. The highest biogas production
was obtained in the sample of cattle manure, previously treated at 70 °C (M70), while the lowest was recorded in
the control sample M. The specific biogas production in relation to the input quantity of volatile organic matter
had the highest value in sample M70 and the lowest in the control sample. Overall results have shown that the
thermal treatment of cattle manure before the anaerobic digestion process can increase both yield and biogas
quality.
KEYWORDS: Anaerobic digestion, biogas, thermal pretreatment, cattle manure, waste sludge.
INTRODUCTION
One of the oldest and best researched processes by which the energy can be obtained from biomass is anaerobic digestion. Anaerobic digestion is a biologi-cal process of converting complex substrates of bio-gas and digestate by the action of various types of microorganisms without the presence of oxygen through four major steps: hydrolysis, acidogenesis, acetogenesis and methanogenesis [1]. Today, biogas is commonly produced from raw materials that are easily degradable. Although there is a great potential for biogas production in organic raw materials, especially waste from agriculture, crop residues, animal waste, communal waste, food re-mains, these raw materials are characterized by a low degree of degradation and as such require longer re-tention time in the anaerobic digester [2]. Recently, the amount of manure produced on cat-tle farms has increased, most of which has been dis-posed in landfills or on agricultural land as a fertilizer without previous treatment. On the other hand, with application of the Nitrates Directive (91/676/EEC), the application of cattle manure for fertilization of agricultural land is limited[3]. In fact, anaerobic di-gestion provides an alternative solution for treatment, as well as for the recovery of energy from this type of waste [4]. In order to overcome the problem of slow degra-dation to ensure a shorter time of retention, with in-
creased production of biogas and reduction of waste material that is being disposed, it is advisable to use certain methods for pretreatment of input raw materi-al [5]. The optimal pretreatment method for use in the pro-cess of decomposing these raw materials should be economical, should increase the availability of raw materials to microorganisms, should not use or pro-duce substances that inhibit biogas production, should not require high energy consumption and no environmentally harmful byproducts should be creat-ed. MATERIAL AND METHODS
Fresh samples of cattle manure from the dairy farm "Spreča", which were thermally treated at tem-peratures of 55°C and 70°C and waste sludge from the municipal waste water treatment plant in Živinice, were used as substrates. A laboratory reactor system for anaerobic diges-tion, consisting of six glass bottles of 500 ml volume, combined with eudiometric tubes which help to read the biogas production volume, was used for experi-mental studies. The constant temperature of 35°C was obtained by heating the water in the water bath (Figure 1). The pressure and the temperature of the ambient air were measured with the barothermo-hygrometer and the readings were used to convert the volume of obtained biogas into normal conditions.
16 M. Zohorović, F. Andrejaš, V. Stuhli, J. Bršadinac, M. Selimbašić, S. Halilović, “Thermal pretreatment of cattle...”, Technologica Acta, vol. 12, no. 1, pp. 15–18, 2019.
ISSN 1840-0426 (P); ISSN 2232-7588 (E) http://tf.untz.ba/technologica-acta
Mixing of the substrate was performed mechanically using a magnetic stirrer.
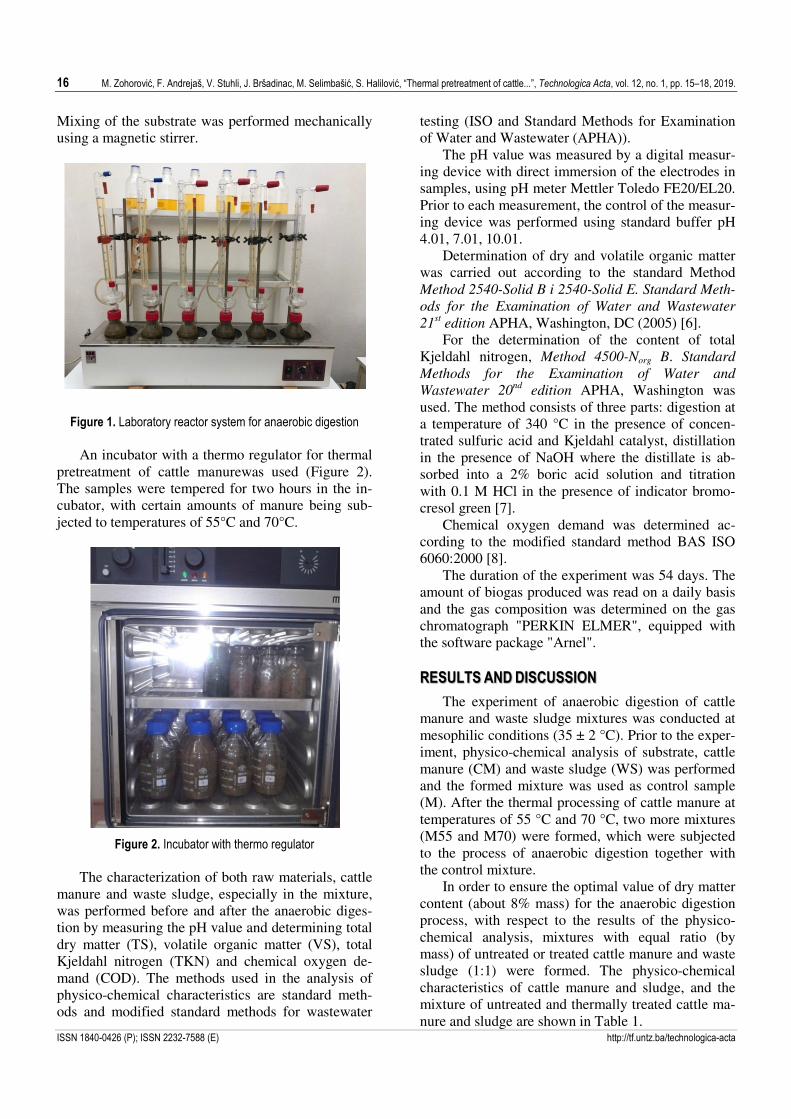
Figure 1. Laboratory reactor system for anaerobic digestion
An incubator with a thermo regulator for thermal pretreatment of cattle manurewas used (Figure 2). The samples were tempered for two hours in the in-cubator, with certain amounts of manure being sub-jected to temperatures of 55°C and 70°C.
Figure 2. Incubator with thermo regulator
The characterization of both raw materials, cattle manure and waste sludge, especially in the mixture, was performed before and after the anaerobic diges-tion by measuring the pH value and determining total dry matter (TS), volatile organic matter (VS), total Kjeldahl nitrogen (TKN) and chemical oxygen de-mand (COD). The methods used in the analysis of physico-chemical characteristics are standard meth-ods and modified standard methods for wastewater
testing (ISO and Standard Methods for Examination of Water and Wastewater (APHA)). The pH value was measured by a digital measur-ing device with direct immersion of the electrodes in samples, using pH meter Mettler Toledo FE20/EL20. Prior to each measurement, the control of the measur-ing device was performed using standard buffer pH 4.01, 7.01, 10.01. Determination of dry and volatile organic matter was carried out according to the standard Method Method 2540-Solid B i 2540-Solid E. Standard Meth-
ods for the Examination of Water and Wastewater
21st edition APHA, Washington, DC (2005) [6].
For the determination of the content of total Kjeldahl nitrogen, Method 4500-Norg B. Standard
Methods for the Examination of Water and
Wastewater 20nd
edition APHA, Washington was used. The method consists of three parts: digestion at a temperature of 340 °C in the presence of concen-trated sulfuric acid and Kjeldahl catalyst, distillation in the presence of NaOH where the distillate is ab-sorbed into a 2% boric acid solution and titration with 0.1 M HCl in the presence of indicator bromo-cresol green [7]. Chemical oxygen demand was determined ac-cording to the modified standard method BAS ISO 6060:2000 [8]. The duration of the experiment was 54 days. The amount of biogas produced was read on a daily basis and the gas composition was determined on the gas chromatograph "PERKIN ELMER", equipped with the software package "Arnel". RESULTS AND DISCUSSION
The experiment of anaerobic digestion of cattle manure and waste sludge mixtures was conducted at mesophilic conditions (35 ± 2 °C). Prior to the exper-iment, physico-chemical analysis of substrate, cattle manure (CM) and waste sludge (WS) was performed and the formed mixture was used as control sample (M). After the thermal processing of cattle manure at temperatures of 55 °C and 70 °C, two more mixtures (M55 and M70) were formed, which were subjected to the process of anaerobic digestion together with the control mixture. In order to ensure the optimal value of dry matter content (about 8% mass) for the anaerobic digestion process, with respect to the results of the physico-chemical analysis, mixtures with equal ratio (by mass) of untreated or treated cattle manure and waste sludge (1:1) were formed. The physico-chemical characteristics of cattle manure and sludge, and the mixture of untreated and thermally treated cattle ma-nure and sludge are shown in Table 1.

M. Zohorović, F. Andrejaš, V. Stuhli, J. Bršadinac, M. Selimbašić, S. Halilović, “Thermal pretreatment of cattle...”, Technologica Acta, vol. 12, no. 1, pp. 15–18, 2019. 17
ISSN 1840-0426 (P); ISSN 2232-7588 (E) http://tf.untz.ba/technologica-acta
Table 1. Physico-chemical characteristics of cattle manure, sludge and mixture of CM:WS
parameter Unit CM WS M M55 M70 pH - 7.7 6.87 6.61 6.97 6.87 TS % 14.99 3.82 9.47 10.09 9.56 VS % 13.50 2.31 7.93 8.52 7.92 VS/TS - 0.9 0.6 0.83 0.84 0.82 TKN g/kg 3.68 2.85 3.20 3.07 3.26 COD g/kg 178.90 46.39 70.98 89.06 93.97
TS-total solids VS-volatile solids; TKN-total Kjeldahl nitrogen; COD- chemical oxygen demand
The pH value measured in all three formed mix-tures ranged from 6.61 to 6.97, while according to literature, the optimum pH value for an undisturbed process of anaerobic digestion ranged from 6.5 to 7.6 [9]. The content of dry matter in the control sample was slightly higher than the recommended value. The VS/TS ratio was approximately 0.8 in all formed mixtures, so the requirement for a sufficient amount of organic matter in reactors was satisfied [10]. The ratio of available organic matter and nitro-gen, expressed through COD:N, ranged from 22:1 in control sample, 29:1 in sample M55, and 29:1 in sample M70, while the optimal value of this ratio was 30:1. The differences in regard of pH value, dry matter content, VS/TS and COD:N ratios between M, M55 and M70 samples are mainly caused by the thermal treatment of the part of the M55 and M70 samples, although the inability to fully homogenize such mix-tures should be considered, because it certainly has an influence on the parameters of the samples, but significantly lower than the influence of thermal treatment has.
Diagram 1. Quantity of biogas obtained from untreated and
thermally treated cattle manure and sludge in a period of 54 days
Diagram 1 shows the total amount of biogas pro-duced during the time of substrate retention in reac-tors for 54 days. During the study, the amount of bio-gas produced in the reactor with a thermally treated cattle manure at 70°C (M70) was 6254 ml, a slightly smaller amount of biogas was recorded at 55°C
(M55) (5615 ml), while the smallest biogas produc-tion in the amount of 1743 ml was recorded in the control sample (M). Also, the specific production of biogas based on the input VS expressed in [ml/g VSi] had the highest value for sample M70 (263.22), slightly smaller for sample M55 (219.68), while the lowest (73.27)for control sample (M) (Diagram 2).
Diagram 2. Specific biogas production per g VSi
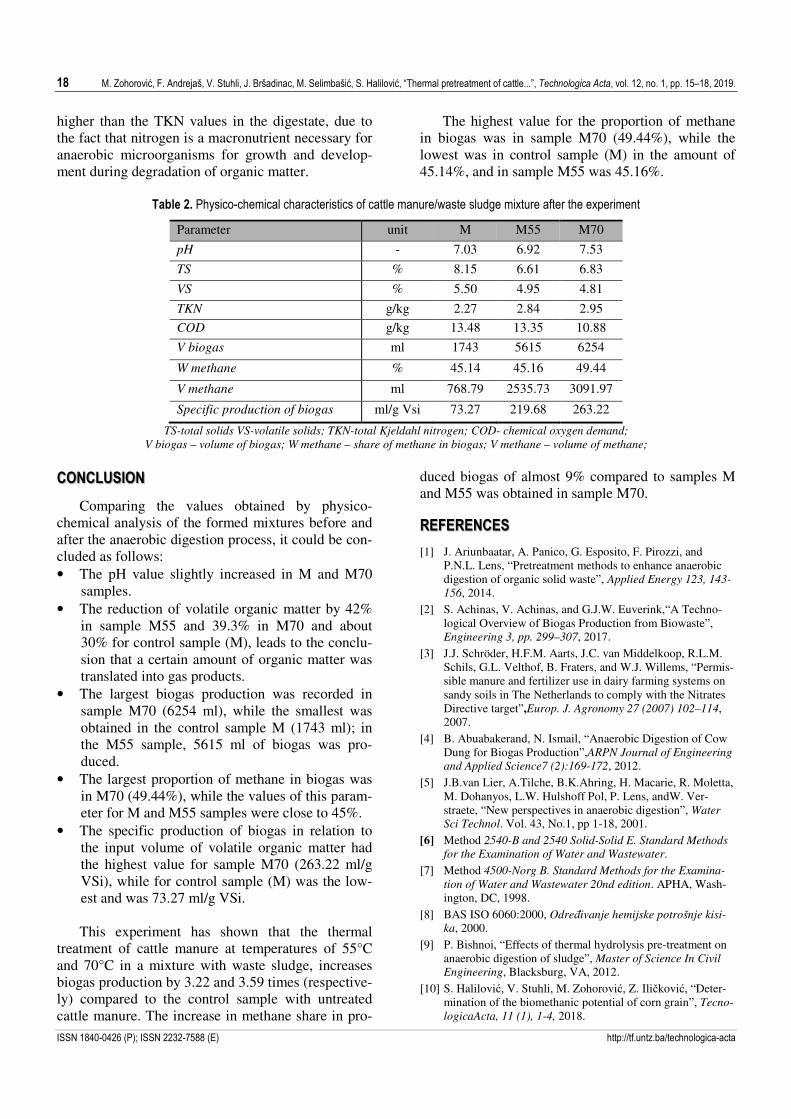
Table 2 shows the characteristics of the digestate remaining after the anaerobic degradation process, the amount of produced biogas, the specific biogas production in relation to the input volume of VSi, and the proportion of methane in the biogas. It is apparent that the values for certain parameters in the digestate were significantly lower than those prior to the diges-tion process, except for the pH value in samples M (7.03) and M70 (7.53), where the value was in-creased while slight reduction occurred in sample M55 (6.92), indicating that during the process there was no inhibition of the process with volatile fatty acids that represent an anaerobic degradation inter-mediate and the values remained within the range optimal for anaerobic digestion. Reduction of dry and volatile organic matter sug-gests that part of organic matter was transformed into gas products. Also, significantly lower values of COD in the digestate (reduced by about 80%) were observed, in relation to the sample values prior to the start of the process. The TKN content in the samples prior to the start of the process was significantly
18 M. Zohorović, F. Andrejaš, V. Stuhli, J. Bršadinac, M. Selimbašić, S. Halilović, “Thermal pretreatment of cattle...”, Technologica Acta, vol. 12, no. 1, pp. 15–18, 2019.
ISSN 1840-0426 (P); ISSN 2232-7588 (E) http://tf.untz.ba/technologica-acta
higher than the TKN values in the digestate, due to the fact that nitrogen is a macronutrient necessary for anaerobic microorganisms for growth and develop-ment during degradation of organic matter.
The highest value for the proportion of methane in biogas was in sample M70 (49.44%), while the lowest was in control sample (M) in the amount of 45.14%, and in sample M55 was 45.16%.
Table 2. Physico-chemical characteristics of cattle manure/waste sludge mixture after the experiment
Parameter unit M M55 M70
pH - 7.03 6.92 7.53
TS % 8.15 6.61 6.83
VS % 5.50 4.95 4.81
TKN g/kg 2.27 2.84 2.95
COD g/kg 13.48 13.35 10.88
V biogas ml 1743 5615 6254
W methane % 45.14 45.16 49.44
V methane ml 768.79 2535.73 3091.97
Specific production of biogas ml/g Vsi 73.27 219.68 263.22
TS-total solids VS-volatile solids; TKN-total Kjeldahl nitrogen; COD- chemical oxygen demand;
V biogas – volume of biogas; W methane – share of methane in biogas; V methane – volume of methane;
CONCLUSION
Comparing the values obtained by physico-chemical analysis of the formed mixtures before and after the anaerobic digestion process, it could be con-cluded as follows: • The pH value slightly increased in M and M70
samples. • The reduction of volatile organic matter by 42%
in sample M55 and 39.3% in M70 and about 30% for control sample (M), leads to the conclu-sion that a certain amount of organic matter was translated into gas products.
• The largest biogas production was recorded in sample M70 (6254 ml), while the smallest was obtained in the control sample M (1743 ml); in the M55 sample, 5615 ml of biogas was pro-duced.
• The largest proportion of methane in biogas was in M70 (49.44%), while the values of this param-eter for M and M55 samples were close to 45%.
• The specific production of biogas in relation to the input volume of volatile organic matter had the highest value for sample M70 (263.22 ml/g VSi), while for control sample (M) was the low-est and was 73.27 ml/g VSi.
This experiment has shown that the thermal treatment of cattle manure at temperatures of 55°C and 70°C in a mixture with waste sludge, increases biogas production by 3.22 and 3.59 times (respective-ly) compared to the control sample with untreated cattle manure. The increase in methane share in pro-
duced biogas of almost 9% compared to samples M and M55 was obtained in sample M70.
REFERENCES
[1] J. Ariunbaatar, A. Panico, G. Esposito, F. Pirozzi, and P.N.L. Lens, “Pretreatment methods to enhance anaerobic digestion of organic solid waste”, Applied Energy 123, 143-
156, 2014. [2] S. Achinas, V. Achinas, and G.J.W. Euverink,“A Techno-
logical Overview of Biogas Production from Biowaste”, Engineering 3, pp. 299–307, 2017.
[3] J.J. Schröder, H.F.M. Aarts, J.C. van Middelkoop, R.L.M. Schils, G.L. Velthof, B. Fraters, and W.J. Willems, “Permis-sible manure and fertilizer use in dairy farming systems on sandy soils in The Netherlands to comply with the Nitrates Directive target”,Europ. J. Agronomy 27 (2007) 102–114, 2007.
[4] B. Abuabakerand, N. Ismail, “Anaerobic Digestion of Cow Dung for Biogas Production”,ARPN Journal of Engineering
and Applied Science7 (2):169-172, 2012.
[5] J.B.van Lier, A.Tilche, B.K.Ahring, H. Macarie, R. Moletta, M. Dohanyos, L.W. Hulshoff Pol, P. Lens, andW. Ver-straete, “New perspectives in anaerobic digestion”, Water
Sci Technol. Vol. 43, No.1, pp 1-18, 2001.
[6] Method 2540-B and 2540 Solid-Solid E. Standard Methods
for the Examination of Water and Wastewater.
[7] Method 4500-Norg B. Standard Methods for the Examina-
tion of Water and Wastewater 20nd edition. APHA, Wash-ington, DC, 1998.
[8] BAS ISO 6060:2000, Određivanje hemijske potrošnje kisi-
ka, 2000.
[9] P. Bishnoi, “Effects of thermal hydrolysis pre-treatment on anaerobic digestion of sludge”, Master of Science In Civil
Engineering, Blacksburg, VA, 2012.
[10] S. Halilović, V. Stuhli, M. Zohorović, Z. Iličković, “Deter-mination of the biomethanic potential of corn grain”, Tecno-
logicaActa, 11 (1), 1-4, 2018.

T. Brčina, M. Vilušić, A. Selimović, Lj. Bojanović, “Influence of parameters on sensory properties…”, Technologica Acta, vol. 12, no. 1, pp. 19–25, 2019. 19
ISSN 1840-0426 (P); ISSN 2232-7588 (E) http://tf.untz.ba/technologica-acta
INFLUENCE OF PARAMETERS ON SENSORY
PROPERTIES AND CONSUMER ACCEPTANCE OF
PROBIOTIC FRESH CHEESE ORIGINAL SCIENTIFIC PAPER
Tijana Brčina1�, Milica Vilušić1, Amel Selimović1, Ljilja Bojanović1 DOI: 10.5281/zenodo.3268751
RECEIVED
2019-02-15 ACCEPTED
2019-05-16
1 Faculty of Technology, University of Tuzla, Univerzitetska 8, 75000 Tuzla, Bosnia and Herzegovina � [email protected]
ABSTRACT: Probiotics, because of their beneficial effects on human health, are used in the treatment of
digestive disorders, the prevention of colon cancer, restoration of the intestinal microflora balance and stimulate
the immune system. New discoveries of soy enter the list of functional foods, i.e. found between food and
medicine. The aim of the work was to examine the effect of soy drink, thermalization (60°C/3 min), combinations
of microbial starter cultures and addition of prebiotics on sensory properties, and acceptability of probiotic fresh
cheese. Fresh cheese samples were produced from skimmed milk (0.9% milk fat) and combination of cow’s milk
and soy drink. Milk fermentation was carried out at 25ºC and 40ºC, with addition of Lyofast EF1 and
combination of microbial starter cultures Lyofast MWO 030 and Lyofast EF1 in a ratio of 1:1. Half of the
obtained fresh cheese was subjected to a thermalisation process (60ºC/3 min). All the samples produced had a
creamy consistency. The sensory properties of probiotic fresh cheese were evaluated by a group of 15 assessors.
The acceptability of probiotic fresh cheese was evaluated by a group of 40 consumers. The samples were
evaluated after 1, 7 and 14 days of storage. The addition of soy drink and the combination of microbial starter
cultures had an influence on the improvement of the sensory properties of probiotic fresh cheese, which was
confirmed by statistical analysis of the results.
KEYWORDS: probiotic fresh cheese, Lyofast EF1, Lyofast MWO 030, soy drink, thermalization, sensory
properties, acceptability
INTRODUCTION
The development of cheese production through history is the result of the importance and role that milk and dairy products have taken in the nutrition of population, as well as the aspiration of people to ensure adequate storage of the most important foods for them. Fresh cheeses are usually not, or are minimally aged, have high moisture content, do not have rind, and got very mild flavor and a soft and smooth texture. In this category, milk coagulation is due to rennet and/or acid produced from a bacterial culture or other sources such as lemon juice. When bacteria are involved in their manufacture, they also contribute to the development of typical flavors, quality improvement, and/or promote health benefits if they display probiotic properties [1]. The use of soy as a food ingredient is gaining importance in the food industry and for consumers due to its role as functional food [2]. Soymilk is an inexpensive, nutritive dairy substitute that is used to make cheese and cheese analogs by people worldwide [3]. Soy prebiotics such as oligofructose and inulin have a great application potential in the food industry due to their functional properties. The use of alternative ingredients such as
soy drink reduces lactose content in yogurt [4]. According to a study carried out by Martinez – Villaluenga et al. [5], it is possible to use Enterococcus faecium, isolated from raw soy drink, in production of fermented soy drink, which could be a promising strategy in the preventative therapy against cardiovascular diseases. Because of their role in mating and the development of cheese flavor, enterococci have been proposed to be used as a starter culture in the production of European cheeses due to the preferred technological and metabolic properties [6,7,8,9]. Bedani et al. [10] examined the effect of inulin and okara flour on textural and sensory properties of probiotic soy yoghurt (SY) throughout 28 days of storage at 4 °C. According to them, inulin has influnce on higher scores for sensory acceptability. Bibiana et al. [11] compared reduced-fat fresh cow's milk cheese with inulin (3%) with both full-fat and reduced-fat cheeses without prebiotic. The results showed that the reduced-fat cheese with inulin was more acceptable than its counterpart without inulin. Kinik et al. [12] investigate the effects of probiotics, and inulin on aromatic compounds, and on the textural and sensory properties of symbiotic goat
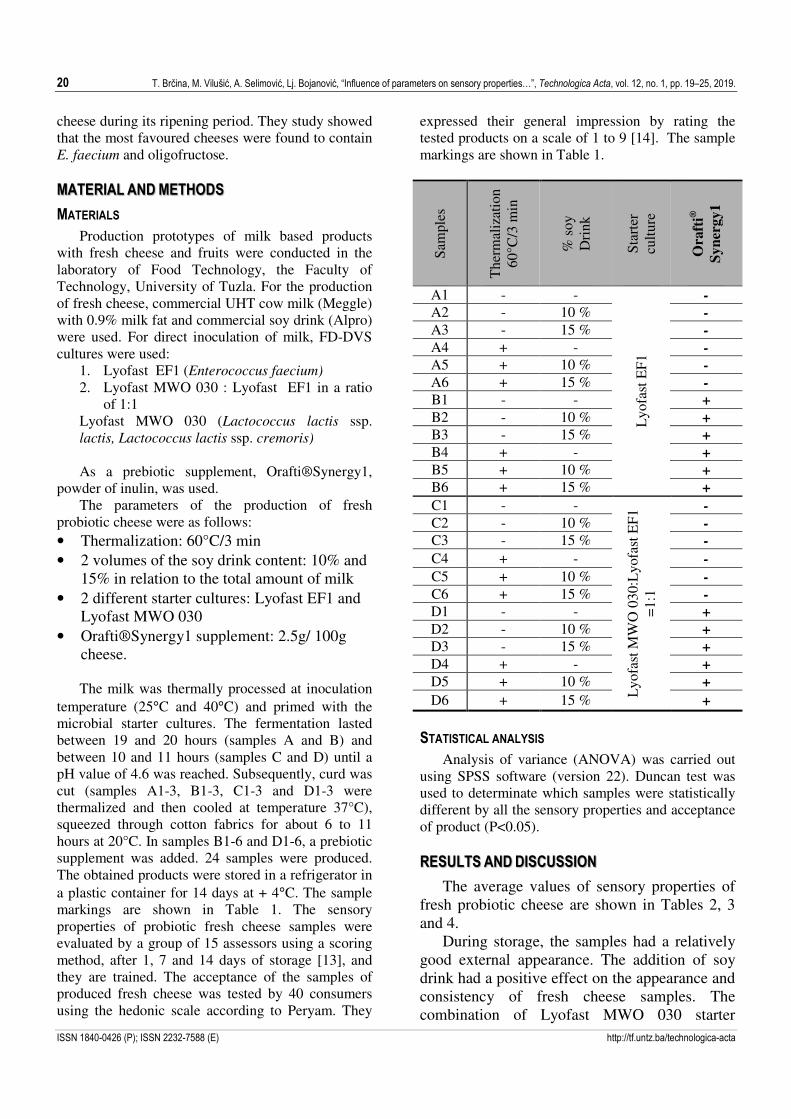
20 T. Brčina, M. Vilušić, A. Selimović, Lj. Bojanović, “Influence of parameters on sensory properties…”, Technologica Acta, vol. 12, no. 1, pp. 19–25, 2019.
ISSN 1840-0426 (P); ISSN 2232-7588 (E) http://tf.untz.ba/technologica-acta
cheese during its ripening period. They study showed that the most favoured cheeses were found to contain E. faecium and oligofructose. MATERIAL AND METHODS
MATERIALS
Production prototypes of milk based products with fresh cheese and fruits were conducted in the laboratory of Food Technology, the Faculty of Technology, University of Tuzla. For the production of fresh cheese, commercial UHT cow milk (Meggle) with 0.9% milk fat and commercial soy drink (Alpro) were used. For direct inoculation of milk, FD-DVS cultures were used:
1. Lyofast EF1 (Enterococcus faecium) 2. Lyofast MWO 030 : Lyofast EF1 in a ratio
of 1:1
Lyofast MWO 030 (Lactococcus lactis ssp. lactis, Lactococcus lactis ssp. cremoris)
As a prebiotic supplement, Orafti®Synergy1, powder of inulin, was used. The parameters of the production of fresh probiotic cheese were as follows: • Thermalization: 60°C/3 min • 2 volumes of the soy drink content: 10% and
15% in relation to the total amount of milk • 2 different starter cultures: Lyofast EF1 and
Lyofast MWO 030 • Orafti®Synergy1 supplement: 2.5g/ 100g
cheese. The milk was thermally processed at inoculation temperature (25°C and 40°C) and primed with the microbial starter cultures. The fermentation lasted between 19 and 20 hours (samples A and B) and between 10 and 11 hours (samples C and D) until a pH value of 4.6 was reached. Subsequently, curd was cut (samples A1-3, B1-3, C1-3 and D1-3 were thermalized and then cooled at temperature 37°C), squeezed through cotton fabrics for about 6 to 11 hours at 20°C. In samples B1-6 and D1-6, a prebiotic supplement was added. 24 samples were produced. The obtained products were stored in a refrigerator in a plastic container for 14 days at + 4°C. The sample markings are shown in Table 1. The sensory properties of probiotic fresh cheese samples were evaluated by a group of 15 assessors using a scoring method, after 1, 7 and 14 days of storage [13], and they are trained. The acceptance of the samples of produced fresh cheese was tested by 40 consumers using the hedonic scale according to Peryam. They
expressed their general impression by rating the tested products on a scale of 1 to 9 [14]. The sample markings are shown in Table 1.
Sam
ples
The
rmal
izat
ion
60°C
/3 m
in
% s
oy
Dri
nk
Sta
rter
cu
ltur
e
Ora
fti®
Sy
ner
gy
1
A1 - -
Lyo
fast
EF
1
-
A2 - 10 % -
A3 - 15 % -
A4 + - -
A5 + 10 % -
A6 + 15 % -
B1 - - +
B2 - 10 % +
B3 - 15 % +
B4 + - +
B5 + 10 % +
B6 + 15 % +
C1 - -
Lyo
fast
MW
O 0
30:L
yofa
st E
F1
=1:
1
-
C2 - 10 % -
C3 - 15 % -
C4 + - -
C5 + 10 % -
C6 + 15 % -
D1 - - +
D2 - 10 % +
D3 - 15 % +
D4 + - +
D5 + 10 % +
D6 + 15 % +
STATISTICAL ANALYSIS
Analysis of variance (ANOVA) was carried out using SPSS software (version 22). Duncan test was used to determinate which samples were statistically different by all the sensory properties and acceptance of product (P<0.05). RESULTS AND DISCUSSION
The average values of sensory properties of fresh probiotic cheese are shown in Tables 2, 3 and 4. During storage, the samples had a relatively good external appearance. The addition of soy drink had a positive effect on the appearance and consistency of fresh cheese samples. The combination of Lyofast MWO 030 starter

T. Brčina, M. Vilušić, A. Selimović, Lj. Bojanović, “Influence of parameters on sensory properties…”, Technologica Acta, vol. 12, no. 1, pp. 19–25, 2019. 21
ISSN 1840-0426 (P); ISSN 2232-7588 (E) http://tf.untz.ba/technologica-acta
culture: Lyofast EF1 = 1:1 influenced better sample consistency (Tables 2, 3 and 4). Observ-ing the sensory sensitivity of the fragrance, it is evident that the addition of Lyofast MWO 030 and soy drink contributed to better grades, which was also reflected in the taste of the product (Ta-bles 2, 3 and 4). The cheese samples produced by
inoculation of milk with Lyofast EF1 only had slightly bitter but still pleasing taste. The addi-tion of the soy drink neutralized bitter taste, giv-ing the sweet taste and smell of probiotic cheese, a better feeling in the mouth when consumed, and the creamy consistency.
Table 2. Average values of sensory properties of probiotic fresh cheese after 1 day of storage
Sample
External
appearance
(2,0)
Consistency
(4,0)
Smell
(3,0)
Taste
(9,0)
Color
(2,0)
Σ
(20,0)
A1 1.73(±0.45)1 3.25(±0.84)1 2.38(±0.87)1 7.69(±1.09)1 1.98(±0,07) 17.01
A2 1.94(±0.17)2,3 3.88(±0.35)3 3.00(±0.00)3 8.31(±0.79)1,2,3,4,5 2.00(±0.00) 19.13
A3 2.00(±0.00)3 3.88(±0.35)3 2.91(±0.18)3 8.16(±0.90)1,2,3,4,5 2.00(±0.00) 18.95
B1 1.94(±0.17)2,3 3.41(±0.71)1,2 2.68(±0.50)3 8.08(±0.91)1,2,3,4 2.00(±0.00) 18.10
B2 1.96(±0.07)2 3.61(±0.43)1,2,3 2.88(±0.35)3 8.81(±0.37)4,5 2.00(±0.00) 19.26
B3 1.86(±0.09)1,2,3 3.80(±0.36)2,3 2.98(±0.07)3 8.73(±0.45)3.4.5 2.00(±0.00) 19.36
C1 2.00(±0.00)3 3.99(±0.03)3 2.95(±0.09)3 8.56(±0.49)2,3,4,5 1.98(±0.07) 19.48
C2 2.00(±0.00)3 4.00(±0.00)3 3.00(±0.00)3 8.88(±0.35)5 2.00(±0.00) 19.88
C3 2.00(±0.00)3 4.00(±0.00)3 3.00(±0.00)3 8.75(±0.46)3,4,5 2.00(±0.00) 19.75
D1 2.00(±0.00)3 3.88(±0.35)3 3.00(±0.00)3 7.88(±0.58)1,2 2.00(±0.00) 18.75
D2 2.00(±0.00)3 3.88(±0.35)3 2.98(±0.07)3 8.25(±0.65)1,2,3,4,5 2.00(±0.00) 19.10
D3 2.00(±0.00)3 4.00(±0.00)3 2.94(±0.17)3 8.56(±0.03)2,3,4,5 2.00(±0.00) 19.50
A4 1.79(±0.36)1,2 3.56(±0.72)1,2,3 2.53(±0.71)1,2 8.01(±1.05)1,2,3 1.97(±0.737) 17.99
A5 1.94(±0.17)2,3 3.94(±0.17)3 2.93(±0.21)3 8.75(±0.46)3,4,5 2.00(±0.00) 19.55
A6 1.94(±0.17)2,3 3.88(±0.35)3 3.00(±0.00)3 8.56(±0.82)2,3,4,5 1.97(±0.70) 19.35
B4 1.98(±0.07)3 3.88(±0.23)3 2.85(±0.22)3 8.59(±0.41)2,3,4,5 1.93(±0.17) 19.23
B5 2.00(±0.00)3 3.81(±0.37)2,3 3.00(±0.00)3 8.88(±0.23)5 2.00(±0.00) 19.69
B6 2.00(±0.00)3 3.81(±0.37)2,3 2.75(±0.46)2,3 8.19(±0.88)1,2,3,4,5 2.00(±0.00) 18.75
C4 1.94(±0.17)2,3 4.00(±0.00)3 2.81(±0.37)2,3 8.44(±0.56)1,2,3,4,5 1.93(±0.17) 19.13
C5 2.00(±0.00)3 3.98(±0.07)3 3.00(±0.00)3 8.75(±0.46)3,4,5 2.00(±0.00) 19.73
C6 2.00(±0.00)3 3.98(±0.07)3 3.00(±0.00)3 8.81(±0.37)4,5 2.00(±0.00) 19.79
D4 2.00(±0.00)3 4.00(±0.00)3 3.00(±0.00)3 8.44(±0.53)1,2,3,4,5 2.00(±0.00) 19.44
D5 2.00(±0.00)3 3.75(±0.46)2,3 2.94(±0.17)3 8.75(±0.46)3,4,5 2.00(±0.00) 19.44
D6 2.00(±0.00)3 3.88(±0.35)3 3.00(±0.00)3 8.31(±0.53)1,2,3,4,5 2.00(±0.00) 19.19 1,2,3,4,5,6 - Mean values in the same column, with different superscript are significantly different (P<0.05)
Table 3. Average values of sensory properties of probiotic fresh cheese after 7 days of storage
Sample
External
appearance
(2,0)
Consistency
(4,0)
Smell
(3,0)
Taste
(9,0)
Color
(2,0)
Σ
(20,0)
A1 1.63(±0.58)1 2.71(±1.00)1 2.50(±0.92)1,2,3,4 6.38(±1.59)1 1.98(±0.07) 15.19 A2 1.79(±0.36)1,2 3.59(±0.49)2,3,4,5 2.86(±0.35)3,4 7.50(±1.06)1,2,3,4,5 1.98(±0.07) 17.71 A3 1.85(±0.35)1,2 3.29(±0.92) 2,3 2.60(±0.68) 2,3,4 7.50(±1.30)1,2,3,4,5 1.91(±0.18) 17.15 B1 1.81(±0.37)1,2 3.01(±0.87) 1,2 1.94(±0.62) 1 6.63(±1.30)1,2 1.88(±0.35) 15.26 B2 1.85(±0.22)1,2 3.35(±0.55)2,3,4 2.33(±0.70)1,2,3 7.56(±0.82)1,2,3,4,5 2.00(±0.00) 17.09 B3 1.71(±0.18)1,2 3.44(±0.41)2,3,4,5 2.29(±0.56)1,2,3 7.73(±1.55)1,2,3,4,5 1.88(±0.35) 17.04 C1 1.88(±0.23)1,2 3.94(±0.17)4,5 2.60(±0.50)2,3,4 6.81(±1,06)1,2 1.98(±0.07) 17.20 C2 1.95(±0.10)1,2 4.00(±0.00)5 2.81(±0.37)2,3,4 7.63(±1.48)1,2,3,4,5 2.00(±0.00) 18.39 C3 1.90(±0.19)1,2 3.81(±0.37)3,4,5 2.75(±0.46)2,3,4 7.38(±0.80)1,2,3,4 2.00(±0.00) 18.46 D1 1.81(±0.25)1,2 3.38(±0.44)2,3,4,5 2.69(±0.44)2,3,4 7.44(±0.51)1,2,3,4 2.00(±0.00) 17.31 D2 1.94(±0.17)1,2 3.63(±0.44)3,4,5 2.81(±0.25)2,3,4 7.88(±0.64)2,3,4,5 2.00(±0.00) 18.25 D3 2.00(±0.00)2 4.00(±0.00)5 3.00(±0.00)4 8.44(±0.41)4,5 2.00(±0.00) 19.44 A4 1.79(±0.36)1,2 3.31(±1.16)2,3,4 2.19(±0.63)1,2 6.88(±1.55)1,2,3 1.87(±0.23) 16.04

22 T. Brčina, M. Vilušić, A. Selimović, Lj. Bojanović, “Influence of parameters on sensory properties…”, Technologica Acta, vol. 12, no. 1, pp. 19–25, 2019.
ISSN 1840-0426 (P); ISSN 2232-7588 (E) http://tf.untz.ba/technologica-acta
Sample
External
appearance
(2,0)
Consistency
(4,0)
Smell
(3,0)
Taste
(9,0)
Color
(2,0)
Σ
(20,0)
A5 1.63(±0.44) 1 3.75(±0.37)3,4,5 2.4(±0.60)1,2,3,4 7.25(±0.92) 1,2,3,4 1.75(±0.46) 16.79 A6 1.80(±0.22)1,2 3.80(±0.35)3,4,5 2.63(±0.51)2,3,4 7.81(±0.70)2,3,4,5 1.85(±0.22) 17.89 B4 1.79(±0.36)1,2 3.50(±0.70)2,3,4,5 2.44(±0.49)1,2,3,4 7.31(±1.38)1,2,3,4 1.81(±0.37) 16.85 B5 1.85(±0.22)1,2 3.87(±0.41)3,4,5 2.50(±0.44)1,2,3,4 7.56(±0.45)1,2,3,4,5 1.93(±0.23) 18.64 B6 2(±0.00)2 3.78(±0.23)3,4,5 2.91(±0.22)3,4 8.31(±0.83)4,5 2.00(±0.00) 18.56 C4 1.88(±0.23)1,2 3.88(±0.23)3,4,5 2.50(±0.92)1,2,3,4 7.56(±1.14)1,2,3,4,5 1.94(±0.17) 17.75 C5 1.94(±0.17)1,2 3.79(±0.24)3,4,5 2.91(±0.18)3,4 8.31(±0.88)4,5 1.88(±0.35) 18.83 C6 1.88(±0.23)1,2 3.76(±0.253)3,4,5 2.66(±0.35)2,3,4 7.73(±1.33)1,2,3,4,5 1.99(±0.03) 18.01 D4 2.00(±0.00)2 4.00(±0.00)5 3.00(±0.00)4 8.44(±0.53)4,5 2.00(±0.00) 19.44 D5 2.00(±0.00)2 3.88(±0.35)3,4,5 3.00(±0.00)4 8.88(±0.35)5 2.00(±0.00) 19.75 D6 2.00(±0.00)2 4.00(±0.00)5 2.88(±0.35)3,4 8.25(±0.37)3,4,5 2.00(±0.00) 19.13
1,2,3,4,5,6 - Mean values in the same column, with different superscript are significantly different (P<0.05)
Table 4. Average values of sensory properties of probiotic fresh cheese after 14 days of storage
Sample
External
appearance
(2,0)
Consistency
(4,0)
Smell
(3,0)
Taste
(9,0)
Color
(2,0)
Σ
(20,0)
A1 1.75(±0.35)1,2,3 2.81(±0.56)1 2.08(±0.61)3,4 4.85(±1.47)1 1.98(±0.07)2,3 13.40 A2 1.86(±0.22)2,3 3.49(±0.44)2 2.41(±0.60)3,4,5,6 5.88(±1.80)1,2,3,4 1.98(±0.07)2,3 15.61 A3 1.81(±0.37)2,3 3.38(±0.87)2 2.19(±0.84)3,4,5 6.44(±2.19)1,2,3,4,5 1.85(±0.35)2,3 15.66 B1 1.44(±0.49)1 2.31(±0.45)2 1.25(±0.37)1 5.50(±0.75)1,2,3 1.88(±0.35)2,3 12.38 B2 1.85(±0.22)2,3 3.56(±0.56)2 2.25(±0.65)3,4,5 7.25(±1.03)4,5,6 2.00(±0.00)3 16.91 B3 1.76(±0.23)1,2,3 3.44(±0.41)2 2.25(±0.26)3,4,5 7.50(±1.36)4,5,6 1.88(±0.35)2,3 16.83 C1 1.75(±0.21)1,2,3 3.44(±0.49)2 2.26(±0.54)3,4,5 5.94(±1.01)1,2,3,4 1.98(±0.07)2,3 15.36 C2 1.88(±0.23)2,3 3.81(±0.37)2 2.31(±0.59)3,4,5 6.38(±1.30)1,2,3,4,5 2.00(±0.00)3 16.38 C3 1.88(±0.23)2,3 3.88(±0.23)2 2.19(±0.75)3,4,5 7.31(±1.33)4,5,6 2.00(±0.00)3 17.25 D1 1.76(±0.33)1,2,3 3.63(±0.44)2 2.13(±0.64)3,4,5 5.25(±1.90)1,2 2.00(±0.00)3 14.76 D2 1.89(±0.18)2,3 3.88(±0.35)2 2.33(±0.70)3,4,5 5.50(±2.20)1,2,3 2.00(±0.00)3 15.59 D3 2.00(±0.00)3 4.00(±0.00)2 3.00(±0.00)6 8.50(±0.46)6 2.00(±0.00)3 19.50 A4 1.56(±0.49)1,2 2.75(±1.25)1 1.44(±0.67)1,2 4.88(±2.41)1 1.88(±0.22)2,3 12.50 A5 1.66(±0.44)1,2,3 3.50(±0.70)2 1.89(±0.62)2,3 6.56(±0.11)2,3,4,5 1.63(±0.51)1 15.24 A6 1.81(±0.25)2,3 3.68(±0.69)2 2.35(±0.40)3,4,5,6 6.94(±0.77)3,4,5,6 1.73(±0.36)1,2 16.50 B4 1.81(±0.37)2,3 3.44(±0.72)2 2.56(±0.49)3,4,5,6 7.00(±1.07)3,4,5,6 1.81(±0.37)1,2 16.63 B5 1.91(±0.18)2,3 3.63(±0.44)2 2.69(±0.45)4,5,6 7.88(±0.64)5,6 1.94(±0.17)2,3 18.04 B6 2.00(±0.00)3 3.69(±0.37)2 2.81(±0.25)5,6 7.31(±0.75)5,4,6 1.94(±0.17)2,3 17.75 C4 1.75(±0.37)1,2,3 3.63(±0.74)2 2.19(±1.06)3,4,5 6.38(±1.99)1,2,3,4,5 1.94(±0.17)2,3 15.88 C5 1.85(±0.22)2,3 3.73(±0.36)2 2.73(±0.45)4,5,6 7.35(±1.58)4,5,6 2.00(±0.00)3 17.65 C6 1.75(±0.26)1,2,3 3.75(±0.37)2 2.54(±0.39)3,4,5,6 7.06(±1.08)3,4,5,6 2.00(±0.00)3 17.10 D4 2.00(±0.00)3 4.00(±0.00)2 3.00(±0.00)6 8.50(±0.65)6 2.00(±0.00)3 19.50 D5 2.00(±0.00)3 3.88(±0.35)2 2.19(±0.37)3,4,5 7.75(±0.46)5,6 2.00(±0.00)3 17.81 D6 2.00(±0.00)3 4.00(±0.00)2 2.50(±0.53)3,4,5,6 7.00(±0.00)3,4,5,6 2.00(±0.00)3 17.50
1,2,3,4,5,6 - Mean values in the same column, with different superscript are significantly different (P<0.05)
The combination of starter cultures Lyofast MWO 030 with Lyofast EF1 in the ratio of 1:1 improved the taste of cheese, which is also evi-dent from the ratings given by the sensory asses-sors, and which was shown by statistical analysis (Tables 2, 3 and 4). In the research carried out by Rasouli Pirouzian et al. [15], samples of Iranian white UF cheeses containing Enterococcus fae-
cium showed lower scores of cheeses that were
diluted with milking with a combination of mes-ophilic (Lactococcus cremoris and L. lactic) and thermophilic (Streptococcus thermophilus and Lactobacillus delbrueckii subsp. bulgaricus) cul-tures. The panelists commented that the cheeses produced with E. faecium lacked a good taste and had a less pronounced aroma after two months of storage. Some bacteria produce addi-tional cellular proteolytic and lipolytic enzymes

T. Brčina, M. Vilušić, A. Selimović, Lj. Bojanović, “Influence of parameters on sensory properties…”, Technologica Acta, vol. 12, no. 1, pp. 19–25, 2019. 23
ISSN 1840-0426 (P); ISSN 2232-7588 (E) http://tf.untz.ba/technologica-acta
that can cause unwanted texture and flaws [16]. There are contradictory statements about the in-fluence of enterococci on the sensory character-istics of cheese. High concentrations of entero-cocci are considered to cause deterioration in organoleptic properties in parmesan [17, 18]. In contrast, many authors claim that enterococci can play a positive role in the cheese production process [19]-[22]. The color, as sensory proper-ty, of all samples was the most stabile during storage. The consistency of thermalized samples was enhanced during storage, indicating that thermalisation had a positive impact on con-sistency. Table 5. Average values of acceptance of non thermalized pro-
biotic fresh cheese after 14 days of storage
Sample X D (%) ND (%)
A1 5.188(±1.06)1,2,3 87.50 12.50 A2 6.438(±1.267)1,2,3,4 87.50 12.50 A3 6.588(±2.01)2,3,4 75.00 25.00 B1 5.750(±0.70)1,2,3 100.00 0 B2 7.125(±0.83)3,4 100.00 0 B3 7.250(±1.16)3,4,5 100.00 0 C1 6.225(±1.12)1,2,3,4 100.00 0 C2 6.750(±1.38)2,3,4 100.00 0 C3 7.438(±1.23)4,5 100.00 0 D1 5.000(±1.30)1 75.00 25.00 D2 5.500(±1.92)1,2 75.00 25.00 D3 8.625(±0.35)5 100.00 0 x- Average values; D – desirability; ND – non desirability 1,2,3,4,5- Mean values in the same column, with different super-
script are significantly different (P<0.05)
Table 6. Average values of acceptance of thermalized probiotic
fresh cheese after 7 days of storage
Sample X D (%) ND (%)
A4 6.938(±1.26)1 100.00 0 A5 7.93(±0.41)2,3 100.00 0 A6 8.125(±1.64)3 100.00 0 B4 7.063(±1.65)1,2 100.00 0 B5 8.313(±0.37)3 100.00 0 B6 8.000(±0.91)2,3 100.00 0 C4 8.000(±0.92)2,3 100.00 0 C5 8.438(±0.72)3 100.00 0 C6 8.000(±1.02)2,3 100.00 0 D4 8.500(±0.41)3 100.00 0 D5 8.875(±0.35)3 100.00 0 D6 8.475(±0.35)3 100.00 0 x- Average values; D – desirability; ND – non desirability 1,2,3- Mean values in the same column, with different superscript
are significantly different (P<0.05)
Table 7. Average values of acceptance of thermalized probiotic fresh cheese after 14 days of storage
Sample X D (%) ND (%)
A4 5.188(±2.06)1 62.50 37.50 A5 7.313(±0.94)2 100.00 0 A6 7.313(±1.16)2,3 100.00 0 B4 6.875(±1.45)2 100.00 12.50 B5 7.938(±0.41)2,3 100.00 0 B6 7.375(±0.69)2,3 100.00 0 C4 6.938(±1.74)2 100.00 0 C5 7.375(±1.57)2,3 100.00 0 C6 7.313(±1.03)2,3 100.00 0 D4 8.563(±0.49)3 100.00 0 D5 7.875(±0.35)2,3 100.00 0 D6 7.375(±0.51)2,3 100.00 0 x- Average values; D – desirability; ND – non desirability 1,2,3- Mean values in the same column, with different superscript
are significantly different (P<0.05)
The analysis of the variance (Table 5, 6 and 7) showed that there was a statistically signifi-cant difference (p <0.05) between the sensory properties of the samples of probiotic fresh cheese during storage, for appearance, consisten-cy, smell and taste for all days of storage. Ac-cording to the results (Table 4), the color, as a sensory property, was statistically significant (P <0.05) only after 14 days of storage. Considering the statistically significant difference (P<0.05), the Duncan test was conducted by which it was determined which samples were the best by cer-tain sensory properties also during the storage. The samples which were produced with the combination of starter cultures and addition of soy drink had a better external appearance, con-sistency and smell than other samples. Also, ad-dition of inulin had a positive influence on con-sistency and smell. The samples with soy drink C2 and B5 had the best taste. The worst smell and taste had the sample without soy milk and inulin A1. There was a change of sensory prop-erties during storage. Based on the statistical analysis of the results, it is evident that most D group samples were the most stable during stor-age. The results of the consumer acceptance for the produced fresh cream cheese samples are shown in Tables 5, 6 and 7. The preferred prod-uct is considered to be the one whose average grade (x) is at least 7.5 when applying a scale with nine possible grades [14]. This criterion was satisfied by all samples of probiotic fresh cheese after 1 day of storage. All samples were

24 E. Cilović, A. Brantner, H.T. Tran, J. Arsenijević, Z. Maksimović, “Methanol Extracts and Volatiles of Telekia speciosa...”, Technologica Acta, vol. 12, no. 1, pp. 9–13, 2019.
ISSN 1840-0426 (P); ISSN 2232-7588 (E) http://tf.untz.ba/technologica-acta
100% preferred, indicating that no assessor rated the fresh cheese samples with a grade lower than 5. Soy drink influenced the stable acceptability during the first 7 days of storage. After 14 days of storage, only the samples with added soy drink and inulin D3, B5, D4 and D5 might be considered desirable. Considering the statistical-ly significant difference (P<0.05), the Duncan test was conducted.
CONCLUSION
Sensory properties of probiotic fresh cheese were variable during storage for 14 days. During storage, the samples had a relatively good outer appearance. Soy drink and the combination of microbial start-er cultures had a positive influence on the external appearance, consistency, smell and taste of the sam-ples. Observing the results for the color of the probi-otic fresh cheese, this sensory characteristic was found to be the most stable during storage. The ther-malisation of the curd affected a slightly firmer con-sistency of the product, and during storage, the sur-face of the product did not extract whey. The samples inoculated with the combination of microorganisms Lyofast MWO 030 and Lyofast EF1 with inulin addition were the most stable during stor-age for all sensory properties. All the investigated samples showed a high percentage of 100% prefer-ence for the first day of storage. During storage, the percentage of desirability decreased in each sample (up to 62.50%).
REFERENCES
[1] A. R. Hill and P. Kethireddipalli, "Dairy products: cheese and yogurtin," in Biochemistry of Foods, N. A. M. Eskin and F. Shahidi, Eds. Elsevier Science & Technology Books, San Diego, Calif, USA, 3rd edition, 2012, pp. 319–362.
[2] H. Walsh, J. Ross, G. Hendricks, M. Guo, "Physico-chemical properties, probiotics survivability, microstructure, and acceptability of a yogurt-like symbiotic oats-based product using pre-polymerized whey protein as a gelation agent," Journal Food Science vol. 75(5), pp. 327-337, 2010.
[3] R.K.C. Jeewanthi and H.D. Paik, "Modifications of nutritional, structural, and sensory characteristics of non-dairy soy cheese analogs to improve their quality attributes" Journal Food Science Technology vol .55(11). pp. 4384-4394, 2018
[4] N.K. Zanhi, I. A. Jideani, "Physico-chemical and sensory qualities of soy and milk solids fortified low fat yoghurt," African Journal of Agricultural Research vol. 7(38), pp. 5336-5343, 2012.
[5] C. Martinez-Villaluenga, M.I. Torino, V. Martín, R. Ar-royo, P. Garcia-Mora, I. Estrella Pedrola, C.Vidal-Valverde,
J.M. Rodriguez, J. Frias, "Multifunctional properties of soy milk fermented by Enterococcus faecium strains isolated from raw soy milk," Journal of Agricultural and Food
Chemistry vol. 60(41), pp.10235-44, 2012
[6] E. Litopoulou-Tzanetaki, N. Tzanetakis, A. Vafopoulou-Mastrojiannaki, "Effect of type of lactic starter on microbio-logical, chemical and sensory characteristics of Feta cheese," Food Microbiology, vol. 10, 31– 41, 1993.
[7] F. Villani, S. Coppola, (1994): "Selection of enterococcal strains for water-buffalo mozzarella cheese manufacture," Ann. Microbiol. Enzimol. Vol. 44, pp. 97–105, 1994.
[8] J.A. Centeno, S. Menendez, M.A. Hermida, J.L. Rodriguez-Otero, "Effects of the addition of Enterococcus faecalis in Cebreiro Cheese manufacture," International Journal of
Food Microbiology vol. 48, pp. 97– 111, 1999.
[9] P. Sarantinopoulous, G. Kalantzopoulous, E. Tsakalidou, "Effect of Enterococcus faecium on microbiological, physi-cochemical and sensory characteristics of Greek Feta cheese," International Journal of Food Microbiology, vol. 76 (1-2), pp. 93– 105, 2002.
[10] R.Bedani, M. Campos, I. Castro, A. E. Rossi, S. Saad, "In-corporation of soybean by-product okara and inulin in a probiotic soy yoghurt: Texture profile and sensory ac-ceptance," Journal of the science of food and agriculture, vol. 94(1), pp. 119-122, 2013
[11] J. Bibiana, A. Zamora, F. Quintana, B. Guamis, A-J. Trujil-lo, "Effect of inulin addition on the sensorial properties of reduced-fat fresh cheese," International Journal of Dairy
Technology, vol. 66(4), pp.472-483,2013.
[12] Ö.Kınık, H. Kesenkaş, P. Günç Ergönül, E. Akan, "The effect of using pro and prebiotics on the aromatic compounds, textural and sensorial properties of symbiotic goat cheese," Mljekarstvo vol. 67 (1), pp.71-85, 2017
[13] R. Radovanović, J. Popov-Raljić, Senzorna analiza prehrambenih proizvoda, Poljoprivredni fakultet Beograd i Tehnološki fakultet Novi Sad, 2001.
[14] H. Stone, J.J. Sidel, Sensory Evoluation Practices, Academic Press, Inc. New York. 1985
[15] H. Rasouli Pirouzian, J. Hesari, S. Farajnia, M. Moghad-dam, Sh. Ghiassifa, "Effects of Enterococcus faecalis and
Enterococcus faecium, Isolated from Traditional Lighvan Cheese, on Physicochemical and Sensory Characteristics of Iranian UF White Cheese," Journal of Agricultur-
al Science and Technology vol. 14, pp.1023-1034, 2012.
[16] M. Hatzikamari, E. Litopoulou-Tzanetakiand, N. Tzanetkis, "Microbiological Characteristics of Anevato: A Traditional Greek Cheese," Journal of Applied Microbiology, vol. 87, pp.595- 601, 1999.
[17] T.L. Thompons, E.H. Marth, "Changes in Parmesan cheese during ripening: Microflora - coliforms, enterococci, an-aerobs, propionibacteria and staphylococci," Milchwissen-
schaft, vol 41, pp.201–204, 1986.
[18] T.M. Lopez-Diaz, J.A. Santos, C.J. Gonzales, B. Moreno, M.L. Garcia, "Bacteriological quality of traditional Spanish blue cheese," Milchwissenschaft, vol. 50, pp.503–505, 1995.
[19] J.P. Jensen, G.W. Reinbold, C.J. Washam, E.R. Vedamuthu, "Role of enterococci in Cheddar cheese: proteolytic activity and lactic acid development," Journal of Milk Food Tech-
nology, vol.38, pp.3–7, 1975b.
[20] J.P. Jensen, G.W. Reinbold, C.J. Washam, E.R Vedamuthu, "Role of enterococci in Cheddar cheese: free fatty acid ap-pearsnce and citric acid utilization," Journal of Milk and
Food Technology, vol. 38, pp.142-145, 1975c.
T. Brčina, M. Vilušić, A. Selimović, Lj. Bojanović, “Influence of parameters on sensory properties…”, Technologica Acta, vol. 12, no. 1, pp. 19–25, 2019. 25
ISSN 1840-0426 (P); ISSN 2232-7588 (E) http://tf.untz.ba/technologica-acta
[21] J.A. Ordoñez, R. Barneto, M. Ramos, "Studies on Manche-go cheese ripened in olive oil," Milchwissenschaft vol. 33, pp.609–612, 1978.
[22] L.D. Trovatelli, A. Schliesser, "Identification and signifi-cance of enterococci in hard cheese made from raw cow and sheep milk," Milchwissenschaft vol.42, pp.717–719, 1987.

26 Technologica Acta, vol. 12, no. 1, 2019.
ISSN 1840-0426 (P); ISSN 2232-7588 (E) http://tf.untz.ba/technologica-acta
E. Horozić, Z. Ademović, J. Suljagić, A. Cipurković, E. Roša, A. Sejfić, D. Husejnagić, S. Hodžić, “Synthesis…”, Technologica Acta, vol. 12, no. 1, pp. 27–30, 2019. 27
ISSN 1840-0426 (P); ISSN 2232-7588 (E) http://tf.untz.ba/technologica-acta
SYNTHESIS, SPECTRAL CHARACTERIZATION, ANTIBACTERIAL AND ANTIFUNGAL ACTIVITY OF COPPER(II)-PABA COMPLEX ORIGINAL SCIENTIFIC PAPER
Emir Horozić 1�, Zahida Ademović1, Jasmin Suljagić1, Amira Cipurković2, Enida Roša3, Adisa Sejfić3, Darja Husejnagić2, Snježana Hodžić2 DOI: 10.5281/zenodo.3268784
RECEIVED 2019-03-17
ACCEPTED 2019-05-16
1 Faculty of Technology, University of Tuzla, Univerzitetska 8, 75000 Tuzla, Bosnia and Herzegovina 2 Faculty of Natural Sciences and Mathematics, University of Tuzla, Univerzitetska 4, 75000 Tuzla, Bosnia and Herzegovina 3 Faculty of Pharmacy, University of Tuzla, Univerzitetska 8, 75000 Tuzla, Bosnia and Herzegovina � [email protected]
ABSTRACT: pABA (p-aminobenzoic acid or 4-aminobenzoic acid) is a chemical component of the folate mole-
cule produced by plants and bacteria, and found in many foods. It is best known as a UV-blocking sunscreen ap-
plied to the skin, and is sometimes taken orally for certain medical conditions. Today it is known that many or-
ganic molecules in the human body can react with biometals such as copper, cobalt, manganese, iron and others.
This study was performed to investigate the interaction of Cu(II) ions with p-aminobenzoic acid. Spectroscopic
methods (FTIR and UV/Vis spectroscopy) were used to characterize the product obtained. The antimicrobial ac-
tivity of the synthesized complex was tested by diffusion techniques. The results of spectroscopic analysis indicate
the interaction of Cu(II) ions with pABA. Interaction is realized through oxygen donor atom of ligand. It was
found that the Cu(II) complex has significant antimicrobial activity compared to the pABA ligand.
KEYWORDS: p-aminobenzoic acid, copper, FTIR, UV/Vis, antimicrobial analysis
INTRODUCTION
Para-aminobenzoic acid (pABA), (Figure 1), is a
precursor for the synthesis of folic acid (also known
as vitamin B9 or folacin). Folic acid is an enzyme
cofactor, and it is involved in some basic biological
reactions, as nucleotide biosynthesis, DNA repair and
DNA methylation [1].
COH
H2N
O
Figure 1. Structure of pABA
pABA is a chemical compound which has been
of medical interest during the past decade because of
its effects on bacterial metabolism and pigment me-
tabolism [2]. It is also used as a protective drug
against solar insolation and in diagnostic tests for the
state of the gastrointestinal tract in medicine [3]. In
normal man, pABA is rapidly absorbed and excreted,
in small amount as free pABA or as acetylated
pABA. Most of this drug is excreted either as a con-
jugation product with glycine (p-aminohippuric acid)
or as the glucuronate [4]. pABA have shown a
stronger antimicrobial activity at lower pH values. It
is supposed that this acid reacts in at least two mech-
anisms of antibacterial activity: one mechanism in
common with other organic acids and the other
mechanism by interfering with the synthesis of the
peptidoglycan layer by an action on the dihydrofolate
reductase enzyme [5].
Complexing of biologically important molecules
as well as molecules introduced into the body by
drugs and supplements can significantly influence
their biological activity [6,7]. The analysis of the in-
teraction of biogenic metal M(II) cations with O, N,
S-donor atoms of ligands often used in the treatment
of a wide spectrum of diseases is important for moni-
toring of distribution, pharmacokinetics, excretion,
drug efficacy and adverse effects [8].
MATERIAL AND METHODS
CHEMICALS
All reagents used were p.a. purity and were pur-
chased from Sinex (Bosnia and Herzegovina), Euro-
Lab (Bosnia and Herzegovina), Sigma Aldrich (Unit-
ed States) and Fisher Scientific (United States).
SYNTHESIS OF CU(II)-PABA COMPLEX
The complex synthesis was performed according
to a previously published procedure [6, 8]. A mixture

28 E. Horozić, Z. Ademović, J. Suljagić, A. Cipurković, E. Roša, A. Sejfić, D. Husejnagić, S. Hodžić, “Synthesis…”, Technologica Acta, vol. 12, no. 1, pp. 27–30, 2019.
ISSN 1840-0426 (P); ISSN 2232-7588 (E) http://tf.untz.ba/technologica-acta
of ethanol and water in a volume ratio 1:1 was used
as a solvent for metal salt and pABA. For the synthe-
sis of complex, solutions of CuCl2 x 2H2O (0.005
mol L-1
) and pABA (0.01 mol L-1
) were prepared.
The solutions were mixed in an equimolar volume
ratio and mixed on a magnetic stirrer for 30 minutes
at room temperature, with an adjustment of pH value
at 5.6. After stirring, the solution was left in dark
space for three days to separate the solid complex.
The resulting dark green product was filtered, washed
with ethanol and water and then dried in a drying
oven at 50 °C. The dry product is stored in a dessica-
tor until analysis.
FTIR CHARACTERIZATION
In order to determine structure of the com-
plex, samples were recorded on Nicolet iS10 FT-
IR spectrophotometer - Thermo Fisher Scien-
tific. The ATR technique was used for sample
analysis. Samples were recorded in the range of
4000-650 cm-1
.
UV CHARACTERIZATION
The aqueous solutions of pABA (0.12 x 10⁻³
mol
L-1
) and Cu(II) salt (0.06 x 10⁻³
mol L-1
) were used
for recording the UV spectra. The solutions were
mixed in equimolar volume ratio, stirred for 2 hours
at 300 rpm, and then the UV spectra were recorded.
Absorption spectra were recorded on a UV/Vis spec-
trophotometer Perkin Elmer λ25, in the range of
wavelengths of 200-400 nm. Based on the position of
the absorption maximum (λmax) in the tested model
system, the value of the energy splitting of the central
ion was calculated.
MORPHOLOGICAL CHARACTERIZATION
Before morphological characterization, solid
complexes were treated with DMSO. The color, size
and shape of Cu(II) crystal complex were determined
by microscopic analysis. Shots were performed on
the binocular microscope, the Leica DM 2500P mark.
ANTIMICROBIAL ACTIVITY IN VITRO
Antimicrobial activities were investigated by dif-
fusion method on reference bacterial strains Esche-
richia coli, Enterococcus faecalis, Staphylococcus
aureus, Bacillus subtilis, Listeria monocytogenes and
Pseudomonas aeruginosa. Antifungal activity of the
complex was tested on Candida albicans. From the
microorganisms strains of overnight cultures, suspen-
sions of 0.5 McFarland turbidity were prepared (den-
sity 107-10
8 CFU/mL, depending on soy).
The strains were then placed on the surface of the
nutrient substrate-Mueller-Hinton agar (MH), dis-
persed in sterile Petri dishes. Substrate thickness was
4 mm. In the agar sterile drill-shaped holes were
made ("wells"), into which 80 µL of pABA and
Cu(II) complex solutions in concentration of 5 mg
mL-1
were added. After the plates were left at room
temperature for 15 minutes, the substance was dif-
fused into agar, incubated at 37⁰C/24 h. After the
incubation period, the size of the inhibitory zone was
measured and the sensitivity of the microorganisms
was expressed as follows: if the inhibitory zone of
the microorganism growth was greater than 20 mm, it
was marked with three pluses (+++), which is the
highest sensitivity of microorganisms. If the inhibito-
ry zone was in the range of 16-20 mm it was marked
with two pluses (++). Very low sensitivity is indicat-
ed with one plus (+), if the inhibitory zone is 10-15
mm in diameter. The minus (-) mark is used for an
inhibitory zone of less than 10 mm or if it’s absolute-
ly absent [9].
RESULTS AND DISCUSSION
STRUCTURE OF THE COMPLEX
Figure 2 shows the reaction scheme and the pro-
posed structure of the Cu(II)-pABA complex. Metal
and ligand react in a 1:2 molar ratio (M:L). The oxy-
gen atom from the carboxyl group is involved in the
formation of a bond with metal. The assumption is
that the metal ion can bind two molecules of water
(from the metal salt).
H2N
COH
O
2Cu(II)
pH = 5.6
30 minutes
H2N C C
O
O
NH2
O
O
Cu
H2O
OH2
Figure 2. Reaction scheme and proposed structure of the complex

E. Horozić, Z. Ademović, J. Suljagić, A. Cipurković, E. Roša, A. Sejfić, D. Husejnagić, S. Hodžić, “Synthesis…”, Technologica Acta, vol. 12, no. 1, pp. 27–30, 2019. 29
ISSN 1840-0426 (P); ISSN 2232-7588 (E) http://tf.untz.ba/technologica-acta
SPECTRAL CHARACTERIZATION
On the FTIR spectrum of the ligand, a strip char-
acteristic of the O-H stretch vibration is seen at 3458
cm-1
, which is not visible in the spectrum of the com-
plex. This indicates the interaction of copper(II) ions
with the ligand over the oxygen atom of the carboxyl
group. C=O stretch vibration is recorded as a high
intensity strip at 1657 cm-1
. For the carboxylate ion in
the spectrum of the complex the characteristic band is
1554 cm-1
(νas) (slight shift to smaller wave numbers
compared to the ligand spectrum) and 1380 cm-1
(νs).
The tape characteristic of the N-H stretch vibration
was recorded at 3360 cm-1
in the ligand spectrum, or
3248 cm-1
at the complex spectrum. Insights into the
electronic spectra of the ligand, peaks at 279, 217 and
202 nm were determined. In the spectrum of the
complex, two absorption peaks were recorded, with
hypochromic shifts. The difference in these two spec-
tra is that the absorbance peak at 202 nm visible in
the pABA spectrum is not visible in the spectrum of
complex. Based on the absorption peak for the
Cu(II)-pABA model system, splitting energy of d-
orbitales was determined and it was 592 kJ mol-1
.
Spectral data for pABA and Cu(pABA)2(H2O)2 are
shown in Table 1.
Table 1. Spectral data for pABA and Cu(pABA)2(H2O)2
Infra-red spectral bands (cm−1
)
Sample Functional group
N-H O-H C=O
pABA 3360 3458 1657
Cu(pABA)2(H2O)2 3248 - 1554
Electronic spectral bands (nm)
pABA 279, 217, 202
Cu(pABA)2(H2O)2 277, 217
MORPHOLOGICAL CHARACTERIZATION
Figure 3. Morphology of Cu(pABA)2(H2O)2 crystals
The morphologies of Cu(pABA)2(H2O)2 crystals
are presented in Figure 3. The images show the de-
veloped crystals, but irregular amorphous bodies.
Severe interference colors are present due to the
sample thickness. The size (diameter) is up to 0.25
mm.
ANTIMICROBIAL ACTIVITY IN VITRO
Table 2 shows the results of antimicrobial testing
of pABA and Cu(II) complex. Antimicrobial screen-
ing revealed the effect of Cu(II) complexes on all
tested gram positive bacteria. The largest inhibition
zone was recorded with Enterococcus faecalis (16
mm) and the smallest in Staphylococcus aureus (11
mm). The synthesized complex does not act against
gram negative bacteria and Candida albicans. In the
parent ligand, antimicrobial activity is completely
lacking in all bacterial strains and Candida albicans
at a concentration of 5 mg mL-1
. In comparison with
the control antibiotic Ciprofloxacin (conc. 1 mg
mL-1
), significantly less antimicrobial activity of
Cu(pABA)2(H2O)2 is observed.
Table 2. Antimicrobial activities of pABA and Cu(pABA)2(H2O)2
Microorganism Inhibition Zone [mm]
1 2
E. coli - -
E. faecalis - 16 (++)
S. aureus - 11 (+)
B. subtilis - 13 (+)
L. monocytogenes - 13 (+)
P. aeruginosa - -
C. albicans - - *Legend: (1) - pABA; (2) - Cu(pABA)2(H2O)2
CONCLUSION
Cu(pABA)2(H2O)2 complex is formed by interac-
tion of Cu(II) ion with pABA in 1:2 (M:L) molar ra-
tio. In the formation of the bond, oxygen atom of the
carboxyl group are involved. There is a difference in
the spectral and morphological properties of the
complex and the ligand. Complexation of pABA with
Cu(II) ion forms a compound that has significant an-
timicrobial activity on gram positive bacteria as op-
posed to pABA.
REFERENCES
[1] L. Zhonglei, K. Xiangxiang, L. Zhaoming, X. Meixiang, C.
Meiyuan, Z. Liang, S. Yuemao, H. Xiangyang, S. Siyang,
“Para-Aminobenzoic Acid (PABA) Synthase Enhances
Thermotolerance of Mushroom Agaricus bisporus”, PLOS
ONE, vol. 9, no. 3, March, 2014. [Online] Available:
https://doi.org/10.1371/journal.pone.0091298
[2] C. J. D. Zarafonetis, “Therapeutic possibilities of para-
aminobenzoic acid”, Annals of Internal Medicine, vol. 30,
no. 6, pp. 1188-1211, June 1949.
30 E. Horozić, Z. Ademović, J. Suljagić, A. Cipurković, E. Roša, A. Sejfić, D. Husejnagić, S. Hodžić, “Synthesis…”, Technologica Acta, vol. 12, no. 1, pp. 27–30, 2019.
ISSN 1840-0426 (P); ISSN 2232-7588 (E) http://tf.untz.ba/technologica-acta
[3] S. I. Akberova, “New Biological Properties of p-
Aminobenzoic Acid”, Biology Bulletin of the Russian
Academy of Sciences”, vol. 29. no. 4, pp. 390-393, July
2002.
[4] C. W. Tabor, M. V. Freeman, J. Baily, P. K. Smith, “Studies
on the metabolism of para-aminobenzoic acid”, Journal of
Pharmacology and Experimental Therapeutics, vol. 102, no.
2, pp. 98-102, June 1951.
[5] R. M. E. Richards, D. K. L. Xing, T. P. King, “Activity of p‐
aminobenzoic acid compared with other organic acids
against selected bacteria”, Journal of Applied Microbiology,
vol. 78, no. 3, pp. 209-215, March 1995.
[6] E. Horozić, A. Cipurković, Z. Ademović, D. Bjelošević, A.
Zukić, L. Kolarević, D. Husejnagić, S. Hodžić, “Synthesis,
spectral characterization and antimicrobial activity of some
M(II) complexes with Ciprofloxacin”, Journal of Engineer-
ing and Processing Management, vol. 10, no. 2, pp. 16-22,
December 2018.
[7] E. Horozić, A. Cipurković, Z. Ademović, L. Kolarević, D.
Bjelošević, A. Zukić, S. Hodžić, D. Husejnagić, M. Ibišević,
“Synthesis, characterization and in vitro antimicrobial ac-
tivity of the Cu(II) and Fe(III) complexes with 1-
cyclopropyl-6-fluoro-4-oxo-7-(piperazin-1-yl)-1,4-
dihydroquinoline-3-carboxylic acid”, Bulletin of the Chem-
ists and Technologists of Bosnia and Herzegovina, no. 51,
pp. 1-5, December 2018.
[8] A. Cipurković, E. Horozić, N. Ljubijankić, A. Odobašić, S.
Galijašević, M. Saletović, “Synthesis and spectral character-
ization of Fe(II) and Mn(II) complexes with oral fluoroura-
cil pro-drug Capecitabine”, RASAYAN Journal of Chemis-
try, vol. 10, no. 4, pp. 1381-1390, October 2017.
[9] L. Pirvu, C. Hlevca, I. Nicu, C. Bubueanu, “Comparative
analytical, antioxidant and antimicrobial activity studies on
a series of vegetal extracts prepared from eight plant species
growing in Romania”, Journal of Planar Chromatography,
vol. 27, no. 5, pp. 346-356. October 2014.
OPORPH – Second notice, Technologica Acta, vol. 12, no. 1, pp. 31-32, 2019. 31
ISSN 1840-0426 (P); ISSN 2232-7588 (E) http://tf.untz.ba/technologica-acta

32 OPORPH – Second notice, Technologica Acta, vol. 12, no. 1, pp. 31-32, 2019.
ISSN 1840-0426 (P); ISSN 2232-7588 (E) http://tf.untz.ba/technologica-acta
Dear Colleagues, It is our great honour to invite you to participate in the
VI International Scientific-Professional Symposium „Environmental resources, sustainable development, and food production - OPORPH 2019“, to be held in Tuzla on 14 - 15 November 2019, organized by the Faculty of Technology of the University of Tuzla and the Association of Chemists of Tuzla Canton. The holding of the symposium "OPORPH" becomes a tradition of the Faculty of Technology of the University of Tuzla, and this year our Faculty is proud to celebrate 60 years of successful work, therefore, as part of the conference, a formal academy will be held.
As in previous years, our goal is to promote and popularize excellence in scientific and professional research of scientists and experts in the fields of chemistry, chemical engineering and technology, food technology, biotechnology, environmental protection and agronomy, and this year under the common motto "Sustainable development today is a change you want to see tomorrow."
SYMPOSIUM VENUE
Amphitheater 1 of the Faculty of Technology, University of Tuzla, Univerzitetska 8, 75000 Tuzla. OFFICIAL LANGUAGES OF THE SYMPOSIUM Bosnian/Croatian/Serbian and English. SECTIONS
� Chemical analysis, control and monitoring
� Chemical and biochemical engineering
� Chemical and environmentally sustainable technologies � Food technology and biotechnology
� Environmental potentials and waste management � Agronomy
FORMS OF PARTICIPATION
� Plenary presentations (at the invitation of the organizer)
� Oral presentations � Poster presentations � Students section (authors i co-authors of papers are
exclusively students)
ABSTRACT AND PAPER SUBMISSIONS *Abstract (up to 250 words in an officially available template) is to be sent in English and in one of the official languages of BiH to the e-mail address: [email protected] *Paper (up to 7 pages in an officially available template) exclusively in English, should be sent to the email address: [email protected]. Papers that pass the review process will be published in one of the upcoming issues of Technologica Acta. *NOTE: The Scientific Committee reserves the right to decide on the acceptance and the manner of presentation of the submitted paper (oral or poster presentation). PARTICIPATION APPLICATION The completed application form is to be send to the e-mail address: [email protected]
IMPORTANT DATES 31 July 2019 - deadline for participation application and abstract submission 15 August 2019 - deadline for notification of abstract acceptance 01 October 2019 - deadline for paper submission SYMPOSIUM FEE
Category KM EUR
Faculty teachers 100 50
Associates/Assistants 50 25
Students 0 0
The Symposium fee includes: access to the Symposium, working material, certificate of participation, gala dinner. The scanned confirmation of the paid fee is to be sent to the following address: [email protected] Instructions for payment from Bosnia and Herzegovina: NLB Tuzlanska banka dd Tuzla, Budžet TK Deposit account: 1321000256000080 Budget organization: 2404008 Type of income: 722614; Municipality: 094; Reference number:7013000000 Instructions for payment from abroad: F57: Account with Institution: ACC 100867249 EUR NLB BANKA DD TUZLA, MARŠALA TITA 31 BIC: TBTUBA22 F59: Beneficiary Customer: IBAN: BA 3913210100 867 24943 TUZLANSKI KANTON – DEP.RN. TURALIBEGOVA 40, TUZLA ZA UNIVERZITET U TUZLI- TEHNOLOŠKI FAKULTET ORGANIZING COMMITTEE Sead Ćatić (president), Sabina Begić, Indira Šestan, Muhamed Bijedić, Meho Bašić, Ivan Petric, Gordan Avdić, Dijana Miličević, Abdel Đozić, Milena Ivanović, Vedran Stuhli, Jasmin Suljagić, Zvonko Antunović, Aldina Kesić, Stela Jokić, Mirna Habuda-Stanić, Maša Islamčević Razboršek, Milica Hadnađev-Kostić, Brankica Svitlica. SCIENTIFIC COMMITTEE Amra Odobašić, Midhat Jašić, Elvis Ahmetović, Vahida Selimbašić, Mirsad Salkić, Zahida Ademović, Zlatko Čmelik, Vlado Guberac, Jurislav Babić, Krunoslav Zmaić, Jasna Šoštarić, Zdenko Lončarić, Matija Domaćinović, Borislav Malinović, Mitja Kolar, Bruno Zelić, Jaroslava Budinski-Simendić, Tatjana Vulić, Fehim Korać, Elma Temim, Jasmina Ibrahimpašić, Nadira Ibrišimović-Mehmedinović, Radovan Omorjan, Borislav Miličević, Besim Salkić, Emir Imširović. CONTACT Sabina Begić Faculty of Technology Tuzla Univerzitetska 8, 75000 Tuzla, Bosniaa and Herzegovina Phone: 00387 35 320 740; Fax: 00387 35 320 741 e-mail: [email protected]
PLEASE FORWARD THIS LETTER TO ALL
INTERESTED PARTIES FOR PARTICIPATION IN VI
INTERNATIONAL SCIENTIFIC-PROFESSIONAL
SYMPOSIUM „OPORPH 2019“

Instructions for Authors, Technologica Acta, vol. 12, no. 1, pp. 33-36, 2019. 33
ISSN 1840-0426 (P); ISSN 2232-7588 (E) http://tf.untz.ba/technologica-acta
INSTRUCTION FOR AUTHORS
GENERAL INFORMATION
Technologica Acta is an open access, double-
blind peer-reviewed, semiannual international journal
devoted to fundamental and applied chemistry, as
well as materials chemistry and technology, chemical
engineering and technology, environmental protec-
tion engineering and food technology research, pub-
lished by the Faculty of Technology Tuzla, Universi-
ty in Tuzla (Bosnia and Herzegovina), since 2004.
Technologica Acta is an APC-free (there is not an
article processing charge or some hidden costs), open
access journal.
The Journal is indexed by CAB Abstracts,
EBSCO, Index Copernicus Journal Master List,
HRČAK, ROAD, COBISS, The Quality Factor and
many others.
CATEGORIES OF CONTRIBUTIONS
Original scientific paper reports original re-
search, previously unpublished – except in a prelimi-
nary form. It must contain significant and original
observations to be critically evaluated. Experimental
data should be presented in a way that enables repro-
duction and verification of analyses and deductions
on which the conclusions are based.
Preliminary communication includes short in-
formation on the results of scientific research which
require and merrit immediate publication.
Scientific note includes report on short but com-
pleted original research or describe original laborato-
ry techniques (methods, apparatus etc.).
Scientific review paper is original, critical and
up-to-date survey of an specific research area. Gener-
ally, these are prepared by the invitation of the Edi-
tor.
Professional paper reports on applications of an
already described innovation, known methods and
facts.
Conference paper presents lecture given (or post-
er presented) at a conference, workshop or similar
event.
REVIEWING THE MANUSCRIPT
All contributors are evaluated according to the
criteria of originality and quality of their scientific
content, and only those deemed worthy will be ac-
cepted for publication. To facilitate the reviewing
process, authors are encouraged to suggest two to
three persons competent to review their manuscript.
Such suggestions will be taken into consideration but
not always accepted.
The Editor-In-Chief and Editors have the right to
decline formal review of a manuscript when it is
deemed that the manuscript is:
− on a topic outside the scope of the Journal;
− lacking technical merit;
− of insufficient novelty for a wide international
readership;
− fragmentary and providing marginally incremen-
tal results; or
− is poorly written.
PROOFS
When a manuscript is ready for printing, the cor-
responding author will receive a PDF-formatted
manuscript for proof reading, which should be re-
turned to the journal within one week. Failure to do
so will be taken as the authors are in agreement with
any alteration which may have occurred during the
preparation of the manuscript.
COPYRIGHT
LICENSE AGREEMENT
“I, as a corresponding author, in submitting an article
to Technologica Acta certify that:
− I am authorized by my co-authors to enter into
these arrangements.
− I warrant, on behalf of myself and my co-authors,
that:
− the article is original, has not been formally
published in any other peer-reviewed journal,
is not under consideration by any other jour-
nal and does not infringe any existing copy-
right or any other third party rights;
− I am/we are the sole author(s) of the article
and have full authority to enter into this
agreement and in granting rights to Techno-
ploica Actar are not in breach of any other
obligation;
− the article contains nothing that is unlawful,
libellous, or which would, if published, con-
stitute a breach of contract or of confidence
or of commitment given to secrecy;
− I/we have taken due care to ensure the integ-
rity of the article. To my/our – and currently
accepted scientific – knowledge all state-
ments contained in it purporting to be facts
are true and any formula or instruction con-
34 Instructions for Authors, Technologica Acta, vol. 12, no. 1, pp. 33-36, 2019.
ISSN 1840-0426 (P); ISSN 2232-7588 (E) http://tf.untz.ba/technologica-acta
tained in the article will not, if followed ac-
accurately, cause any injury, illness or
damage to the user.
I, and all co-authors, agree that the article, if
editorially accepted for publication, shall be licensed
under the Creative Commons Attribution License CC
BY 4.0.”
PROFESSIONAL ETHICS AND PUBLICATION
POLICY
The journal expects the Editors, Referees and
Authors to adhere to the well-known standards of
professional ethics. Authors are responsible for the
factual accuracy of their contributions. Submission of
the paper commits the author not to submit the same
material elsewhere. Referees should act promptly. If
certain circumstances preclude prompt attention to
the manuscript at the time it is received, the non-
received manuscript should be returned immediately
to the Editor or the Referee should contact the Editor
for possible delay of the report submission date. The
Editor accepts full responsibility for his decisions on
the manuscripts.
MANUSCRIPT PREPARATION
Manuscript should be written with the assumption
that readers know the discussed subject. Thus in (a
short) introduction should briefly be stated only what
is necessary for understanding of the text.
Manuscripts with grammar or vocabulary
deficiencies are disadvantaged during the scientific
review process and, even if accepted, may be returned
to the author to be rewritten in regular English, either
standard British or American English, but consistent
throughout. The authors are requested to seek the
assistance of competent English language expert, if
necessary, to ensure their English is of a reasonable
standard. This journal maintains its policy and takes
the liberty of correcting the English of manuscripts
scientifically accepted for publication.
The submitted articles must be prepared solely
with Microsoft Word; with single spacing (12 points
Times New Roman; Greek letters in the character font
Symbol) in A4 format leaving 2.5 cm for margins.
The size of the article (text, along with abstract,
figures, tables and list of literature references should
be limited to 7-10 pages. An exception can be
negotiated with the editorial board, and to receive a
larger volume of work if the content and quality
justifies it.
IUPAC and International Union of Biochemistry
and Molecular Biology recommendations for the
naming of compounds should be followed.
Symbols of physical values should be in cursive
(italic), and unit of measure in regular font, eg. V, m,
p, t, T, but: m3, kg, Pa, °C, K.
SI units, or other permissible units, should be
employed. The designation of physical quantities
should be in Times New Roman font. In text, graphs,
and tables, brackets should be used to separate the
designation of a physical quantity from the unit.
Please do not use the axes of graphs for
additional explanations; these should be mentioned in
the figure captions and/or the manuscript (example:
“pressure at the inlet of the system, kPa” should be
avoided).
Percents and per mills, although not being units
in the same sense as the units of dimensioned
quantities, can be treated as such. Unit symbols
should never be modified (for instance: w/w%,
vol.%, mol.%) but the quantity measured has to be
named, e.g. mass fraction, w=95%; amount (mole)
fraction, x=20%.
Latin words, as well as the names of species,
should be in italic, as for example: i.e., e.g., in vivo,
ibid, Artemisia annua L., etc. The branching of
organic compound should also be indicated in italic,
for example, n-butanol, tert-butanol, etc.
Decimal numbers must have decimal points and
not commas in the text, tables and axis labels in
graphical presentations of results. Thousands are
separated, if at all, by a comma and not a point.
Tables are part of the text together with their
captions. They should be made so that they are
understandable without reading the text, font Times
New Roman 10 pt. in table. Table caption have to be
positioned above the table. The tables should be
numbered consequently in Latin numbers. Quantities
should be separated from units by brackets. Footnotes
to tables, in size 9 font, are to be indicated
consequently (line-by-line) in superscript letters.
Tables should be prepared solely using the Word
table function, without vertical lines. Table columns
must not be formatted using multiple spaces. Table
rows must not be formatted using Carriage returns
(enter key). Tables should not be incorporated as
graphical objects.
Figures and diagrams are also part of the text
together with their captions. They should be drawn
and described so that they are understandable without
reading the text. The same data should not be placed
at the tables and diagrams, except in exceptional
cases. The author will then give its reasons, and its
validity is subject to final assessment of Editorial
board and its reviewers. Figure caption have to be
positioned below the table. Every figure and/or
diagram should be prepared according to the artwork

Instructions for Authors, Technologica Acta, vol. 12, no. 1, pp. 33-36, 2019. 35
ISSN 1840-0426 (P); ISSN 2232-7588 (E) http://tf.untz.ba/technologica-acta
instructions and, even embedded in text, submitted
also as a separate file. All these files should be
archived in the *.zip or *rar archive and named as
follows: TA_last name of first author_first word of
title_figures.extension. The extension must match the
format of archive (zip or rar).
Mathematical and chemical equations should be
numbered by Arabic numbers, consecutively in
parenthesis at the end of the line. All equations
should be embedded in the text except when they
contain graphical elements (tables, figures, schemes
and formulae). Complex equations (fractions,
inegrals, matrix…) should be prepared using the
Word MS Equation Editor or MathType.
The main file, containing the text of the
manuscript with all elements embedded, should be
named as follows: TA_last name of first author_first
word of title.doc
Artwork Instructions. High resolution
illustrations in TIF, JPG, PNG or GIF format are
acceptable and must be uploaded as a separate
archived (.zip or .rar) file. MS files (Word,
PowerPoint, Excel, Visio) are NOT acceptable.
Generally, scanned instrument data sheets should be
avoided. Authors are responsible for the quality of
their submitted artwork.
Image quality: keep figures as simple as possible
for clarity - avoid unnecessary complexity, colouring
and excessive detail. Images should be of sufficient
quality for the printed version, i.e. 300 dpi minimum.
Image size: illustrations should be submitted at its
final size (8 cm for single column width or 17 cm for
double column width) so that neither reduction nor
enlargement is required. Please, keep in mind that
colour photographs rarely reproduce satisfactorily in
black and white.
STRUCTURE OF THE MANUSCRIPT
The manuscript must contain the title of the
manuscript, full name(s) of the author(s) without
abbreviation, abstract, the list of key words, the main
text with all the tables and figures embedded and list
of references. Can contain also the
“Acknowledgement” section.
Title should be specific and informative, in order
to exactly determine the content of the paper. It is
desirable to be as short as possible
Authors are listed with full first name(s) and
family name(s), without abbreviation. The
corresponding author should be marked with the
asterix (*) at the end of his family name.
A one-paragraph Abstract written of 150–200
words in an impersonal form indicating the aims of
the work, the main results and conclusions should be
given and clearly set off from the text. It must finish
with the list of keywords (up to 6, separated by “;”)
Main text should have the following form
(though this proposed form is not fixed):
Introduction should include the aim of the
research and a concise description of background
information and related studies directly connected to
the paper.
Experimental section should give the purity and
source of all employed materials, as well as details of
the instruments used. The employed methods should
be described in sufficient detail to enable experienced
persons to repeat them. Standard procedures should
be referenced and only modifications described in
detail.
Results and Discussion should include concisely
presented results and their significance discussed and
compared to relevant literature data. The results and
discussion may be combined or kept separate.
The inclusion of a Conclusion section, which
briefly summarizes the principal conclusions, is
highly recommended.
Acknowledgement section is optional.
Reference List should be selective rather than
extensive. Generally, no more than 30 references
should be cited in your manuscript. except when it
comes to review article. Please ensure that every
reference cited in the text is also present in the
Reference List (and vice versa).
If the original literature was not available to the
authors, they should cite by the source from which
the quotation was taken. Abbreviations for magazines
must be in strict accordance with the abbreviations
that are alleged by the Chemical Abstract.
Unpublished results and personal
communications are not recommended in the
reference list, but may be mentioned in the text.
From this issue of Technologica Acta (vol. 10,
no. 2) forward, the Journal will strictly follow the
IEEE citation style. The brief explanation of IEEE
citation style is given below.
IEEE citation style includes in-text citations,
numbered in square brackets, which refer to the full
citation listed in the reference list at the end of the
paper. The reference list is organized numerically,
not alphabetically.
THE BASICS OF IEEE CITATION STYLE:
IN-TEXT CITING
Refer to the source with a number in a square
bracket, e.g. [1], that will then correspond to the full
citation in your reference list.

36 Instructions for Authors, Technologica Acta, vol. 12, no. 1, pp. 33-36, 2019.
ISSN 1840-0426 (P); ISSN 2232-7588 (E) http://tf.untz.ba/technologica-acta
− Place bracketed citations within the line of text,
before any punctuation, with a space before the
first bracket.
− Number your sources as you cite them in the
paper. Once you have referred to a source and
given it a number, continue to use that number as
you cite that source throughout the paper.
− When citing multiple sources at once, the pre-
ferred method is to list each number separately, in
its own brackets, using a comma or dash between
numbers, as such: [1], [3], [5] or [1]-[5].
EXAMPLES OF IN-TEXT CITATIONS:
"...end of the line for my research [13]."
"This theory was first put forward in 1987 [1]."
"Scholtz [2] has argued that..."
"Several recent studies [3], [4], [15], [16] have
suggested that...."
"For example, see [7]."
EXAMPLES OF CITATIONS FOR DIFFERENT MATERIALS:
Material Type Works Cited
Book in print [1] B. Klaus and P. Horn, Robot Vision. Cambridge, MA: MIT Press, 1986.
Chapter in book [2] L. Stein, “Random patterns,” in Computers and You, J. S. Brake, Ed. New York: Wiley, 1994, pp. 55-70.
eBook [3] L. Bass, P. Clements, and R. Kazman, Software Architecture in Practice, 2nd ed. Reading, MA: Addison
Wesley, 2003. [E-book] Available: Safari e-book.
Journal article [4] J. U. Duncombe, "Infrared navigation - Part I: An assessment of feasability," IEEE Trans. Electron. Devices,
vol. ED-11, pp. 34-39, Jan. 1959.
eJournal (from
database)
[5] H. K. Edwards and V. Sridhar, "Analysis of software requirements engineering exercises in a global virtual
team setup," Journal of Global Information Management, vol. 13, no. 2, p. 21+, April-June 2005. [Online].
Available: Academic OneFile, http://find.galegroup.com. [Accessed May 31, 2005].
eJournal (from
internet)
[6] A. Altun, "Understanding hypertext in the context of reading on the web: Language learners'
experience," Current Issues in Education, vol. 6, no. 12, July 2003. [Online]. Available:
http://cie.ed.asu.edu/volume6/number12/. [Accessed Dec. 2, 2004].
Conference paper [7] L. Liu and H. Miao, "A specification based approach to testing polymorphic attributes," in Formal Methods and
Software Engineering: Proceedings of the 6th International Conference on Formal Engineering Methods, ICFEM
2004, Seattle, WA, USA, November 8-12, 2004, J. Davies, W. Schulte, M. Barnett, Eds. Berlin: Springer, 2004. pp.
306-19.
Conference
proceedings
[8] T. J. van Weert and R. K. Munro, Eds., Informatics and the Digital Society: Social, ethical and cognitive issues:
IFIP TC3/WG3.1&3.2 Open Conference on Social, Ethical and Cognitive Issues of Informatics and ICT, July 22-
26, 2002, Dortmund, Germany. Boston: Kluwer Academic, 2003.
Newspaper article
(from database)
[9] J. Riley, "Call for new look at skilled migrants," The Australian, p. 35, May 31, 2005. [Online]. Available:
Factiva, http://global.factiva.com. [Accessed May 31, 2005].
Technical report [10] J. H. Davis and J. R. Cogdell, “Calibration program for the 16-foot antenna,” Elect. Eng. Res. Lab., Univ.
Texas,
Austin, Tech. Memo. NGL-006-69-3, Nov. 15, 1987.
Patent [11] J. P. Wilkinson, “Nonlinear resonant circuit devices,” U.S. Patent 3 624 125, July 16, 1990.
Standard [12] IEEE Criteria for Class IE Electric Systems, IEEE Standard 308, 1969.
Thesis/Dissertation [1] J. O. Williams, “Narrow-band analyzer,” Ph.D. dissertation, Dept. Elect. Eng., Harvard Univ., Cambridge, MA,
1993.
SUBMISSION OF MANUSCRIPT
COVER LETTER
Manuscripts must be accompanied by a cover
letter It should contain:
− title of the manuscript without any abbreviations,
− proposed type of contribution,
− full name(s) of the author(s) without
abbreviations,
− full affiliation of all the authors (department,
institution, city and country), along with the
ORCID ID and ResearcherID (if they have
them),
− mailing address (address, phone and fax numbers,
e-mail) of the author to whom correspondence
should be addressed.
The file with cover letter should be named as
follows: TA_last name of first author_first word of
title_cover.doc.
SUBMISSION
Submissions containing all needed files should be
sent to e-mail address: [email protected] with
the subject “Manuscript for Technologica Acta”. All
manuscripts will be acknowledged on receipt (by e-
mail) and given a reference number, which should be
quoted in all subsequent correspondence.