Embed Size (px)
Citation preview

1
Glucose homeostasis is differentially affected by dietary Maillard Reaction
Products and macronutrients.
Josephine M. Forbes1,2, Samantha P. Cowan1,3, Sofianos Andrikopoulos4, Amy L.
Morley1, Leigh C. Ward5, Karen Z. Walker3, Mark E. Cooper1, Melinda T. Coughlan1,6.
1Diabetes Complications, Baker IDI Heart and Diabetes Research Institute, Melbourne,
Victoria, Australia
2Department of Immunology, Alfred Medical Research and Education Precinct, Monash
University, Melbourne, Australia.
3Department of Nutrition and Dietetics, Monash University, Melbourne, Australia.
4Department of Medicine, The University of Melbourne, Melbourne, Australia.
5School of Chemistry and Molecular Biosciences, University of Queensland, Brisbane,
Queensland, Australia.
6Department of Medicine, Alfred Medical Research and Education Precinct, Monash
University, Melbourne, Australia.
Corresponding author:
Dr Melinda T. Coughlan
Glycation & Diabetes Complications
Baker IDI Heart & Diabetes Institute, PO Box 6492, St Kilda Rd Central
Melbourne, 8008, Australia.
Telephone: +61 3 8532 1278, Fax: +61 3 8532 1480
Email: [email protected]
*Manuscript

2
Funding sources: This project was funded by a National Health and Medical Research
Council of Australia (NHMRC) New Investigator Project Grant (586645), the Juvenile
Diabetes Research Foundation (5-2010-163) and in part by the Victorian Government's
Operational Infrastructure Support Program. Melinda Coughlan holds an Australian
Diabetes Society Early Career Fellowship. Josephine Forbes and Sofianos
Andrikopoulos hold NHMRC Senior Research Fellowships. Mark Cooper is an NHMRC
Australia Fellow and a Juvenile Diabetes Research Foundation Scholar.
Running title: Heat treated diets and glucose homeostasis
Key words: Maillard reaction products, glucose, macronutrients, insulin, oxidative
stress, pancreas.

3
Abstract
Maillard reaction products (MRPs) are generated when protein-rich foods are subjected
to intensive heat during cooking. Overconsumption of a Western diet, high in MRP has
been identified as a major risk factor for diabetes; yet precisely how MRPs contribute to
defects in glucose homeostasis independent of consumption of other macronutrients
remains unclear. Eight-week old male Sprague Dawley rats were randomized to feeding
with one of six semi-pure diets: control, heat processed (high MRPs), high protein, high
dextrose, high in saturated fat (of plant origin), or high in saturated fat (of animal origin).
After feeding for 24 weeks body composition was determined by bioelectrical impedance
spectroscopy and glucose homeostasis was assessed. When compared to the high
MRP diet, excess consumption of the diet high in saturated fat (from an animal source)
increased body weight and fat mass, and impaired insulin sensitivity, as defined by
impaired skeletal muscle insulin signaling and insulin hypersecretion in the context of
increased circulating glucagon-like peptide (GLP-1). Compared to the control diet,
chronic consumption of the high MRP diet increased fasting glucose, decreased fasting
insulin and insulin secretory capacity. It also resulted in lower GLP-1 and an increase in
urinary 15-isoprostane F2t, a sensitive marker of oxidative stress status. These data
suggest that excessive consumption of heat-treated foodstuffs can impair glucose
homeostasis and pancreatic function in rodents independent of excesses in other
macronutrients. These data provide a link between over-consumption of processed
foods and the development of diabetes.

4
Introduction
Diabetes prevalence, now estimated as 171 million people worldwide, is expected
to double within the next 20 years (1). Diabetes is characterized by both hyperglycemia
and a relative deficiency in insulin secretion, required before development of overt
disease. In type 2 diabetes this is seen in the context of reduced insulin sensitivity,
whereas in type 1 diabetes, autoimmune destruction of the pancreatic beta cells leads to
absolute insulin deficiency. Reducing the global burden of diabetes is a high priority for
the WHO (1).
The global increase in diabetes has arisen in parallel with the increasing
popularity of Western-style diets, so that it has been argued that dietary factors and
diabetes are closely associated (2-5). The adverse effects of the Western diet are most
often attributed to its high energy density and poor nutrient profile with large amounts of
saturated and trans fatty acids and poor quality carbohydrate. Yet other adverse
features that derive from modern methods of food processing need also to be
considered, one of which is the high generation of Maillard reaction products (MRPs)
(6). MRPs, also known as advanced glycation end products (AGEs), are formed through
the non-enzymatic irreversible modification of free amino groups within proteins and
amino acids by reducing sugars and reactive aldehydes and can increase the shelf-life
and taste of manufactured foods (7). Once ingested, 10 to 30% of dietary MRPs are
thought to become absorbed into the circulation (8, 9) where they can form deleterious
cross-linkages with many body tissues before excretion into the urine via the kidneys

5
(9). Some MRPs can also arise endogenously under physiologic conditions within
tissues particularly in people with diabetes (7).
Recent studies in rodent models indicate that the restriction of dietary MRP intake
not only improves insulin sensitivity, but can also extend the lifespan (10, 11). Moreover,
other rodent studies suggest an association between AGEs and type 1 diabetes (12-14).
There remains a need however, to distinguish the effects pertaining to MRPs from
effects arising from other adverse dietary factors, particularly in relation to glucose
homeostasis, insulin sensitivity and pancreatic function. In this study, undertaken in
healthy rats, comparisons have therefore been made between the effect of a highly
processed, heat-treated rodent diet (high in MRPs) with unheated rodent diets that are
high in either saturated fatty acids, dietary protein or refined carbohydrates.

6
Methods and Materials
Rodents
All animal experiments were performed in accordance with the Alfred Medical
Research and Education Precinct Animal Ethics Committee. Rats were housed in
groups of three per cage with a 12 h light/dark cycle and ad libitum access to food and
water. Healthy male 8-week-old Sprague Dawley rats, weighing 250 to 300g, were
randomized into groups (n=10/group) and given one of the following diets: a control (C)
diet (unbaked AIN93G (15)); a baked diet high in MRP (MRP diet) (AIN93G baked at
160C for 1 h); a high protein (Pr) diet with 48% of total energy (%E) as protein; a high
glucose (Glu) diet (with 636 g dextrose/kg); a high saturated fat diet of plant origin (Pla
Fat) (40%E from hydrogenated coconut oil) or a high saturated fat diet of animal origin
(Ani Fat) (40%E from clarified butter, ghee) and followed for a period of 24 weeks.
All diets were semi-pure formulations manufactured by Specialty Feeds (Western
Australia, Australia). Unlike the high MRP diet, the control, protein, dextrose, and high
fat diets were not heat treated (i.e., were kept raw) and were not dehydrated and formed
into pellets. The MRP diet thus had a five times higher MRP content than the control
diet, as determined by an ELISA specific to the AGE carboxymethyllysine (CML) (16).
CML was chosen as a surrogate marker of all MRPs because it is present in tissues and
serum from humans and rodents and correlates with other MRPs and oxidants (17).
At 23 weeks after feeding, rats were placed individually in metabolic cages
(Tecniplast, VA, Italy) to collect a single 24-hour urine sample and to measure water and
food intake. After 24 weeks, rats were anaesthetized with pentobarbitone sodium (50

7
mg/kg body weight) and perfused via the abdominal aorta with 0.1 mol/L PBS for 1-2
min to remove circulating blood. The liver, gastrocnemius skeletal muscle, fat pads and
pancreas were removed, frozen in liquid nitrogen and stored at -80C. Glycated
hemoglobin was determined by HPLC as previously described (18).
Bioelectrical impedance spectroscopy (BIS)
At 23 weeks and after feeding, bioelectrical impedance spectroscopy was
performed in rats anaesthetized with 2.5% isofluorane in 1.75 L/min of oxygen delivered
via nose cone using a bioelectrical impedance analyzer (ImpSFB7, Impedimed,
Brisbane, Australia) as previously described (19, 20).
Intravenous glucose tolerance testing (IVGTT)
After 24 weeks of feeding, intravenous glucose tolerance testing was performed
(21). In brief, rats (n=6/group) were anaesthetized and the left carotid artery cannulated.
After equilibration and a bolus glucose injection of 1 g/kg, 0.5 ml blood samples were
taken at 2, 5, 10, 15, 30 and 45 min for the measurement of plasma glucose (glucose
oxidase method using an autoanalyser, Beckman Coulter LX20PRO) and plasma insulin
by radioimmunoassay (Rat Sensitive RIA, Linco Research, MO, USA). Whole blood was
reconstituted in saline and returned to the rats after plasma was extracted. Area under
the curve (AUC) was calculated by the trapezoidal rule (GraphPad Prism, GraphPad
Software, San Diego, CA, USA).

8
Intra-peritoneal insulin tolerance testing (ipITT)
ipITT was performed after 23 weeks of feeding. After a fasting blood sample was
collected, a 0.5 U/kg insulin bolus (Humalog, Insulin Lispro, Eli Lilly, USA) was injected
intra-peritoneally into rats and blood samples were taken at 15, 30, 60 and 120 min
post-bolus. Plasma glucose was measured as described above.
Homeostatic model assessment of insulin resistance (HOMA-IR)
HOMA-IR was used calculated to determine the relative insulin sensitivity (22)
using the formula (insulin (U/ml) x glucose (mmol/L)) divided by 22.5.
pAKT/AKT immunoblotting
Western immuno-blotting was used to determine the ratio of phosphorylated Akt
(phosphoAkt) to total Akt as a marker of insulin signaling in both liver and skeletal
muscle. Thirty g of protein (liver or gastrocnemius skeletal muscle) was reduced with
2% -mercaptoethanol and proteins were separated using polyacrylamide gel
electrophoresis (Bio-Rad Laboratories, Gladesville, Australia). Separated protein bands
were transferred onto a Hybond-P PVDF membrane (Millipore, Maryland, USA) using a
semi-dry blotting apparatus (Bio-Rad Laboratories, Gladesville, Australia). After
transfer, membranes were blocked with 5% skim milk powder diluted in a 1M Tris
buffered saline solution with 0.05% Tween-20 (TBS-T) for 1 h. After blocking,
membranes were washed in 1M TBS-T solution for 10 min before incubating overnight
with either Akt or phospho-Akt primary antibodies (rabbit anti-rat S473, Cell Signaling

9
Technologies, Massachusetts, USA, Akt antibody at a dilution of 1/10,000 and pAkt
antibody 1/5000). Akt and phosphoAkt membranes were washed six times in 1M TBS-T
solution before incubating for 1 h at room temperature with an anti rabbit, HRP-labeled
polymer secondary antibody (Dako, California, USA). Membranes were probed with
Chemiluminescent Peroxidase Substrate-3 (Sigma-Aldrich, St.Louis, USA) for 3 min.
Light emission was captured on CL-XPosure film (Thermo Scientific, Rockford, IL, USA).
The density of each band was quantitated using Adobe Photoshop. Results were
expressed as a ratio of phosphoAkt to Akt.
GLP-1, glucagon and Urinary 15-isoprostane F2t
Plasma GLP-1 and glucagon were determined using ELISA kits from Wako
(Osaka, Japan). Urinary 15-isoprostane F2t was measured using an EIA kit specifically
designed to assay urine samples (Oxford Biomedical Research, Rochester Hills, MI,
USA).
Statistical analysis
All statistical computations were performed using GraphPad Prism version 4.0a
for Mac OS X (GraphPad Software, San Diego, California, USA). Values for
experimental groups are given as mean, with bars showing the SEM, unless otherwise
stated. One-way ANOVA with Tukey’s post-test analysis, or two-way ANOVA with
Bonferroni post-test analysis was used to determine statistical significance. Where
appropriate, two-tailed t tests were performed. A probability of P < 0.05 was considered
to be statistically significant.

10
Results
To determine the effects of excess consumption of macronutrients and heat
treated foodstuffs (MRPs) on glucose homeostasis and pancreatic function, healthy
Sprague Dawley rats were fed one of the following diets for 24 weeks: a MRP (baked;
MRP) or control (unbaked; C) diet, a high protein (Pr) diet, a high dextrose (Glu) diet, or
a high fat diet in saturated fat from either a plant (hydrogenated coconut oil; Pla Fat) or
animal fat (clarified butter; Ani Fat) source. The nutrient and energy content of each diet
are presented in Table 1. All diets were isoenergetic but differed in specific
macronutrients. The MRP content, specifically carboxymethyllsine (CML), was 5-fold
higher in the MRP diet than in the unbaked control diet (101.9 versus 20.9 nmol/mol
lysine/100 mg, respectively).
Body composition
After 24 weeks of chronic feeding, mean body weight was lower in rats that
consumed high protein (Pr) diet (Figure 1A) than in controls. Conversely, body weight
was significantly increased in rats fed the high saturated fat diet of animal origin (Ani
Fat) (15% increase, P < 0.05). Total visceral adipose tissue was also increased in these
rats (Figure 1B). In contrast, both the high protein (Pr) and high glucose (Glu) diets
resulted in a smaller accumulation of total visceral adipose tissue. Consumption of the
high saturated fat diet of animal origin (Ani fat) led to significant increases in both
absolute and relative (% of body weight) fat mass as determined by BIS, (28%, P < 0.05
and 10%, P < 0.05, Figures 1C and 1D respectively). Whereas both absolute and

11
relative fat mass was lower in rats consuming the high glucose diet (22%, P < 0.05 and
21%, P < 0.05, Figure 1C and 1D respectively) compared to those fed the control diet.
Relative fat mass was also lower in the MRP and high protein diet groups (Figure 1D).
Although absolute fat free mass was greater in rats fed high glucose diets and both high
fat diets (Figure 1E), when expressed as a % of body weight, fat free mass was
increased in MRP, protein and glucose-fed rats, and not significantly altered in the high
fat-fed rats (Figure 1F).
Assessment of glucose homeostasis and insulin sensitivity
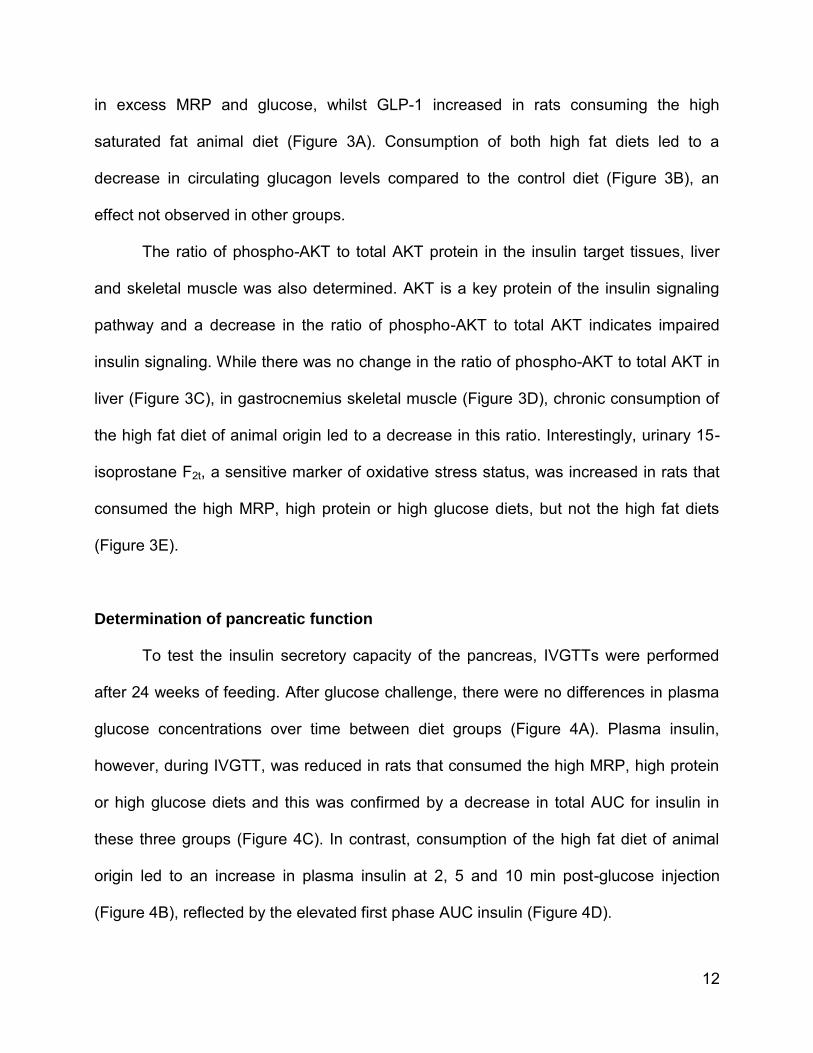
Fasting plasma glucose was increased in rats that consumed excess MRPs
(10%, P < 0.05, Figure 2A) or saturated fat from plant (18%, P < 0.05, Figure 2A) or
animal sources (19%, P < 0.05, Figure 2A). Fasting plasma insulin was lower in rats fed
the high MRP diet or the high glucose diet and also showed a tendency to increase in
rats fed a diet high in animal fat (not of statistical significance) (Figure 2B). The diet high
in animal fat, however, increased HOMA-IR, a surrogate measure of insulin resistance,
(Figure 2C) and compromised long-term glucose control as reflected by the increase in
glycated hemoglobin (Figure 2D). Compared with the control group, rats consuming the
diet high in animal fat had lower insulin sensitivity, as plasma glucose did not normalize
to control levels over 120 minutes post-insulin injection (Figure 2E), confirmed by the
increased AUC calculated in this group (Figure 2F). Rats consuming all other diets had
normal insulin sensitivity.
Circulating GLP-1, a gut hormone responsive to macronutrient intake, which
stimulates pancreatic insulin secretion, was decreased in rats that consumed diets high
12
in excess MRP and glucose, whilst GLP-1 increased in rats consuming the high
saturated fat animal diet (Figure 3A). Consumption of both high fat diets led to a
decrease in circulating glucagon levels compared to the control diet (Figure 3B), an
effect not observed in other groups.
The ratio of phospho-AKT to total AKT protein in the insulin target tissues, liver
and skeletal muscle was also determined. AKT is a key protein of the insulin signaling
pathway and a decrease in the ratio of phospho-AKT to total AKT indicates impaired
insulin signaling. While there was no change in the ratio of phospho-AKT to total AKT in
liver (Figure 3C), in gastrocnemius skeletal muscle (Figure 3D), chronic consumption of
the high fat diet of animal origin led to a decrease in this ratio. Interestingly, urinary 15-
isoprostane F2t, a sensitive marker of oxidative stress status, was increased in rats that
consumed the high MRP, high protein or high glucose diets, but not the high fat diets
(Figure 3E).
Determination of pancreatic function
To test the insulin secretory capacity of the pancreas, IVGTTs were performed
after 24 weeks of feeding. After glucose challenge, there were no differences in plasma
glucose concentrations over time between diet groups (Figure 4A). Plasma insulin,
however, during IVGTT, was reduced in rats that consumed the high MRP, high protein
or high glucose diets and this was confirmed by a decrease in total AUC for insulin in
these three groups (Figure 4C). In contrast, consumption of the high fat diet of animal
origin led to an increase in plasma insulin at 2, 5 and 10 min post-glucose injection
(Figure 4B), reflected by the elevated first phase AUC insulin (Figure 4D).

13
Discussion
While many studies now support the concept that dietary factors are involved in
the development of diabetes, controversy exists as to the relative contribution of single
dietary elements to disease pathogenesis. Before the development of agriculture,
dietary choices were limited to minimally processed plant and animal foods. With
advancing technology, and particularly since industrialization, original nutrient
characteristics have changed (23), so that highly processed foods now dominate the
typical western diet. In the current study, we examined the effects of raw unbaked diets
predominating in different macronutrients as compared with a processed diet subjected
to high heat to determine effects on pancreatic function, glucose homeostasis and
insulin sensitivity in healthy rodents.
Data obtained in this study indicate that in rodents, heat-treated food high in
MRPs can impair glucose homeostasis and pancreatic function independent of other
macronutrient excesses. These findings provide a clear association between
overconsumption of highly processed food and the development of diabetes. Indeed,
overt diabetes does not develop without pancreatic islet dysfunction (24). We found that
excess consumption of a heat treated diet (AIN93G baked at 160C for 1 h), baked to
increase the content of MRPs, led to a decrease in relative fat mass and an increase in
fasting glucose in parallel with a decrease in fasting insulin concentrations when
compared to consumption of an unbaked diet (AIN93G, control). Further investigation
using an IVGTT revealed a defect in glucose-induced insulin secretion with chronic
consumption of a diet high in MRPs. The defects elicited by the high MRP diet appear
14
similar to those occurring in patients prior to the onset of type 1 diabetes. This is in line
with previous studies that have suggested that dietary MRPs may have direct effects on
beta cell function. Indeed, AGEs, formed by heat treatment, have been implicated to
mediate defects in insulin secretion in pancreatic beta cell lines (25, 26) and in rodent
models (10, 12-14, 28).
The delivery of nutrients from the stomach into the duodenum and the
subsequent interaction of these nutrients with the small intestine to stimulate incretin
hormone release are considered key determinants of acute insulin secretion in response
to food (29). The incretin effect has been attributed to the secretion of glucagon-like
peptide-1 (GLP-1) from cells in the intestinal epithelium with GLP-1 enhancing insulin
secretion (30). In the current study, it was interesting to note that plasma GLP-1 levels
were suppressed in rats that consumed diets high in either MRPs or glucose, both diets
that also elicited defective insulin secretion. Conversely, consumption of the high fat diet
of animal origin, which caused insulin hypersecretion, also resulted in an increase in
GLP-1 in the circulation. Other studies in rodents have demonstrated an increase in
GLP-1 secretion in response to high fat feeding (31). These data are consistent with the
view that GLP-1 plays a key role as a modulator of insulin secretion in response to
dietary intake. GLP-1 also strongly inhibits glucagon secretion (30) and it was
noteworthy that a decrease in plasma glucagon was observed in rats that consumed the
high fat plant or animal diets. These data suggest that further examination of the direct
effects of MRPs and saturated fats on gut incretins should be a focus of future studies.
Consumption of high protein or high glucose diets led to variable metabolic
responses, including lower accumulation of fat mass. Even though ad libitum feeding

15
was used, the effect of the high protein diet on smaller body weight and fat mass could
not be attributed to a decreased energy intake. Similarly, the increase in body fat mass
in the rats fed a high fat diet of animal origin was not accompanied by higher energy
intake. Differences in fat accumulation seem rather to relate to differences in
macronutrient metabolism and energy expenditure. Fasting plasma insulin was
decreased after 24 weeks of high glucose feeding in parallel with reduced plasma GLP-
1 concentrations. Impaired insulin secretion was also seen in rodents that consumed
high glucose or high protein diets. Interestingly, the diets that suppressed insulin
secretion, namely those high in MRP, protein or glucose, also increased urinary
excretion of 15-isoprostane F2t, a biomarker of oxidative stress, suggesting that
oxidative stress may be a key mediator of diet-induced pancreatic dysfunction. Indeed,
there is a large body of evidence to implicate reactive oxygen species in beta cell
dysfunction, albeit in other contexts (32-34).
In the current study, we found that excess consumption for 24 weeks, of an
unbaked and unprocessed high saturated fat diet derived from clarified butter led to
increased body weight and fat mass, insulin resistance and an elevation in plasma
glucose and glycated haemoglobin. Although the high saturated fat diet derived from
hydrogenated coconut oil also increased fasting plasma glucose, it did not impair
glucose and insulin sensitivity, consistent with previous studies (35). It is also clear that
animal and coconut-sourced saturated fats exert differential effects on insulin sensitivity
and type 2 diabetes risk in humans. Polynesian islanders following a traditional diet with
a high proportion of total energy intake from coconut-sourced saturated fat
(approximately 40% of total energy) have very low prevalence rates of type 2 diabetes.

16
In contrast, Polynesians who migrate to countries which consume western style diets,
consume less saturated fat in total (<30% of total energy), but a larger quantity of that
saturated fat is derived from animal sources. In turn, their prevalence rate of type 2
diabetes is much higher (4, 36-38). It is possible that the differences in fatty acid
composition observed between plant and animal-sourced saturated fats, in addition to
the different metabolic fates of these fatty acids, may be responsible. For example, it is
known that long and medium chain saturated fatty acids undergo different pathways of
hydrolysis, absorption, storage, and oxidation (39, 40). However, although both high fat
diets were not heat processed, the clarified butter diet contained cholesterol. Our study
is unique, in assessing these effects in an unbaked diet where they are not confounded
by the introduction of MRPs, as would be the case in other studies where conventional
heat-treated rodent diets have been used.
In conclusion, data obtained from this study indicate that consumption of heat-
treated food can in itself impair glucose homeostasis and pancreatic function in
susceptible rodents. Further studies are now warranted to explore potential synergistic
effects between high dietary MRPs and other macronutrients, particularly simple sugars
and saturated fat, in the promotion of risk factors for diabetes.
Acknowledgments
We thank Amy Blair, Tuong-Vi Nguyen, Brooke Harcourt, Vicki Thallas-Bonke, Felicia
Yap, Sally Penfold, Karly Sourris and Maryann Arnstein for technical assistance and
Gavin Langmaid for the expert care of the rats.
17
References 1. World Health Organisation, International Diabetes Foundation. Definition and Diagnosis of Diabetes Mellitus and Intermediate Hyperglycaemia. Geneva: World Health Organisation; 2006. 2. Fung TT, McCullough M, van Dam RM, Hu FB. A prospective study of overall diet quality and risk of type 2 diabetes in women. Diabetes Care. 2007 Jul;30:1753-7. 3. Fung TT, Schulze M, Manson JE, Willett WC, Hu FB. Dietary patterns, meat intake, and the risk of type 2 diabetes in women. Arch Intern Med. 2004 Nov 8;164:2235-40. 4. Zimmet P, Alberti KG, Shaw J. Global and societal implications of the diabetes epidemic. Nature. 2001 Dec 13;414:782-7. 5. Sandu O, Song K, Cai W, Zheng F, Uribarri J, Vlassara H. Insulin resistance and type 2 diabetes in high-fat-fed mice are linked to high glycotoxin intake. Diabetes. 2005 Aug;54:2314-9. 6. O'Brien J, Morrissey PA. Nutritional and toxicological aspects of the Maillard browning reaction in foods. Crit Rev Food Sci Nutr. 1989;28:211-48. 7. Thornalley PJ, Battah S, Ahmed N, Karachalias N, Agalou S, Babaei-Jadidi R, Dawnay A. Quantitative screening of advanced glycation endproducts in cellular and extracellular proteins by tandem mass spectrometry. Biochem J. 2003 Nov 1;375:581-92. 8. Koschinsky T, He CJ, Mitsuhashi T, Bucala R, Liu C, Buenting C, Heitmann K, Vlassara H. Orally absorbed reactive glycation products (glycotoxins): an environmental risk factor in diabetic nephropathy. Proc Natl Acad Sci U S A. 1997 Jun 10;94:6474-9. 9. Somoza V, Wenzel E, Weiss C, Clawin-Radecker I, Grubel N, Erbersdobler HF. Dose-dependent utilisation of casein-linked lysinoalanine, N(epsilon)-fructoselysine and N(epsilon)-carboxymethyllysine in rats. Mol Nutr Food Res. 2006 Sep;50:833-41. 10. Cai W, He JC, Zhu L, Chen X, Zheng F, Striker GE, Vlassara H. Oral glycotoxins determine the effects of calorie restriction on oxidant stress, age-related diseases, and lifespan. Am J Pathol. 2008 Aug;173:327-36. 11. Hofmann SM, Dong H-J, Li Z, Cai W, Altomonte J, Thung SN, Zeng F, Fisher EA, Vlassar H. Improved insulin sensitivity is associated with restricted intake of dietary glycoxidation products in the db/db mouse. Diabetes. 2002;51:2082(8). 12. Coughlan MT, Yap FY, Tong DC, Andrikopoulos S, Gasser A, Thallas-Bonke V, Webster DE, Miyazaki J, Kay TW, et al. Advanced glycation end products are direct modulators of beta-cell function. Diabetes. 2011 Oct;60:2523-32. 13. Peppa M, He C, Hattori M, McEvoy R, Zheng F, Vlassara H. Fetal or neonatal low-glycotoxin environment prevents autoimmune diabetes in NOD mice. Diabetes. 2003 Jun;52:1441-8. 14. Zhao Z, Zhao C, Zhang XH, Zheng F, Cai W, Vlassara H, Ma ZA. Advanced glycation end products inhibit glucose-stimulated insulin secretion through nitric oxide-dependent inhibition of cytochrome c oxidase and adenosine triphosphate synthesis. Endocrinology. 2009 Jun;150:2569-76. 15. Reeves PG, Nielsen FH, Fahey GC, Jr. AIN-93 Purified Diets for Laboratory Rodents: Final Report of the American Institute of Nutrition Ad Hoc Writing Committee

18
on the Reformulation of the AIN-76A Rodent Diet. J Nutr. 1993 November 1, 1993;123:1939-51. 16. Coughlan MT, Forbes JM. Temporal increases in urinary carboxymethyllysine correlate with albuminuria development in diabetes. Am J Nephrol. 2011;34:9-17. 17. Cai W, He JC, Zhu L, Chen X, Wallenstein S, Striker GE, Vlassara H. Reduced oxidant stress and extended lifespan in mice exposed to a low glycotoxin diet: association with increased AGER1 expression. Am J Pathol. 2007 Jun;170:1893-902. 18. Cefalu WT, Wang ZQ, Bell-Farrow A, Kiger FD, Izlar C. Glycohemoglobin measured by automated affinity HPLC correlates with both short-term and long-term antecedent glycemia. Clin Chem. 1994 Jul;40:1317-21. 19. Ward LC, Mason S, Battersby KJ. Bioimpedance spectroscopy for the measurement of body composition of laboratory rats in vivo. International Journal of Body Composition Research. 2009;7:27-35. 20. Ward LC, Battersby KJ. Assessment of body composition of rats by bioimpedance spectroscopy: Validation against dual-energy X-ray absorptiometry. Scandinavian Journal of Laboratory Animal Science 2009;36:253-61. 21. Kebede M, Favaloro J, Gunton JE, Laybutt DR, Shaw M, Wong N, Fam BC, Aston-Mourney K, Rantzau C, et al. Fructose-1,6-bisphosphatase overexpression in pancreatic beta-cells results in reduced insulin secretion: a new mechanism for fat-induced impairment of beta-cell function. Diabetes. 2008 Jul;57:1887-95. 22. Matthews DR, Hosker JP, Rudenski AS, Naylor BA, Treacher DF, Turner RC. Homeostasis model assessment: insulin resistance and beta-cell function from fasting plasma glucose and insulin concentrations in man. Diabetologia. 1985 Jul;28:412-9. 23. Cordain L, Eaton SB, Sebastian A, Mann N, Lindeberg S, Watkins BA, O'Keefe JH, Brand-Miller J. Origins and evolution of the Western diet: health implications for the 21st century. Am J Clin Nutr. 2005 Feb;81:341-54. 24. Kahn SE, Zraika S, Utzschneider KM, Hull RL. The beta cell lesion in type 2 diabetes: there has to be a primary functional abnormality. Diabetologia. 2009 Jun;52:1003-12. 25. Matsuoka T, Kajimoto Y, Watada H, Kaneto H, Kishimoto M, Umayahara Y, Fujitani Y, Kamada T, Kawamori R, Yamasaki Y. Glycation-dependent, reactive oxygen species-mediated suppression of the insulin gene promoter activity in HIT cells. J Clin Invest. 1997 Jan 1;99:144-50. 26. Tajiri Y, Grill V. Aminoguanidine exerts a beta-cell function-preserving effect in high glucose-cultured beta-cells (INS-1). Int J Exp Diabetes Res. 2000;1:111-9. 27. Coughlan MT, Yap FYT, Tong DCK, Andrikopoulos S, Gasser A, Thallas-Bonke V, Webster DE, Miyazaki J, Kay TW, et al. Advanced Glycation End Products are Direct Modulators of Beta Cell Function. Diabetes. 2011;Accepted for publication 13th July 2011. 28. Hofmann SM, Dong HJ, Li Z, Cai W, Altomonte J, Thung SN, Zeng F, Fisher EA, Vlassara H. Improved insulin sensitivity is associated with restricted intake of dietary glycoxidation products in the db/db mouse. Diabetes. 2002 Jul;51:2082-9. 29. Wu T, Rayner CK, Jones K, Horowitz M. Dietary effects on incretin hormone secretion. Vitam Horm. 2010;84:81-110. 30. Holst JJ. The physiology of glucagon-like peptide 1. Physiol Rev. 2007 Oct;87:1409-39.

19
31. Knauf C, Cani PD, Ait-Belgnaoui A, Benani A, Dray C, Cabou C, Colom A, Uldry M, Rastrelli S, et al. Brain glucagon-like peptide 1 signaling controls the onset of high-fat diet-induced insulin resistance and reduces energy expenditure. Endocrinology. 2008 Oct;149:4768-77. 32. Drews G, Krippeit-Drews P, Dufer M. Oxidative stress and beta-cell dysfunction. Pflugers Arch. 2010 Sep;460:703-18. 33. Rains JL, Jain SK. Oxidative stress, insulin signaling, and diabetes. Free Radic Biol Med. 2011 Mar 1;50:567-75. 34. Lenzen S. Oxidative stress: the vulnerable beta-cell. Biochem Soc Trans. 2008 Jun;36:343-7. 35. Wein S, Wolffram S, Schrezenmeir J, Gašperiková D, Klimeš I, Šeböková E. Medium-chain fatty acids ameliorate insulin resistance caused by high-fat diets in rats. Diabetes Metab Res Rev. 2009;25:185-94. 36. Zimmet P. Epidemiology of diabetes and its macrovascular manifestations in Pacific populations: the medical effects of social progress. Diabetes Care. 1979 March 1, 1979;2:144-53. 37. Prior IA, Davidson F, Salmond CE, Czochanska Z. Cholesterol, coconuts, and diet on Polynesian atolls: a natural experiment: the Pukapuka and Tokelau island studies. Am J Clin Nutr. 1981 Aug;34:1552-61. 38. Taylor RJ, Bennett PH, LeGonidec G, Lacoste J, Combe D, Joffres M, Uili R, Charpin M, Zimmet PZ. The prevalence of diabetes mellitus in a traditional-living Polynesian population: the Wallis Island survey. Diabetes Care. 1983 Jul-Aug;6:334-40. 39. Greenberger NJ, Rodgers JB, Isselbacher KJ. Absorption of medium and long chain triglycerides: factors influencing their hydrolysis and transport. J Clin Invest. 1966 Feb;45:217-27. 40. Little TJ, Horowitz M, Feinle-Bisset C. Modulation by high-fat diets of gastrointestinal function and hormones associated with the regulation of energy intake: implications for the pathophysiology of obesity. Am J Clin Nutr. 2007 September 1, 2007;86:531-41.

20
Figure Legends Figure 1
Body weights (A), absolute total visceral depot fat pad weights (B), absolute fat mass
(C), relative fat mass (D), absolute fat free mass (E) relative fat-free mass (F) were
measured in rats after 24 weeks feeding of control (C), MRP, protein (Pr), glucose (Glu),
saturated plant fat (Pla Fat) or saturated animal fat (Ani Fat) diets. Data are meanSEM.
*p<0.05 compared to control, n=10 rats/group.
Figure 2
Fasting glucose (A), fasting insulin (B), HOMA-IR (C), glycated Hb (GHb) (D), plasma
glucose during ipITT (E), and corresponding AUC glucose (mmol/l) (F) were measured
in rats after 24 weeks feeding of control, MRP, protein (Pr), glucose (Glu), saturated
plant fat (Pla Fat) or saturated animal fat (Ani Fat) diets. Data are meanSEM. *p<0.05
compared to control, n=6-10 rats/group.
Figure 3
Plasma GLP-1 (A), plasma glucagon (B), liver phospho-AKT to AKT ratio (C),
gastrocnemius phospho-AKT to AKT ratio (GHb) (D), urinary excretion of 15-isoprostane
F2t (E) were measured in rats after 24 weeks feeding of control, MRP, protein (Pr),
glucose (Glu), saturated plant fat (Pla Fat) or saturated animal fat (Ani Fat) diets. Data
are meanSEM. *p<0.05 compared to control, n=10 rats/group.
Figure 4

21
Plasma glucose during IVGTT (A), plasma insulin during IVGTT (B), total AUC insulin
(ng/ml) (C), first phase AUC insulin (ng/ml) (D), were measured in rats after 24 weeks
feeding of control, MRP, protein (Pr), glucose (Glu), saturated plant fat (Pla Fat) or
saturated animal fat (Ani Fat) diets. Data are meanSEM. *p<0.05 compared to control,
n=6 rats/group.

1
Table 1. Nutrient content of rodent diets, macronutrient and energy intake
Control MRP Protein Dextrose
Fat
Hydrogenated
Coconut Oil
Clarified
Butter
Protein, % of total energy 19.3 19.3 48.0 19.3 19.3 19.3
Fat, % of total energy 16.4 16.4 16.4 16.4 40 40
Carbohydrate, g/kg 100 100 100 636 340 340
Digestible Energy, MJ/kg 16.1 16.1 18.2 16.7 19.5 19.4
Energy intake, KJ/24h 350±68 357±63 440±26 385±97 368±67 397±50
Protein, g/24h 4.3±0.8 4.3±0.8 12.8±0.82 4.5±1.1 3.7±0.7 4.0±0.5
Fat, g/24h 1.5±0.3 1.5±0.3 1.7±0.1 1.6±0.4 4.0±0.72 4.3±0.52
Carbohydrate, g/24h 2.2±0.4 2.2±0.4 2.4±0.2 14.7±3.72 6.4±1.2 6.9±0.9
124 h intake data are mean±SD, n=10 rats per group. 2P<0.05 compared to control diet
Table(s)

Figure 1
Figure(s)
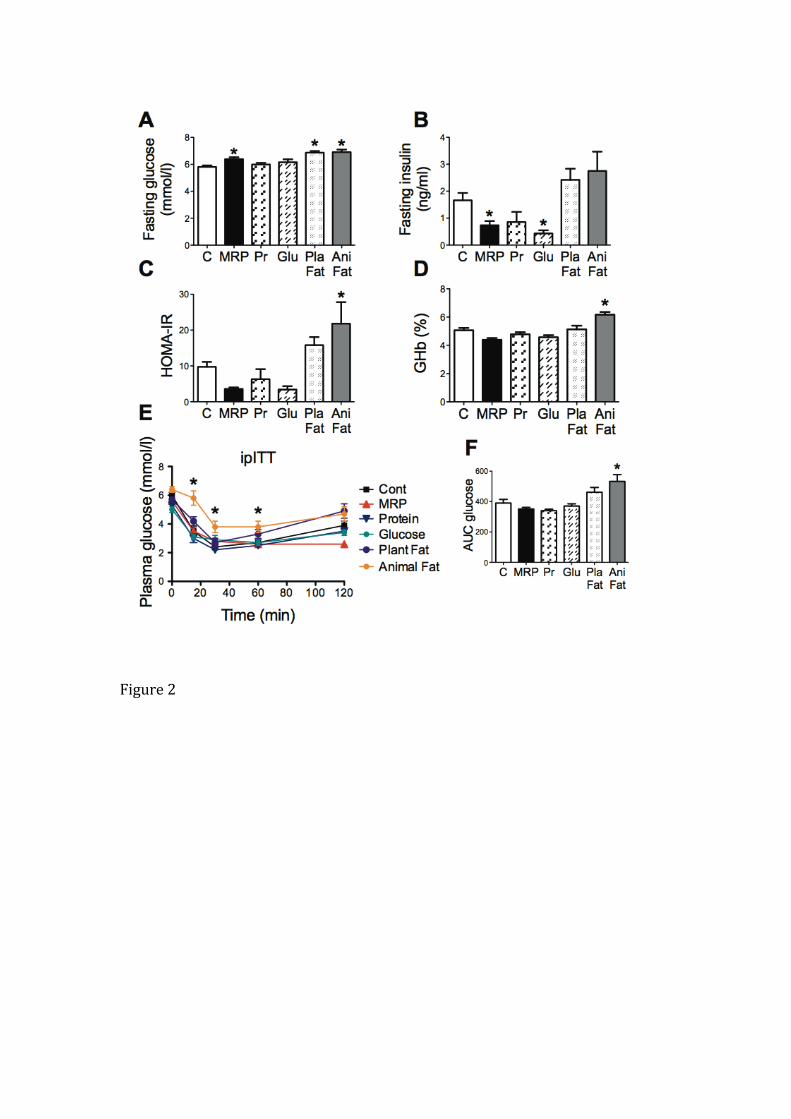
Figure 2

Figure 3

Figure 4