Embed Size (px)
Citation preview
National Aeronautics and Space Administration
Global Learning and Observations to
Benefit the Environment (GLOBE)
Data User Guide
Version 1.0
Last updated: July 5, 2019
NASA Goddard Space Flight Center
Greenbelt, Maryland, USA
www.nasa.gov

GLOBE-19-001
Effective Date: July 10, 2019
Revision: v1.0
2
Cite this document as:
Global Learning to Benefit the Environment (GLOBE) Data User Guide, 2019, version 1.0,
www.globe.gov.
GLOBE-19-001
Effective Date: July 10, 2019
Revision: v1.0
3
GLOBE Data User Guide
Electronic Signature Page
Prepared by:
Helen Amos
Senior Research Scientist, Science Systems and Applications, Inc.
Approved by:
Allison Leidner
GLOBE Program Manager
Approved by:
Anthony (Tony) Murphy
GLOBE Implementation Office Director
GLOBE-19-001
Effective Date: July 10, 2019
Revision: v1.0
4
GLOBE Data User Guide
Contributors
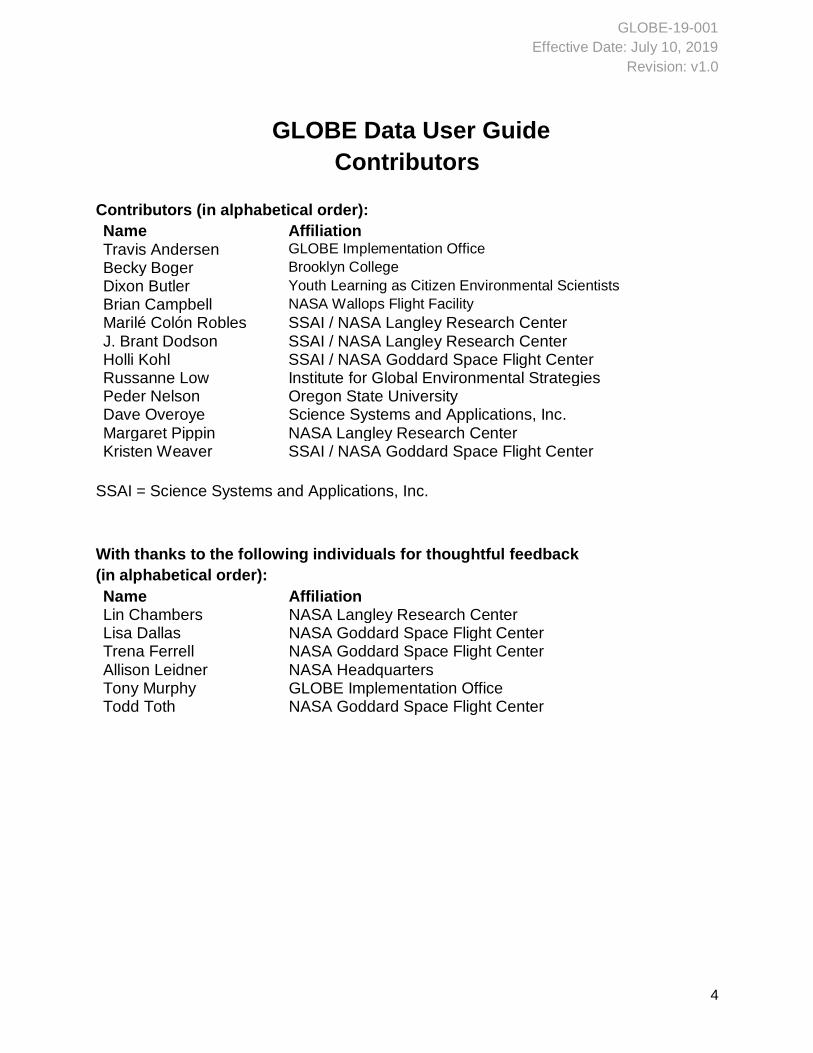
Contributors (in alphabetical order):
Name Affiliation Travis Andersen GLOBE Implementation Office
Becky Boger Brooklyn College
Dixon Butler Youth Learning as Citizen Environmental Scientists
Brian Campbell NASA Wallops Flight Facility
Marilé Colón Robles SSAI / NASA Langley Research Center J. Brant Dodson SSAI / NASA Langley Research Center Holli Kohl SSAI / NASA Goddard Space Flight Center Russanne Low Institute for Global Environmental Strategies
Peder Nelson Oregon State University
Dave Overoye Science Systems and Applications, Inc. Margaret Pippin NASA Langley Research Center Kristen Weaver SSAI / NASA Goddard Space Flight Center
SSAI = Science Systems and Applications, Inc.
With thanks to the following individuals for thoughtful feedback
(in alphabetical order):
Name Affiliation Lin Chambers NASA Langley Research Center Lisa Dallas NASA Goddard Space Flight Center Trena Ferrell NASA Goddard Space Flight Center Allison Leidner NASA Headquarters Tony Murphy GLOBE Implementation Office Todd Toth NASA Goddard Space Flight Center
GLOBE-19-001
Effective Date: July 10, 2019
Revision: v1.0
5
Preface This document is under GLOBE Project configuration control. Once this document is approved,
GLOBE-approved changes are handled in accordance with the change control requirements as
described in the GLOBE Change Management Plan, and changes to this document shall be
made by complete revision.
Questions or comments concerning this document should be addressed to:
GLOBE Implementation Office
GLOBE-19-001
Effective Date: July 10, 2019
Revision: v1.0
6
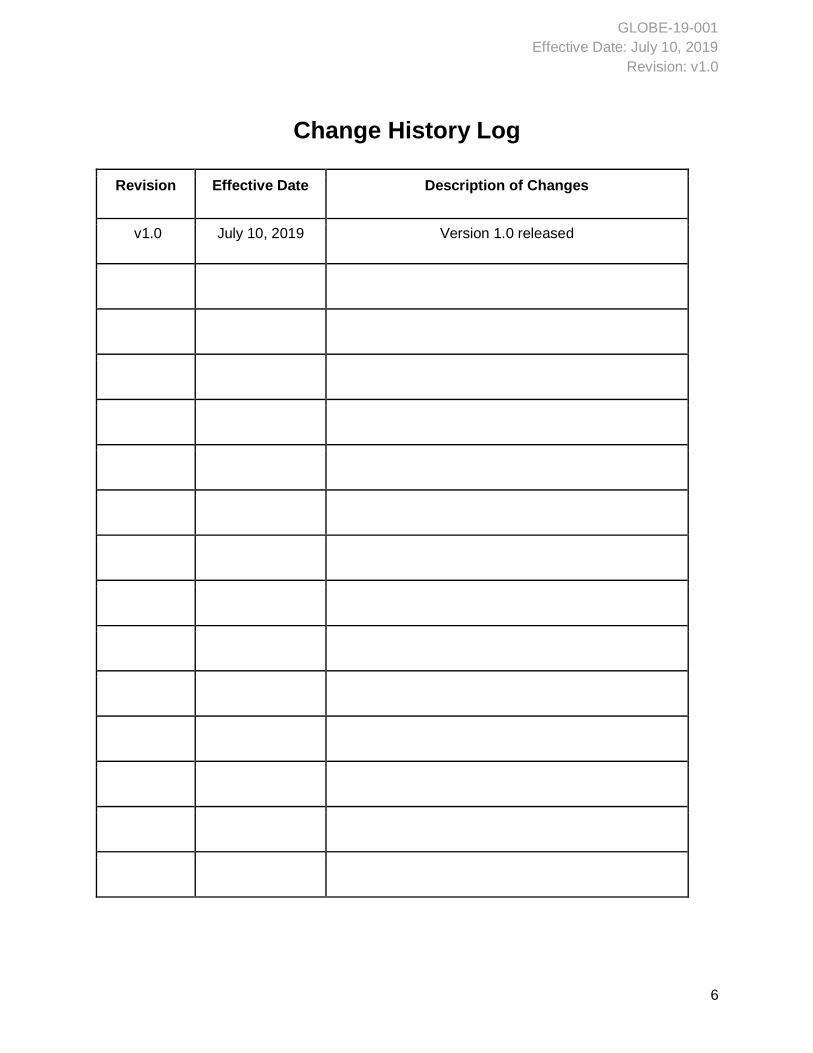
Change History Log
Revision Effective Date Description of Changes
v1.0 July 10, 2019 Version 1.0 released
GLOBE-19-001
Effective Date: July 10, 2019
Revision: v1.0
7
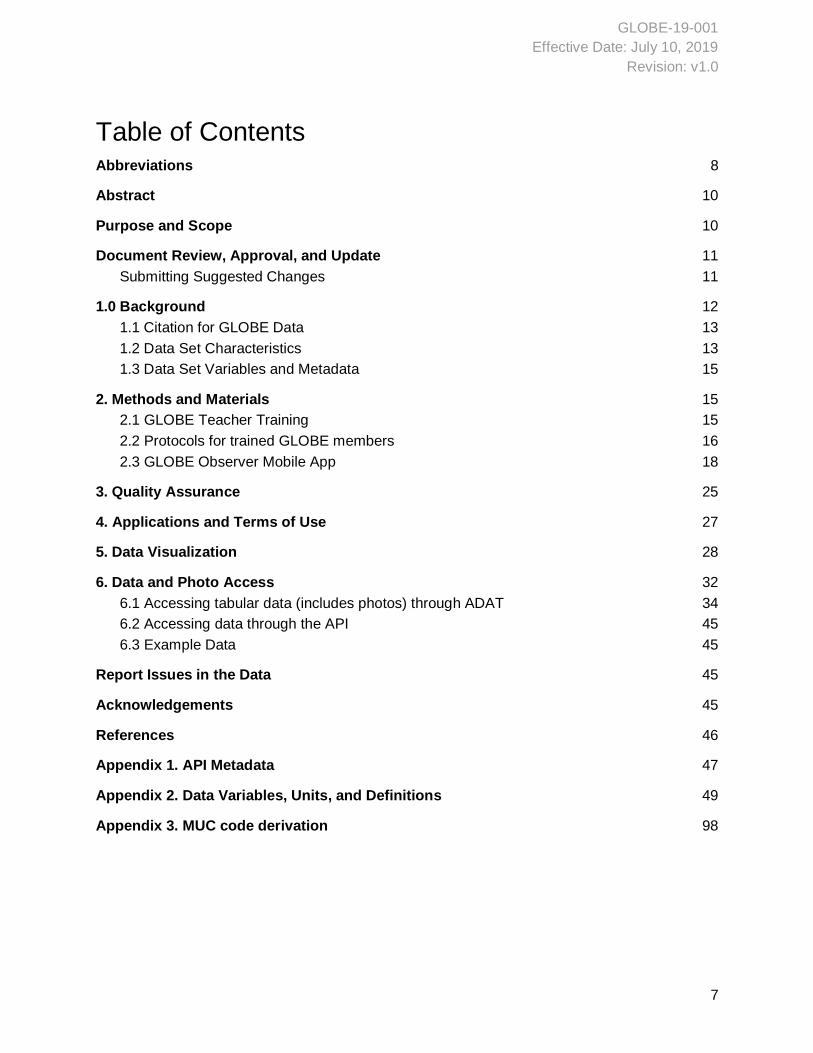
Table of Contents Abbreviations 8
Abstract 10
Purpose and Scope 10
Document Review, Approval, and Update 11
Submitting Suggested Changes 11
1.0 Background 12
1.1 Citation for GLOBE Data 13
1.2 Data Set Characteristics 13
1.3 Data Set Variables and Metadata 15
2. Methods and Materials 15
2.1 GLOBE Teacher Training 15
2.2 Protocols for trained GLOBE members 16
2.3 GLOBE Observer Mobile App 18
3. Quality Assurance 25
4. Applications and Terms of Use 27
5. Data Visualization 28
6. Data and Photo Access 32
6.1 Accessing tabular data (includes photos) through ADAT 34
6.2 Accessing data through the API 45
6.3 Example Data 45
Report Issues in the Data 45
Acknowledgements 45
References 46
Appendix 1. API Metadata 47
Appendix 2. Data Variables, Units, and Definitions 49
Appendix 3. MUC code derivation 98
GLOBE-19-001
Effective Date: July 10, 2019
Revision: v1.0
8
List of Figures Figure 1. MGRIS grid zones 14
Figure 2. Participating GLOBE countries 14
Figure 3. Taking directional images with GLOBE Observer app 19
Figure 4. Geometry of tree height measurement 23
List of Tables Table 1. GLOBE science protocols 17
Table 2. Required and optional trees fields 25
Table 3. Elements of the photo file name 33 Appendix 1. API metadata 47
Appendix 2. Data variables, units, and definitions 49
GLOBE-19-001
Effective Date: July 10, 2019
Revision: v1.0
9
Abbreviations Abbreviation Definition
ADAT Advanced Data Access Tool
API Application Programming Interface
CALIPSO Cloud-Aerosol Lidar and Infrared Pathfinder Satellite Observation
CERES Clouds and the Earth’s Radiant Energy System
csv Comma Separated Values
GLOBE Global Learning and Observations to Benefit the Environment
GPS Global Positioning System
I/O Input/Output
JSON JavaScript Object Notation
MGRS Military Grid Reference System
MODIS Moderate Resolution Imaging Spectroradiometer
MUC Modified UNESCO (United Nations Educational, Scientific, and Cultural Organization) Classification
S’COOL Students’ Cloud Observations On-Line
SMAP Soil Moisture Active Passive
STEM Science, Technology, Engineering, and Math
UTC Coordinated Universal Time
Vis GLOBE Visualization System
GLOBE-19-001
Effective Date: July 10, 2019
Revision: v1.0
10
Abstract The Global Learning and Observations to Benefit the Environment (GLOBE) Program is an
international science and education program that provides students and citizen scientists the
opportunity to contribute Earth observations. The GLOBE Program started in 1995, includes
more than 120 participating countries, has a mobile app (GLOBE Observer), and has more than
160 million observations contributed from trained students and citizen scientists in its database.
GLOBE data are all made freely available to everyone. This User Guide is a technical document
intended to help scientists and researchers understand, access, and use available GLOBE data.
GLOBE-19-001
Effective Date: July 10, 2019
Revision: v1.0
11
Purpose and Scope The purpose of the GLOBE Data User Guide is to help scientists and researchers understand,
access, and use available GLOBE data. The scope includes data collected by GLOBE-trained
teachers and students, automated weather stations, as well as data collected by citizen
scientists using the tools in the GLOBE Observer mobile application.
Document Review, Approval, and Update This document is reviewed, approved and updated in accordance with the GLOBE Change
Management Plan. This document is approved by the relevant stakeholders.
The GLOBE Data User Guide presents a snapshot of technical information about GLOBE data
that is current at the time of signature. It is reviewed periodically thereafter to ensure currency at
major milestones such as the addition of new tools to the GLOBE Observer mobile app,
addition/modification of GLOBE science protocols, or if major program/project changes occur.
The GLOBE Data User Guide contains the best-known information at the time it is documented
and will be updated at the major milestones. Upon approval, this document will be placed under
configuration control. Approved changes will be listed in the document’s Change History Log.
Submitting Suggested Changes Suggested updates, additions, edits, and corrections are welcomed. Please email your
suggestion(s) to [email protected] and include the following information:
● Suggested change (please be as specific as possible)
● Rationale for change
● Version of the guide
● Section
● Page number
● Your name
● Email address
● Date
● How are you using GLOBE data?
GLOBE-19-001
Effective Date: July 10, 2019
Revision: v1.0
12
1. Background The Global Learning and Observations to Benefit the Environment (GLOBE) Program is an
international science and education program that provides students and the public worldwide
with the opportunity to participate in data collection and the scientific process, and contribute
meaningfully to our understanding of the Earth system and global environment. Announced by
the U.S. Government on Earth Day in 1994, GLOBE launched its worldwide implementation in
1995. Classroom teachers receive training to become certified in GLOBE protocols. Protocols
are specific data collection methods. Classroom teachers then teach those protocols to their
students, and then collect and contribute measurements to the GLOBE database. Today there
are more than 34,000 schools, and 143,000 citizen scientists in the GLOBE network who have
contributed 160 million observations. Live statistics about GLOBE are updated continuously on
the GLOBE website.
In 2016, the GLOBE Observer mobile application (hereafter “app”) was launched to broaden
opportunities for teachers, students, and people who are outside formal classroom settings to
contribute Earth observations. The app is a tool that allows users to collect and submit data for
a subset of GLOBE protocols that do not require equipment or extensive training. Currently, four
kinds of observations can be collected and submitted through the app: clouds, land cover,
mosquito habitats, and trees. In 2017, a temporary Eclipse tool inside the app was created to
facilitate the collection of air temperature observations during the 2017 North American Solar
Eclipse. The Eclipse tool is being re-activated in 2019 for the South American Solar Eclipse.
User observations can include photographs. All observations submitted through the GLOBE
Observer app are stored in the GLOBE database. GLOBE data are all made freely available to
everyone. Today there are more than 230,000 observations submitted through the GLOBE
Observer app. The GLOBE Observer app can be downloaded for free from Google Play or the
Apple App Store.
There are primarily two types of individuals contributing measurements to GLOBE’s database:
(1) GLOBE member; and (2) GLOBE Participant. GLOBE members are typically those that
completed protocol training; use the program in a classroom setting or do work for the program
in addition to contributing data. A GLOBE Participant's primary focus is contributing
environmental data and may have yet to complete protocol training. Once a GLOBE member
has completed training for a particular sphere and a protocol within the sphere (e.g.,
Atmosphere and Air Temperature) the member may enter data for any of the other GLOBE
protocols in any sphere. Observers using the GLOBE Observer app are guided through
tutorials supplied within the app before submitting data. GLOBE-trained members can, and do,
use the GLOBE Observer app.
GLOBE-19-001
Effective Date: July 10, 2019
Revision: v1.0
13
1.1 Citation for GLOBE Data Global Learning and Observations to Benefit the Environment (GLOBE) Program, Date Data
was Accessed, https://www.globe.gov/globe-data.
NOTICE
If you publish a peer-reviewed article with GLOBE data, please credit the program and let us
know so we can advertise your work on the GLOBE Publications page. Send the citation for
your published article to [email protected].
1.2 Data Set Characteristics Sampling frequency: Discrete. Users can report a single observation at a site, or return to that
site over a period of time and report multiple observations over a period of months-to-years.
Time: Time is reported in UTC (Universal Coordinated Time).
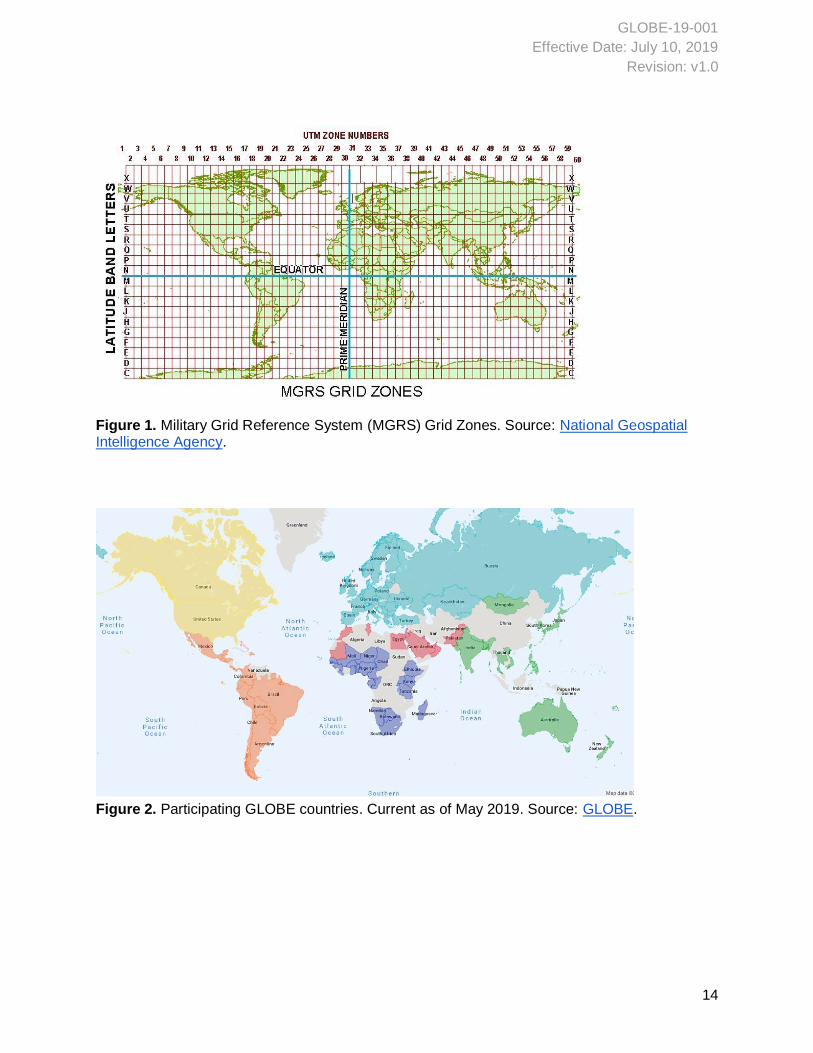
Spatial coverage: Worldwide. More than 120 countries participate in GLOBE (see Figure 2).
Spatial characteristics: GLOBE data are point data. Each GLOBE observation is associated
with a point latitude and longitude location.
For naming and visualization purposes, data submitted through the GLOBE Observer app or
GLOBE Data Entry app are associated with the Military Grid Reference System (MGRS) (see
Figure 1). An explanation of the MGRS grid, including examples, is available from the National
Geospatial Intelligence Agency. GLOBE observations submitted through either app are
associated with the nearest 100-meter x 100-meter MGRS grid box based on the measured
latitude and longitude from the user’s smartphone Global Positioning System (GPS). A “site ID”
is generated based on the associated MGRS grid box (see Appendix 2).
GLOBE-19-001
Effective Date: July 10, 2019
Revision: v1.0
14
Figure 1. Military Grid Reference System (MGRS) Grid Zones. Source: National Geospatial Intelligence Agency.
Figure 2. Participating GLOBE countries. Current as of May 2019. Source: GLOBE.
GLOBE-19-001
Effective Date: July 10, 2019
Revision: v1.0
15
1.3 Data Set Variables and Metadata Appendix 1 provides the lists of metadata associated with the GLOBE data. Appendix 2
provides a list of GLOBE data variables that can be downloaded. The metadata list includes
descriptions and units for each variable in the GLOBE data set. The variables correspond to the
measurements recorded in the GLOBE database.
Each observation submitted to GLOBE can be identified spatially, temporally, and by unique
identifiers associated with entities and individuals. Spatial and temporal resolutions vary
depending on the requirement of a protocol.
2. Methods and Materials There are more than 40 GLOBE science protocols (data collection methods) for collecting Earth
observations. GLOBE protocols are grouped by subject matter: atmosphere, hydrosphere,
biosphere, and pedosphere. Table 1 provides a list of GLOBE science protocols. There is
extensive documentation online about GLOBE science protocols. Trained GLOBE members are
the intended audience for these protocols. GLOBE members can submit data five ways:
desktop data entry forms, email data entry, application programming interfaces (APIs), the
GLOBE data entry app, and the GLOBE Observer app. Ingest of data submitted via email lacks
the ability to process images.
Citizen scientists can use the tools in the GLOBE Observer app to collect and submit
observations of clouds, mosquito habitats, land cover, and tree height. (There are plans to add
more protocols in the future to the Observer app.) Trained GLOBE members can, and many do,
use the GLOBE Observer app too.
2.1 GLOBE Teacher Training Training for GLOBE teachers has traditionally been accomplished at in-person workshops,
which are offered around the world and teach the appropriate data collection procedures for
various protocols. As of 2017, teachers can also be trained online (“eTraining”) using online
modules. These modules can be used as a review for current GLOBE teachers, or as additional
training during GLOBE workshops
The GLOBE Teacher’s Guide is a foundational resource for teachers training their students to
collect measurements. It is also a useful resource for scientists who want to know more about
the procedures for collecting GLOBE data. The GLOBE Teacher's Guide is an online collection
of background information, science protocols (data collection procedures), and learning
activities organized by Earth spheres: atmosphere, biosphere, hydrosphere, and pedosphere
(soil). Protocols provide step-by-step instructions on how to gather measurements as well as
guidance on instrumentation. Protocols are intended to be used as written, using instruments
that meet certain specifications in order to ensure data accuracy worldwide. Participants should
not submit data if it does not follow the protocol. Protocols include instructions for instrument
GLOBE-19-001
Effective Date: July 10, 2019
Revision: v1.0
16
calibration. Instruments, as well as instrument suppliers, are available here: Scientific
Instruments for Collecting GLOBE Data.
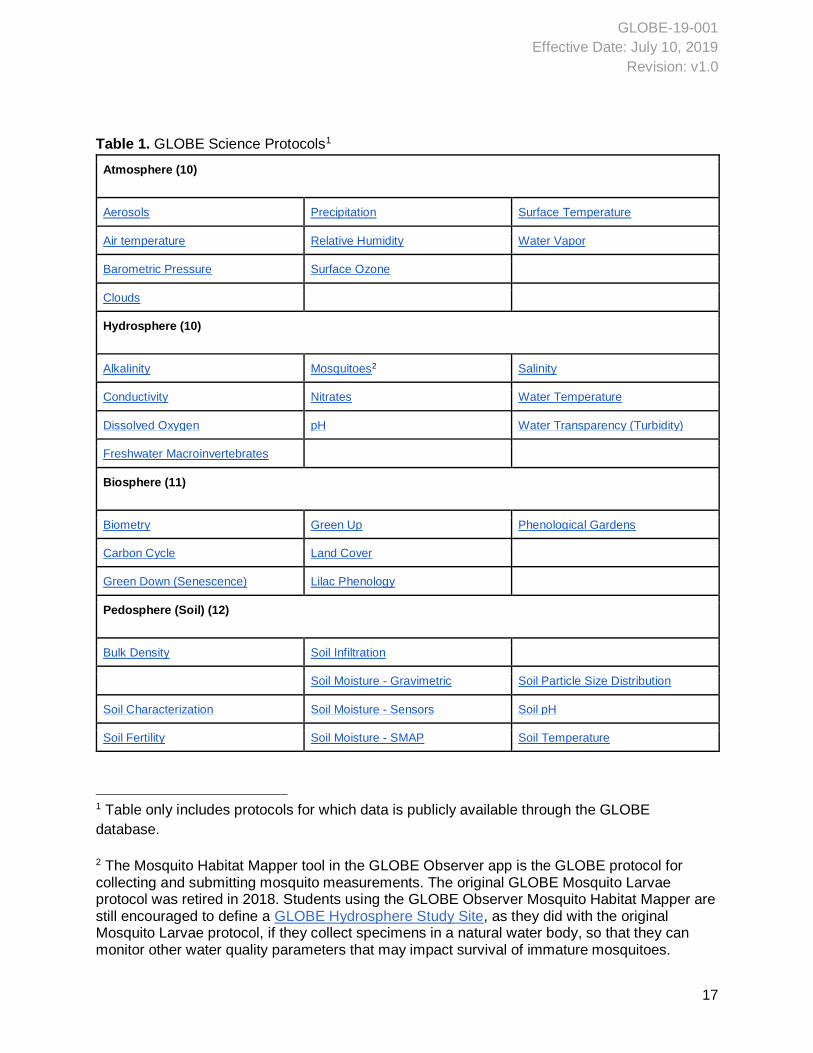
2.2 Protocols for trained GLOBE members Table 1 provides a list of GLOBE science protocols for students grouped by Earth sphere. The
links in the table will take you directly to the science protocol page in an internet browser
window, which includes the science protocol of interest plus supporting protocols.
GLOBE-19-001
Effective Date: July 10, 2019
Revision: v1.0
17
Table 1. GLOBE Science Protocols1
Atmosphere (10)
Aerosols Precipitation Surface Temperature
Air temperature Relative Humidity Water Vapor
Barometric Pressure Surface Ozone
Clouds
Hydrosphere (10)
Alkalinity Mosquitoes2 Salinity
Conductivity Nitrates Water Temperature
Dissolved Oxygen pH Water Transparency (Turbidity)
Freshwater Macroinvertebrates
Biosphere (11)
Biometry Green Up Phenological Gardens
Carbon Cycle Land Cover
Green Down (Senescence) Lilac Phenology
Pedosphere (Soil) (12)
Bulk Density Soil Infiltration
Soil Moisture - Gravimetric Soil Particle Size Distribution
Soil Characterization Soil Moisture - Sensors Soil pH
Soil Fertility Soil Moisture - SMAP Soil Temperature
1 Table only includes protocols for which data is publicly available through the GLOBE
database.
2 The Mosquito Habitat Mapper tool in the GLOBE Observer app is the GLOBE protocol for collecting and submitting mosquito measurements. The original GLOBE Mosquito Larvae protocol was retired in 2018. Students using the GLOBE Observer Mosquito Habitat Mapper are still encouraged to define a GLOBE Hydrosphere Study Site, as they did with the original Mosquito Larvae protocol, if they collect specimens in a natural water body, so that they can monitor other water quality parameters that may impact survival of immature mosquitoes.
GLOBE-19-001
Effective Date: July 10, 2019
Revision: v1.0
18
2.3 GLOBE Observer Mobile App In this section, we go into greater detail about the GLOBE Observer app. Tools in the Observer
app (e.g., clouds, tree height) mimic the science protocols for trained GLOBE members (Table
1). Observations collected using the GLOBE Observer mobile app are intended to be completed
using a smartphone or other mobile device (e.g., tablet) with a built-in camera. GLOBE
Observer tools are designed to work offline so they can be used in remote regions, although a
cellular or wifi network is needed to download the app and periodically upload data. Date, time,
latitude, longitude, and elevation are logged automatically at the beginning of each new
observation using the mobile device’s clock and GPS. Tools in the GLOBE Observer app let
users collect and report cloud, mosquito habitat, land cover, and tree height observations.
Photographs/Images
In the GLOBE Observer app, users have the option to take photographs with their device (e.g.,
smartphone, tablet) and send those images to GLOBE as part of their observation. For the
cloud and land cover tools in the GLOBE Observer app, photos/images are taken in the four
cardinal directions (north, south, east, west), as well as up and down to capture the overhead
and surface conditions. North is the magnetic north pole (not the geographic north pole). Users
can take these six photos in “automatic mode” or “manual mode”. Automatic mode uses the
device’s internal compass and accelerometer and captures each photo when the user is in the
correct orientation and pointed in the correct direction. Images captured in automatic mode are
a standard size of 1920 pixels x 1080 pixels. Manually uploaded images are stored at the full
mobile device resolution at which they were taken. For the mosquitoes protocol, images are
captured and stored at their original photo resolution - no cropping or resizing is performed.
Images are stored in the app on the user’s device until they are uploaded to GLOBE; images
are deleted from the app after being sent to conserve memory on the user’s device. Images
taken with the user’s device are stored as .jpg files.
GLOBE-19-001
Effective Date: July 10, 2019
Revision: v1.0
19
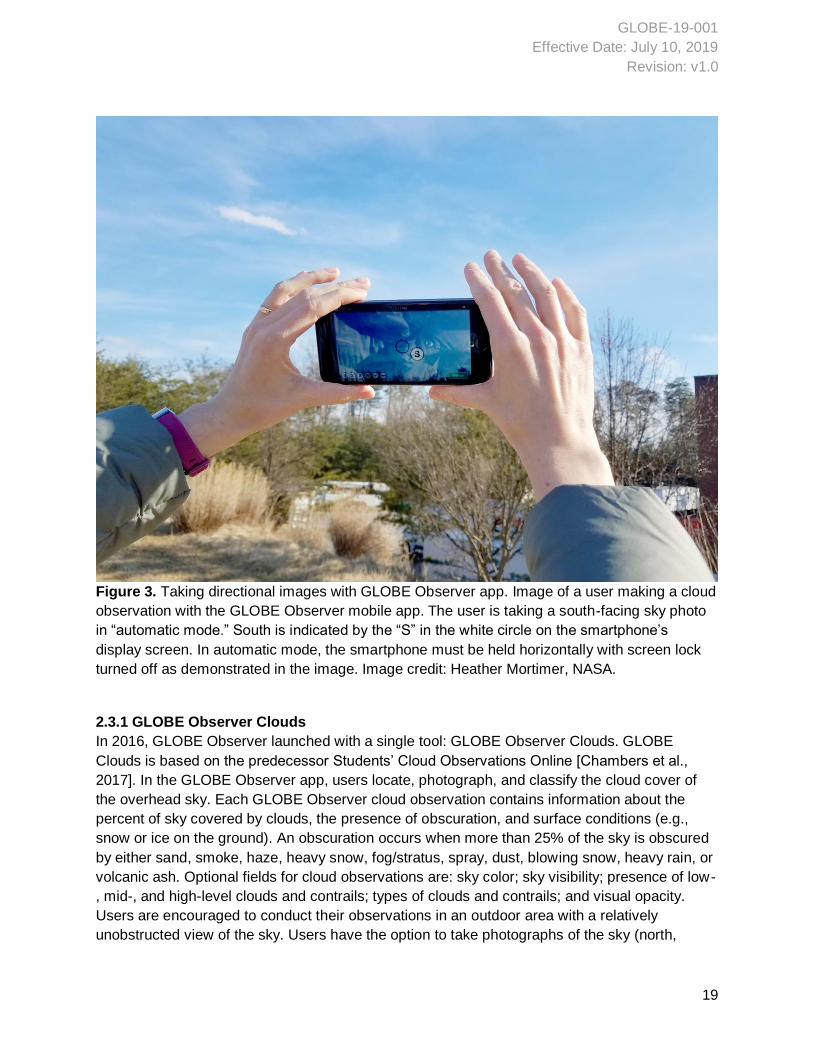
Figure 3. Taking directional images with GLOBE Observer app. Image of a user making a cloud
observation with the GLOBE Observer mobile app. The user is taking a south-facing sky photo
in “automatic mode.” South is indicated by the “S” in the white circle on the smartphone’s
display screen. In automatic mode, the smartphone must be held horizontally with screen lock
turned off as demonstrated in the image. Image credit: Heather Mortimer, NASA.
2.3.1 GLOBE Observer Clouds
In 2016, GLOBE Observer launched with a single tool: GLOBE Observer Clouds. GLOBE
Clouds is based on the predecessor Students’ Cloud Observations Online [Chambers et al.,
2017]. In the GLOBE Observer app, users locate, photograph, and classify the cloud cover of
the overhead sky. Each GLOBE Observer cloud observation contains information about the
percent of sky covered by clouds, the presence of obscuration, and surface conditions (e.g.,
snow or ice on the ground). An obscuration occurs when more than 25% of the sky is obscured
by either sand, smoke, haze, heavy snow, fog/stratus, spray, dust, blowing snow, heavy rain, or
volcanic ash. Optional fields for cloud observations are: sky color; sky visibility; presence of low-
, mid-, and high-level clouds and contrails; types of clouds and contrails; and visual opacity.
Users are encouraged to conduct their observations in an outdoor area with a relatively
unobstructed view of the sky. Users have the option to take photographs of the sky (north,
GLOBE-19-001
Effective Date: July 10, 2019
Revision: v1.0
20
south, east, west, up) and surface conditions (down). The app guides users to align their
smartphone cameras in the correct direction and tilted to a 14 degree angle, then automatically
takes the photographs. GLOBE Observer Clouds requires no additional equipment beyond a
smartphone. Required and optional elements of a clouds observation are below. Trained
GLOBE members who log into GLOBE Observer with a GLOBE ID can also enter air
temperature, relative humidity, and pressure.
Required elements of a clouds observation include total cloud cover or obscuration covering
more than 25% of the sky; and surface conditions. Total cloud cover categories are: no clouds
(0%), few (>0-105%), isolated (10-25%), scattered (25-50%), broken (50-90%), overcast (90-
10%). Obscuration types include: sand, smoke, haze, heavy snow, fog/stratus, spray, dust,
blowing snow, heavy rain, and volcanic ash. Surface conditions (yes/no) include: snow/ice,
standing water, muddy, dry ground, leaves on trees, and raining/snowing.
Optional elements of a clouds observation include cloud types, opacity, sky color, and visibility.
Observers qualitatively estimate cloud altitude by low, mid, and high and then identify cloud
types for each level. High cloud types include: contrails, cirrus, cirrocumulus, and cirrostratus.
Mid-level clouds include: altostratus, and altocumulus. Low clouds include: fog/stratus,
stratocumulus, cumulus, nimbostratus, and cumulonimbus. Observers can report percent cloud
cover for all clouds present at each level (low, mid, high). Observers can also report opacity for
each altitude level and cloud type as opaque, transparent, or translucent. Observers also have
the option to report the darkest blue observed in the sky and also qualitatively report sky
visibility. Sky color categories are: deep blue, blue, light blue, pale blue, and milky. Sky visibility
categories are: unusually clear, clear, somewhat hazy, very hazy, and extremely hazy.
The NASA GLOBE cloud team at Langley Research Center matches GLOBE Observer cloud
observations to corresponding satellite data. Users can opt-in to receive notifications on their
phone about satellite flyovers or use the satellite overpass tool available here. If a user’s clouds
observation is matched to satellite data, the user will receive a Satellite Match email from NASA
within one week of submitting the observation (example). Observations are matched to multiple
geostationary satellites, CERES instruments onboard Aqua and Terra, and CALIPSO (see
GLOBE’s satellite comparison page). Complete documentation of the satellite matching method
is here.
More information about how to make cloud observations in the GLOBE Observer app is here. A
toolkit for informal for educators is here.
2.3.2 GLOBE Observer Solar Eclipse
GLOBE Observer was modified to support the August 21, 2017 total solar eclipse, Eclipse
Across America. In addition to the standard clouds data collection already available in the app, a
special temporary tool allowing untrained users to report air temperature data was added for the
eclipse. Observers were asked to acquire a meteorological thermometer, either a traditional
GLOBE-19-001
Effective Date: July 10, 2019
Revision: v1.0
21
alcohol-filled glass model or a digital version, to measure temperature. The goal was to have
observers measure the eclipse-induced temperature depression, which complemented
temperature measurements from automated weather stations. Observers provided a nearly
unbroken record of temperature measurements along the path of totality across the United
States. This unique feature of the data would be difficult and expensive to replicate with
automated stations. In addition to air temperature measurements, observers were encouraged
to submit cloud observations periodically during the eclipse. Dodson et al. [2019] detail an
analysis of GLOBE Observer cloud cover and surface temperature data reported during the
2017 eclipse. More information about the 2017 eclipse, including GLOBE data from the event, is
here.
2.3.3 GLOBE Observer Mosquito Habitat Mapper
In May 2017, the Mosquito Habitat Mapper tool was added to the GLOBE Observer app. There
are four steps that users can take when using the Mosquito Habitat Mapper - and it is important
to note that users do not have to do all of the steps to make observations. The first step involves
identifying potential mosquito breeding habitats and taking pictures of them. To do this, users
simply walk around their home, school, or neighborhood and look for standing water sources -
natural or artificial- where an adult mosquito might lay her eggs. For example, users might find
discarded items such as cans or bottles, old tires, and water storage containers such as animal
feeding bowls and bird baths. Taking a picture of these potential mosquito breeding habitats
completes the first step. The app then prompts users to eliminate the standing water source or
cover it with a lid or a net when possible, thereby reducing the risk of mosquito-transmitted
diseases in the user’s community.
After this there are two optional steps. The app guides users through these identification
activities step-by-step. One is to sample and count the mosquito larvae that users find in the
water source, and the other is to use a microscope or cell phone magnifier to identify the larva
type (Aedes, Anopheles, and Culex). A user will need to use a lens with a 60x magnification or
higher. The app is optimized for identification of Aedes aegypti and Aedes albopictus, two
species implicated in transmission of pathogens causing a wide variety of diseases in humans,
including dengue, chikungunya, yellow fever and Zika. These two species originated in tropical
and humid subtropical regions worldwide and are now invasive in a variety of environments. The
app also allows for identification of mosquitoes from the genus Culex, many species of which
are implicated in a wide variety of diseases, including West Nile Virus. The app also enables the
identification of Anopheles, the genus primarily responsible for transmission of malaria.
Tutorials, an instructional video, and additional training resources about Mosquito Habitat
Mapper are available on the GLOBE Observer website. More information about how to make
mosquito observations in the GLOBE Observer app is here. A toolkit for informal educators is
here.
GLOBE-19-001
Effective Date: July 10, 2019
Revision: v1.0
22
2.3.4 GLOBE Observer Land Cover
In October 2018, Land Cover was added to the GLOBE Observer app. Land cover has been a
GLOBE student protocol since the 1990s [Larsen Becker et al., 1998]. In the GLOBE Observer
app, participants locate, photograph, and classify land cover for a 100-meter x 100-meter area.
Users photograph surface conditions and land cover in the up, down, east, west, north, and
south directions. Date, time, elevation, latitude, and longitude are logged by the user’s device.
The app guides users to align their smartphone cameras in the correct direction, adjust to an
angle that best captures the land cover, and captures the photographs. Users enter yes/no
information about surface conditions (e.g., snow and ice on the ground), then have the option to
classify the land cover types seen in each photo. Users classify land cover in each photo, so
there may be a different land cover classification in an east-facing photo compared to a west-
facing photo. Next, users have the option to estimate percent cover for each type of land cover
selected for each photo. Percentages may add up to more than 100 percent, since vegetation
has vertical structure. Lastly, GLOBE Observer users are asked to match their overall land
cover classification to the MODIS land cover classification. If there is a difference between their
classification and the MODIS classification, users may flag that pixel. Differences may occur
because of land cover or land use change or because of the difference in scale between MODIS
(500 meters) and GLOBE Observer (100 meters).
GLOBE Observer land cover classifications are based on the Modified UNESCO Classification
(MUC) and the International Geosphere-Biosphere Programme (IGBP) Land Cover Type
Classification used in the MODIS Land Cover Product. Historically, GLOBE has used the MUC
system for land cover protocol. Remote sensing land cover classification products widely use
IGBP, which distinguishes land cover by plant functional type rather than ecosystem type (e.g.,
evergreen broad leaf forest vs. tropical forest). Because GLOBE land cover was meant to be a
source of verification for remote sensing scientists, the GLOBE Observer app combines IGBP
and MUC. Users select land cover types in line with IGBP and then provide a small amount of
additional information about plant height and density that makes it possible to map IGBP land
cover classifications to the MUC system.
The land cover tool in the GLOBE Observer app differs from the student protocol primarily in the
classification system. To make GLOBE Observer land cover compatible with the historic
GLOBE land cover measurement data, the combination of all estimates in all directions is
converted into a single MUC code for the observed 100-m x 100-m pixel. Students, teachers,
and others doing the traditional GLOBE land cover protocol collect the latitude and longitude for
the center of a 90-m x 90-m homogenous pixel. They then photograph the site facing north,
south, east, and West and estimate the MUC land cover type. GLOBE members can change the
calculated MUC code in the GLOBE Observer app.
More information about how to make land cover observations in the GLOBE Observer app is
here. A toolkit for informal educators is here.
GLOBE-19-001
Effective Date: July 10, 2019
Revision: v1.0
23
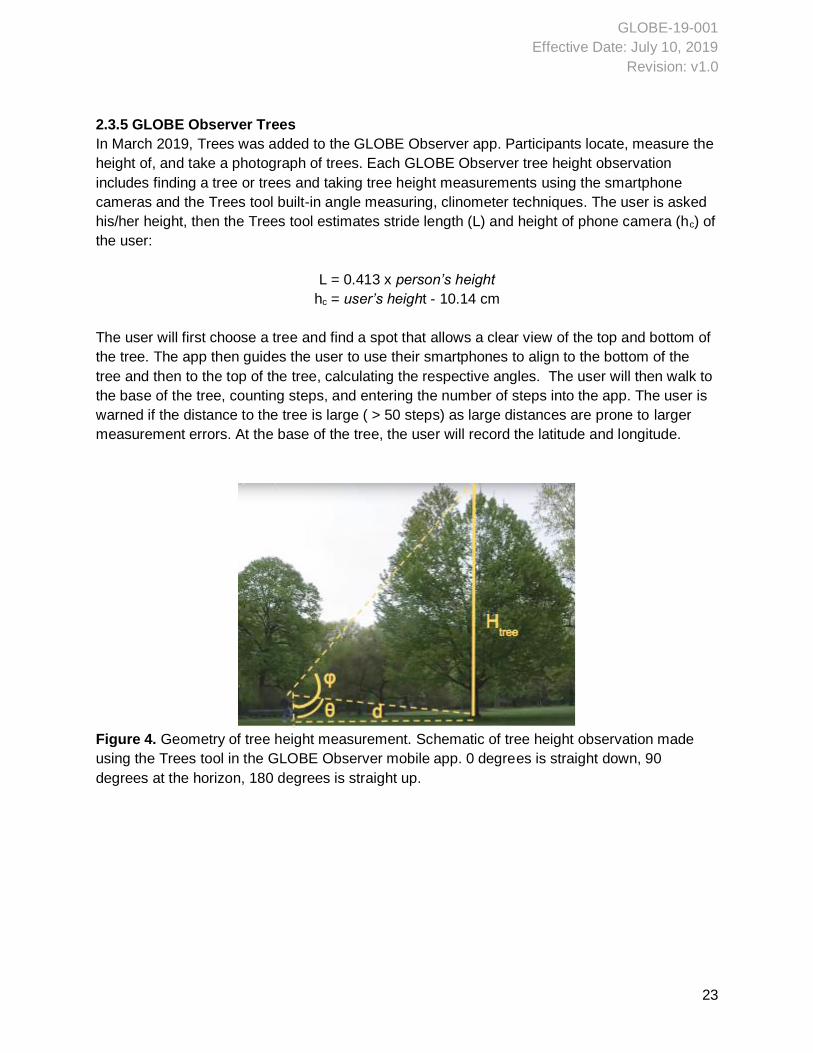
2.3.5 GLOBE Observer Trees
In March 2019, Trees was added to the GLOBE Observer app. Participants locate, measure the
height of, and take a photograph of trees. Each GLOBE Observer tree height observation
includes finding a tree or trees and taking tree height measurements using the smartphone
cameras and the Trees tool built-in angle measuring, clinometer techniques. The user is asked
his/her height, then the Trees tool estimates stride length (L) and height of phone camera (hc) of
the user:
L = 0.413 x person’s height
hc = user’s height - 10.14 cm
The user will first choose a tree and find a spot that allows a clear view of the top and bottom of
the tree. The app then guides the user to use their smartphones to align to the bottom of the
tree and then to the top of the tree, calculating the respective angles. The user will then walk to
the base of the tree, counting steps, and entering the number of steps into the app. The user is
warned if the distance to the tree is large ( > 50 steps) as large distances are prone to larger
measurement errors. At the base of the tree, the user will record the latitude and longitude.
Figure 4. Geometry of tree height measurement. Schematic of tree height observation made
using the Trees tool in the GLOBE Observer mobile app. 0 degrees is straight down, 90
degrees at the horizon, 180 degrees is straight up.
GLOBE-19-001
Effective Date: July 10, 2019
Revision: v1.0
24
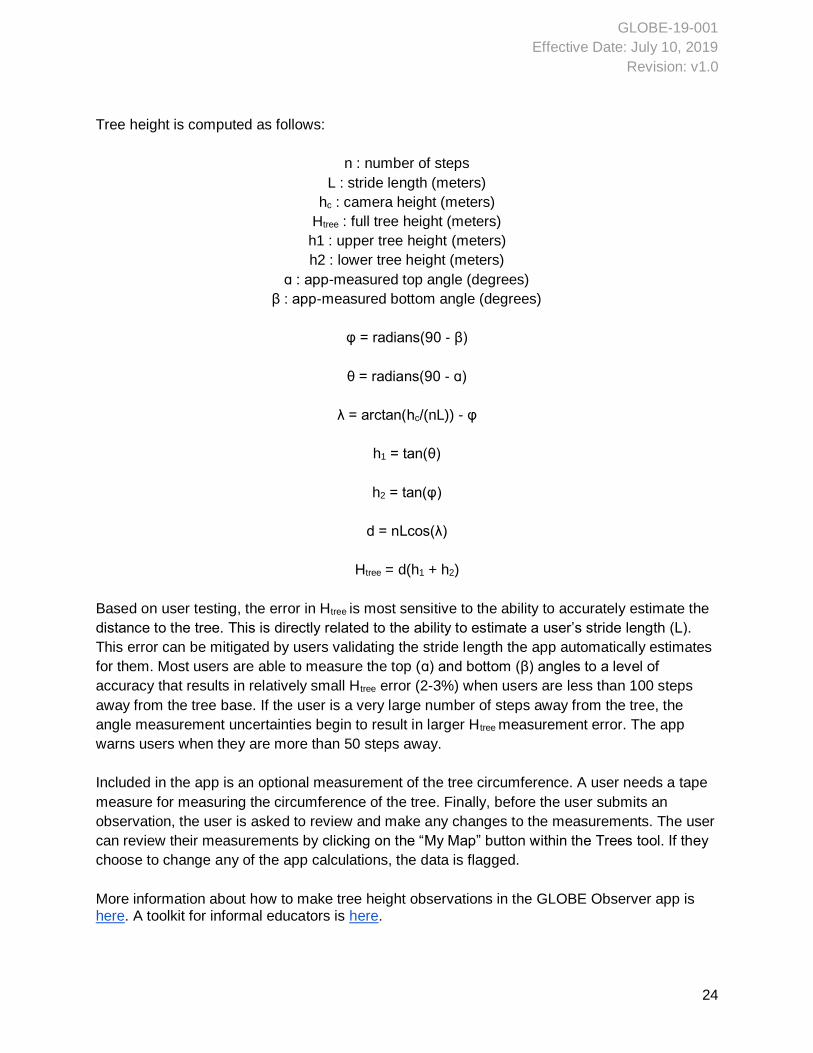
Tree height is computed as follows:
n : number of steps
L : stride length (meters)
hc : camera height (meters)
Htree : full tree height (meters)
h1 : upper tree height (meters)
h2 : lower tree height (meters)
ɑ : app-measured top angle (degrees)
β : app-measured bottom angle (degrees)
φ = radians(90 - β)
θ = radians(90 - ɑ)
λ = arctan(hc/(nL)) - φ
h1 = tan(θ)
h2 = tan(φ)
d = nLcos(λ)
Htree = d(h1 + h2)
Based on user testing, the error in Htree is most sensitive to the ability to accurately estimate the
distance to the tree. This is directly related to the ability to estimate a user’s stride length (L).
This error can be mitigated by users validating the stride length the app automatically estimates
for them. Most users are able to measure the top (ɑ) and bottom (β) angles to a level of
accuracy that results in relatively small Htree error (2-3%) when users are less than 100 steps
away from the tree base. If the user is a very large number of steps away from the tree, the
angle measurement uncertainties begin to result in larger Htree measurement error. The app
warns users when they are more than 50 steps away.
Included in the app is an optional measurement of the tree circumference. A user needs a tape
measure for measuring the circumference of the tree. Finally, before the user submits an
observation, the user is asked to review and make any changes to the measurements. The user
can review their measurements by clicking on the “My Map” button within the Trees tool. If they
choose to change any of the app calculations, the data is flagged.
More information about how to make tree height observations in the GLOBE Observer app is here. A toolkit for informal educators is here.
GLOBE-19-001
Effective Date: July 10, 2019
Revision: v1.0
25
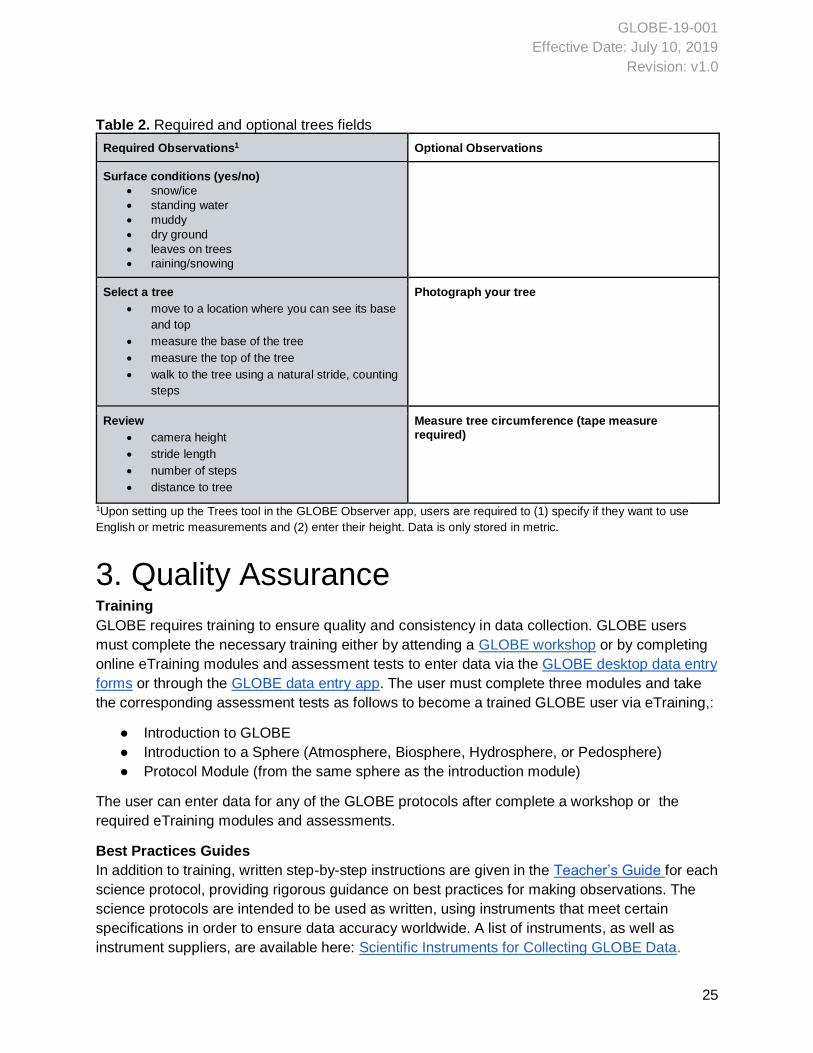
Table 2. Required and optional trees fields
Required Observations1 Optional Observations
Surface conditions (yes/no)
• snow/ice
• standing water
• muddy
• dry ground
• leaves on trees
• raining/snowing
Select a tree
• move to a location where you can see its base
and top
• measure the base of the tree
• measure the top of the tree
• walk to the tree using a natural stride, counting
steps
Photograph your tree
Review
• camera height
• stride length
• number of steps
• distance to tree
Measure tree circumference (tape measure required)
1Upon setting up the Trees tool in the GLOBE Observer app, users are required to (1) specify if they want to use
3. Quality AssuranceTraining
GLOBE requires training to ensure quality and consistency in data collection. GLOBE users
must complete the necessary training either by attending a GLOBE workshop or by completing
online eTraining modules and assessment tests to enter data via the GLOBE desktop data entry
forms or through the GLOBE data entry app. The user must complete three modules and take
the corresponding assessment tests as follows to become a trained GLOBE user via eTraining,:
● Introduction to GLOBE
● Introduction to a Sphere (Atmosphere, Biosphere, Hydrosphere, or Pedosphere)
● Protocol Module (from the same sphere as the introduction module)
The user can enter data for any of the GLOBE protocols after complete a workshop or the
required eTraining modules and assessments.
Best Practices Guides
In addition to training, written step-by-step instructions are given in the Teacher’s Guide for each
science protocol, providing rigorous guidance on best practices for making observations. The
science protocols are intended to be used as written, using instruments that meet certain
specifications in order to ensure data accuracy worldwide. A list of instruments, as well as
instrument suppliers, are available here: Scientific Instruments for Collecting GLOBE Data.
English or metric measurements and (2) enter their height. Data is only stored in metric.
GLOBE-19-001
Effective Date: July 10, 2019
Revision: v1.0
26
Completeness
A measurement must contain all required elements before it can be submitted and stored in the
GLOBE database.
Range and Logic Checks
Observations submitted to GLOBE must pass range and logic checks before the data are
allowed in the database. For example, future time cannot be entered and minimum values
cannot be greater than maximum values. Instant feedback is provided at the time of data entry
to indicate if the value(s) pass checks and likewise will be stored in the GLOBE database. For
example, the enforced maximum value for dark voltage in the aerosol protocol is 0.02. If a
GLOBE participant tries to enter 0.03, she/he will get an error message and not be allowed to
submit. The data entry form does not default to a value (e.g., 0.02) when an error message is
triggered; a valid value must be entered by the participant in order to submit. Documentation on
the range and logic checks is here.
Location Data
Location data has become more accurate over time. From 1995-2014, GLOBE members had
two options to enter the latitude and longitude coordinates associated with their measurement
site: (1) GPS or (2) other. Before 2014, teachers were encouraged at in-person GLOBE
trainings to use Garmin or GeoTrack GPS devices. The “other” category includes techniques
such as estimating latitude and longitude coordinates from a map. Not all techniques
categorized as “other” are known. GLOBE requested five decimal places for all reported latitude
and longitude coordinates to achieve high and consistent spatial accuracy. Four significant
digits after the decimal place implies 100-meter accuracy; five digits implies 5-meter accuracy.
After 2014, GPS is the standard for obtaining latitude and longitude coordinates.
In the GLOBE Observer app, a person’s location is automatically located on a map. The Land
Cover and Trees tools in the GLOBE Observer app have a button users can press to refresh
their automatic GPS location to potentially improve the location accuracy. If users judge that
their device places their location incorrectly as indicated by a red pin on the map, users have
the option to manually adjust their location on map. If using the GLOBE data entry app, the
measurement is associated with the user’s GLOBE site’s latitude and longitude.
Photo Approval
Photos submitted through the GLOBE Observer app are screened before being added to the
public GLOBE database. Photos containing inappropriate content, faces, or personally
identifiable information (e.g., automobile license plate numbers) are removed or blurred.
GLOBE-19-001
Effective Date: July 10, 2019
Revision: v1.0
27
Known Issues
Protocol Issue
All GLOBE Latency. On average, GLOBE measurements are submitted one month after being taken. Latency is decreasing with increased uptake of the GLOBE Observer app.
All GLOBE, 2013 and earlier
Timestamp. In 2012 and 2013, the GLOBE database migrated from an Oracle to a Postgres system. As a result, most all measurements in the database were assigned “created at” timestamps relevant to the date of migration versus the date of original measurement. In the GLOBE database, GLOBE measurements are each associated with three timestamps: “measured at” (aka “measured on” when temporal resolution is just to the day), “created at”, and “updated at”. The “measured” timestamps records when the measurement was observed and is the timestamp relevant for research. The “created” timestamp indicates when a record of the measurement was created in the GLOBE database and “updated” indicates when the measurement was last updated in the GLOBE database for various reasons. The “measured at” timestamp was not impacted by the Oracle-to-Postgres migration.
4. Applications and Terms of Use Terms of Use
GLOBE promotes full and open sharing of its data for educational and scientific purposes. Use
of data should be crediting to the GLOBE Program (see 1.1 Citation for GLOBE Data)
Any downloading and use of these data signifies a user's agreement to comprehension and
compliance of the NASA Earth Science Data & Information Policy.
Ensure all portions of metadata are read and clearly understood before using these data in
order to protect both user and NASA interests. GLOBE data users are strongly encouraged
to read and understand the science protocol(s) relevant to your data of interest (see
Methods and Materials).
Applications
Appropriate applications of GLOBE data may include, but are not limited to, community
engagement, STEM education, student research, citizen science investigations, and scientific
research in Earth, social, and biological and health sciences.
Browse the GLOBE Publications page to see previous applications of GLOBE data.
GLOBE-19-001
Effective Date: July 10, 2019
Revision: v1.0
28
NOTICE
If you publish a peer-reviewed article with GLOBE data, please credit the program and let us
know so we can advertise your work on the GLOBE Publications page. Send the citation for
your published article to [email protected].
5. Data Visualization GLOBE data can be viewed on a map in your web browser using the GLOBE Visualization
System. A tutorial on how to use the GLOBE Visualization System is already embedded in the
mapping tool and appears when users visit the site. This PowerPoint tutorial includes additional
instruction. A brief example of how to view data using the GLOBE Visualization System is
below.
Quick links
See cloud cover on a map.
See land cover photos on a map.
See mosquito habitats on a map.
See tree heights on a map.
Example: View 2017-2018 cloud cover data on a map with the GLOBE Visualization
System
GLOBE-19-001
Effective Date: July 10, 2019
Revision: v1.0
29
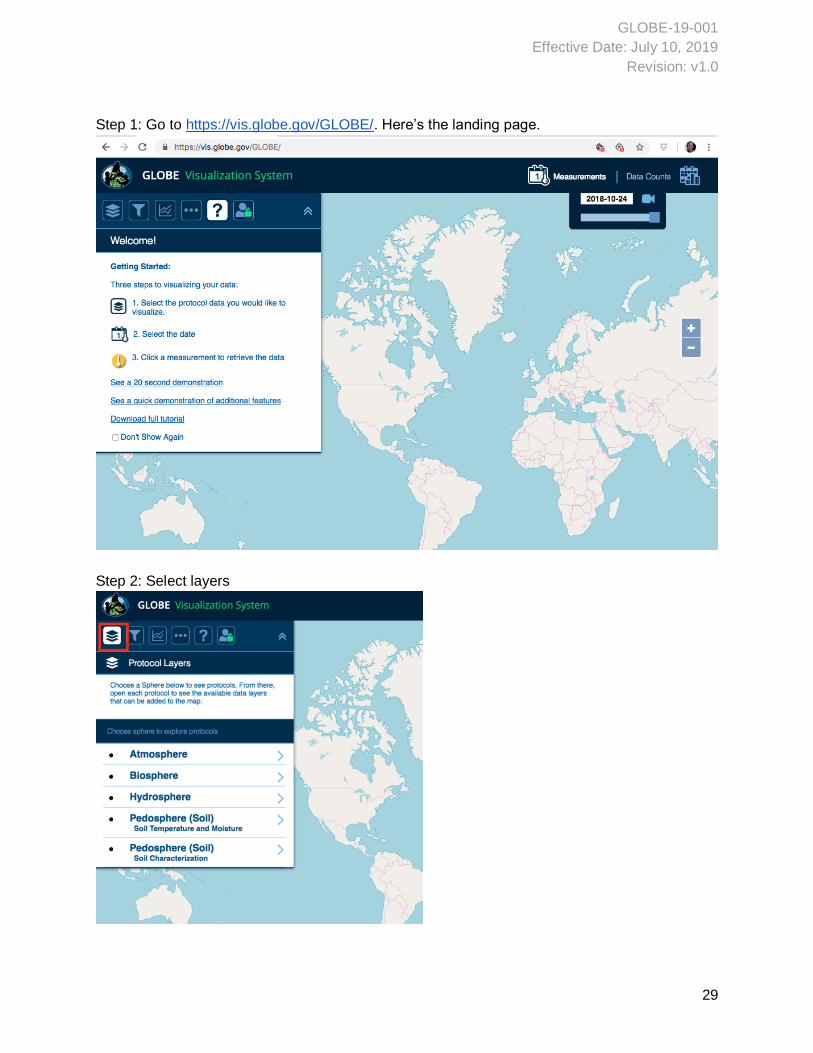
Step 1: Go to https://vis.globe.gov/GLOBE/. Here’s the landing page.
Step 2: Select layers
GLOBE-19-001
Effective Date: July 10, 2019
Revision: v1.0
30
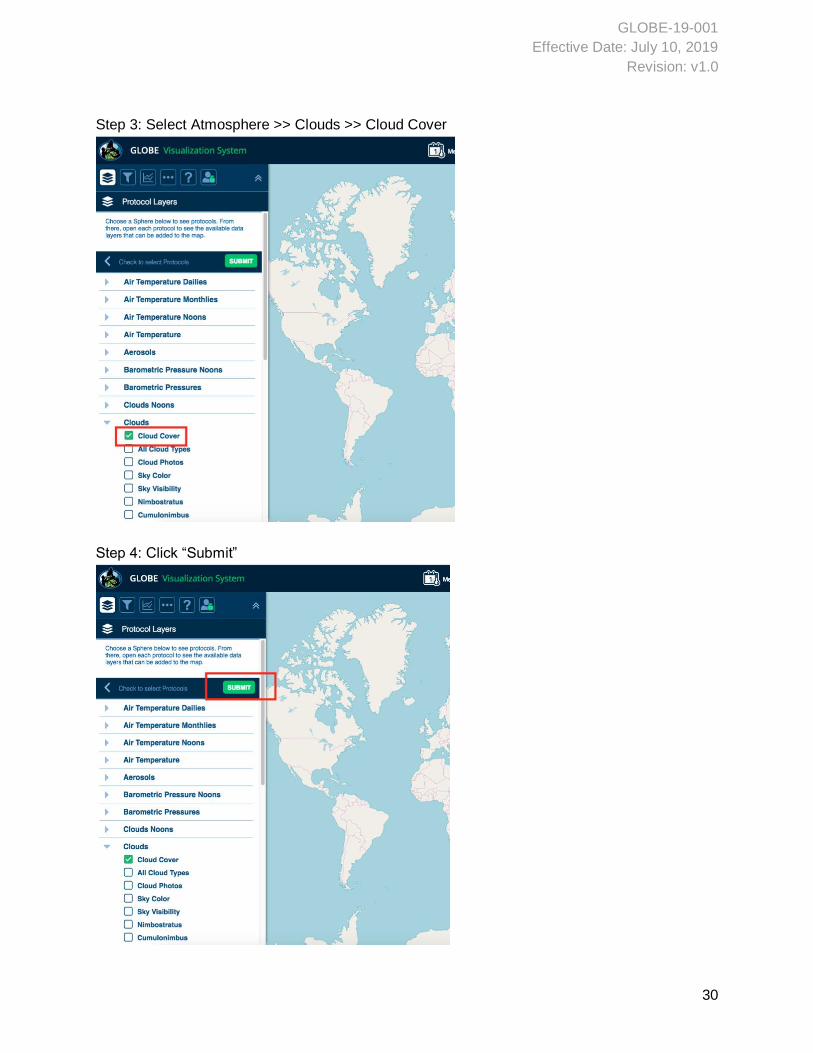
Step 3: Select Atmosphere >> Clouds >> Cloud Cover
Step 4: Click “Submit”
GLOBE-19-001
Effective Date: July 10, 2019
Revision: v1.0
31
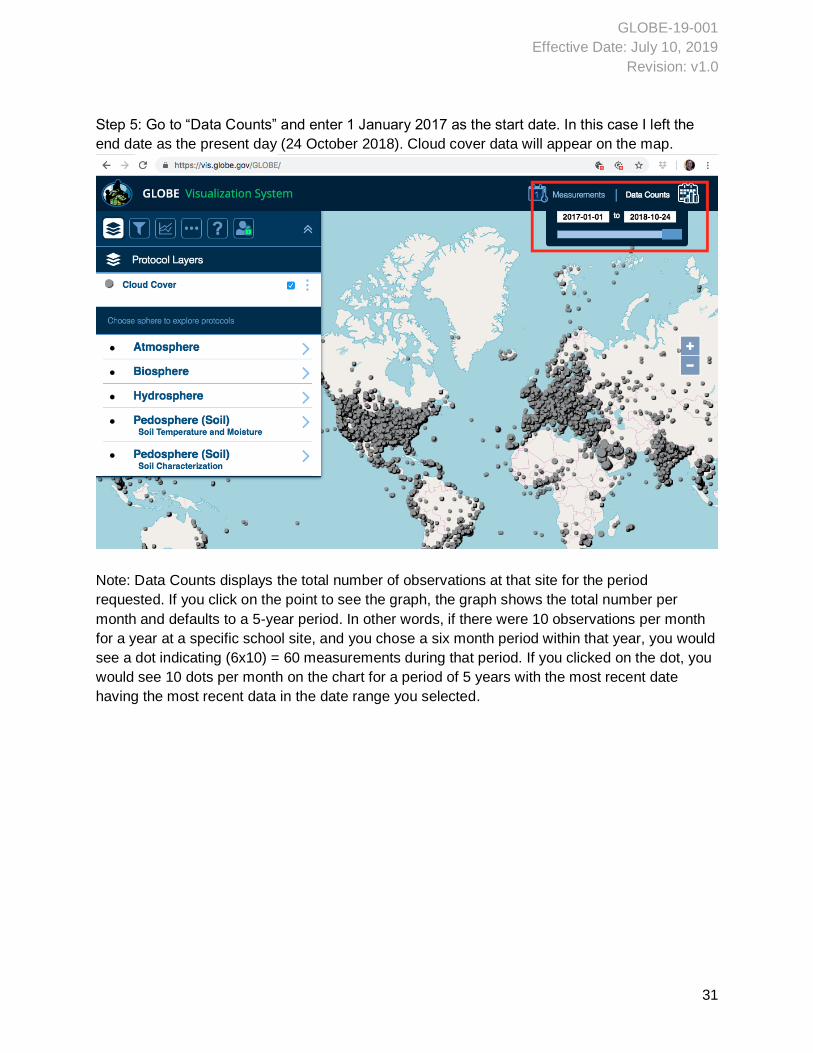
Step 5: Go to “Data Counts” and enter 1 January 2017 as the start date. In this case I left the
end date as the present day (24 October 2018). Cloud cover data will appear on the map.
Note: Data Counts displays the total number of observations at that site for the period
requested. If you click on the point to see the graph, the graph shows the total number per
month and defaults to a 5-year period. In other words, if there were 10 observations per month
for a year at a specific school site, and you chose a six month period within that year, you would
see a dot indicating (6x10) = 60 measurements during that period. If you clicked on the dot, you
would see 10 dots per month on the chart for a period of 5 years with the most recent date
having the most recent data in the date range you selected.
GLOBE-19-001
Effective Date: July 10, 2019
Revision: v1.0
32
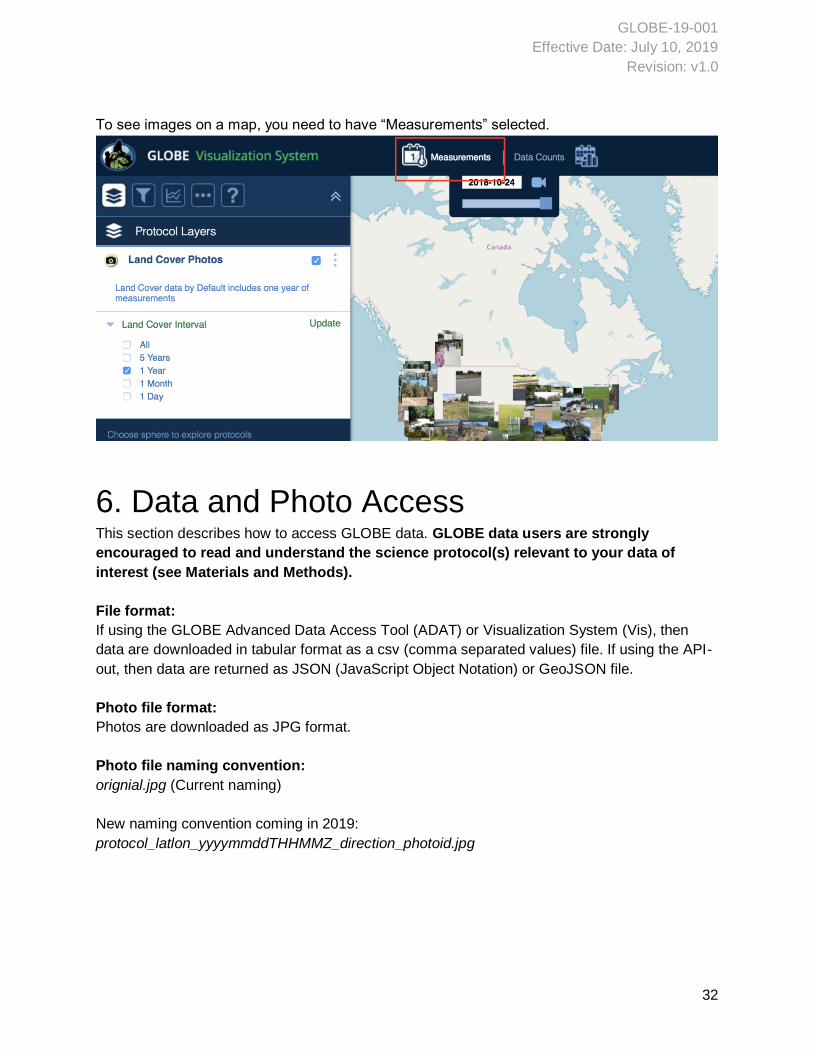
To see images on a map, you need to have “Measurements” selected.
6. Data and Photo Access This section describes how to access GLOBE data. GLOBE data users are strongly
encouraged to read and understand the science protocol(s) relevant to your data of
interest (see Materials and Methods).
File format:
If using the GLOBE Advanced Data Access Tool (ADAT) or Visualization System (Vis), then
data are downloaded in tabular format as a csv (comma separated values) file. If using the API-
out, then data are returned as JSON (JavaScript Object Notation) or GeoJSON file.
Photo file format:
Photos are downloaded as JPG format.
Photo file naming convention:
orignial.jpg (Current naming)
New naming convention coming in 2019:
protocol_latlon_yyyymmddTHHMMZ_direction_photoid.jpg
GLOBE-19-001
Effective Date: July 10, 2019
Revision: v1.0
33
Table 4. Elements of the photo file name
Attribute Description Options
protocol GLOBE protocol with which the photo is associated
CLD : clouds LC : land cover MHM : mosquito habitat mapper SDA : atmosphere site description SDB : biosphere site description SDH : hydrosphere site description SDS : soil site description TH : tree height
latlon Latitude and longitude of the site the measurement is associated with. Direction indicated by N (north), S (south), E (east), W (west). Latitude and longitude values are positive three-digit integers.
latitude range = [N090,S090] longitude range = [W180,E180]
yyyymmddTHHMMZ Date and time of measurement in Coordinated Universal Time (UTC). When the photo represents a site (i.e., SDA, SDB, SDH, SDS), this datetime represents when the photo was added to the site definition.
yyyy : four-digit year mm : two-digit month range = [01,12] dd : two-digit day range = [01,31] HH : two-digit hour range = [00,23] MM : two-digit minute range = [00,59]
direction Direction photo was taken. For Mosquito Habitat Mapper, photos are not taken in a specific direction. The direction attribute instead indicates if the photo is a water source or mosquito body part.
Direction: NORTH SOUTH EAST WEST UP DOWN For Mosquito Habitat Mapper, WS : watersource FB : fullybody AB : abdomen Multiple images are differentiated by a number. “1” is always left off the first photo. Example: FB; FB2
photoid Unique integer number assigned to each photo
GLOBE-19-001
Effective Date: July 10, 2019
Revision: v1.0
34
Examples: South-facing cloud photo from Maryland GLOBECLD_N038W076_20190110T1132Z_SOUTH_834887.jpg Downward land cover photo from Oregon GLOBELC_N044W123_20190110T1132Z_DOWN_917653.jpg Photos of the mosquito’s water source for their breeding habitat, and two photos of the abdominal segment of a mosquito larva from South Africa GLOBEMHM_S034E022_20190110T1132Z_WS_928202.jpg GLOBEMHM_S034E022_20190110T1132Z_AB_928203.jpg GLOBEMHM_S034E022_20190110T1132Z_AB2_928204.jpg
6.1 Accessing tabular data (includes photos) through ADAT Tabular data, including URL links to photos, can be accessed through either the GLOBE
Advanced Data Access Tool (ADAT) or the GLOBE Visualization System (Vis). The Vis system
is preferred for viewing data on a map and then optionally exporting data for a specific school,
or exporting the data on the map layer. In general, use Vis to answer a question like “where was
protocol x data submitted on this day”, or “in this time frame, which sites were the most active”
(data counts), or “Plot the last year’s worth of temperature data from this school”. ADAT is
preferred for exporting data across protocols, dates and optionally other filters. Use ADAT to
answer a question like “I need all the Aerosol and Temperature data recorded for this 3 year
period in the United States and Canada”, or “I need all barometric pressure measurements for
the last 15 years world wide”. Note ADAT returns data for a maximum of five protocols.
Simplified instructions for how to use the visualization system and ADAT are available when you
launch the tool. A more detailed tutorial is available on the GLOBE website. This PowerPoint
tutorial includes additional instruction.
For illustrative purposes, two examples are below of how to query GLOBE data using ADAT.
Example: Via ADAT, download GLOBE air temperature data from California for 2017-2018
GLOBE-19-001
Effective Date: July 10, 2019
Revision: v1.0
35
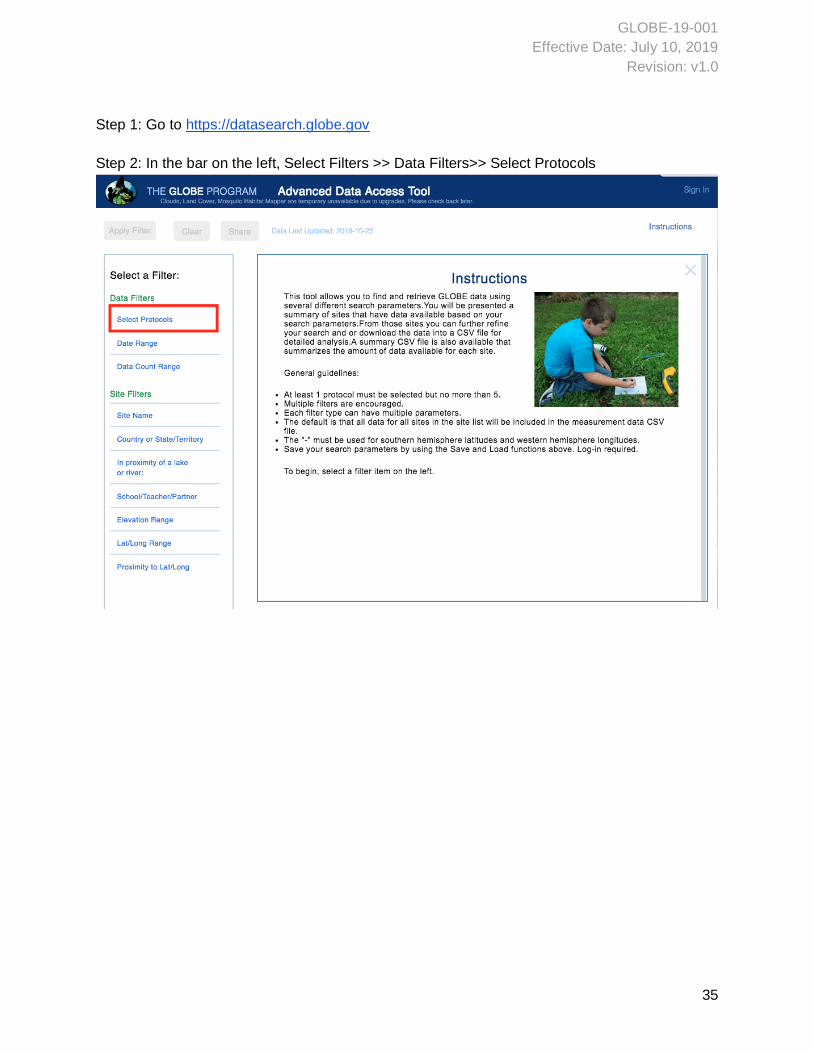
Step 1: Go to https://datasearch.globe.gov
Step 2: In the bar on the left, Select Filters >> Data Filters>> Select Protocols
GLOBE-19-001
Effective Date: July 10, 2019
Revision: v1.0
36
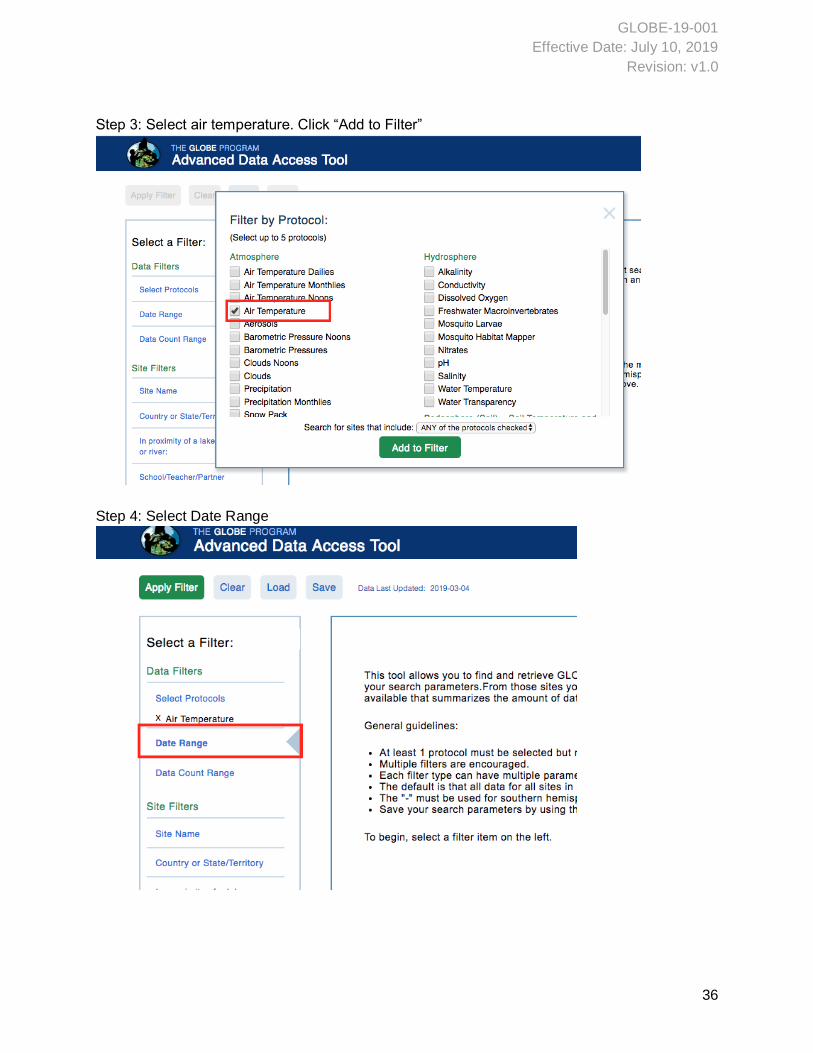
Step 3: Select air temperature. Click “Add to Filter”
Step 4: Select Date Range
GLOBE-19-001
Effective Date: July 10, 2019
Revision: v1.0
37
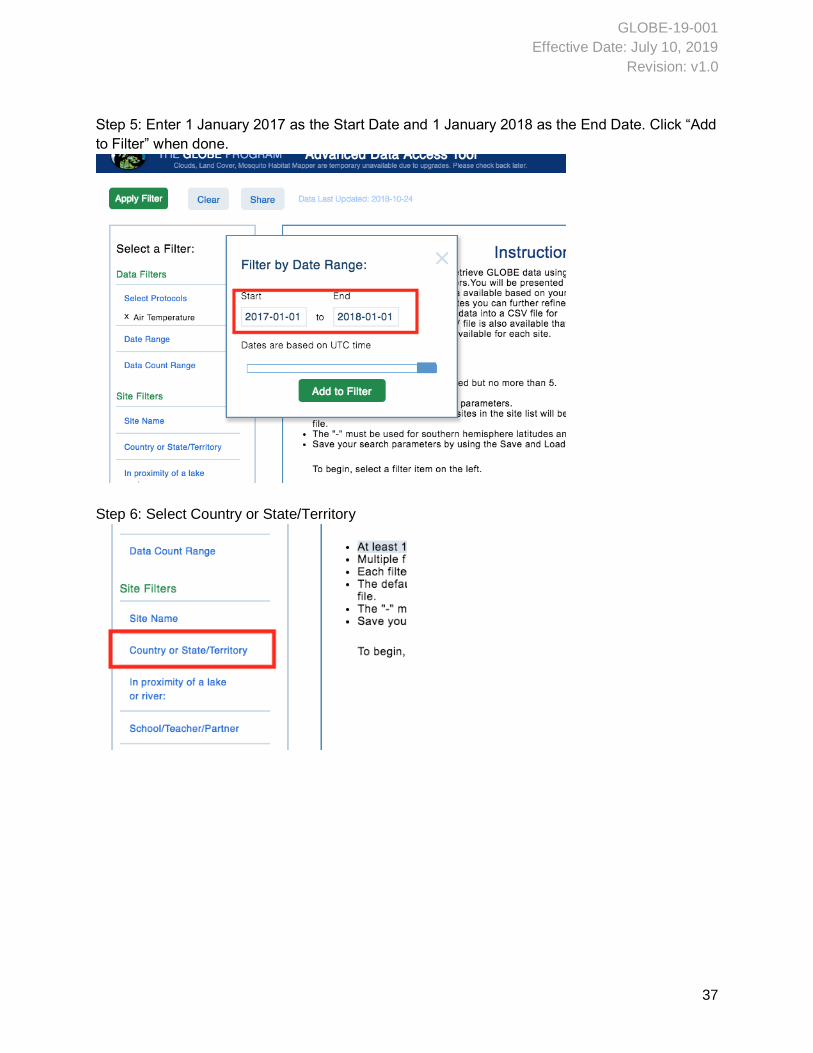
Step 5: Enter 1 January 2017 as the Start Date and 1 January 2018 as the End Date. Click “Add
to Filter” when done.
Step 6: Select Country or State/Territory
GLOBE-19-001
Effective Date: July 10, 2019
Revision: v1.0
38
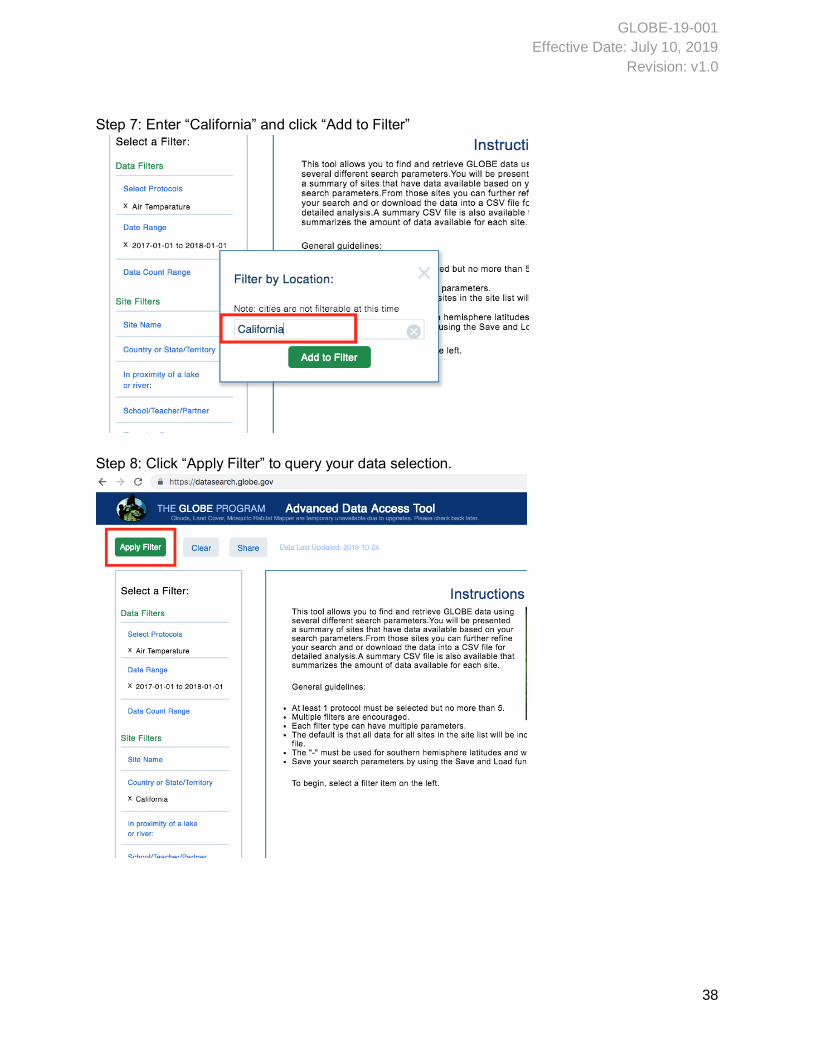
Step 7: Enter “California” and click “Add to Filter”
Step 8: Click “Apply Filter” to query your data selection.
GLOBE-19-001
Effective Date: July 10, 2019
Revision: v1.0
39
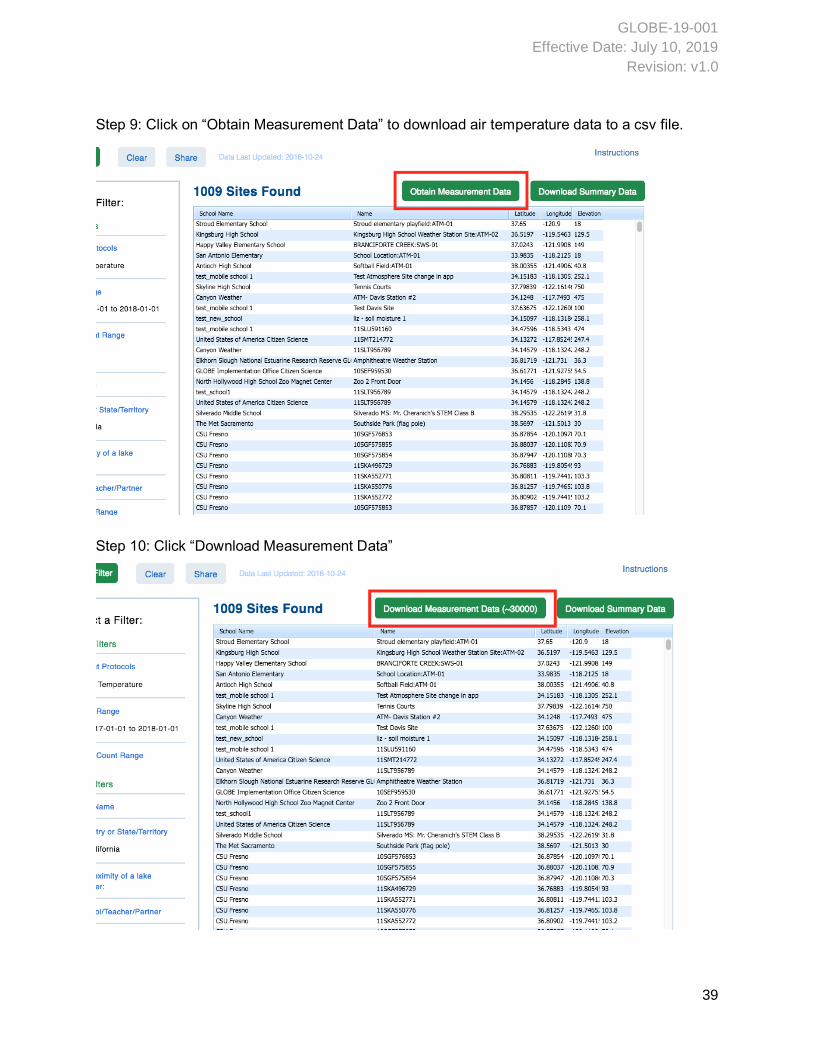
Step 9: Click on “Obtain Measurement Data” to download air temperature data to a csv file.
Step 10: Click “Download Measurement Data”
GLOBE-19-001
Effective Date: July 10, 2019
Revision: v1.0
40
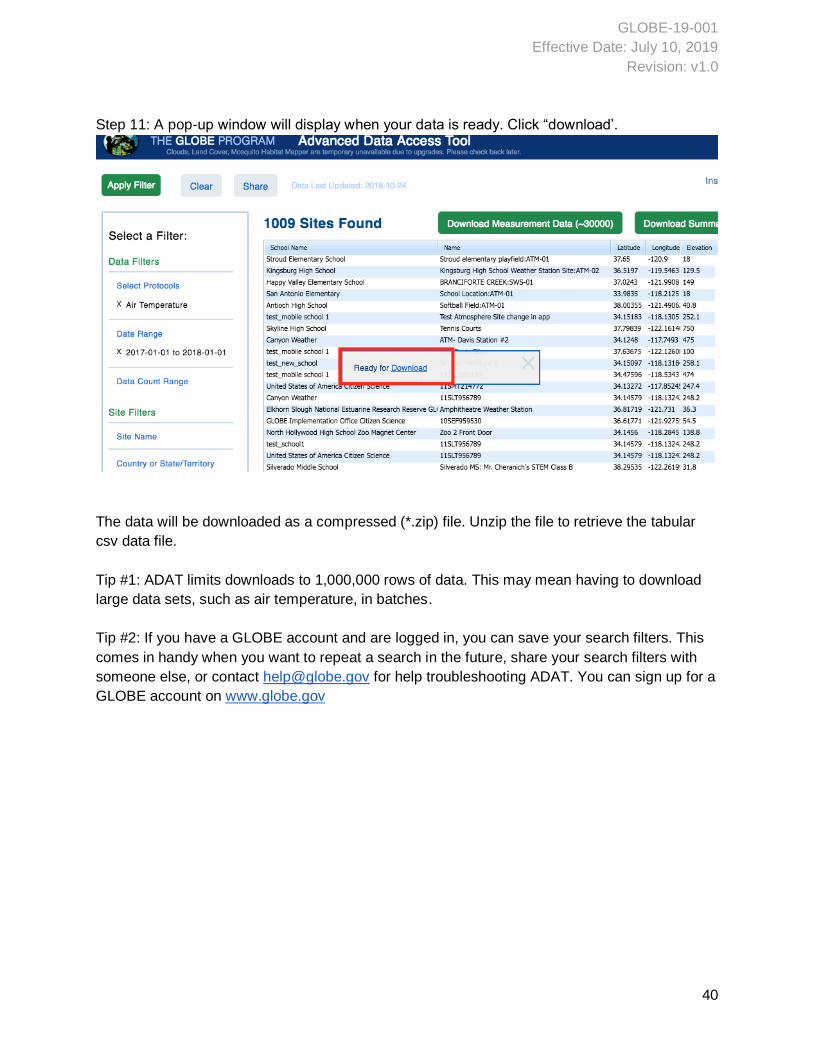
Step 11: A pop-up window will display when your data is ready. Click “download’.
The data will be downloaded as a compressed (*.zip) file. Unzip the file to retrieve the tabular
csv data file.
Tip #1: ADAT limits downloads to 1,000,000 rows of data. This may mean having to download
large data sets, such as air temperature, in batches.
Tip #2: If you have a GLOBE account and are logged in, you can save your search filters. This
comes in handy when you want to repeat a search in the future, share your search filters with
someone else, or contact [email protected] for help troubleshooting ADAT. You can sign up for a
GLOBE account on www.globe.gov
GLOBE-19-001
Effective Date: July 10, 2019
Revision: v1.0
41
GLOBE-19-001
Effective Date: July 10, 2019
Revision: v1.0
42
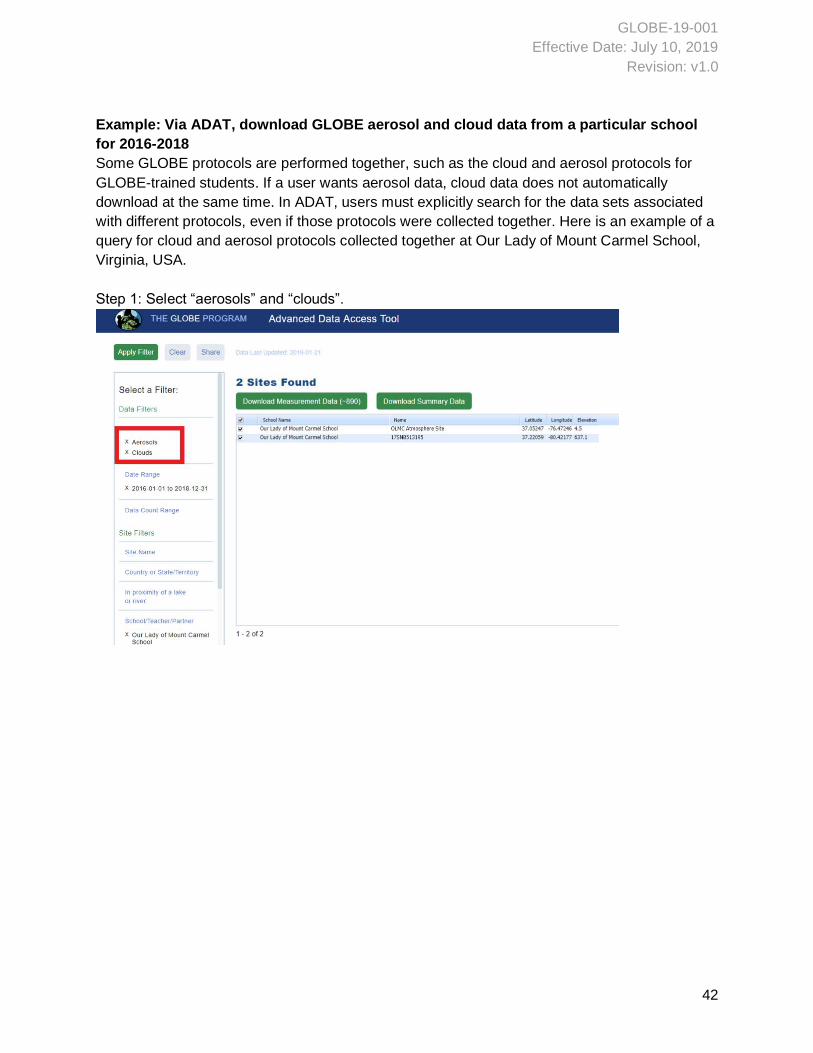
Example: Via ADAT, download GLOBE aerosol and cloud data from a particular school
for 2016-2018
Some GLOBE protocols are performed together, such as the cloud and aerosol protocols for
GLOBE-trained students. If a user wants aerosol data, cloud data does not automatically
download at the same time. In ADAT, users must explicitly search for the data sets associated
with different protocols, even if those protocols were collected together. Here is an example of a
query for cloud and aerosol protocols collected together at Our Lady of Mount Carmel School,
Virginia, USA.
Step 1: Select “aerosols” and “clouds”.
GLOBE-19-001
Effective Date: July 10, 2019
Revision: v1.0
43
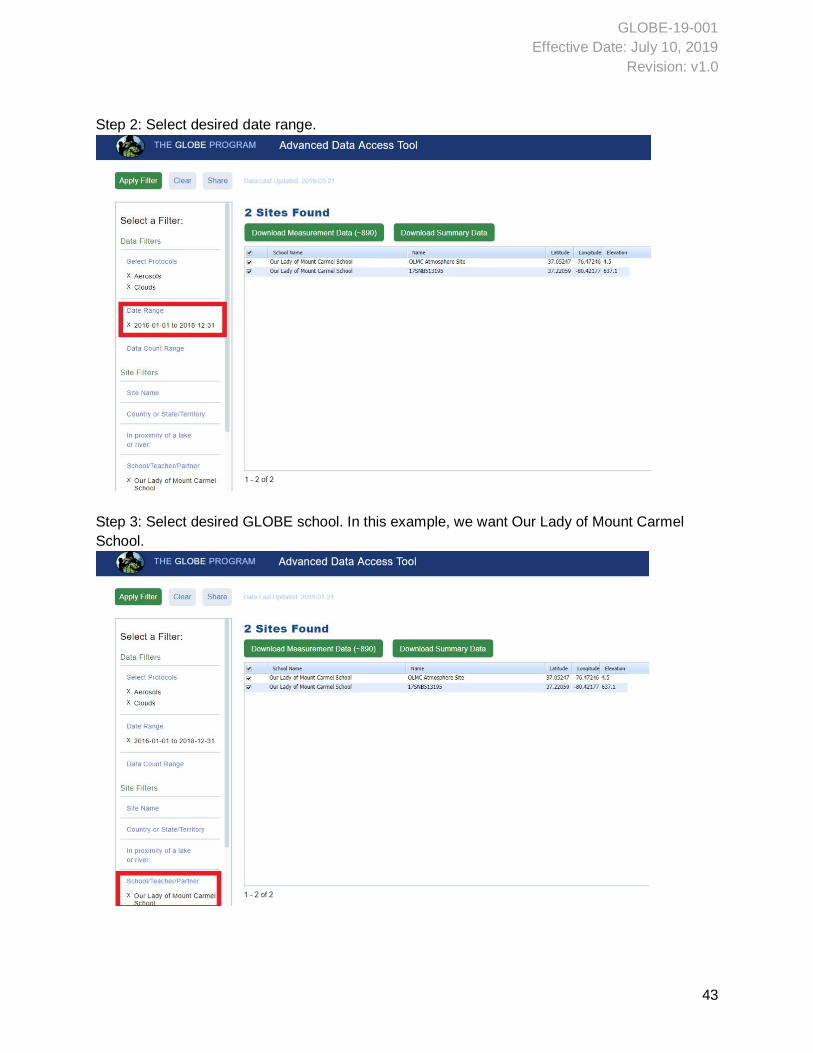
Step 2: Select desired date range.
Step 3: Select desired GLOBE school. In this example, we want Our Lady of Mount Carmel
School.
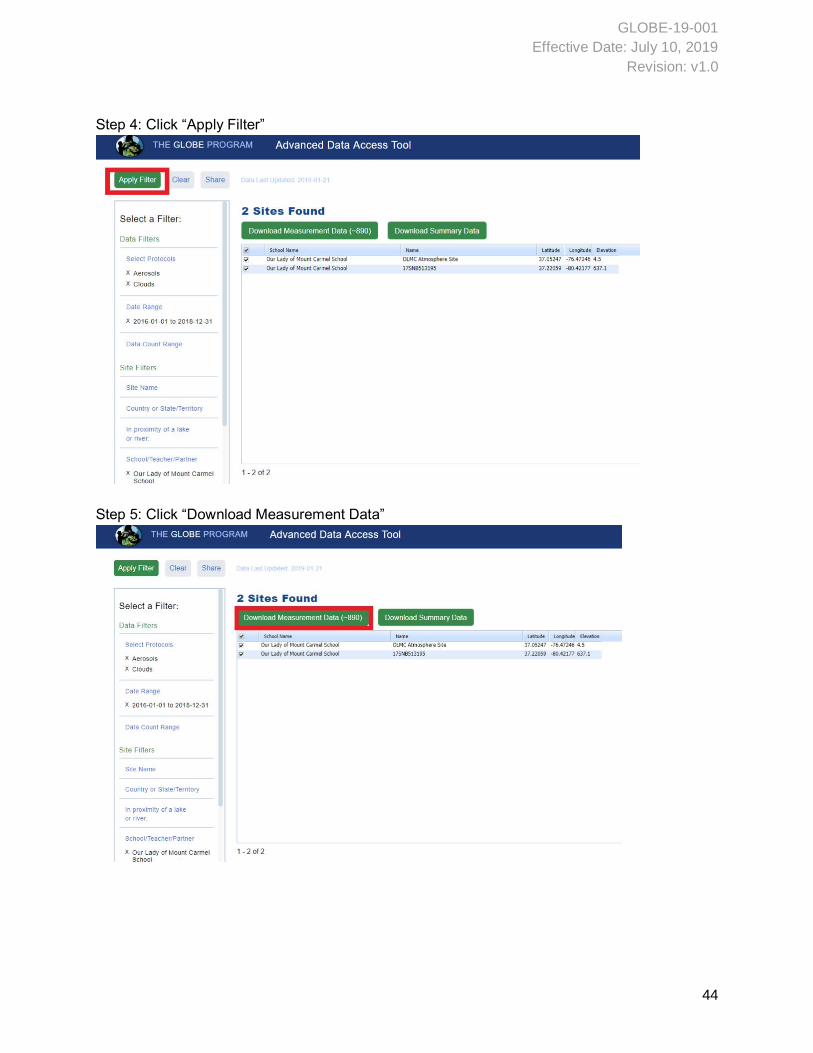
GLOBE-19-001
Effective Date: July 10, 2019
Revision: v1.0
44
Step 4: Click “Apply Filter”
Step 5: Click “Download Measurement Data”
GLOBE-19-001
Effective Date: July 10, 2019
Revision: v1.0
45
6.2 Accessing data through the API In 2019, GLOBE developed an API-out tool. The API-out expands the options available to end
users to query and retrieve GLOBE data. The API-out is provided in addition to GLOBE’s
existing methods for querying and retrieving data: ADAT and Vis. While ADAT and Vis are built
more for general audiences, programmers and developers are the intended end user of the API-
out tool. The API out uses the open-source Swagger UI for visually constructing and testing
database queries and uses Elasticsearch to perform database queries. The API-out overcomes
key limitations of ADAT and Vis by providing end users a way to retrieve large batches of
GLOBE data and automate data retrieval (e.g., write code to automatically retrieve new GLOBE
observations every day). The API-out tool also offers a significant speed-up in query time.
Appendix 1 lists the metadata returned through the API that is provided for each recorded
measurement.
6.3 Example Data Want to get started with GLOBE data? Here is an example dataset to explore:
North American Solar Eclipse, August 21, 2017. Data are available in csv and xlsx (Excel)
format.
Report Issues in the Data Users are encouraged to report errors or inconsistencies they discover in GLOBE data. Please
report issues to [email protected] and include the following information in your email:
● Your name
● Your organization
● Brief description of how you are using GLOBE data
● Date (approximate) issue was discovered
● Description of the issue
Acknowledgements GLOBE is sponsored by the U.S. National Aeronautics and Space Administration (NASA) with
support from the National Science Foundation (NSF), National Oceanic and Atmospheric
Administration (NOAA) and Department of State.
GLOBE-19-001
Effective Date: July 10, 2019
Revision: v1.0
46
References Larsen Becker, M., R. G. Congalton, R. Budd, A. Fried, 1998: A GLOBE Collaboration to
Develop Land Cover Data Collection and Analysis Protocols. J Sci Edu & Technol, 7(1), 85-96,
https://doi.org/10.1175/BAMS-D-15-00248.1
Chambers, L.H., M.A. McKeown, S.A. McCrea, A.M. Martin, T.M. Rogerson, and K.M. Bedka,
2017: CERES S’COOL Project Update: The Evolution and Value of a Long-Running Education
Project with a Foundation in NASA Earth Science Missions. Bull. Amer. Meteor. Soc., 98, 473–
483, doi: 10.1175/BAMS-D-15-00248.1.
Dodson, J. B., M. Colón Robles, J. E. Taylor, C. C. DeFontes, and K. L. Weaver, 2019: Eclipse
Across America: Citizen Science Observations of the 21 August 2017 Total Solar Eclipse.
Submitted to J. Appl. Meteor. Climatol., in review.
GLOBE-19-001
Effective Date: July 10, 2019
Revision: v1.0
47
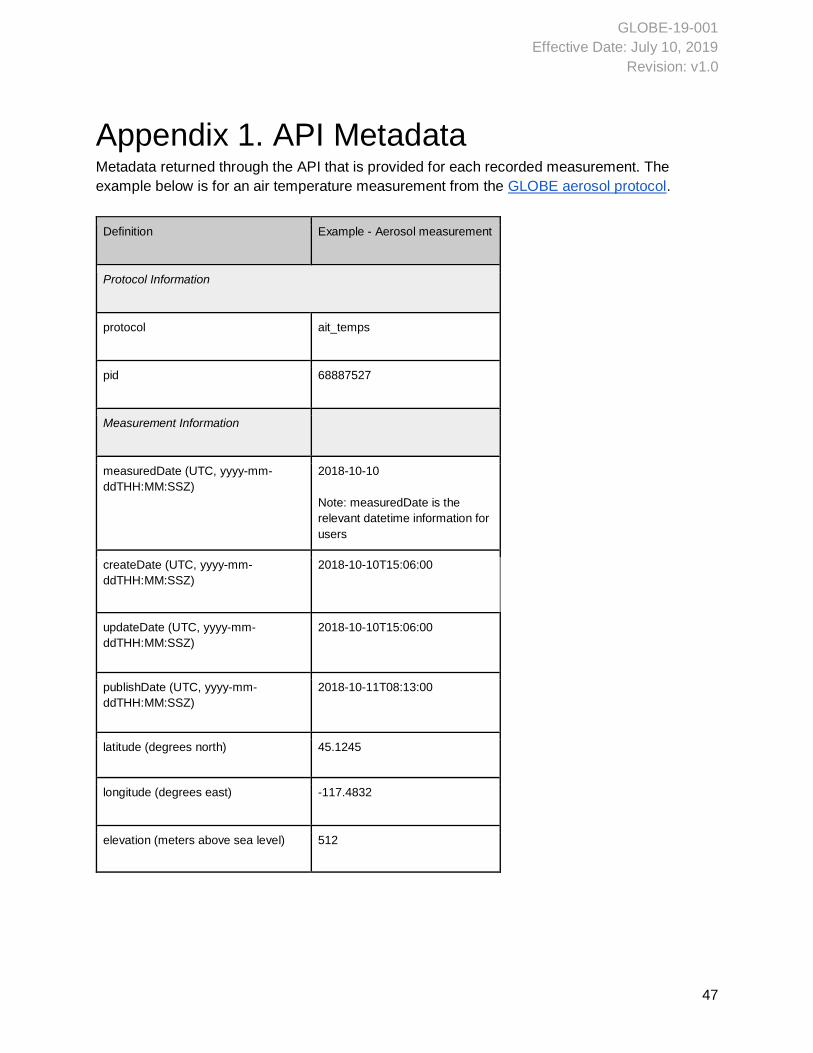
Appendix 1. API Metadata Metadata returned through the API that is provided for each recorded measurement. The
example below is for an air temperature measurement from the GLOBE aerosol protocol.
Definition Example - Aerosol measurement
Protocol Information
protocol ait_temps
pid 68887527
Measurement Information
measuredDate (UTC, yyyy-mm-
ddTHH:MM:SSZ)
2018-10-10
Note: measuredDate is the
relevant datetime information for
users
createDate (UTC, yyyy-mm-
ddTHH:MM:SSZ)
2018-10-10T15:06:00
updateDate (UTC, yyyy-mm-
ddTHH:MM:SSZ)
2018-10-10T15:06:00
publishDate (UTC, yyyy-mm-
ddTHH:MM:SSZ)
2018-10-11T08:13:00
latitude (degrees north) 45.1245
longitude (degrees east) -117.4832
elevation (meters above sea level) 512
GLOBE-19-001
Effective Date: July 10, 2019
Revision: v1.0
48
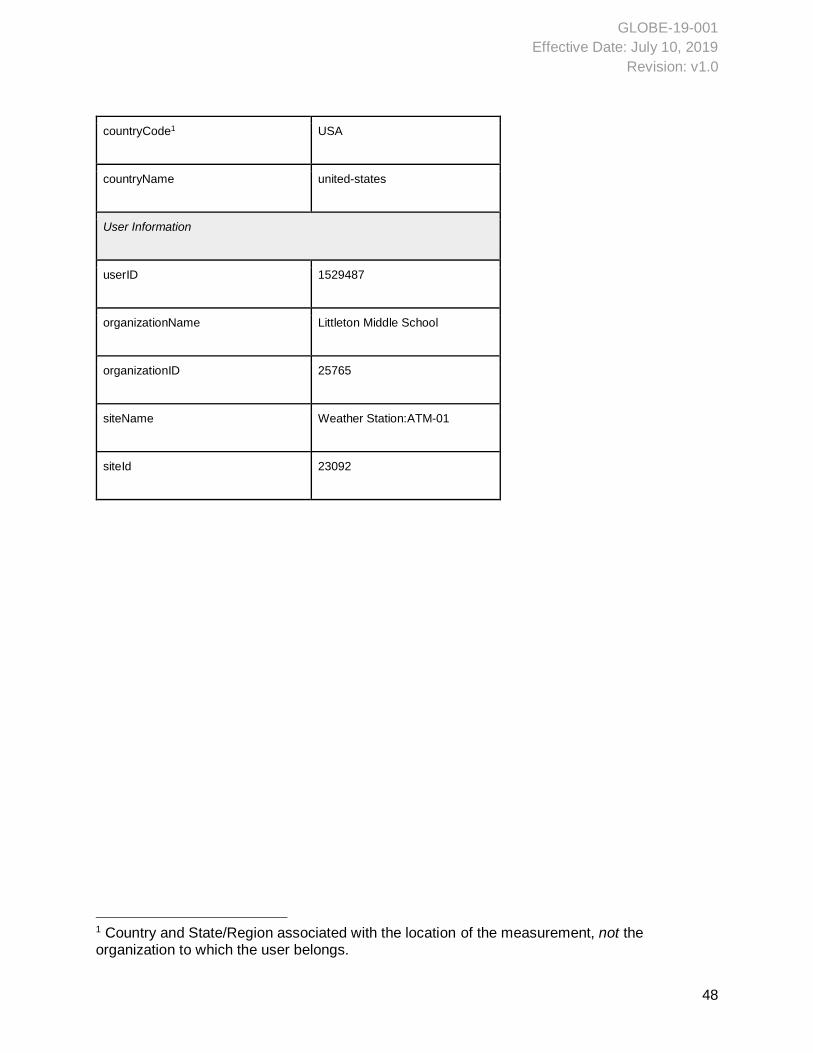
countryCode1 USA
countryName united-states
User Information
userID 1529487
organizationName Littleton Middle School
organizationID 25765
siteName Weather Station:ATM-01
siteId 23092
1 Country and State/Region associated with the location of the measurement, not the organization to which the user belongs.
GLOBE-19-001
Effective Date: July 10, 2019
Revision: v1.0
49
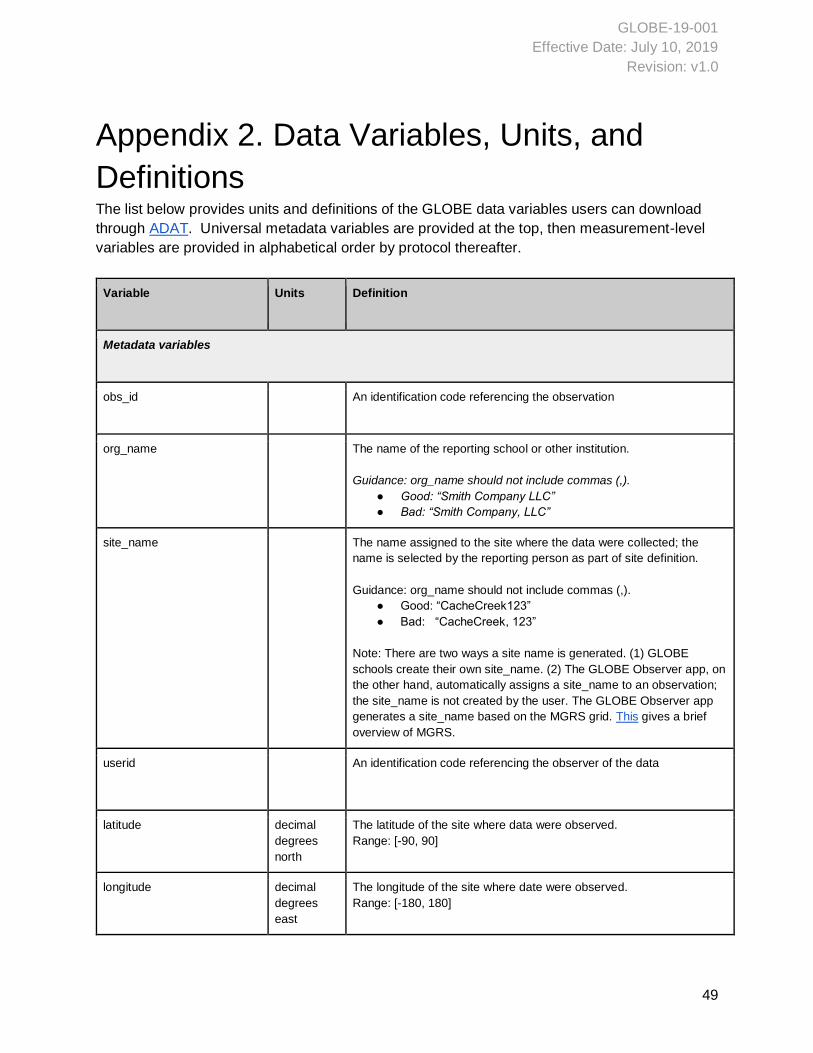
Appendix 2. Data Variables, Units, and
Definitions The list below provides units and definitions of the GLOBE data variables users can download
through ADAT. Universal metadata variables are provided at the top, then measurement-level
variables are provided in alphabetical order by protocol thereafter.
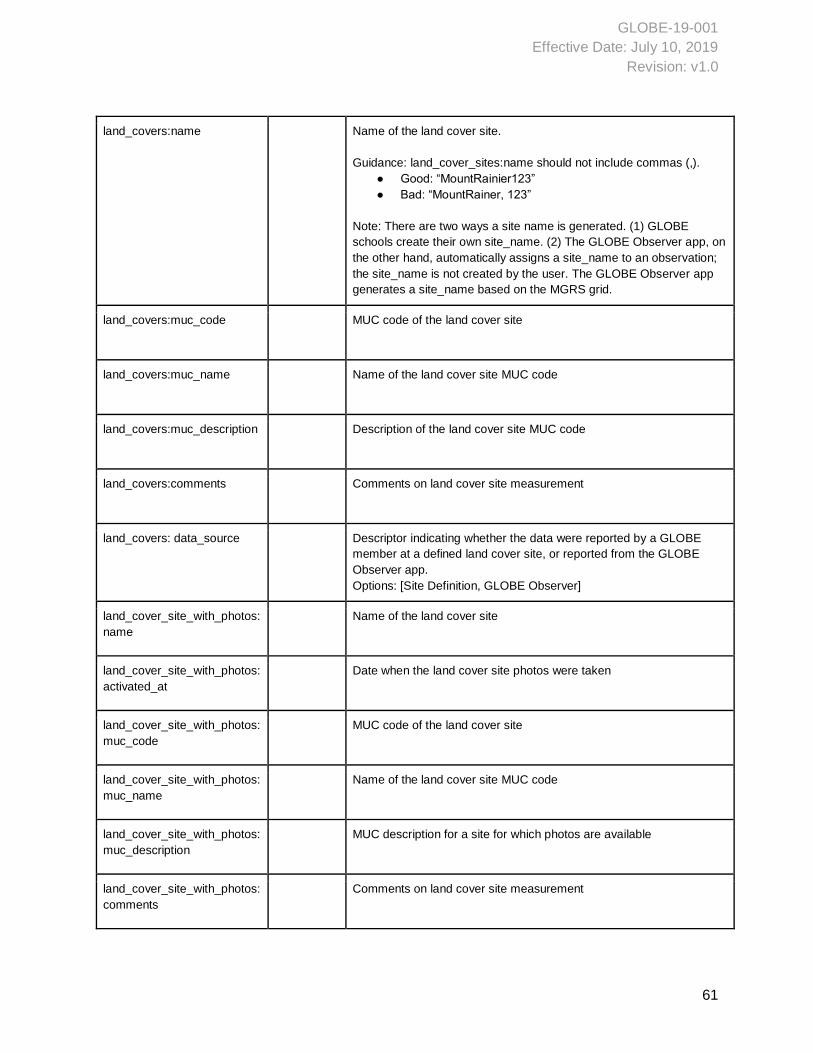
Variable Units Definition
Metadata variables
obs_id An identification code referencing the observation
org_name The name of the reporting school or other institution.
Guidance: org_name should not include commas (,).
● Good: “Smith Company LLC”
● Bad: “Smith Company, LLC”
site_name The name assigned to the site where the data were collected; the
name is selected by the reporting person as part of site definition.
Guidance: org_name should not include commas (,).
● Good: “CacheCreek123”
● Bad: “CacheCreek, 123”
Note: There are two ways a site name is generated. (1) GLOBE
schools create their own site_name. (2) The GLOBE Observer app, on
the other hand, automatically assigns a site_name to an observation;
the site_name is not created by the user. The GLOBE Observer app
generates a site_name based on the MGRS grid. This gives a brief
overview of MGRS.
userid
An identification code referencing the observer of the data
latitude decimal
degrees
north
The latitude of the site where data were observed.
Range: [-90, 90]
longitude decimal
degrees
east
The longitude of the site where date were observed.
Range: [-180, 180]
GLOBE-19-001
Effective Date: July 10, 2019
Revision: v1.0
50
elevation meters
above sea
level
The elevation of the site where data were observed
measured_on dd/mm/yyyy The date only of when the data were observed in UTC
measured_at yyyy-mm-
ddTHH:MM
The date and time when the data were observed in UTC
solar measured at: yyyy-mm-
ddTHH:MM
The date and time when the data were observed in solar time which is
the apparent local time based on the position of the sun at the site
solar noon at: yyyy-mm-
ddTHH:MM
Date and time in UTC when local solar noon occurs at the
measurement site
Measurement-level data variables
aerosols:sensor_wavelength
_nm
nanometers
(nm)
Wavelengths the sun photometer is using to make measurements
Note: All wavelengths appear in a single column and it is dependent
on the instrument. All measurements are associated with the minute
the observers began their observation.
aerosols:aerosol_optical_thic
kness
unitless Aerosol optical thickness per wavelength for each time stamp
Note: This page explains how aerosol optical thickness (AOT) is
computed by the GLOBE database based on the wavelength-specific
voltage reported by the observer.
aerosols:transmission_perce
nt
percent (%) Percentage of sunlight at the wavelength reaching the ground
aerosols:comments Comments on the aerosols measurement
Note: Before May 2016, serial numbers were not recorded. Some
observers recorded serial numbers in the comments.
aerosols:observed_sky_color Sky color
Options: [
deep blue,
blue,
light blue,
pale blue,
milky]
GLOBE-19-001
Effective Date: July 10, 2019
Revision: v1.0
51
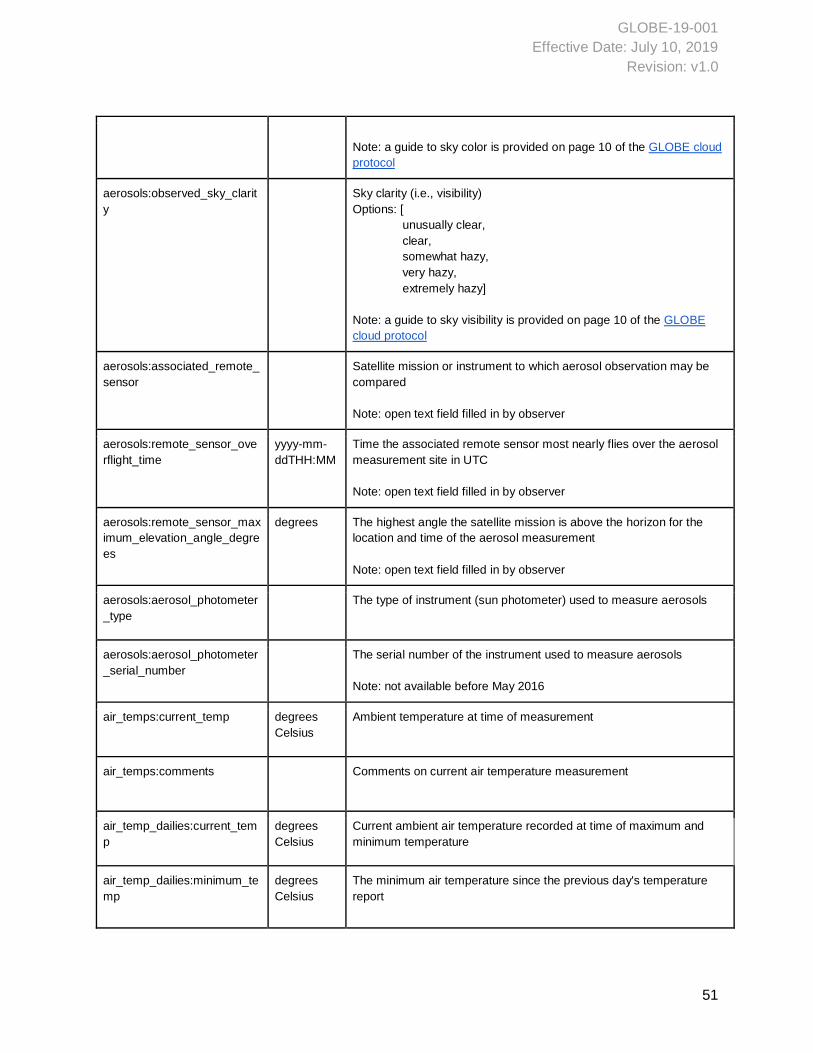
Note: a guide to sky color is provided on page 10 of the GLOBE cloud
protocol
aerosols:observed_sky_clarit
y
Sky clarity (i.e., visibility)
Options: [
unusually clear,
clear,
somewhat hazy,
very hazy,
extremely hazy]
Note: a guide to sky visibility is provided on page 10 of the GLOBE
cloud protocol
aerosols:associated_remote_
sensor
Satellite mission or instrument to which aerosol observation may be
compared
Note: open text field filled in by observer
aerosols:remote_sensor_ove
rflight_time
yyyy-mm-
ddTHH:MM
Time the associated remote sensor most nearly flies over the aerosol
measurement site in UTC
Note: open text field filled in by observer
aerosols:remote_sensor_max
imum_elevation_angle_degre
es
degrees The highest angle the satellite mission is above the horizon for the
location and time of the aerosol measurement
Note: open text field filled in by observer
aerosols:aerosol_photometer
_type
The type of instrument (sun photometer) used to measure aerosols
aerosols:aerosol_photometer
_serial_number
The serial number of the instrument used to measure aerosols
Note: not available before May 2016
air_temps:current_temp degrees
Celsius
Ambient temperature at time of measurement
air_temps:comments Comments on current air temperature measurement
air_temp_dailies:current_tem
p
degrees
Celsius
Current ambient air temperature recorded at time of maximum and
minimum temperature
air_temp_dailies:minimum_te
mp
degrees
Celsius
The minimum air temperature since the previous day's temperature
report
GLOBE-19-001
Effective Date: July 10, 2019
Revision: v1.0
52
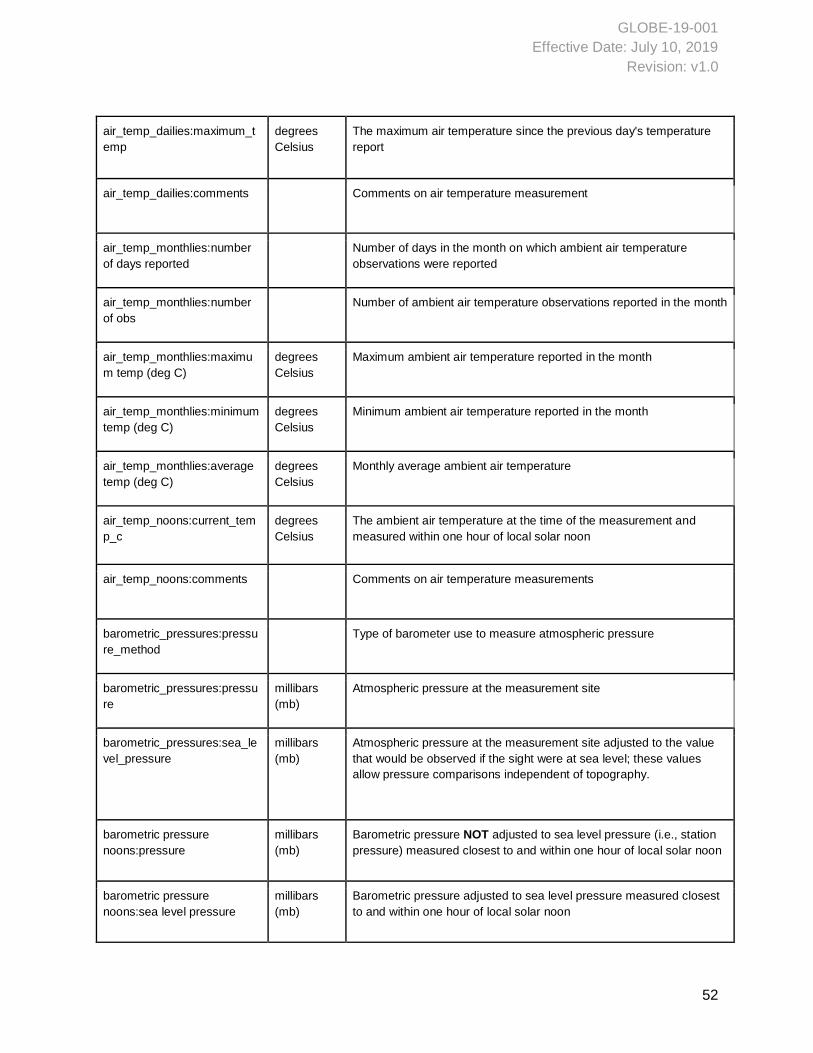
air_temp_dailies:maximum_t
emp
degrees
Celsius
The maximum air temperature since the previous day's temperature
report
air_temp_dailies:comments Comments on air temperature measurement
air_temp_monthlies:number
of days reported
Number of days in the month on which ambient air temperature
observations were reported
air_temp_monthlies:number
of obs
Number of ambient air temperature observations reported in the month
air_temp_monthlies:maximu
m temp (deg C)
degrees
Celsius
Maximum ambient air temperature reported in the month
air_temp_monthlies:minimum
temp (deg C)
degrees
Celsius
Minimum ambient air temperature reported in the month
air_temp_monthlies:average
temp (deg C)
degrees
Celsius
Monthly average ambient air temperature
air_temp_noons:current_tem
p_c
degrees
Celsius
The ambient air temperature at the time of the measurement and
measured within one hour of local solar noon
air_temp_noons:comments Comments on air temperature measurements
barometric_pressures:pressu
re_method
Type of barometer use to measure atmospheric pressure
barometric_pressures:pressu
re
millibars
(mb)
Atmospheric pressure at the measurement site
barometric_pressures:sea_le
vel_pressure
millibars
(mb)
Atmospheric pressure at the measurement site adjusted to the value
that would be observed if the sight were at sea level; these values
allow pressure comparisons independent of topography.
barometric pressure
noons:pressure
millibars
(mb)
Barometric pressure NOT adjusted to sea level pressure (i.e., station
pressure) measured closest to and within one hour of local solar noon
barometric pressure
noons:sea level pressure
millibars
(mb)
Barometric pressure adjusted to sea level pressure measured closest
to and within one hour of local solar noon
GLOBE-19-001
Effective Date: July 10, 2019
Revision: v1.0
53
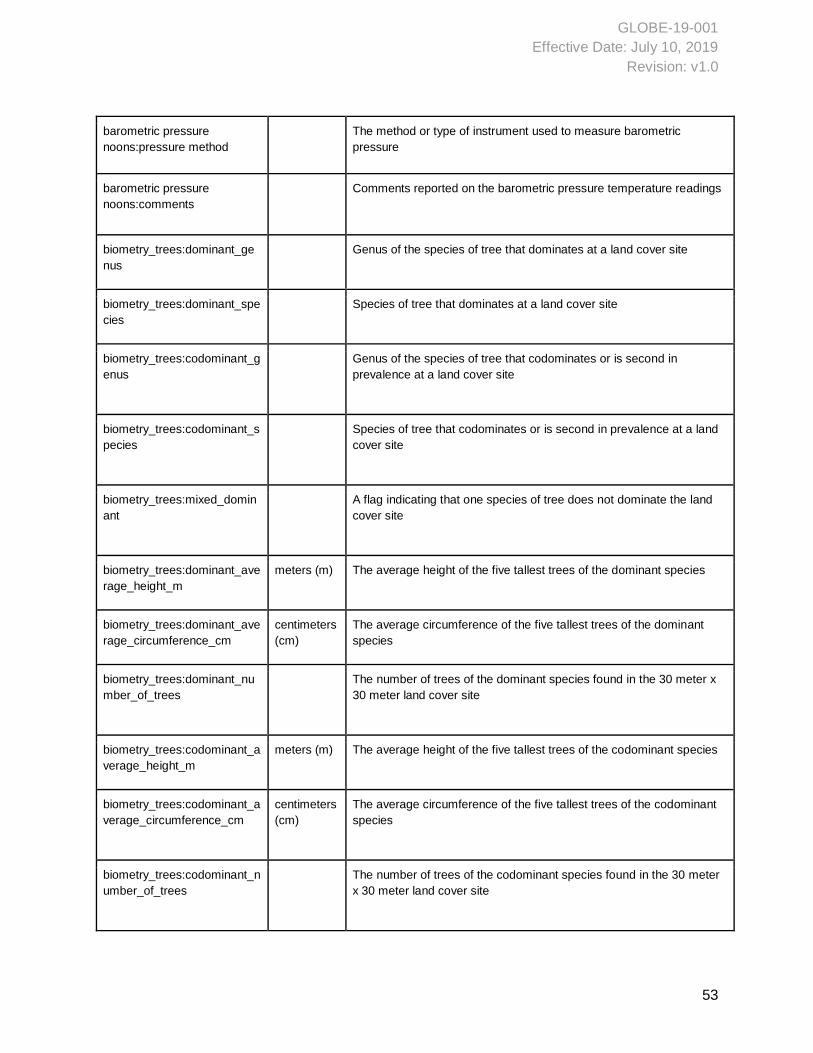
barometric pressure
noons:pressure method
The method or type of instrument used to measure barometric
pressure
barometric pressure
noons:comments
Comments reported on the barometric pressure temperature readings
biometry_trees:dominant_ge
nus
Genus of the species of tree that dominates at a land cover site
biometry_trees:dominant_spe
cies
Species of tree that dominates at a land cover site
biometry_trees:codominant_g
enus
Genus of the species of tree that codominates or is second in
prevalence at a land cover site
biometry_trees:codominant_s
pecies
Species of tree that codominates or is second in prevalence at a land
cover site
biometry_trees:mixed_domin
ant
A flag indicating that one species of tree does not dominate the land
cover site
biometry_trees:dominant_ave
rage_height_m
meters (m) The average height of the five tallest trees of the dominant species
biometry_trees:dominant_ave
rage_circumference_cm
centimeters
(cm)
The average circumference of the five tallest trees of the dominant
species
biometry_trees:dominant_nu
mber_of_trees
The number of trees of the dominant species found in the 30 meter x
30 meter land cover site
biometry_trees:codominant_a
verage_height_m
meters (m) The average height of the five tallest trees of the codominant species
biometry_trees:codominant_a
verage_circumference_cm
centimeters
(cm)
The average circumference of the five tallest trees of the codominant
species
biometry_trees:codominant_n
umber_of_trees
The number of trees of the codominant species found in the 30 meter
x 30 meter land cover site
GLOBE-19-001
Effective Date: July 10, 2019
Revision: v1.0
54
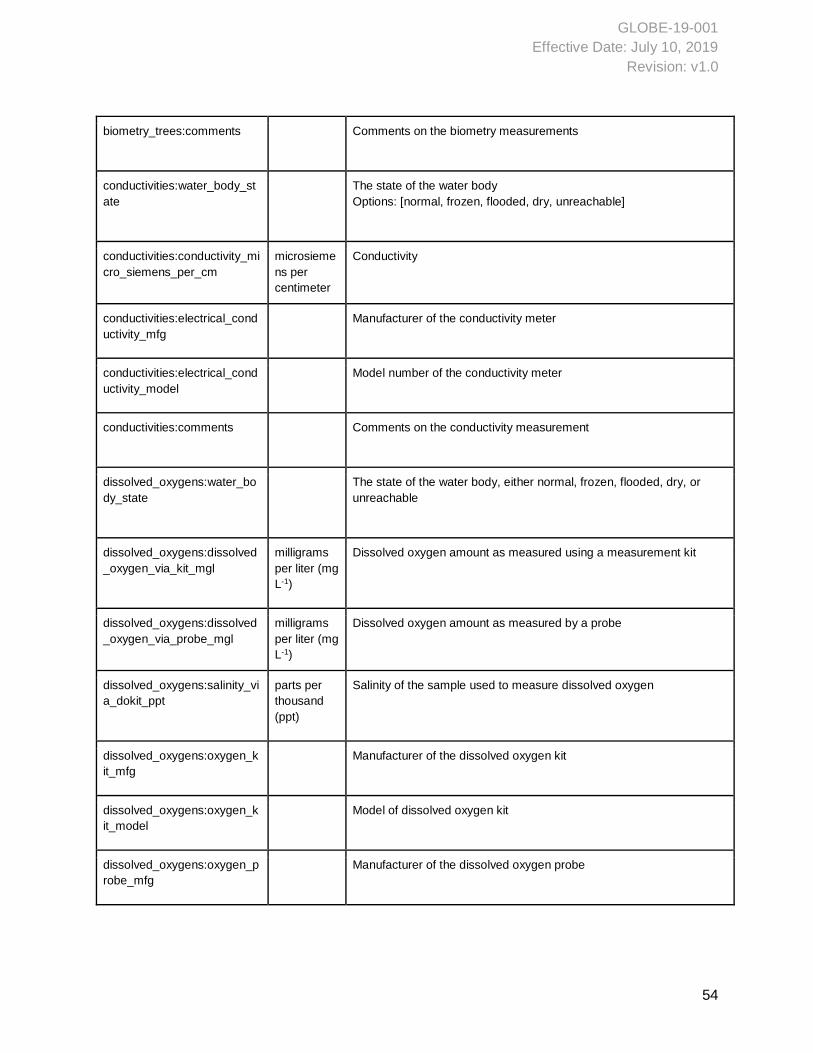
biometry_trees:comments Comments on the biometry measurements
conductivities:water_body_st
ate
The state of the water body
Options: [normal, frozen, flooded, dry, unreachable]
conductivities:conductivity_mi
cro_siemens_per_cm
microsieme
ns per
centimeter
Conductivity
conductivities:electrical_cond
uctivity_mfg
Manufacturer of the conductivity meter
conductivities:electrical_cond
uctivity_model
Model number of the conductivity meter
conductivities:comments Comments on the conductivity measurement
dissolved_oxygens:water_bo
dy_state
The state of the water body, either normal, frozen, flooded, dry, or
unreachable
dissolved_oxygens:dissolved
_oxygen_via_kit_mgl
milligrams
per liter (mg
L-1)
Dissolved oxygen amount as measured using a measurement kit
dissolved_oxygens:dissolved
_oxygen_via_probe_mgl
milligrams
per liter (mg
L-1)
Dissolved oxygen amount as measured by a probe
dissolved_oxygens:salinity_vi
a_dokit_ppt
parts per
thousand
(ppt)
Salinity of the sample used to measure dissolved oxygen
dissolved_oxygens:oxygen_k
it_mfg
Manufacturer of the dissolved oxygen kit
dissolved_oxygens:oxygen_k
it_model
Model of dissolved oxygen kit
dissolved_oxygens:oxygen_p
robe_mfg
Manufacturer of the dissolved oxygen probe
GLOBE-19-001
Effective Date: July 10, 2019
Revision: v1.0
55
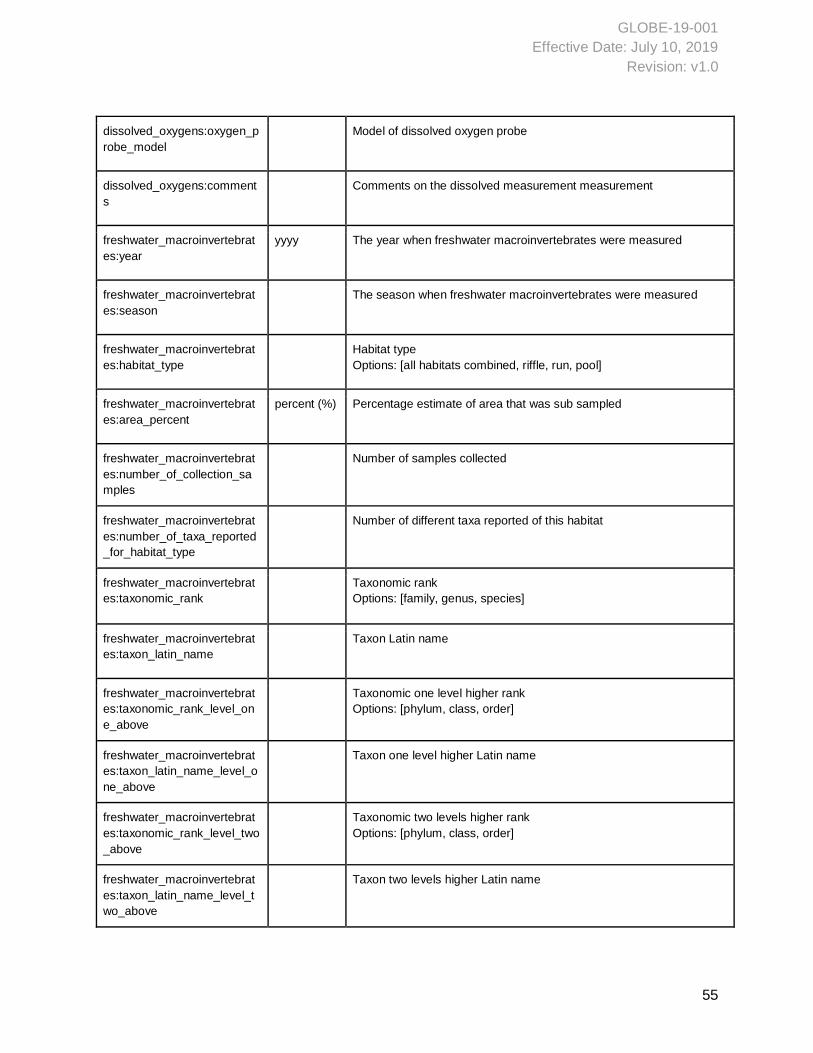
dissolved_oxygens:oxygen_p
robe_model
Model of dissolved oxygen probe
dissolved_oxygens:comment
s
Comments on the dissolved measurement measurement
freshwater_macroinvertebrat
es:year
yyyy The year when freshwater macroinvertebrates were measured
freshwater_macroinvertebrat
es:season
The season when freshwater macroinvertebrates were measured
freshwater_macroinvertebrat
es:habitat_type
Habitat type
Options: [all habitats combined, riffle, run, pool]
freshwater_macroinvertebrat
es:area_percent
percent (%) Percentage estimate of area that was sub sampled
freshwater_macroinvertebrat
es:number_of_collection_sa
mples
Number of samples collected
freshwater_macroinvertebrat
es:number_of_taxa_reported
_for_habitat_type
Number of different taxa reported of this habitat
freshwater_macroinvertebrat
es:taxonomic_rank
Taxonomic rank
Options: [family, genus, species]
freshwater_macroinvertebrat
es:taxon_latin_name
Taxon Latin name
freshwater_macroinvertebrat
es:taxonomic_rank_level_on
e_above
Taxonomic one level higher rank
Options: [phylum, class, order]
freshwater_macroinvertebrat
es:taxon_latin_name_level_o
ne_above
Taxon one level higher Latin name
freshwater_macroinvertebrat
es:taxonomic_rank_level_two
_above
Taxonomic two levels higher rank
Options: [phylum, class, order]
freshwater_macroinvertebrat
es:taxon_latin_name_level_t
wo_above
Taxon two levels higher Latin name
GLOBE-19-001
Effective Date: July 10, 2019
Revision: v1.0
56
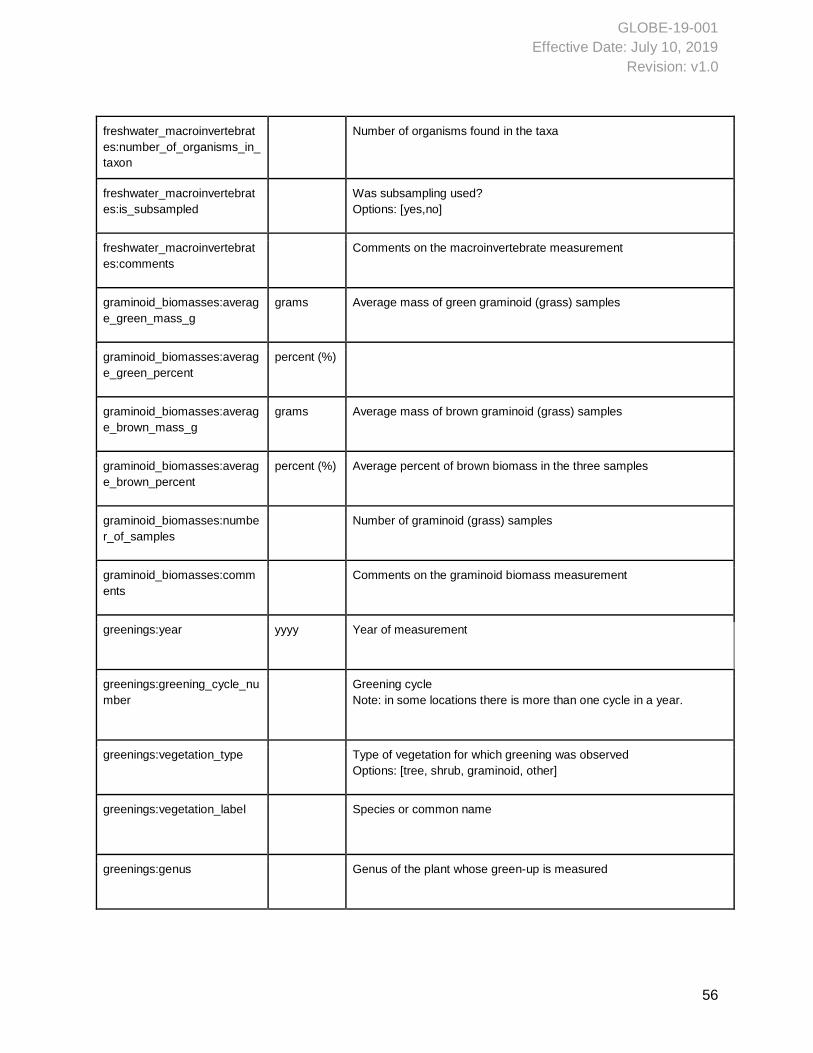
freshwater_macroinvertebrat
es:number_of_organisms_in_
taxon
Number of organisms found in the taxa
freshwater_macroinvertebrat
es:is_subsampled
Was subsampling used?
Options: [yes,no]
freshwater_macroinvertebrat
es:comments
Comments on the macroinvertebrate measurement
graminoid_biomasses:averag
e_green_mass_g
grams Average mass of green graminoid (grass) samples
graminoid_biomasses:averag
e_green_percent
percent (%)
graminoid_biomasses:averag
e_brown_mass_g
grams Average mass of brown graminoid (grass) samples
graminoid_biomasses:averag
e_brown_percent
percent (%) Average percent of brown biomass in the three samples
graminoid_biomasses:numbe
r_of_samples
Number of graminoid (grass) samples
graminoid_biomasses:comm
ents
Comments on the graminoid biomass measurement
greenings:year yyyy Year of measurement
greenings:greening_cycle_nu
mber
Greening cycle
Note: in some locations there is more than one cycle in a year.
greenings:vegetation_type Type of vegetation for which greening was observed
Options: [tree, shrub, graminoid, other]
greenings:vegetation_label Species or common name
greenings:genus Genus of the plant whose green-up is measured
GLOBE-19-001
Effective Date: July 10, 2019
Revision: v1.0
57
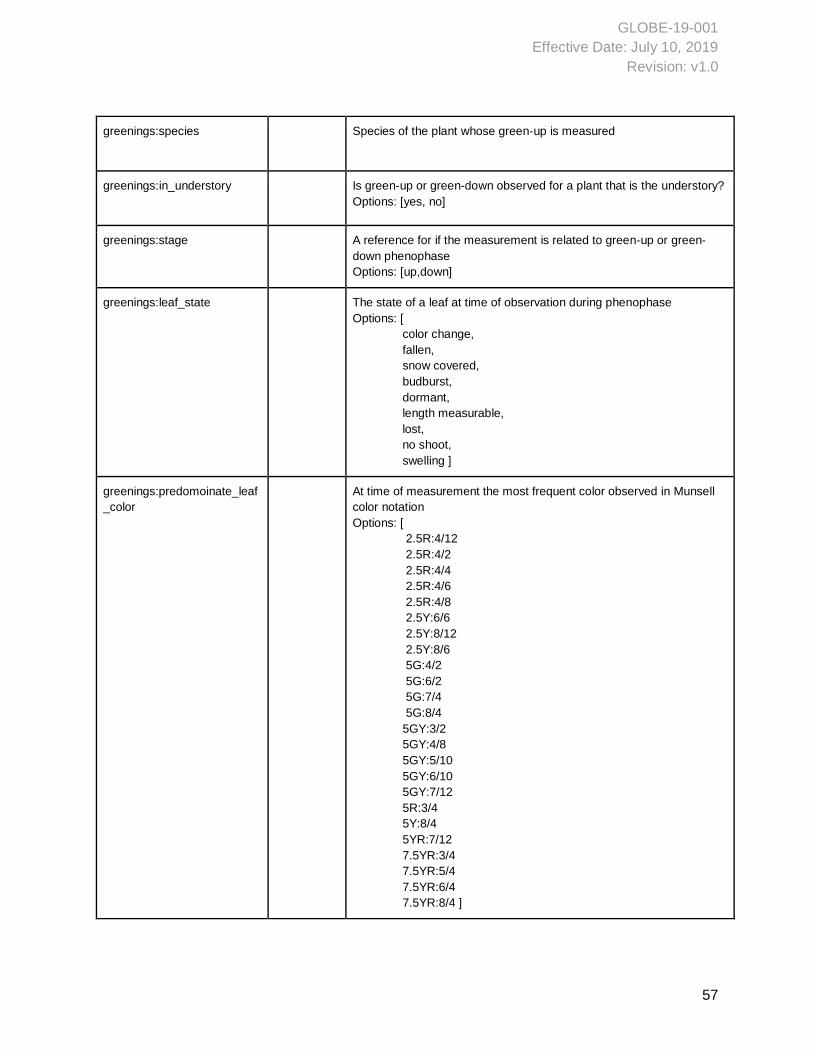
greenings:species Species of the plant whose green-up is measured
greenings:in_understory Is green-up or green-down observed for a plant that is the understory?
Options: [yes, no]
greenings:stage A reference for if the measurement is related to green-up or green-
down phenophase
Options: [up,down]
greenings:leaf_state
The state of a leaf at time of observation during phenophase
Options: [
color change,
fallen,
snow covered,
budburst,
dormant,
length measurable,
lost,
no shoot,
swelling ]
greenings:predomoinate_leaf
_color
At time of measurement the most frequent color observed in Munsell
color notation
Options: [
2.5R:4/12
2.5R:4/2
2.5R:4/4
2.5R:4/6
2.5R:4/8
2.5Y:6/6
2.5Y:8/12
2.5Y:8/6
5G:4/2
5G:6/2
5G:7/4
5G:8/4
5GY:3/2
5GY:4/8
5GY:5/10
5GY:6/10
5GY:7/12
5R:3/4
5Y:8/4
5YR:7/12
7.5YR:3/4
7.5YR:5/4
7.5YR:6/4
7.5YR:8/4 ]
GLOBE-19-001
Effective Date: July 10, 2019
Revision: v1.0
58
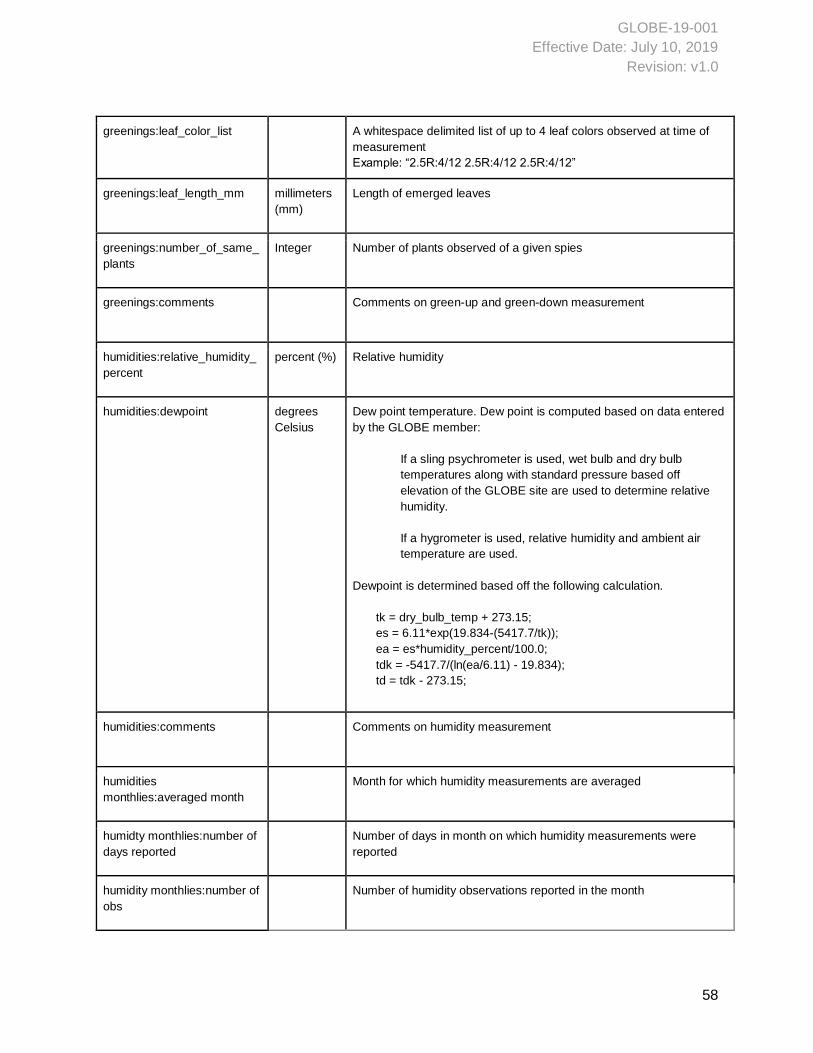
greenings:leaf_color_list A whitespace delimited list of up to 4 leaf colors observed at time of
measurement
Example: “2.5R:4/12 2.5R:4/12 2.5R:4/12”
greenings:leaf_length_mm millimeters
(mm)
Length of emerged leaves
greenings:number_of_same_
plants
Integer Number of plants observed of a given spies
greenings:comments Comments on green-up and green-down measurement
humidities:relative_humidity_
percent
percent (%) Relative humidity
humidities:dewpoint degrees
Celsius
Dew point temperature. Dew point is computed based on data entered
by the GLOBE member:
If a sling psychrometer is used, wet bulb and dry bulb
temperatures along with standard pressure based off
elevation of the GLOBE site are used to determine relative
humidity.
If a hygrometer is used, relative humidity and ambient air
temperature are used.
Dewpoint is determined based off the following calculation.
tk = dry_bulb_temp + 273.15;
es = 6.11*exp(19.834-(5417.7/tk));
ea = es*humidity_percent/100.0;
tdk = -5417.7/(ln(ea/6.11) - 19.834);
td = tdk - 273.15;
humidities:comments Comments on humidity measurement
humidities
monthlies:averaged month
Month for which humidity measurements are averaged
humidty monthlies:number of
days reported
Number of days in month on which humidity measurements were
reported
humidity monthlies:number of
obs
Number of humidity observations reported in the month
GLOBE-19-001
Effective Date: July 10, 2019
Revision: v1.0
59
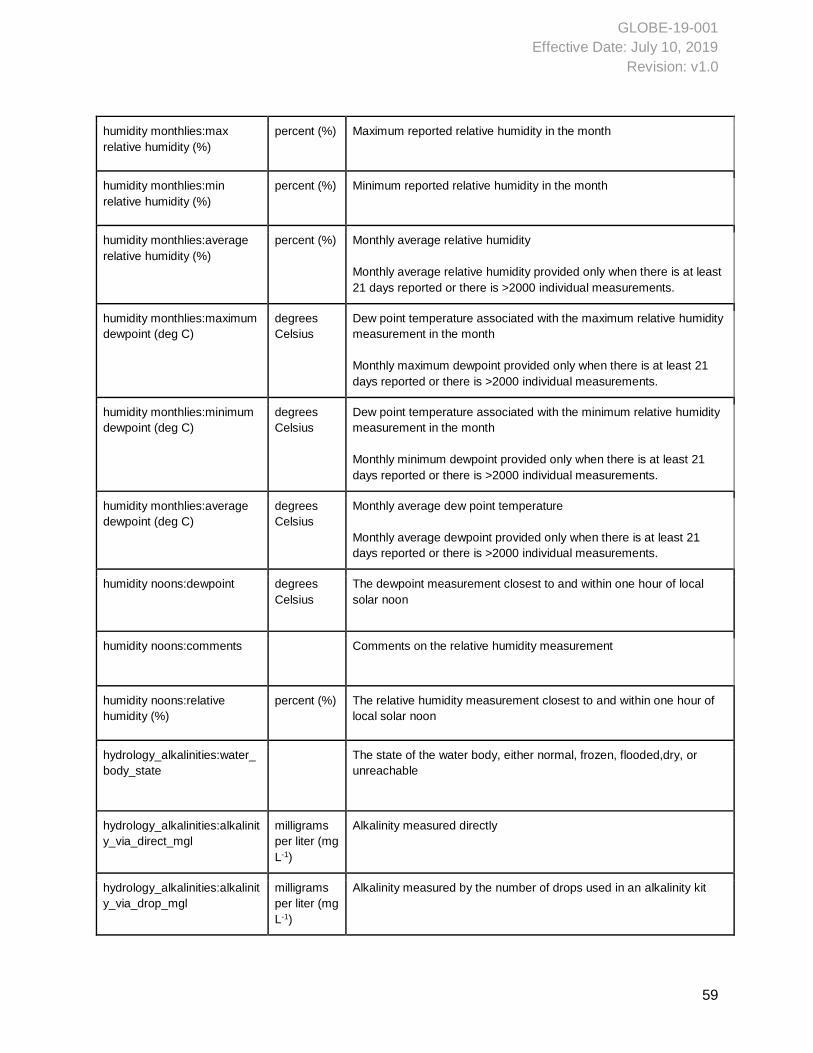
humidity monthlies:max
relative humidity (%)
percent (%) Maximum reported relative humidity in the month
humidity monthlies:min
relative humidity (%)
percent (%) Minimum reported relative humidity in the month
humidity monthlies:average
relative humidity (%)
percent (%) Monthly average relative humidity
Monthly average relative humidity provided only when there is at least
21 days reported or there is >2000 individual measurements.
humidity monthlies:maximum
dewpoint (deg C)
degrees
Celsius
Dew point temperature associated with the maximum relative humidity
measurement in the month
Monthly maximum dewpoint provided only when there is at least 21
days reported or there is >2000 individual measurements.
humidity monthlies:minimum
dewpoint (deg C)
degrees
Celsius
Dew point temperature associated with the minimum relative humidity
measurement in the month
Monthly minimum dewpoint provided only when there is at least 21
days reported or there is >2000 individual measurements.
humidity monthlies:average
dewpoint (deg C)
degrees
Celsius
Monthly average dew point temperature
Monthly average dewpoint provided only when there is at least 21
days reported or there is >2000 individual measurements.
humidity noons:dewpoint degrees
Celsius
The dewpoint measurement closest to and within one hour of local
solar noon
humidity noons:comments Comments on the relative humidity measurement
humidity noons:relative
humidity (%)
percent (%) The relative humidity measurement closest to and within one hour of
local solar noon
hydrology_alkalinities:water_
body_state
The state of the water body, either normal, frozen, flooded,dry, or
unreachable
hydrology_alkalinities:alkalinit
y_via_direct_mgl
milligrams
per liter (mg
L-1)
Alkalinity measured directly
hydrology_alkalinities:alkalinit
y_via_drop_mgl
milligrams
per liter (mg
L-1)
Alkalinity measured by the number of drops used in an alkalinity kit
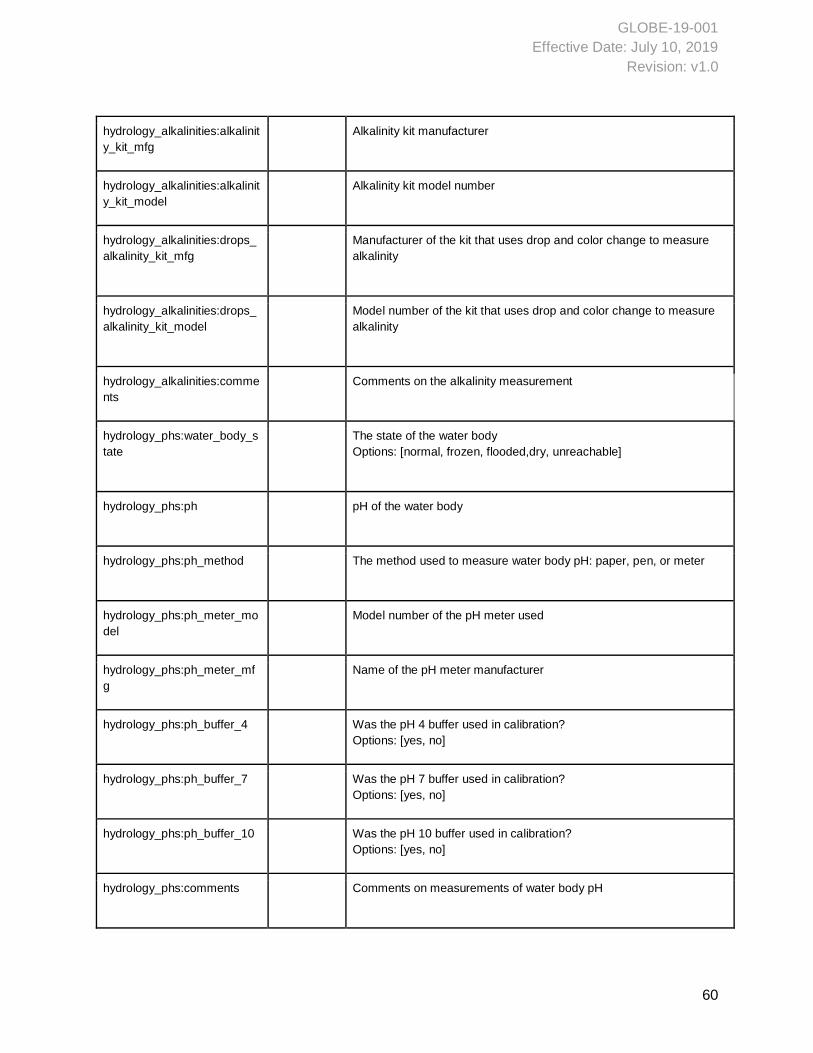
GLOBE-19-001
Effective Date: July 10, 2019
Revision: v1.0
60
hydrology_alkalinities:alkalinit
y_kit_mfg
Alkalinity kit manufacturer
hydrology_alkalinities:alkalinit
y_kit_model
Alkalinity kit model number
hydrology_alkalinities:drops_
alkalinity_kit_mfg
Manufacturer of the kit that uses drop and color change to measure
alkalinity
hydrology_alkalinities:drops_
alkalinity_kit_model
Model number of the kit that uses drop and color change to measure
alkalinity
hydrology_alkalinities:comme
nts
Comments on the alkalinity measurement
hydrology_phs:water_body_s
tate
The state of the water body
Options: [normal, frozen, flooded,dry, unreachable]
hydrology_phs:ph pH of the water body
hydrology_phs:ph_method The method used to measure water body pH: paper, pen, or meter
hydrology_phs:ph_meter_mo
del
Model number of the pH meter used
hydrology_phs:ph_meter_mf
g
Name of the pH meter manufacturer
hydrology_phs:ph_buffer_4 Was the pH 4 buffer used in calibration?
Options: [yes, no]
hydrology_phs:ph_buffer_7 Was the pH 7 buffer used in calibration?
Options: [yes, no]
hydrology_phs:ph_buffer_10 Was the pH 10 buffer used in calibration?
Options: [yes, no]
hydrology_phs:comments Comments on measurements of water body pH
GLOBE-19-001
Effective Date: July 10, 2019
Revision: v1.0
61
land_covers:name Name of the land cover site.
Guidance: land_cover_sites:name should not include commas (,).
● Good: “MountRainier123”
● Bad: “MountRainer, 123”
Note: There are two ways a site name is generated. (1) GLOBE
schools create their own site_name. (2) The GLOBE Observer app, on
the other hand, automatically assigns a site_name to an observation;
the site_name is not created by the user. The GLOBE Observer app
generates a site_name based on the MGRS grid.
land_covers:muc_code MUC code of the land cover site
land_covers:muc_name Name of the land cover site MUC code
land_covers:muc_description Description of the land cover site MUC code
land_covers:comments Comments on land cover site measurement
land_covers: data_source Descriptor indicating whether the data were reported by a GLOBE
member at a defined land cover site, or reported from the GLOBE
Observer app.
Options: [Site Definition, GLOBE Observer]
land_cover_site_with_photos:
name
Name of the land cover site
land_cover_site_with_photos:
activated_at
Date when the land cover site photos were taken
land_cover_site_with_photos:
muc_code
MUC code of the land cover site
land_cover_site_with_photos:
muc_name
Name of the land cover site MUC code
land_cover_site_with_photos:
muc_description
MUC description for a site for which photos are available
land_cover_site_with_photos:
comments
Comments on land cover site measurement
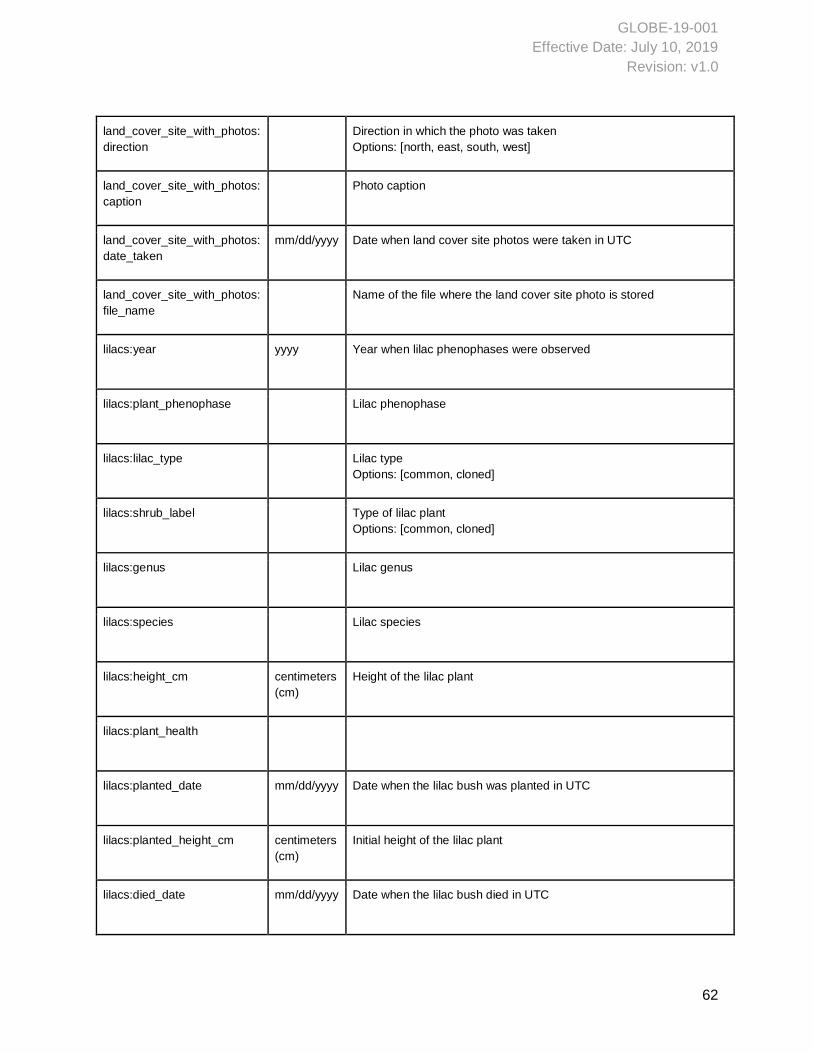
GLOBE-19-001
Effective Date: July 10, 2019
Revision: v1.0
62
land_cover_site_with_photos:
direction
Direction in which the photo was taken
Options: [north, east, south, west]
land_cover_site_with_photos:
caption
Photo caption
land_cover_site_with_photos:
date_taken
mm/dd/yyyy Date when land cover site photos were taken in UTC
land_cover_site_with_photos:
file_name
Name of the file where the land cover site photo is stored
lilacs:year yyyy Year when lilac phenophases were observed
lilacs:plant_phenophase Lilac phenophase
lilacs:lilac_type Lilac type
Options: [common, cloned]
lilacs:shrub_label Type of lilac plant
Options: [common, cloned]
lilacs:genus Lilac genus
lilacs:species Lilac species
lilacs:height_cm centimeters
(cm)
Height of the lilac plant
lilacs:plant_health
lilacs:planted_date mm/dd/yyyy Date when the lilac bush was planted in UTC
lilacs:planted_height_cm centimeters
(cm)
Initial height of the lilac plant
lilacs:died_date mm/dd/yyyy Date when the lilac bush died in UTC
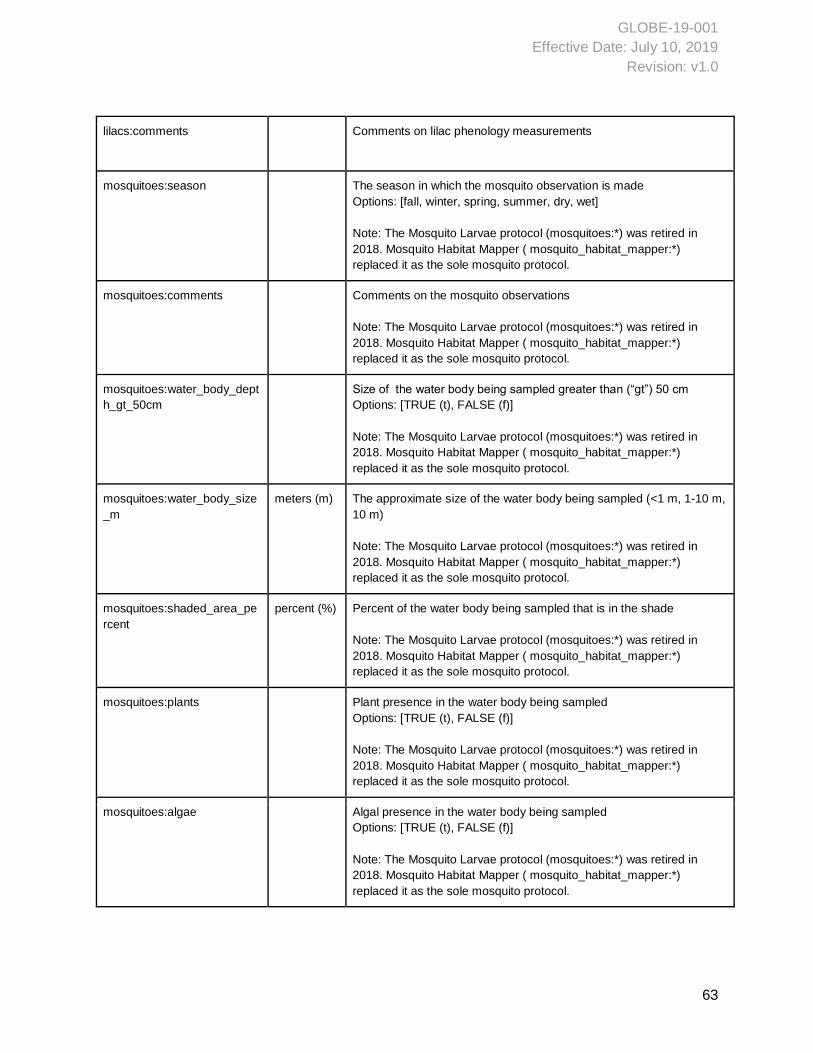
GLOBE-19-001
Effective Date: July 10, 2019
Revision: v1.0
63
lilacs:comments Comments on lilac phenology measurements
mosquitoes:season The season in which the mosquito observation is made
Options: [fall, winter, spring, summer, dry, wet]
Note: The Mosquito Larvae protocol (mosquitoes:*) was retired in
2018. Mosquito Habitat Mapper ( mosquito_habitat_mapper:*)
replaced it as the sole mosquito protocol.
mosquitoes:comments Comments on the mosquito observations
Note: The Mosquito Larvae protocol (mosquitoes:*) was retired in
2018. Mosquito Habitat Mapper ( mosquito_habitat_mapper:*)
replaced it as the sole mosquito protocol.
mosquitoes:water_body_dept
h_gt_50cm
Size of the water body being sampled greater than (“gt”) 50 cm
Options: [TRUE (t), FALSE (f)]
Note: The Mosquito Larvae protocol (mosquitoes:*) was retired in
2018. Mosquito Habitat Mapper ( mosquito_habitat_mapper:*)
replaced it as the sole mosquito protocol.
mosquitoes:water_body_size
_m
meters (m) The approximate size of the water body being sampled (<1 m, 1-10 m,
10 m)
Note: The Mosquito Larvae protocol (mosquitoes:*) was retired in
2018. Mosquito Habitat Mapper ( mosquito_habitat_mapper:*)
replaced it as the sole mosquito protocol.
mosquitoes:shaded_area_pe
rcent
percent (%) Percent of the water body being sampled that is in the shade
Note: The Mosquito Larvae protocol (mosquitoes:*) was retired in
2018. Mosquito Habitat Mapper ( mosquito_habitat_mapper:*)
replaced it as the sole mosquito protocol.
mosquitoes:plants Plant presence in the water body being sampled
Options: [TRUE (t), FALSE (f)]
Note: The Mosquito Larvae protocol (mosquitoes:*) was retired in
2018. Mosquito Habitat Mapper ( mosquito_habitat_mapper:*)
replaced it as the sole mosquito protocol.
mosquitoes:algae Algal presence in the water body being sampled
Options: [TRUE (t), FALSE (f)]
Note: The Mosquito Larvae protocol (mosquitoes:*) was retired in
2018. Mosquito Habitat Mapper ( mosquito_habitat_mapper:*)
replaced it as the sole mosquito protocol.
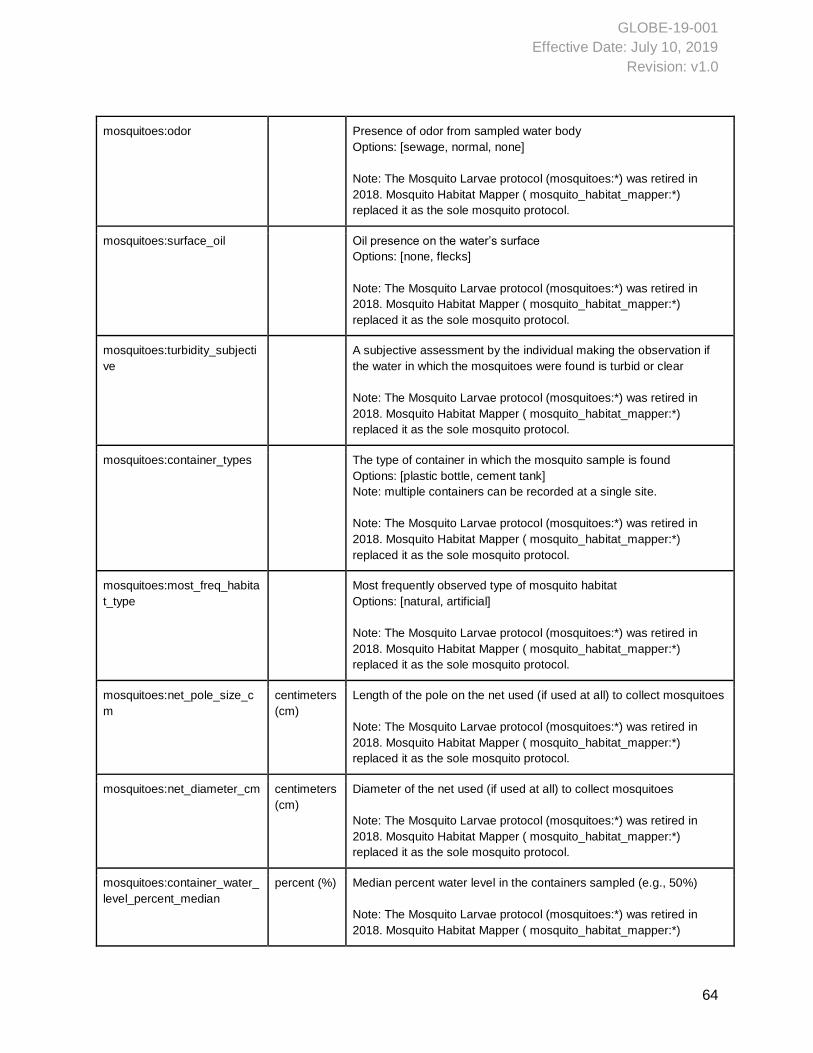
GLOBE-19-001
Effective Date: July 10, 2019
Revision: v1.0
64
mosquitoes:odor Presence of odor from sampled water body
Options: [sewage, normal, none]
Note: The Mosquito Larvae protocol (mosquitoes:*) was retired in
2018. Mosquito Habitat Mapper ( mosquito_habitat_mapper:*)
replaced it as the sole mosquito protocol.
mosquitoes:surface_oil Oil presence on the water’s surface
Options: [none, flecks]
Note: The Mosquito Larvae protocol (mosquitoes:*) was retired in
2018. Mosquito Habitat Mapper ( mosquito_habitat_mapper:*)
replaced it as the sole mosquito protocol.
mosquitoes:turbidity_subjecti
ve
A subjective assessment by the individual making the observation if
the water in which the mosquitoes were found is turbid or clear
Note: The Mosquito Larvae protocol (mosquitoes:*) was retired in
2018. Mosquito Habitat Mapper ( mosquito_habitat_mapper:*)
replaced it as the sole mosquito protocol.
mosquitoes:container_types The type of container in which the mosquito sample is found
Options: [plastic bottle, cement tank]
Note: multiple containers can be recorded at a single site.
Note: The Mosquito Larvae protocol (mosquitoes:*) was retired in
2018. Mosquito Habitat Mapper ( mosquito_habitat_mapper:*)
replaced it as the sole mosquito protocol.
mosquitoes:most_freq_habita
t_type
Most frequently observed type of mosquito habitat
Options: [natural, artificial]
Note: The Mosquito Larvae protocol (mosquitoes:*) was retired in
2018. Mosquito Habitat Mapper ( mosquito_habitat_mapper:*)
replaced it as the sole mosquito protocol.
mosquitoes:net_pole_size_c
m
centimeters
(cm)
Length of the pole on the net used (if used at all) to collect mosquitoes
Note: The Mosquito Larvae protocol (mosquitoes:*) was retired in
2018. Mosquito Habitat Mapper ( mosquito_habitat_mapper:*)
replaced it as the sole mosquito protocol.
mosquitoes:net_diameter_cm centimeters
(cm)
Diameter of the net used (if used at all) to collect mosquitoes
Note: The Mosquito Larvae protocol (mosquitoes:*) was retired in
2018. Mosquito Habitat Mapper ( mosquito_habitat_mapper:*)
replaced it as the sole mosquito protocol.
mosquitoes:container_water_
level_percent_median
percent (%) Median percent water level in the containers sampled (e.g., 50%)
Note: The Mosquito Larvae protocol (mosquitoes:*) was retired in
2018. Mosquito Habitat Mapper ( mosquito_habitat_mapper:*)
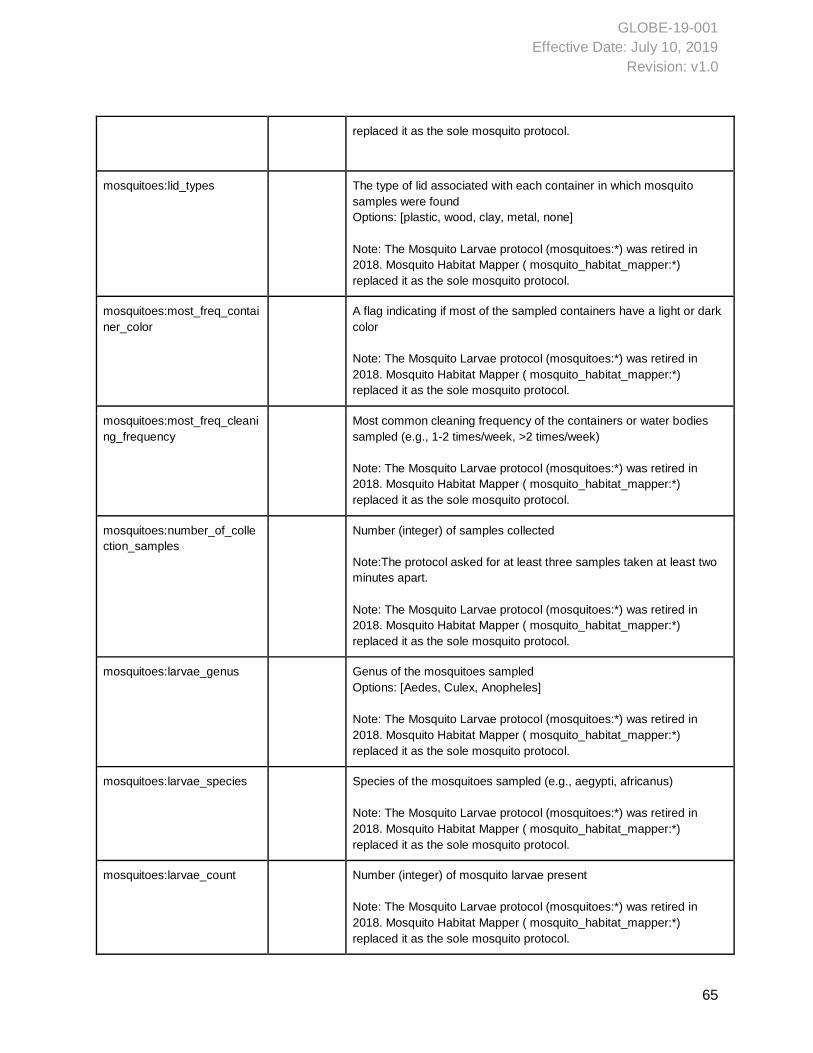
GLOBE-19-001
Effective Date: July 10, 2019
Revision: v1.0
65
replaced it as the sole mosquito protocol.
mosquitoes:lid_types The type of lid associated with each container in which mosquito
samples were found
Options: [plastic, wood, clay, metal, none]
Note: The Mosquito Larvae protocol (mosquitoes:*) was retired in
2018. Mosquito Habitat Mapper ( mosquito_habitat_mapper:*)
replaced it as the sole mosquito protocol.
mosquitoes:most_freq_contai
ner_color
A flag indicating if most of the sampled containers have a light or dark
color
Note: The Mosquito Larvae protocol (mosquitoes:*) was retired in
2018. Mosquito Habitat Mapper ( mosquito_habitat_mapper:*)
replaced it as the sole mosquito protocol.
mosquitoes:most_freq_cleani
ng_frequency
Most common cleaning frequency of the containers or water bodies
sampled (e.g., 1-2 times/week, >2 times/week)
Note: The Mosquito Larvae protocol (mosquitoes:*) was retired in
2018. Mosquito Habitat Mapper ( mosquito_habitat_mapper:*)
replaced it as the sole mosquito protocol.
mosquitoes:number_of_colle
ction_samples
Number (integer) of samples collected
Note:The protocol asked for at least three samples taken at least two
minutes apart.
Note: The Mosquito Larvae protocol (mosquitoes:*) was retired in
2018. Mosquito Habitat Mapper ( mosquito_habitat_mapper:*)
replaced it as the sole mosquito protocol.
mosquitoes:larvae_genus Genus of the mosquitoes sampled
Options: [Aedes, Culex, Anopheles]
Note: The Mosquito Larvae protocol (mosquitoes:*) was retired in
2018. Mosquito Habitat Mapper ( mosquito_habitat_mapper:*)
replaced it as the sole mosquito protocol.
mosquitoes:larvae_species Species of the mosquitoes sampled (e.g., aegypti, africanus)
Note: The Mosquito Larvae protocol (mosquitoes:*) was retired in
2018. Mosquito Habitat Mapper ( mosquito_habitat_mapper:*)
replaced it as the sole mosquito protocol.
mosquitoes:larvae_count Number (integer) of mosquito larvae present
Note: The Mosquito Larvae protocol (mosquitoes:*) was retired in
2018. Mosquito Habitat Mapper ( mosquito_habitat_mapper:*)
replaced it as the sole mosquito protocol.
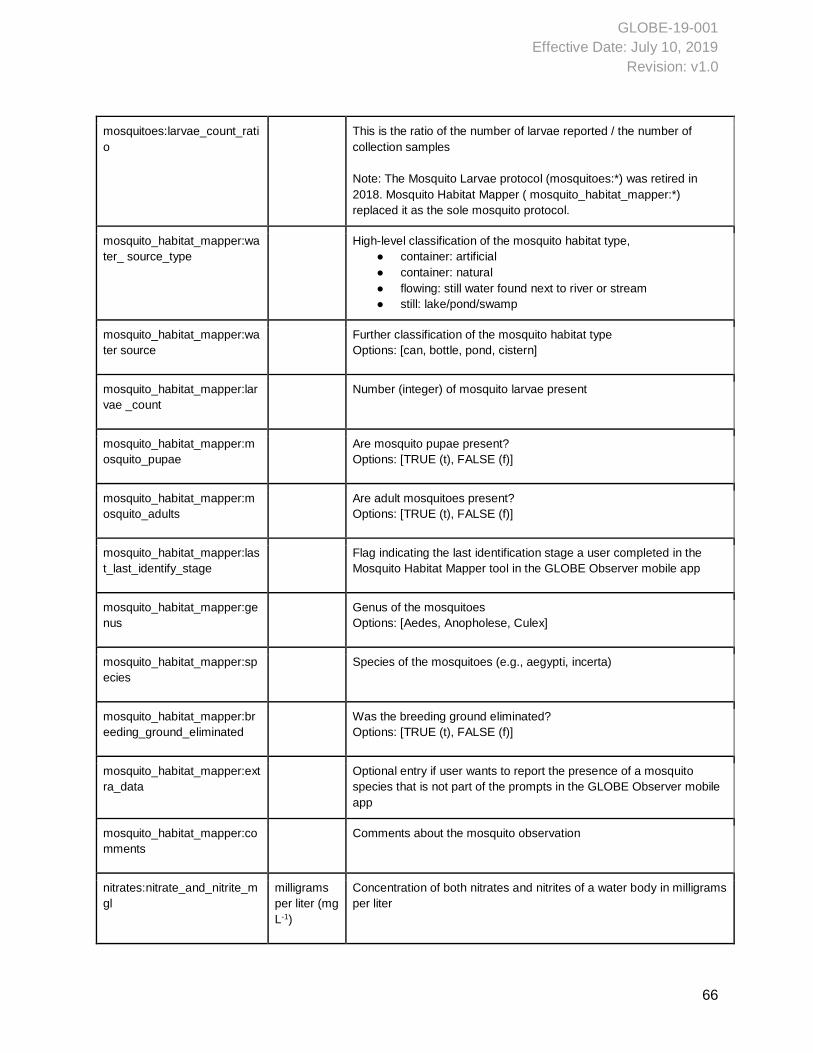
GLOBE-19-001
Effective Date: July 10, 2019
Revision: v1.0
66
mosquitoes:larvae_count_rati
o
This is the ratio of the number of larvae reported / the number of
collection samples
Note: The Mosquito Larvae protocol (mosquitoes:*) was retired in
2018. Mosquito Habitat Mapper ( mosquito_habitat_mapper:*)
replaced it as the sole mosquito protocol.
mosquito_habitat_mapper:wa
ter_ source_type
High-level classification of the mosquito habitat type,
● container: artificial
● container: natural
● flowing: still water found next to river or stream
● still: lake/pond/swamp
mosquito_habitat_mapper:wa
ter source
Further classification of the mosquito habitat type
Options: [can, bottle, pond, cistern]
mosquito_habitat_mapper:lar
vae _count
Number (integer) of mosquito larvae present
mosquito_habitat_mapper:m
osquito_pupae
Are mosquito pupae present?
Options: [TRUE (t), FALSE (f)]
mosquito_habitat_mapper:m
osquito_adults
Are adult mosquitoes present?
Options: [TRUE (t), FALSE (f)]
mosquito_habitat_mapper:las
t_last_identify_stage
Flag indicating the last identification stage a user completed in the
Mosquito Habitat Mapper tool in the GLOBE Observer mobile app
mosquito_habitat_mapper:ge
nus
Genus of the mosquitoes
Options: [Aedes, Anopholese, Culex]
mosquito_habitat_mapper:sp
ecies
Species of the mosquitoes (e.g., aegypti, incerta)
mosquito_habitat_mapper:br
eeding_ground_eliminated
Was the breeding ground eliminated?
Options: [TRUE (t), FALSE (f)]
mosquito_habitat_mapper:ext
ra_data
Optional entry if user wants to report the presence of a mosquito
species that is not part of the prompts in the GLOBE Observer mobile
app
mosquito_habitat_mapper:co
mments
Comments about the mosquito observation
nitrates:nitrate_and_nitrite_m
gl
milligrams
per liter (mg
L-1)
Concentration of both nitrates and nitrites of a water body in milligrams
per liter
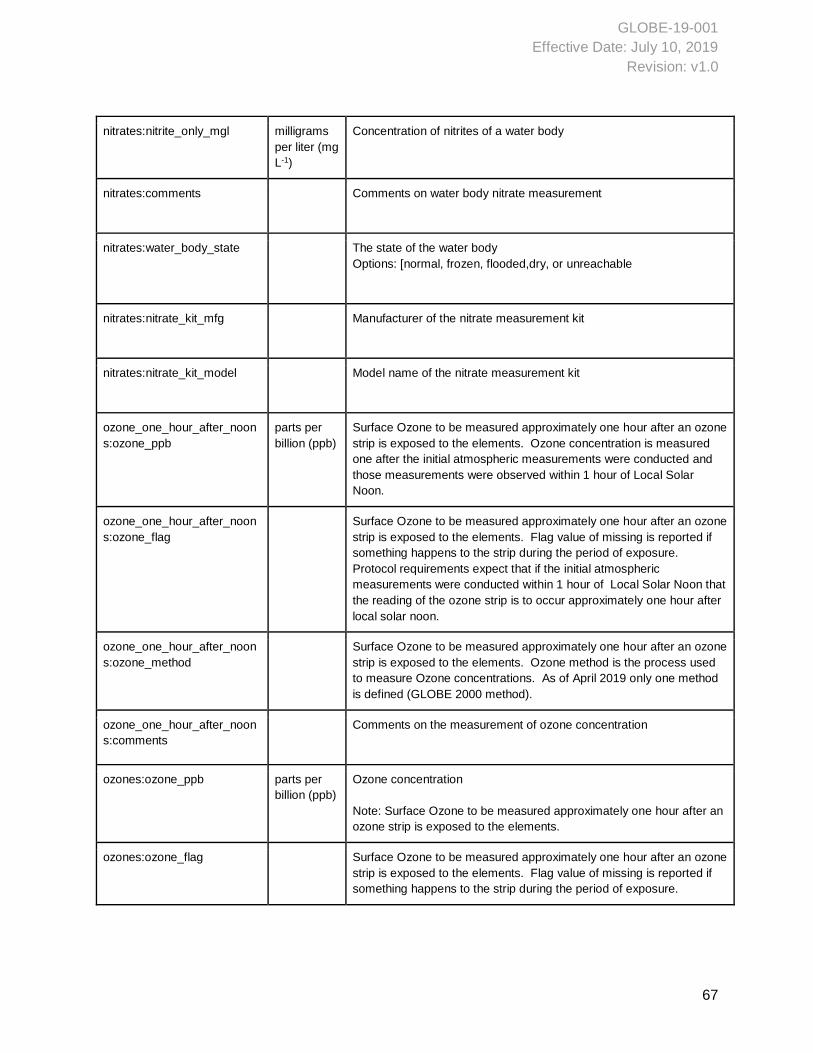
GLOBE-19-001
Effective Date: July 10, 2019
Revision: v1.0
67
nitrates:nitrite_only_mgl milligrams
per liter (mg
L-1)
Concentration of nitrites of a water body
nitrates:comments Comments on water body nitrate measurement
nitrates:water_body_state The state of the water body
Options: [normal, frozen, flooded,dry, or unreachable
nitrates:nitrate_kit_mfg Manufacturer of the nitrate measurement kit
nitrates:nitrate_kit_model Model name of the nitrate measurement kit
ozone_one_hour_after_noon
s:ozone_ppb
parts per
billion (ppb)
Surface Ozone to be measured approximately one hour after an ozone
strip is exposed to the elements. Ozone concentration is measured
one after the initial atmospheric measurements were conducted and
those measurements were observed within 1 hour of Local Solar
Noon.
ozone_one_hour_after_noon
s:ozone_flag
Surface Ozone to be measured approximately one hour after an ozone
strip is exposed to the elements. Flag value of missing is reported if
something happens to the strip during the period of exposure.
Protocol requirements expect that if the initial atmospheric
measurements were conducted within 1 hour of Local Solar Noon that
the reading of the ozone strip is to occur approximately one hour after
local solar noon.
ozone_one_hour_after_noon
s:ozone_method
Surface Ozone to be measured approximately one hour after an ozone
strip is exposed to the elements. Ozone method is the process used
to measure Ozone concentrations. As of April 2019 only one method
is defined (GLOBE 2000 method).
ozone_one_hour_after_noon
s:comments
Comments on the measurement of ozone concentration
ozones:ozone_ppb parts per
billion (ppb)
Ozone concentration
Note: Surface Ozone to be measured approximately one hour after an
ozone strip is exposed to the elements.
ozones:ozone_flag Surface Ozone to be measured approximately one hour after an ozone
strip is exposed to the elements. Flag value of missing is reported if
something happens to the strip during the period of exposure.
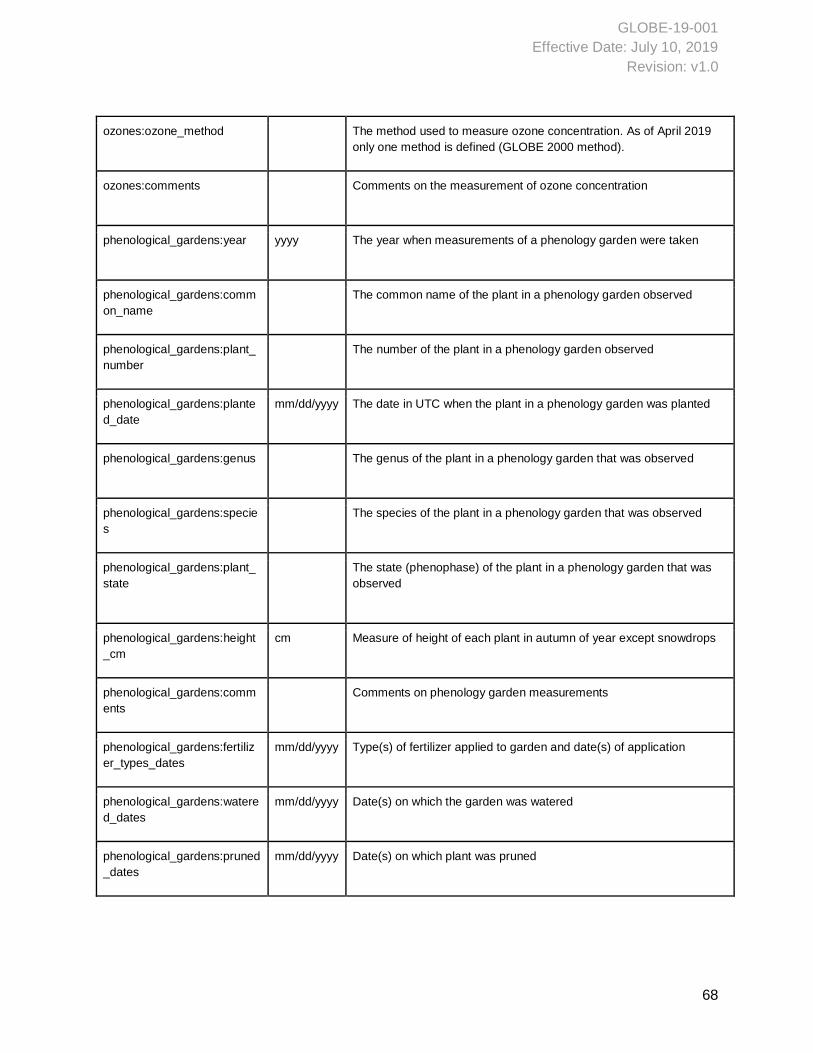
GLOBE-19-001
Effective Date: July 10, 2019
Revision: v1.0
68
ozones:ozone_method The method used to measure ozone concentration. As of April 2019
only one method is defined (GLOBE 2000 method).
ozones:comments Comments on the measurement of ozone concentration
phenological_gardens:year yyyy The year when measurements of a phenology garden were taken
phenological_gardens:comm
on_name
The common name of the plant in a phenology garden observed
phenological_gardens:plant_
number
The number of the plant in a phenology garden observed
phenological_gardens:plante
d_date
mm/dd/yyyy The date in UTC when the plant in a phenology garden was planted
phenological_gardens:genus The genus of the plant in a phenology garden that was observed
phenological_gardens:specie
s
The species of the plant in a phenology garden that was observed
phenological_gardens:plant_
state
The state (phenophase) of the plant in a phenology garden that was
observed
phenological_gardens:height
_cm
cm Measure of height of each plant in autumn of year except snowdrops
phenological_gardens:comm
ents
Comments on phenology garden measurements
phenological_gardens:fertiliz
er_types_dates
mm/dd/yyyy Type(s) of fertilizer applied to garden and date(s) of application
phenological_gardens:watere
d_dates
mm/dd/yyyy Date(s) on which the garden was watered
phenological_gardens:pruned
_dates
mm/dd/yyyy Date(s) on which plant was pruned
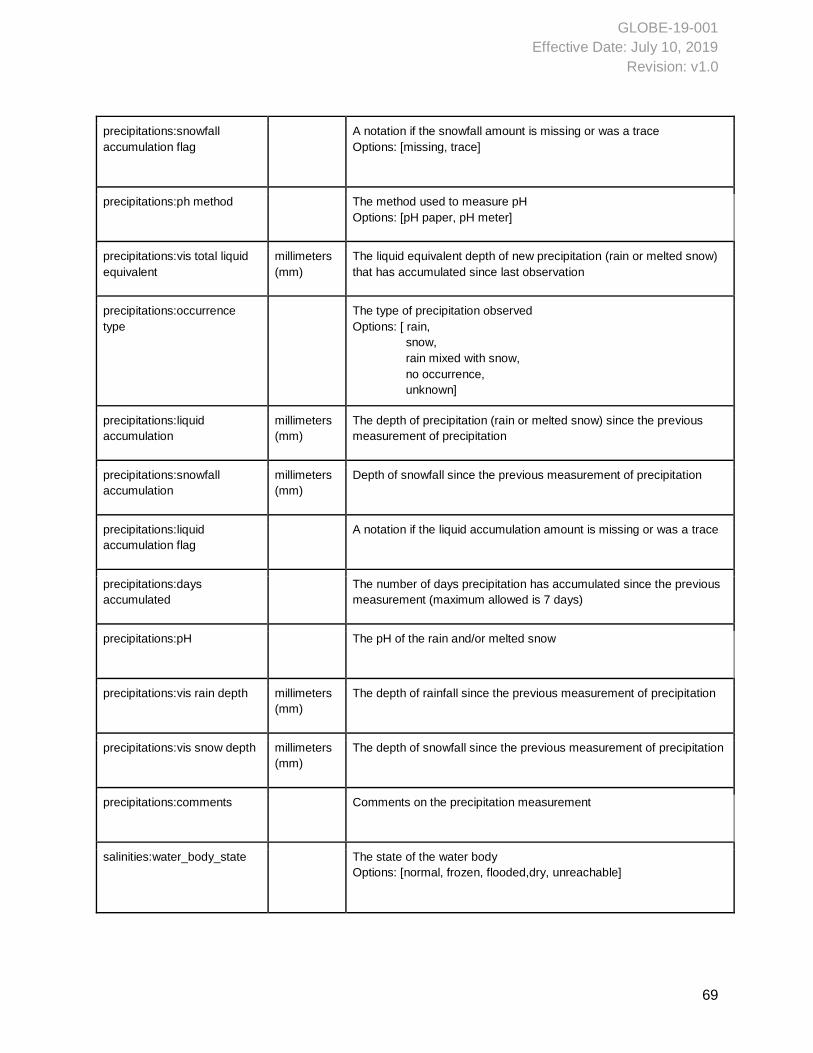
GLOBE-19-001
Effective Date: July 10, 2019
Revision: v1.0
69
precipitations:snowfall
accumulation flag
A notation if the snowfall amount is missing or was a trace
Options: [missing, trace]
precipitations:ph method The method used to measure pH
Options: [pH paper, pH meter]
precipitations:vis total liquid
equivalent
millimeters
(mm)
The liquid equivalent depth of new precipitation (rain or melted snow)
that has accumulated since last observation
precipitations:occurrence
type
The type of precipitation observed
Options: [ rain,
snow,
rain mixed with snow,
no occurrence,
unknown]
precipitations:liquid
accumulation
millimeters
(mm)
The depth of precipitation (rain or melted snow) since the previous
measurement of precipitation
precipitations:snowfall
accumulation
millimeters
(mm)
Depth of snowfall since the previous measurement of precipitation
precipitations:liquid
accumulation flag
A notation if the liquid accumulation amount is missing or was a trace
precipitations:days
accumulated
The number of days precipitation has accumulated since the previous
measurement (maximum allowed is 7 days)
precipitations:pH The pH of the rain and/or melted snow
precipitations:vis rain depth millimeters
(mm)
The depth of rainfall since the previous measurement of precipitation
precipitations:vis snow depth millimeters
(mm)
The depth of snowfall since the previous measurement of precipitation
precipitations:comments Comments on the precipitation measurement
salinities:water_body_state The state of the water body
Options: [normal, frozen, flooded,dry, unreachable]
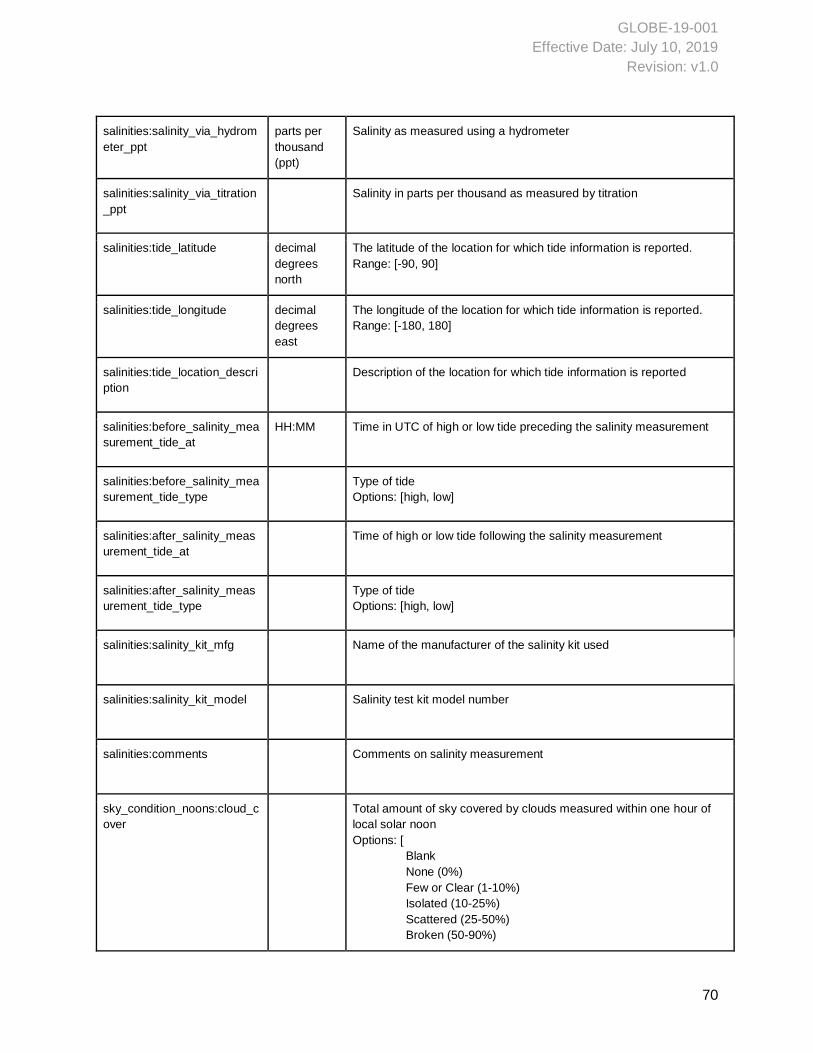
GLOBE-19-001
Effective Date: July 10, 2019
Revision: v1.0
70
salinities:salinity_via_hydrom
eter_ppt
parts per
thousand
(ppt)
Salinity as measured using a hydrometer
salinities:salinity_via_titration
_ppt
Salinity in parts per thousand as measured by titration
salinities:tide_latitude decimal
degrees
north
The latitude of the location for which tide information is reported.
Range: [-90, 90]
salinities:tide_longitude decimal
degrees
east
The longitude of the location for which tide information is reported.
Range: [-180, 180]
salinities:tide_location_descri
ption
Description of the location for which tide information is reported
salinities:before_salinity_mea
surement_tide_at
HH:MM Time in UTC of high or low tide preceding the salinity measurement
salinities:before_salinity_mea
surement_tide_type
Type of tide
Options: [high, low]
salinities:after_salinity_meas
urement_tide_at
Time of high or low tide following the salinity measurement
salinities:after_salinity_meas
urement_tide_type
Type of tide
Options: [high, low]
salinities:salinity_kit_mfg Name of the manufacturer of the salinity kit used
salinities:salinity_kit_model Salinity test kit model number
salinities:comments Comments on salinity measurement
sky_condition_noons:cloud_c
over
Total amount of sky covered by clouds measured within one hour of
local solar noon
Options: [
Blank
None (0%)
Few or Clear (1-10%)
Isolated (10-25%)
Scattered (25-50%)
Broken (50-90%)
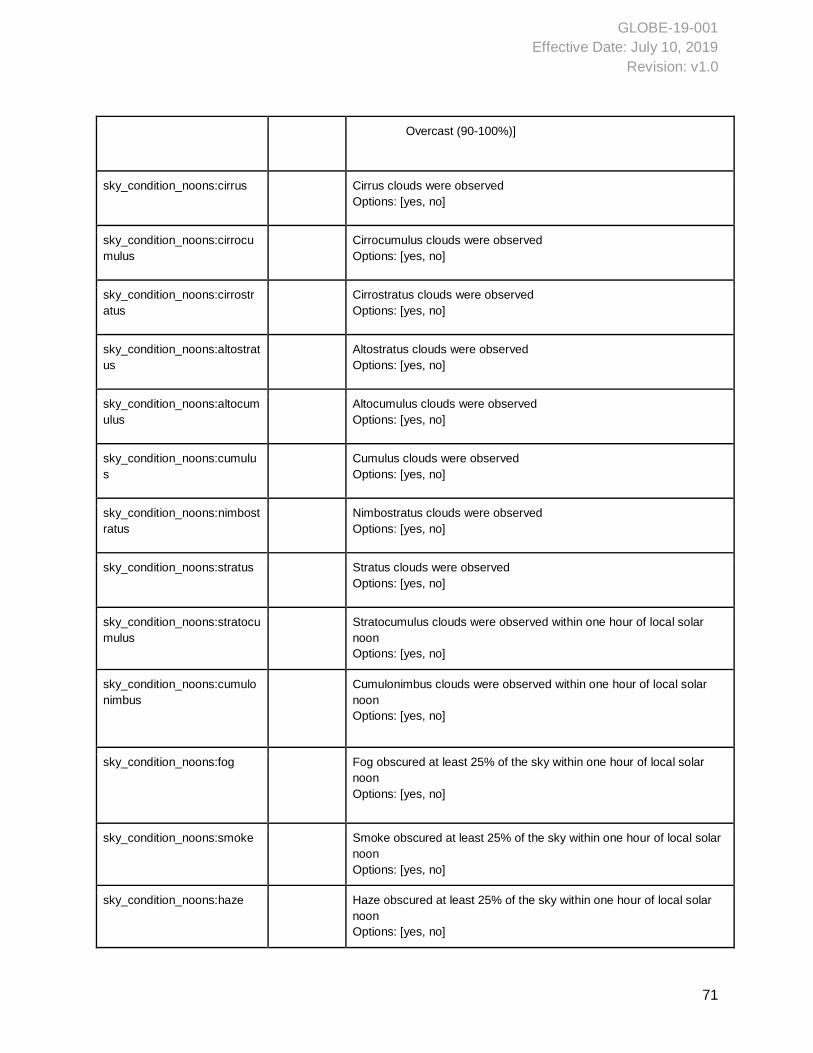
GLOBE-19-001
Effective Date: July 10, 2019
Revision: v1.0
71
Overcast (90-100%)]
sky_condition_noons:cirrus Cirrus clouds were observed
Options: [yes, no]
sky_condition_noons:cirrocu
mulus
Cirrocumulus clouds were observed
Options: [yes, no]
sky_condition_noons:cirrostr
atus
Cirrostratus clouds were observed
Options: [yes, no]
sky_condition_noons:altostrat
us
Altostratus clouds were observed
Options: [yes, no]
sky_condition_noons:altocum
ulus
Altocumulus clouds were observed
Options: [yes, no]
sky_condition_noons:cumulu
s
Cumulus clouds were observed
Options: [yes, no]
sky_condition_noons:nimbost
ratus
Nimbostratus clouds were observed
Options: [yes, no]
sky_condition_noons:stratus Stratus clouds were observed
Options: [yes, no]
sky_condition_noons:stratocu
mulus
Stratocumulus clouds were observed within one hour of local solar
noon
Options: [yes, no]
sky_condition_noons:cumulo
nimbus
Cumulonimbus clouds were observed within one hour of local solar
noon
Options: [yes, no]
sky_condition_noons:fog Fog obscured at least 25% of the sky within one hour of local solar
noon
Options: [yes, no]
sky_condition_noons:smoke Smoke obscured at least 25% of the sky within one hour of local solar
noon
Options: [yes, no]
sky_condition_noons:haze Haze obscured at least 25% of the sky within one hour of local solar
noon
Options: [yes, no]
GLOBE-19-001
Effective Date: July 10, 2019
Revision: v1.0
72
sky_condition_noons:volcani
c_ash
Volcanic ash obscured at least 25% of the sky within one hour of local
solar noon
Options: [yes, no]
sky_condition_noons:dust Dust obscured at least 25% of the sky within one hour of local solar
noon
Options: [yes, no]
sky_condition_noons:sand Sand obscured at least 25% of the sky within one hour of local solar
noon
Options: [yes, no]
sky_condition_noons:spray Spray obscured at least 25% of the sky within one hour of local solar
noon
Options: [yes, no]
sky_condition_noons:heavy_r
ain
Heavy rain obscured at least 25% of the sky within one hour of local
solar noon
Options: [yes, no]
sky_condition_noons:heavy_
snow
Heavy new snow obscured at least 25% of the sky within one hour of
local solar noon
Options: [yes, no]
sky_condition_noons:blowing
_snow
Blowing snow obscured at least 25% of the sky within one hour of
local solar noon
Options: [yes, no]
sky_condition_noons:short_li
ved_contrails
Total number (integer) of short lived contrails observed within one hour
of local solar noon
sky_condition_noons:spreadi
ng_contrails
Total number (integer) of persistent spreading contrails observed
within one hour of local solar noon
sky_condition_noons:non_sp
reading_contrails
Total number (integer) of persistent non-spreading contrails observed
within one hour of local solar noon
sky_condition_noons:comme
nts
Comments made by the observer
sky_condition_noons:is_citize
n_science
Flag indicating if the measurement site ID was MGRS-generated
Options: [TRUE, FALSE]
TRUE: observation came from the GLOBE Observer app
FALSE: observation did not come from the GLOBE Observer app
Sky_conditions:sky condition
id
Identification number (integer) for the latitude and longitude of the
observation
GLOBE-19-001
Effective Date: July 10, 2019
Revision: v1.0
73
Sky_conditions: observation
id
Identification number (integer) for the latitude, longitude, date, and
time of the observation
Sky_conditions: measured at yyyy-mm-
ddTHH:MM
:SS
The date and time of measurement in UTC
Sky_conditions: solar
measured at
yyyy-mm-
ddTHH:MM
:SS
Solar noon for the latitude and longitude of the observation in UTC
sky_conditions:cloud_cover
Total amount of sky covered by clouds irregardless of altitude
Options: [
Blank
None (0%)
Few or Clear (1-10%)
Isolated (10-25%)
Scattered (25-50%)
Broken (50-90%)
Overcast (90-100%)]
sky_conditions:cirrus Cirrus clouds were observed
Options: [TRUE, FALSE]
Note: Data downloaded from Vis returns X. Data downloaded from
ADAT returns TRUE.
sky_conditions:cirrocumulus Cirrocumulus clouds were observed
Options: [TRUE, FALSE]
Note: Data downloaded from Vis returns X. Data downloaded from
ADAT returns TRUE.
sky_conditions:cirrostratus Cirrostratus clouds were observed
Options: [TRUE, FALSE]
Note: Data downloaded from Vis returns X. Data downloaded from
ADAT returns TRUE.
sky_conditions:altostratus Altostratus clouds were observed
Options: [TRUE, FALSE]
Note: Data downloaded from Vis returns X. Data downloaded from
ADAT returns TRUE.
sky_conditions:altocumulus Altocumulus clouds were observed
Options: [TRUE, FALSE]
Note: Data downloaded from Vis returns X. Data downloaded from
ADAT returns TRUE.
GLOBE-19-001
Effective Date: July 10, 2019
Revision: v1.0
74
sky_conditions:cumulus Cumulus clouds were observed
Options: [TRUE, FALSE]
Note: Data downloaded from Vis returns X. Data downloaded from
ADAT returns TRUE.
sky_conditions:nimbostratus Nimbostratus clouds were observed
Options: [TRUE, FALSE]
Note: Data downloaded from Vis returns X. Data downloaded from
ADAT returns TRUE.
sky_conditions:stratus Stratus clouds were observed
Options: [TRUE, FALSE]
Note: Data downloaded from Vis returns X. Data downloaded from
ADAT returns TRUE.
sky_conditions:stratocumulus Stratocumulus clouds were observed
Options: [TRUE, FALSE]
Note: Data downloaded from Vis returns X. Data downloaded from
ADAT returns TRUE.
sky_conditions:cumulonimbu
s
Cumulonimbus clouds were observed
Options: [TRUE, FALSE]
Note: Data downloaded from Vis returns X. Data downloaded from
ADAT returns TRUE.
sky_conditions:comments Comments made by the observer
sky_conditions:fog Fog obscured >25% of the sky
Options: [TRUE, FALSE]
Note: Data downloaded from Vis returns X. Data downloaded from
ADAT returns TRUE.
sky_conditions:smoke Smoke obscured >25% of the sky
Options: [TRUE, FALSE]
Note: Data downloaded from Vis returns X. Data downloaded from
ADAT returns TRUE.
sky_conditions:haze Haze obscured >25% of the sky
Options: [TRUE, FALSE]
Note: Data downloaded from Vis returns X. Data downloaded from
ADAT returns TRUE.
GLOBE-19-001
Effective Date: July 10, 2019
Revision: v1.0
75
sky_conditions:volcanic_ash Volcanic Ash obscured >25% of the sky
Options: [TRUE, FALSE]
Note: Data downloaded from Vis returns X. Data downloaded from
ADAT returns TRUE.
sky_conditions:dust Dust obscured >25% of the sky
Options: [TRUE, FALSE]
Note: Data downloaded from Vis returns X. Data downloaded from
ADAT returns TRUE.
sky_conditions:sand Sand obscured >25% of the sky
Options: [TRUE, FALSE]
Note: Data downloaded from Vis returns X. Data downloaded from
ADAT returns TRUE.
sky_conditions:spray Sea spray obscured >25% of the sky
Options: [TRUE, FALSE]
Note: Data downloaded from Vis returns X. Data downloaded from
ADAT returns TRUE.
sky_conditions:heavy_rain Heavy rain obscured >25% of the sky
Options: [TRUE, FALSE]
Note: Data downloaded from Vis returns X. Data downloaded from
ADAT returns TRUE.
sky_conditions:heavy_snow Heavy snow obscured >25% of the sky
Options: [TRUE, FALSE]
Note: Data downloaded from Vis returns X. Data downloaded from
ADAT returns TRUE.
sky_conditions:blowing_snow Blowing snow obscured >25% of the sky
Options: [TRUE, FALSE]
Note: Data downloaded from Vis returns X. Data downloaded from
ADAT returns TRUE.
sky_conditions:short_lived_c
ontrails
Number (integer) of short lived contrails observed
sky_conditions:spreading_co
ntrails
Number (integer) of persistent spreading contrails observed
sky_conditions:non_spreadin
g_contrails
Number (integer) of persistent, non-spreading contrails observed
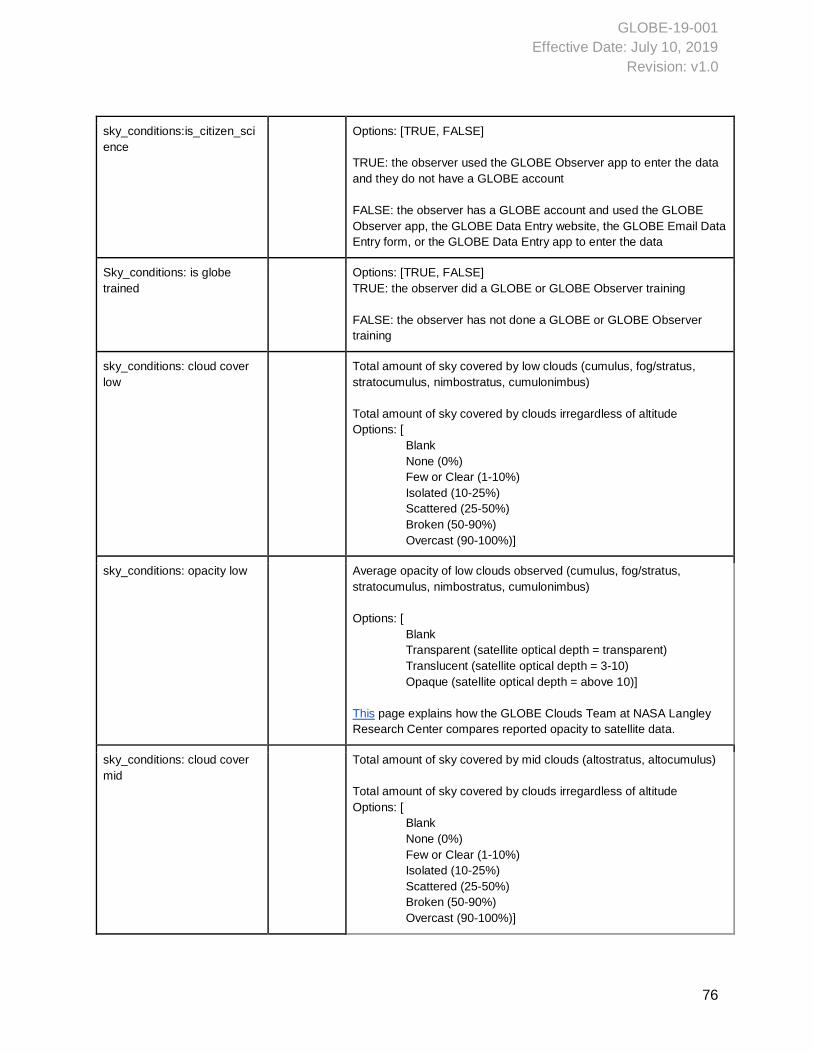
GLOBE-19-001
Effective Date: July 10, 2019
Revision: v1.0
76
sky_conditions:is_citizen_sci
ence
Options: [TRUE, FALSE]
TRUE: the observer used the GLOBE Observer app to enter the data
and they do not have a GLOBE account
FALSE: the observer has a GLOBE account and used the GLOBE
Observer app, the GLOBE Data Entry website, the GLOBE Email Data
Entry form, or the GLOBE Data Entry app to enter the data
Sky_conditions: is globe
trained
Options: [TRUE, FALSE]
TRUE: the observer did a GLOBE or GLOBE Observer training
FALSE: the observer has not done a GLOBE or GLOBE Observer
training
sky_conditions: cloud cover
low
Total amount of sky covered by low clouds (cumulus, fog/stratus,
stratocumulus, nimbostratus, cumulonimbus)
Total amount of sky covered by clouds irregardless of altitude
Options: [
Blank
None (0%)
Few or Clear (1-10%)
Isolated (10-25%)
Scattered (25-50%)
Broken (50-90%)
Overcast (90-100%)]
sky_conditions: opacity low Average opacity of low clouds observed (cumulus, fog/stratus,
stratocumulus, nimbostratus, cumulonimbus)
Options: [
Blank
Transparent (satellite optical depth = transparent)
Translucent (satellite optical depth = 3-10)
Opaque (satellite optical depth = above 10)]
This page explains how the GLOBE Clouds Team at NASA Langley
Research Center compares reported opacity to satellite data.
sky_conditions: cloud cover
mid
Total amount of sky covered by mid clouds (altostratus, altocumulus)
Total amount of sky covered by clouds irregardless of altitude
Options: [
Blank
None (0%)
Few or Clear (1-10%)
Isolated (10-25%)
Scattered (25-50%)
Broken (50-90%)
Overcast (90-100%)]
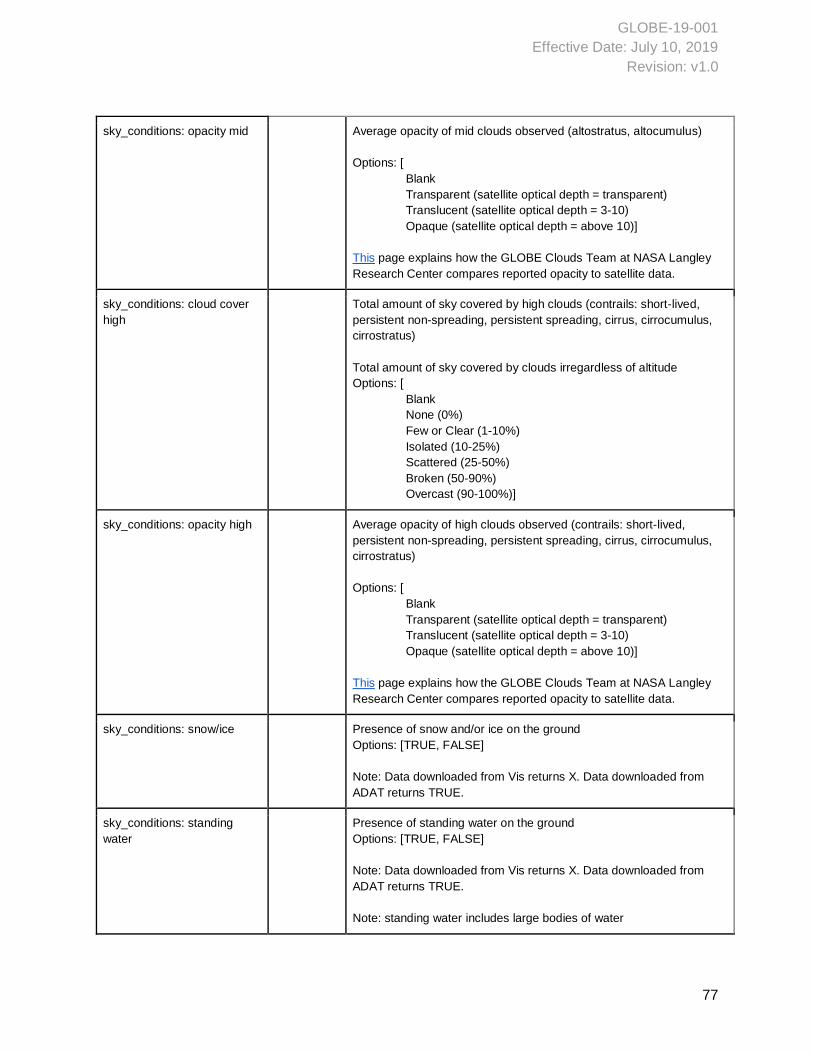
GLOBE-19-001
Effective Date: July 10, 2019
Revision: v1.0
77
sky_conditions: opacity mid Average opacity of mid clouds observed (altostratus, altocumulus)
Options: [
Blank
Transparent (satellite optical depth = transparent)
Translucent (satellite optical depth = 3-10)
Opaque (satellite optical depth = above 10)]
This page explains how the GLOBE Clouds Team at NASA Langley
Research Center compares reported opacity to satellite data.
sky_conditions: cloud cover
high
Total amount of sky covered by high clouds (contrails: short-lived,
persistent non-spreading, persistent spreading, cirrus, cirrocumulus,
cirrostratus)
Total amount of sky covered by clouds irregardless of altitude
Options: [
Blank
None (0%)
Few or Clear (1-10%)
Isolated (10-25%)
Scattered (25-50%)
Broken (50-90%)
Overcast (90-100%)]
sky_conditions: opacity high Average opacity of high clouds observed (contrails: short-lived,
persistent non-spreading, persistent spreading, cirrus, cirrocumulus,
cirrostratus)
Options: [
Blank
Transparent (satellite optical depth = transparent)
Translucent (satellite optical depth = 3-10)
Opaque (satellite optical depth = above 10)]
This page explains how the GLOBE Clouds Team at NASA Langley
Research Center compares reported opacity to satellite data.
sky_conditions: snow/ice Presence of snow and/or ice on the ground
Options: [TRUE, FALSE]
Note: Data downloaded from Vis returns X. Data downloaded from
ADAT returns TRUE.
sky_conditions: standing
water
Presence of standing water on the ground
Options: [TRUE, FALSE]
Note: Data downloaded from Vis returns X. Data downloaded from
ADAT returns TRUE.
Note: standing water includes large bodies of water
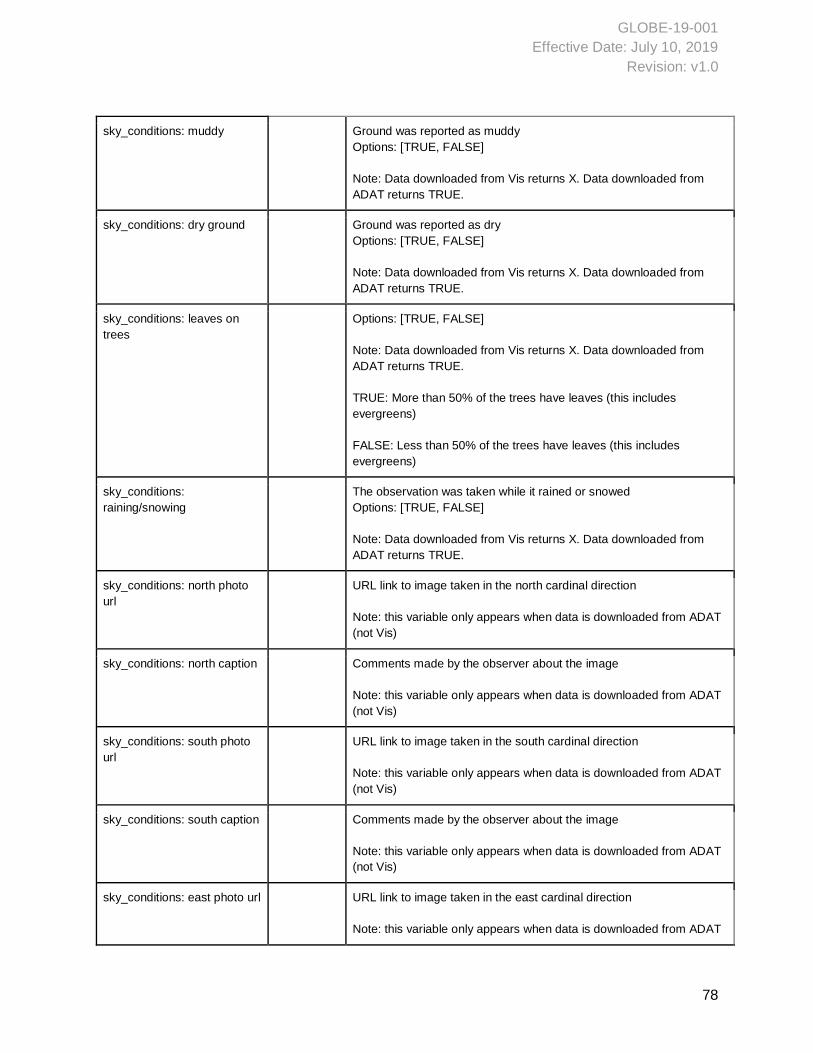
GLOBE-19-001
Effective Date: July 10, 2019
Revision: v1.0
78
sky_conditions: muddy Ground was reported as muddy
Options: [TRUE, FALSE]
Note: Data downloaded from Vis returns X. Data downloaded from
ADAT returns TRUE.
sky_conditions: dry ground Ground was reported as dry
Options: [TRUE, FALSE]
Note: Data downloaded from Vis returns X. Data downloaded from
ADAT returns TRUE.
sky_conditions: leaves on
trees
Options: [TRUE, FALSE]
Note: Data downloaded from Vis returns X. Data downloaded from
ADAT returns TRUE.
TRUE: More than 50% of the trees have leaves (this includes
evergreens)
FALSE: Less than 50% of the trees have leaves (this includes
evergreens)
sky_conditions:
raining/snowing
The observation was taken while it rained or snowed
Options: [TRUE, FALSE]
Note: Data downloaded from Vis returns X. Data downloaded from
ADAT returns TRUE.
sky_conditions: north photo
url
URL link to image taken in the north cardinal direction
Note: this variable only appears when data is downloaded from ADAT
(not Vis)
sky_conditions: north caption Comments made by the observer about the image
Note: this variable only appears when data is downloaded from ADAT
(not Vis)
sky_conditions: south photo
url
URL link to image taken in the south cardinal direction
Note: this variable only appears when data is downloaded from ADAT
(not Vis)
sky_conditions: south caption Comments made by the observer about the image
Note: this variable only appears when data is downloaded from ADAT
(not Vis)
sky_conditions: east photo url URL link to image taken in the east cardinal direction
Note: this variable only appears when data is downloaded from ADAT
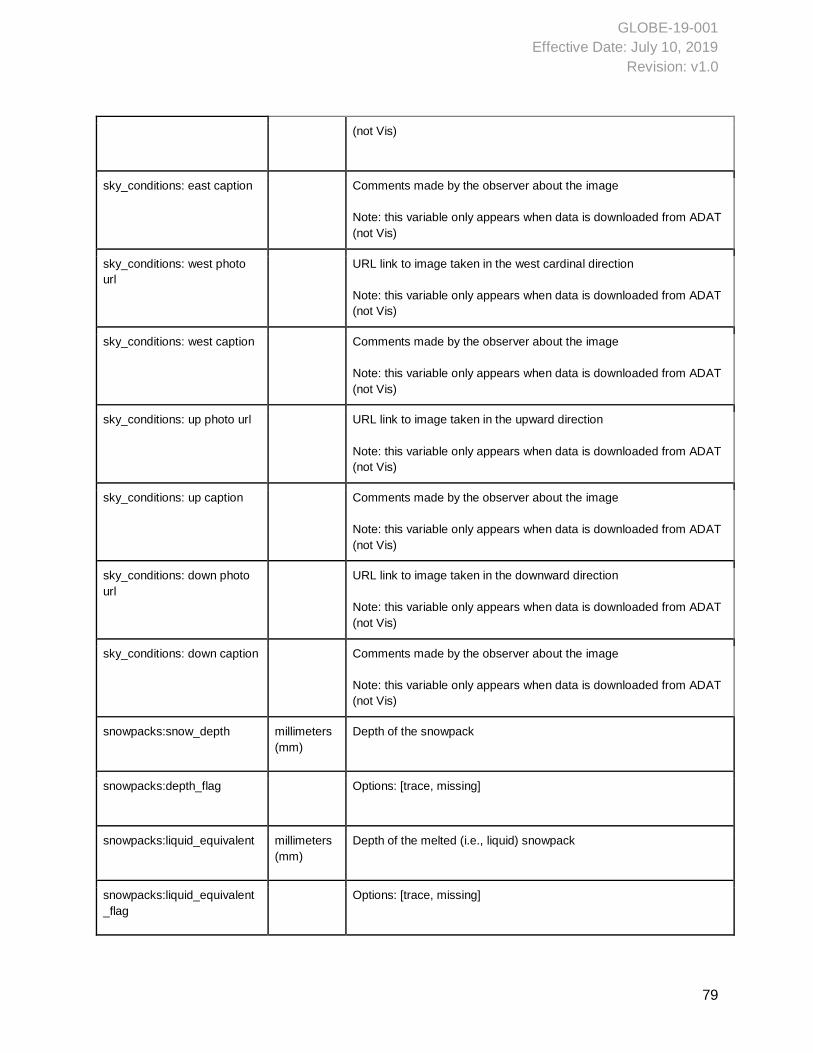
GLOBE-19-001
Effective Date: July 10, 2019
Revision: v1.0
79
(not Vis)
sky_conditions: east caption Comments made by the observer about the image
Note: this variable only appears when data is downloaded from ADAT
(not Vis)
sky_conditions: west photo
url
URL link to image taken in the west cardinal direction
Note: this variable only appears when data is downloaded from ADAT
(not Vis)
sky_conditions: west caption Comments made by the observer about the image
Note: this variable only appears when data is downloaded from ADAT
(not Vis)
sky_conditions: up photo url URL link to image taken in the upward direction
Note: this variable only appears when data is downloaded from ADAT
(not Vis)
sky_conditions: up caption Comments made by the observer about the image
Note: this variable only appears when data is downloaded from ADAT
(not Vis)
sky_conditions: down photo
url
URL link to image taken in the downward direction
Note: this variable only appears when data is downloaded from ADAT
(not Vis)
sky_conditions: down caption Comments made by the observer about the image
Note: this variable only appears when data is downloaded from ADAT
(not Vis)
snowpacks:snow_depth millimeters
(mm)
Depth of the snowpack
snowpacks:depth_flag Options: [trace, missing]
snowpacks:liquid_equivalent millimeters
(mm)
Depth of the melted (i.e., liquid) snowpack
snowpacks:liquid_equivalent
_flag
Options: [trace, missing]
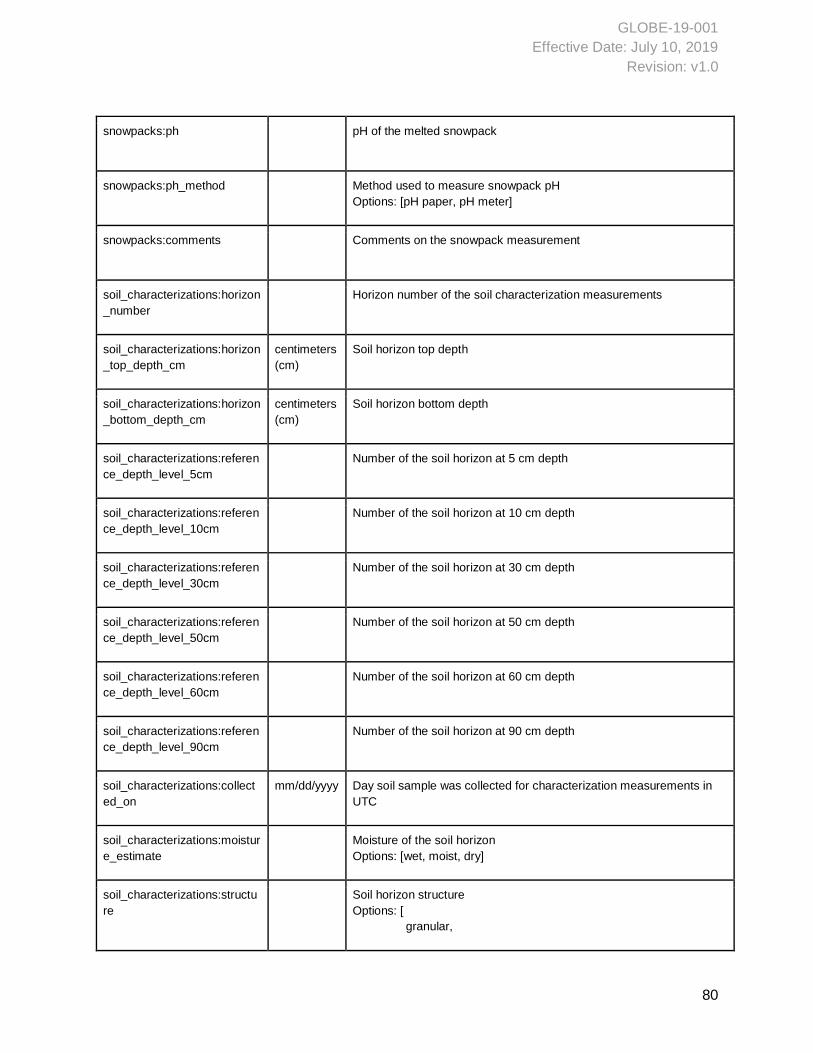
GLOBE-19-001
Effective Date: July 10, 2019
Revision: v1.0
80
snowpacks:ph pH of the melted snowpack
snowpacks:ph_method Method used to measure snowpack pH
Options: [pH paper, pH meter]
snowpacks:comments Comments on the snowpack measurement
soil_characterizations:horizon
_number
Horizon number of the soil characterization measurements
soil_characterizations:horizon
_top_depth_cm
centimeters
(cm)
Soil horizon top depth
soil_characterizations:horizon
_bottom_depth_cm
centimeters
(cm)
Soil horizon bottom depth
soil_characterizations:referen
ce_depth_level_5cm
Number of the soil horizon at 5 cm depth
soil_characterizations:referen
ce_depth_level_10cm
Number of the soil horizon at 10 cm depth
soil_characterizations:referen
ce_depth_level_30cm
Number of the soil horizon at 30 cm depth
soil_characterizations:referen
ce_depth_level_50cm
Number of the soil horizon at 50 cm depth
soil_characterizations:referen
ce_depth_level_60cm
Number of the soil horizon at 60 cm depth
soil_characterizations:referen
ce_depth_level_90cm
Number of the soil horizon at 90 cm depth
soil_characterizations:collect
ed_on
mm/dd/yyyy Day soil sample was collected for characterization measurements in
UTC
soil_characterizations:moistur
e_estimate
Moisture of the soil horizon
Options: [wet, moist, dry]
soil_characterizations:structu
re
Soil horizon structure
Options: [
granular,
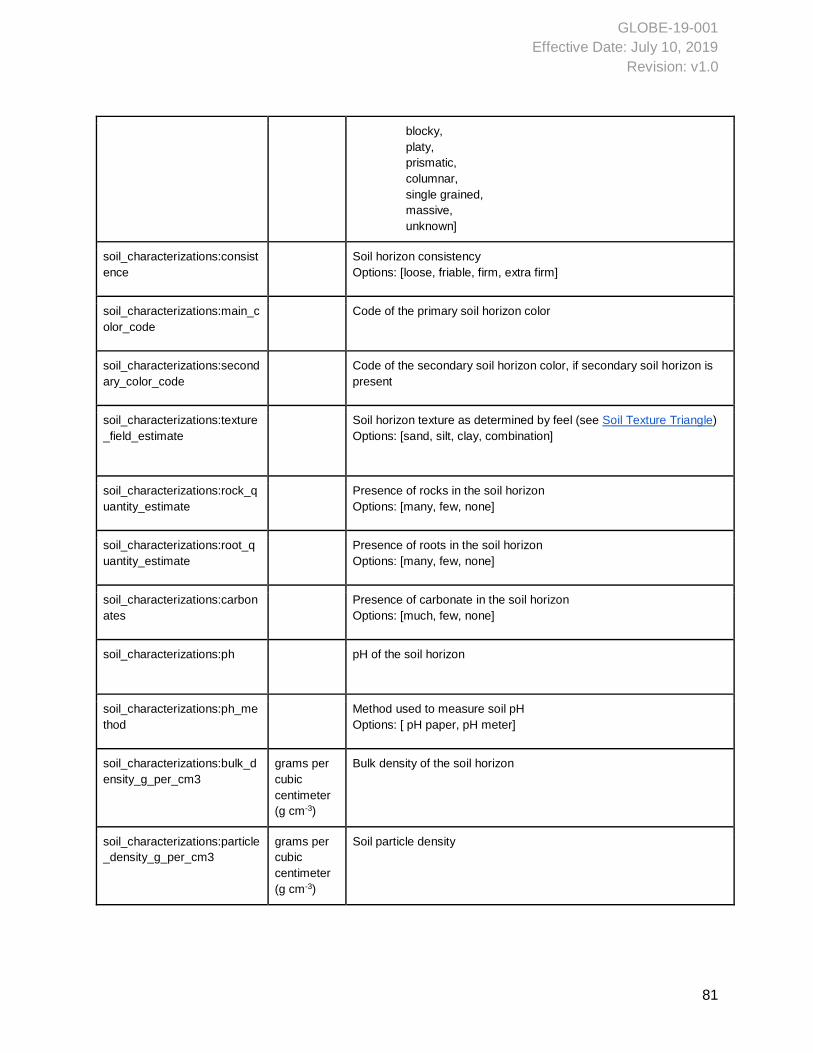
GLOBE-19-001
Effective Date: July 10, 2019
Revision: v1.0
81
blocky,
platy,
prismatic,
columnar,
single grained,
massive,
unknown]
soil_characterizations:consist
ence
Soil horizon consistency
Options: [loose, friable, firm, extra firm]
soil_characterizations:main_c
olor_code
Code of the primary soil horizon color
soil_characterizations:second
ary_color_code
Code of the secondary soil horizon color, if secondary soil horizon is
present
soil_characterizations:texture
_field_estimate
Soil horizon texture as determined by feel (see Soil Texture Triangle)
Options: [sand, silt, clay, combination]
soil_characterizations:rock_q
uantity_estimate
Presence of rocks in the soil horizon
Options: [many, few, none]
soil_characterizations:root_q
uantity_estimate
Presence of roots in the soil horizon
Options: [many, few, none]
soil_characterizations:carbon
ates
Presence of carbonate in the soil horizon
Options: [much, few, none]
soil_characterizations:ph pH of the soil horizon
soil_characterizations:ph_me
thod
Method used to measure soil pH
Options: [ pH paper, pH meter]
soil_characterizations:bulk_d
ensity_g_per_cm3
grams per
cubic
centimeter
(g cm-3)
Bulk density of the soil horizon
soil_characterizations:particle
_density_g_per_cm3
grams per
cubic
centimeter
(g cm-3)
Soil particle density
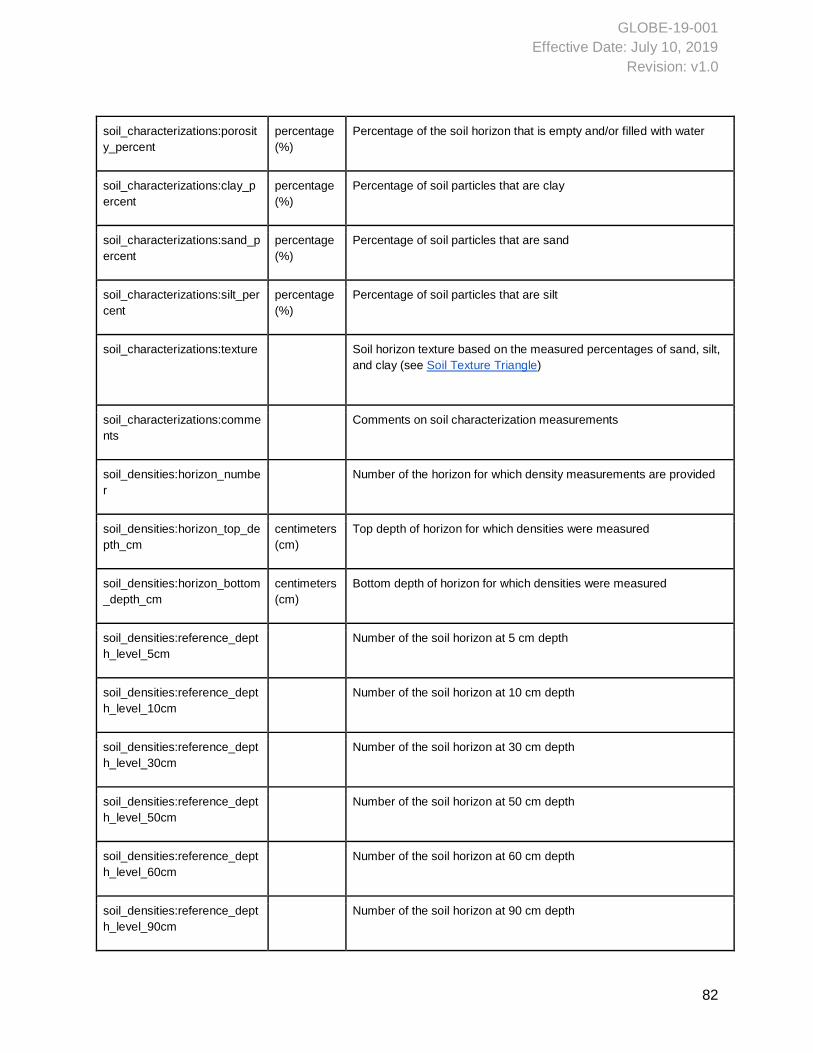
GLOBE-19-001
Effective Date: July 10, 2019
Revision: v1.0
82
soil_characterizations:porosit
y_percent
percentage
(%)
Percentage of the soil horizon that is empty and/or filled with water
soil_characterizations:clay_p
ercent
percentage
(%)
Percentage of soil particles that are clay
soil_characterizations:sand_p
ercent
percentage
(%)
Percentage of soil particles that are sand
soil_characterizations:silt_per
cent
percentage
(%)
Percentage of soil particles that are silt
soil_characterizations:texture Soil horizon texture based on the measured percentages of sand, silt,
and clay (see Soil Texture Triangle)
soil_characterizations:comme
nts
Comments on soil characterization measurements
soil_densities:horizon_numbe
r
Number of the horizon for which density measurements are provided
soil_densities:horizon_top_de
pth_cm
centimeters
(cm)
Top depth of horizon for which densities were measured
soil_densities:horizon_bottom
_depth_cm
centimeters
(cm)
Bottom depth of horizon for which densities were measured
soil_densities:reference_dept
h_level_5cm
Number of the soil horizon at 5 cm depth
soil_densities:reference_dept
h_level_10cm
Number of the soil horizon at 10 cm depth
soil_densities:reference_dept
h_level_30cm
Number of the soil horizon at 30 cm depth
soil_densities:reference_dept
h_level_50cm
Number of the soil horizon at 50 cm depth
soil_densities:reference_dept
h_level_60cm
Number of the soil horizon at 60 cm depth
soil_densities:reference_dept
h_level_90cm
Number of the soil horizon at 90 cm depth
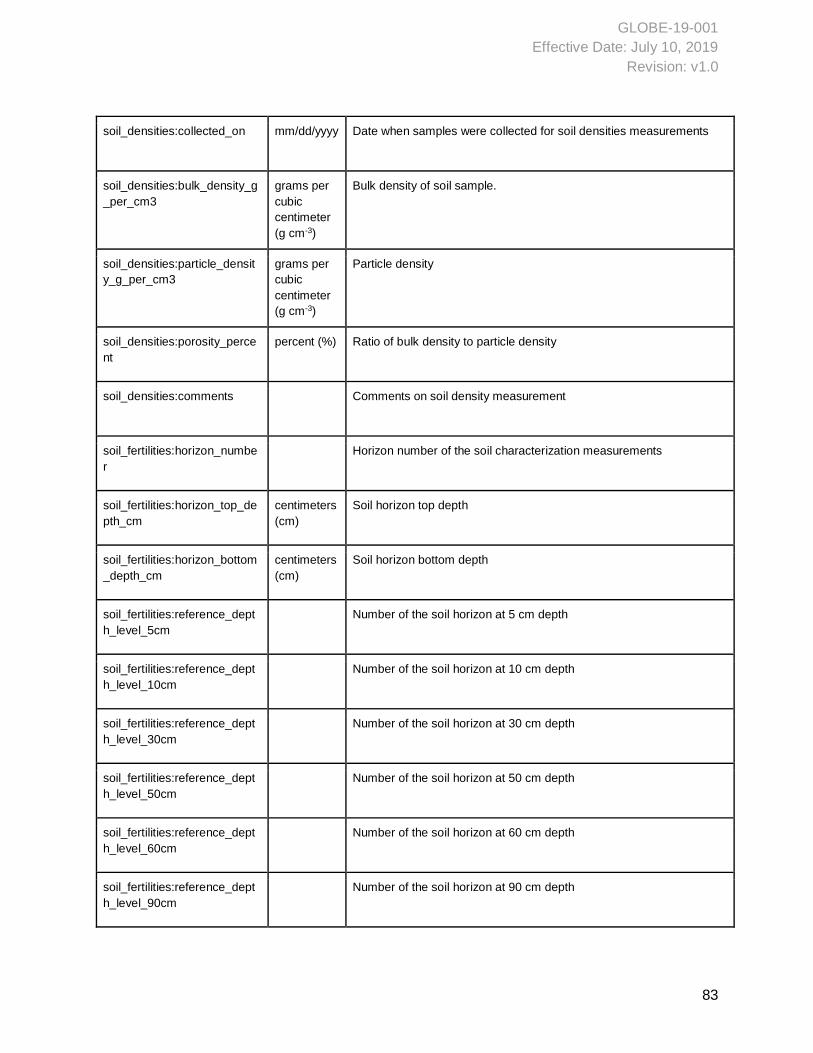
GLOBE-19-001
Effective Date: July 10, 2019
Revision: v1.0
83
soil_densities:collected_on mm/dd/yyyy Date when samples were collected for soil densities measurements
soil_densities:bulk_density_g
_per_cm3
grams per
cubic
centimeter
(g cm-3)
Bulk density of soil sample.
soil_densities:particle_densit
y_g_per_cm3
grams per
cubic
centimeter
(g cm-3)
Particle density
soil_densities:porosity_perce
nt
percent (%) Ratio of bulk density to particle density
soil_densities:comments Comments on soil density measurement
soil_fertilities:horizon_numbe
r
Horizon number of the soil characterization measurements
soil_fertilities:horizon_top_de
pth_cm
centimeters
(cm)
Soil horizon top depth
soil_fertilities:horizon_bottom
_depth_cm
centimeters
(cm)
Soil horizon bottom depth
soil_fertilities:reference_dept
h_level_5cm
Number of the soil horizon at 5 cm depth
soil_fertilities:reference_dept
h_level_10cm
Number of the soil horizon at 10 cm depth
soil_fertilities:reference_dept
h_level_30cm
Number of the soil horizon at 30 cm depth
soil_fertilities:reference_dept
h_level_50cm
Number of the soil horizon at 50 cm depth
soil_fertilities:reference_dept
h_level_60cm
Number of the soil horizon at 60 cm depth
soil_fertilities:reference_dept
h_level_90cm
Number of the soil horizon at 90 cm depth
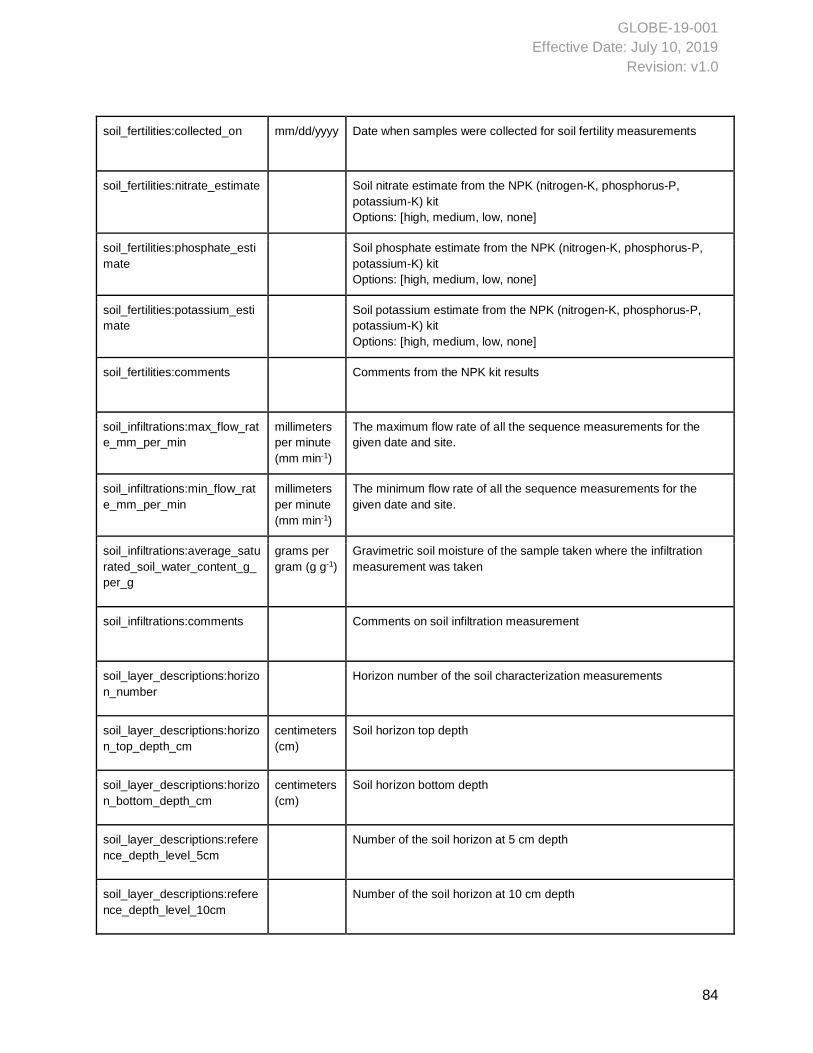
GLOBE-19-001
Effective Date: July 10, 2019
Revision: v1.0
84
soil_fertilities:collected_on mm/dd/yyyy Date when samples were collected for soil fertility measurements
soil_fertilities:nitrate_estimate Soil nitrate estimate from the NPK (nitrogen-K, phosphorus-P,
potassium-K) kit
Options: [high, medium, low, none]
soil_fertilities:phosphate_esti
mate
Soil phosphate estimate from the NPK (nitrogen-K, phosphorus-P,
potassium-K) kit
Options: [high, medium, low, none]
soil_fertilities:potassium_esti
mate
Soil potassium estimate from the NPK (nitrogen-K, phosphorus-P,
potassium-K) kit
Options: [high, medium, low, none]
soil_fertilities:comments Comments from the NPK kit results
soil_infiltrations:max_flow_rat
e_mm_per_min
millimeters
per minute
(mm min-1)
The maximum flow rate of all the sequence measurements for the
given date and site.
soil_infiltrations:min_flow_rat
e_mm_per_min
millimeters
per minute
(mm min-1)
The minimum flow rate of all the sequence measurements for the
given date and site.
soil_infiltrations:average_satu
rated_soil_water_content_g_
per_g
grams per
gram (g g-1)
Gravimetric soil moisture of the sample taken where the infiltration
measurement was taken
soil_infiltrations:comments Comments on soil infiltration measurement
soil_layer_descriptions:horizo
n_number
Horizon number of the soil characterization measurements
soil_layer_descriptions:horizo
n_top_depth_cm
centimeters
(cm)
Soil horizon top depth
soil_layer_descriptions:horizo
n_bottom_depth_cm
centimeters
(cm)
Soil horizon bottom depth
soil_layer_descriptions:refere
nce_depth_level_5cm
Number of the soil horizon at 5 cm depth
soil_layer_descriptions:refere
nce_depth_level_10cm
Number of the soil horizon at 10 cm depth
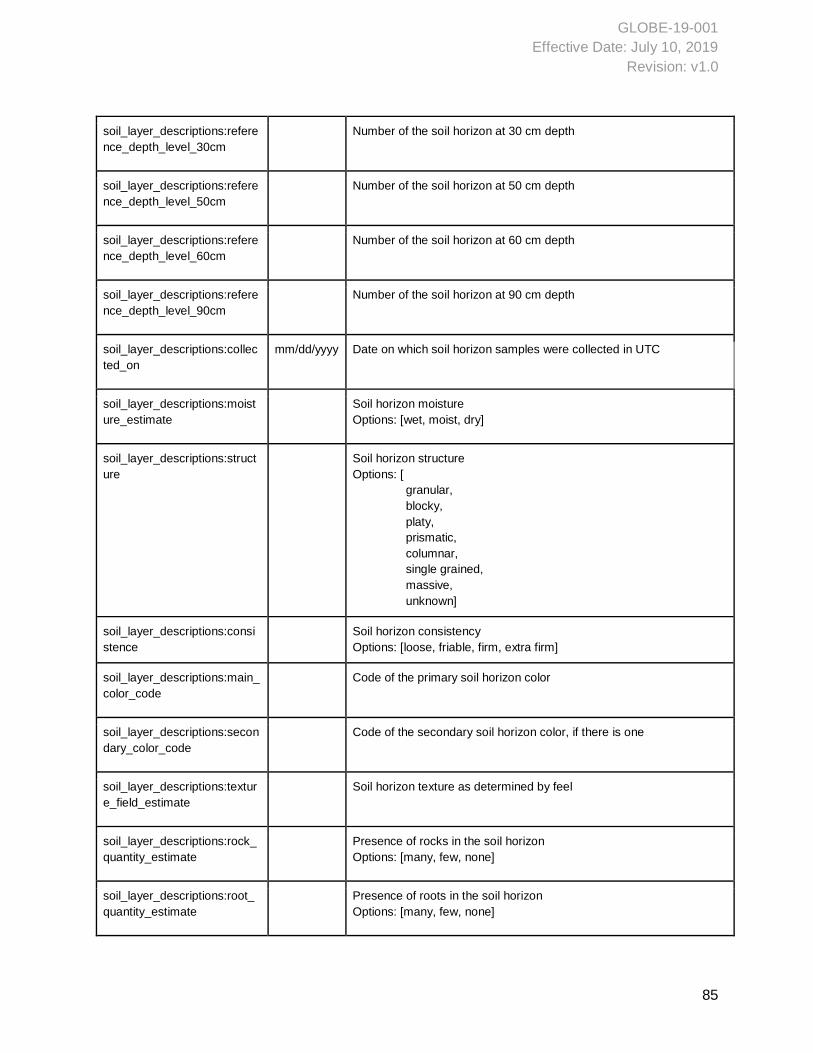
GLOBE-19-001
Effective Date: July 10, 2019
Revision: v1.0
85
soil_layer_descriptions:refere
nce_depth_level_30cm
Number of the soil horizon at 30 cm depth
soil_layer_descriptions:refere
nce_depth_level_50cm
Number of the soil horizon at 50 cm depth
soil_layer_descriptions:refere
nce_depth_level_60cm
Number of the soil horizon at 60 cm depth
soil_layer_descriptions:refere
nce_depth_level_90cm
Number of the soil horizon at 90 cm depth
soil_layer_descriptions:collec
ted_on
mm/dd/yyyy Date on which soil horizon samples were collected in UTC
soil_layer_descriptions:moist
ure_estimate
Soil horizon moisture
Options: [wet, moist, dry]
soil_layer_descriptions:struct
ure
Soil horizon structure
Options: [
granular,
blocky,
platy,
prismatic,
columnar,
single grained,
massive,
unknown]
soil_layer_descriptions:consi
stence
Soil horizon consistency
Options: [loose, friable, firm, extra firm]
soil_layer_descriptions:main_
color_code
Code of the primary soil horizon color
soil_layer_descriptions:secon
dary_color_code
Code of the secondary soil horizon color, if there is one
soil_layer_descriptions:textur
e_field_estimate
Soil horizon texture as determined by feel
soil_layer_descriptions:rock_
quantity_estimate
Presence of rocks in the soil horizon
Options: [many, few, none]
soil_layer_descriptions:root_
quantity_estimate
Presence of roots in the soil horizon
Options: [many, few, none]
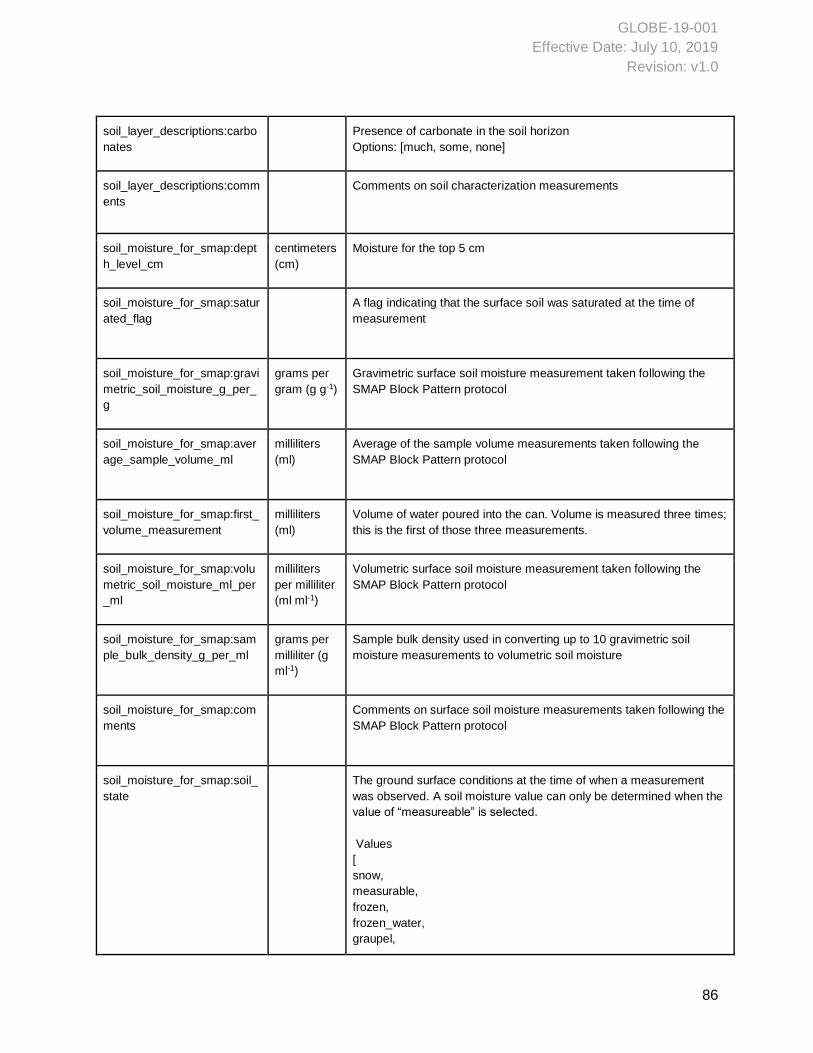
GLOBE-19-001
Effective Date: July 10, 2019
Revision: v1.0
86
soil_layer_descriptions:carbo
nates
Presence of carbonate in the soil horizon
Options: [much, some, none]
soil_layer_descriptions:comm
ents
Comments on soil characterization measurements
soil_moisture_for_smap:dept
h_level_cm
centimeters
(cm)
Moisture for the top 5 cm
soil_moisture_for_smap:satur
ated_flag
A flag indicating that the surface soil was saturated at the time of
measurement
soil_moisture_for_smap:gravi
metric_soil_moisture_g_per_
g
grams per
gram (g g-1)
Gravimetric surface soil moisture measurement taken following the
SMAP Block Pattern protocol
soil_moisture_for_smap:aver
age_sample_volume_ml
milliliters
(ml)
Average of the sample volume measurements taken following the
SMAP Block Pattern protocol
soil_moisture_for_smap:first_
volume_measurement
milliliters
(ml)
Volume of water poured into the can. Volume is measured three times;
this is the first of those three measurements.
soil_moisture_for_smap:volu
metric_soil_moisture_ml_per
_ml
milliliters
per milliliter
(ml ml-1)
Volumetric surface soil moisture measurement taken following the
SMAP Block Pattern protocol
soil_moisture_for_smap:sam
ple_bulk_density_g_per_ml
grams per
milliliter (g
ml-1)
Sample bulk density used in converting up to 10 gravimetric soil
moisture measurements to volumetric soil moisture
soil_moisture_for_smap:com
ments
Comments on surface soil moisture measurements taken following the
SMAP Block Pattern protocol
soil_moisture_for_smap:soil_
state
The ground surface conditions at the time of when a measurement
was observed. A soil moisture value can only be determined when the
value of “measureable” is selected.
Values
[
snow,
measurable,
frozen,
frozen_water,
graupel,
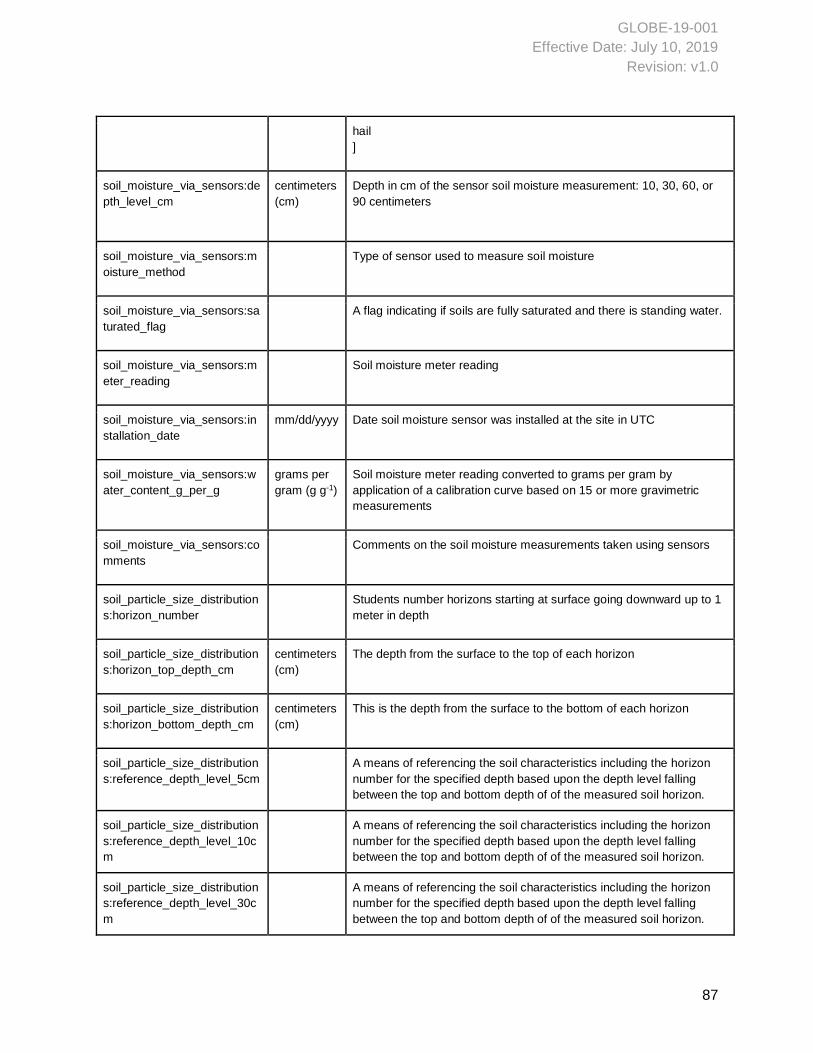
GLOBE-19-001
Effective Date: July 10, 2019
Revision: v1.0
87
hail
]
soil_moisture_via_sensors:de
pth_level_cm
centimeters
(cm)
Depth in cm of the sensor soil moisture measurement: 10, 30, 60, or
90 centimeters
soil_moisture_via_sensors:m
oisture_method
Type of sensor used to measure soil moisture
soil_moisture_via_sensors:sa
turated_flag
A flag indicating if soils are fully saturated and there is standing water.
soil_moisture_via_sensors:m
eter_reading
Soil moisture meter reading
soil_moisture_via_sensors:in
stallation_date
mm/dd/yyyy Date soil moisture sensor was installed at the site in UTC
soil_moisture_via_sensors:w
ater_content_g_per_g
grams per
gram (g g-1)
Soil moisture meter reading converted to grams per gram by
application of a calibration curve based on 15 or more gravimetric
measurements
soil_moisture_via_sensors:co
mments
Comments on the soil moisture measurements taken using sensors
soil_particle_size_distribution
s:horizon_number
Students number horizons starting at surface going downward up to 1
meter in depth
soil_particle_size_distribution
s:horizon_top_depth_cm
centimeters
(cm)
The depth from the surface to the top of each horizon
soil_particle_size_distribution
s:horizon_bottom_depth_cm
centimeters
(cm)
This is the depth from the surface to the bottom of each horizon
soil_particle_size_distribution
s:reference_depth_level_5cm
A means of referencing the soil characteristics including the horizon
number for the specified depth based upon the depth level falling
between the top and bottom depth of of the measured soil horizon.
soil_particle_size_distribution
s:reference_depth_level_10c
m
A means of referencing the soil characteristics including the horizon
number for the specified depth based upon the depth level falling
between the top and bottom depth of of the measured soil horizon.
soil_particle_size_distribution
s:reference_depth_level_30c
m
A means of referencing the soil characteristics including the horizon
number for the specified depth based upon the depth level falling
between the top and bottom depth of of the measured soil horizon.
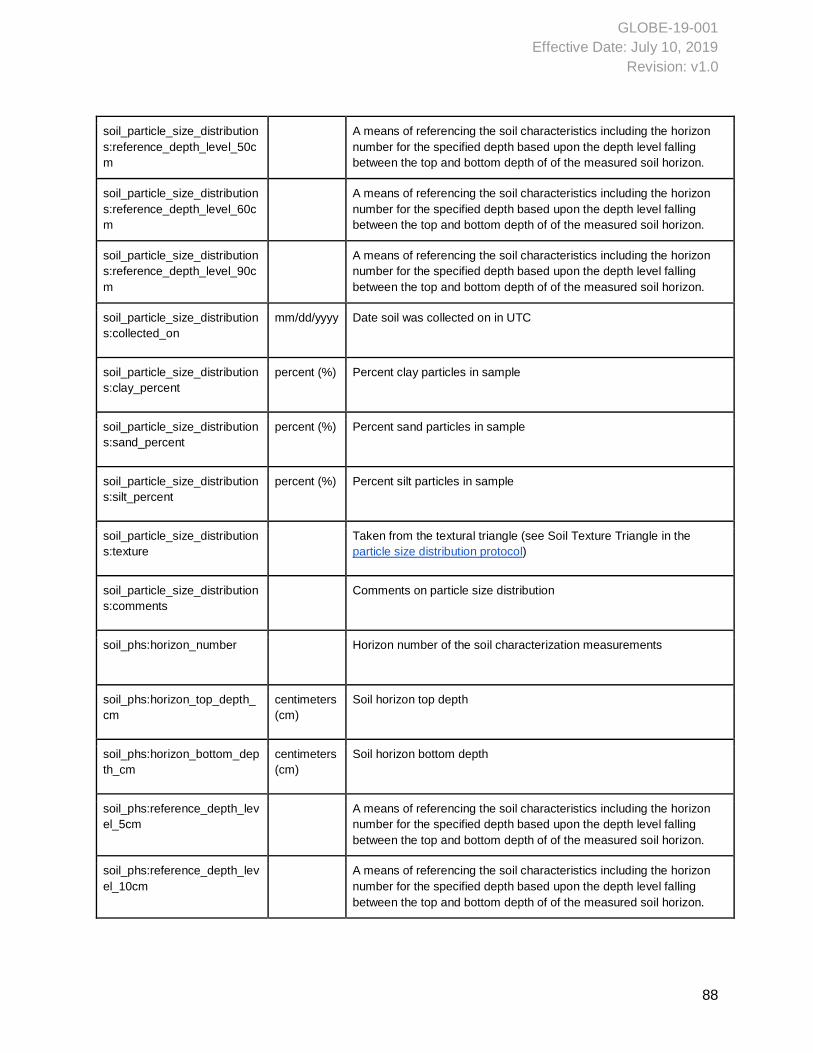
GLOBE-19-001
Effective Date: July 10, 2019
Revision: v1.0
88
soil_particle_size_distribution
s:reference_depth_level_50c
m
A means of referencing the soil characteristics including the horizon
number for the specified depth based upon the depth level falling
between the top and bottom depth of of the measured soil horizon.
soil_particle_size_distribution
s:reference_depth_level_60c
m
A means of referencing the soil characteristics including the horizon
number for the specified depth based upon the depth level falling
between the top and bottom depth of of the measured soil horizon.
soil_particle_size_distribution
s:reference_depth_level_90c
m
A means of referencing the soil characteristics including the horizon
number for the specified depth based upon the depth level falling
between the top and bottom depth of of the measured soil horizon.
soil_particle_size_distribution
s:collected_on
mm/dd/yyyy Date soil was collected on in UTC
soil_particle_size_distribution
s:clay_percent
percent (%) Percent clay particles in sample
soil_particle_size_distribution
s:sand_percent
percent (%) Percent sand particles in sample
soil_particle_size_distribution
s:silt_percent
percent (%) Percent silt particles in sample
soil_particle_size_distribution
s:texture
Taken from the textural triangle (see Soil Texture Triangle in the
particle size distribution protocol)
soil_particle_size_distribution
s:comments
Comments on particle size distribution
soil_phs:horizon_number Horizon number of the soil characterization measurements
soil_phs:horizon_top_depth_
cm
centimeters
(cm)
Soil horizon top depth
soil_phs:horizon_bottom_dep
th_cm
centimeters
(cm)
Soil horizon bottom depth
soil_phs:reference_depth_lev
el_5cm
A means of referencing the soil characteristics including the horizon
number for the specified depth based upon the depth level falling
between the top and bottom depth of of the measured soil horizon.
soil_phs:reference_depth_lev
el_10cm
A means of referencing the soil characteristics including the horizon
number for the specified depth based upon the depth level falling
between the top and bottom depth of of the measured soil horizon.
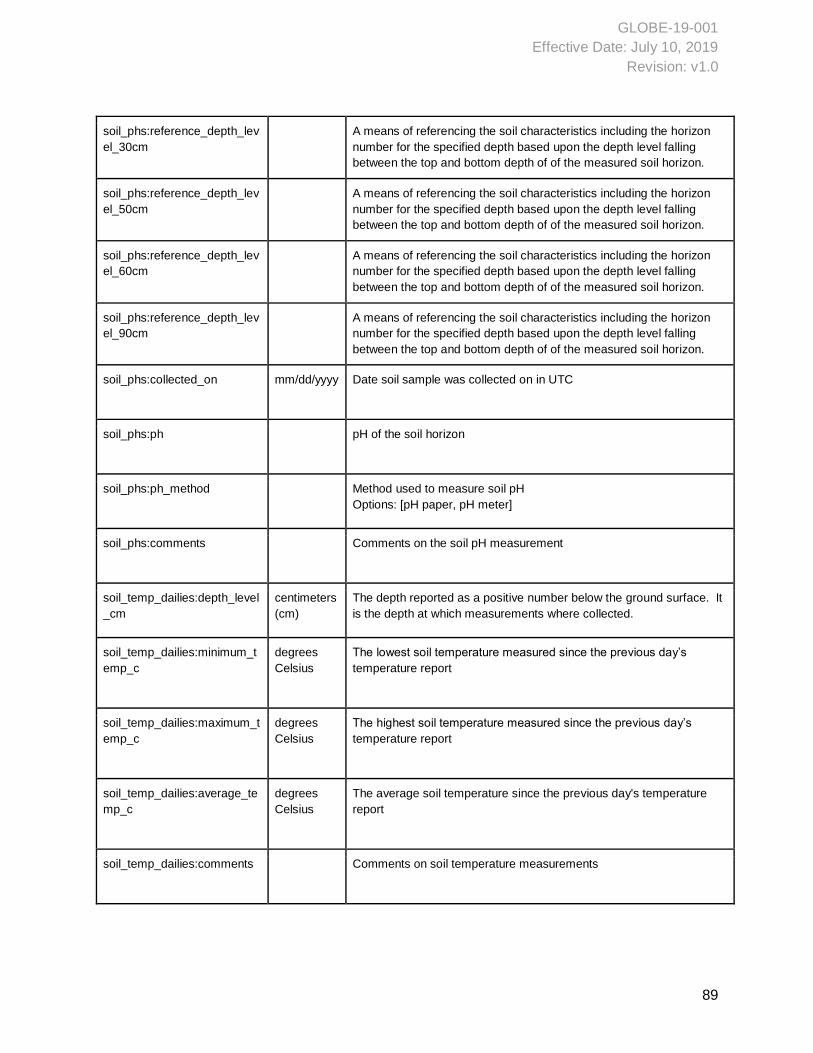
GLOBE-19-001
Effective Date: July 10, 2019
Revision: v1.0
89
soil_phs:reference_depth_lev
el_30cm
A means of referencing the soil characteristics including the horizon
number for the specified depth based upon the depth level falling
between the top and bottom depth of of the measured soil horizon.
soil_phs:reference_depth_lev
el_50cm
A means of referencing the soil characteristics including the horizon
number for the specified depth based upon the depth level falling
between the top and bottom depth of of the measured soil horizon.
soil_phs:reference_depth_lev
el_60cm
A means of referencing the soil characteristics including the horizon
number for the specified depth based upon the depth level falling
between the top and bottom depth of of the measured soil horizon.
soil_phs:reference_depth_lev
el_90cm
A means of referencing the soil characteristics including the horizon
number for the specified depth based upon the depth level falling
between the top and bottom depth of of the measured soil horizon.
soil_phs:collected_on mm/dd/yyyy Date soil sample was collected on in UTC
soil_phs:ph pH of the soil horizon
soil_phs:ph_method Method used to measure soil pH
Options: [pH paper, pH meter]
soil_phs:comments Comments on the soil pH measurement
soil_temp_dailies:depth_level
_cm
centimeters
(cm)
The depth reported as a positive number below the ground surface. It
is the depth at which measurements where collected.
soil_temp_dailies:minimum_t
emp_c
degrees
Celsius
The lowest soil temperature measured since the previous day’s
temperature report
soil_temp_dailies:maximum_t
emp_c
degrees
Celsius
The highest soil temperature measured since the previous day’s
temperature report
soil_temp_dailies:average_te
mp_c
degrees
Celsius
The average soil temperature since the previous day's temperature
report
soil_temp_dailies:comments Comments on soil temperature measurements
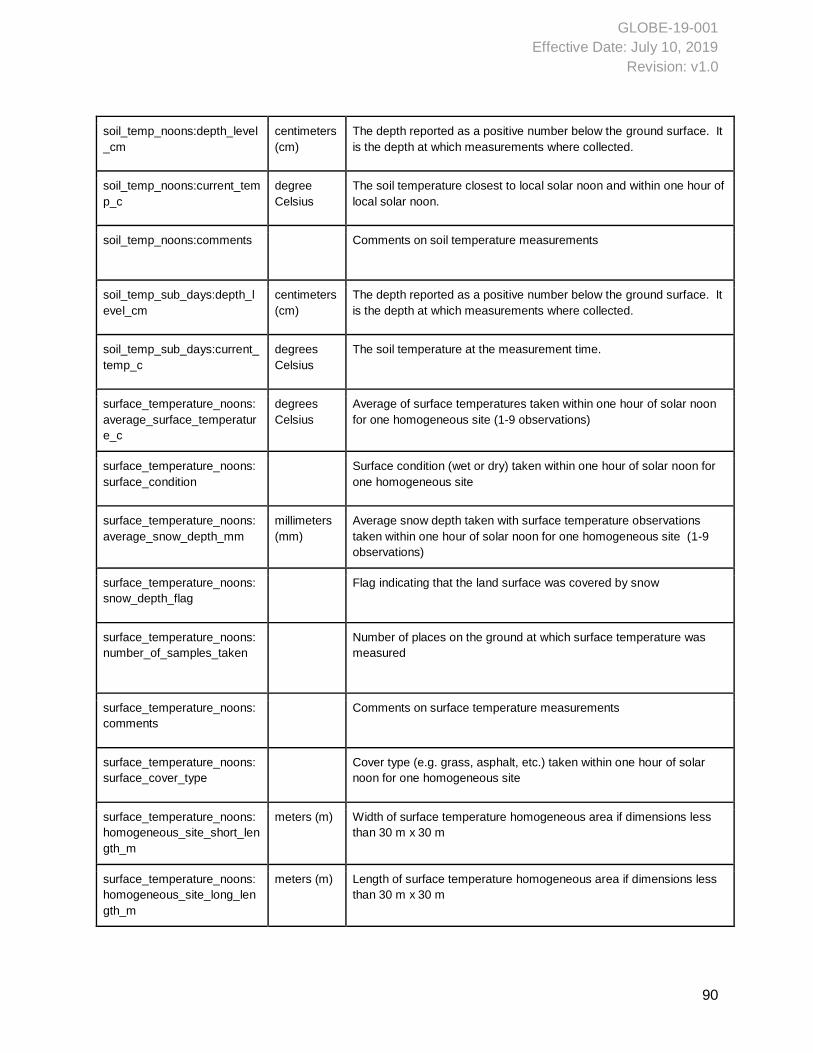
GLOBE-19-001
Effective Date: July 10, 2019
Revision: v1.0
90
soil_temp_noons:depth_level
_cm
centimeters
(cm)
The depth reported as a positive number below the ground surface. It
is the depth at which measurements where collected.
soil_temp_noons:current_tem
p_c
degree
Celsius
The soil temperature closest to local solar noon and within one hour of
local solar noon.
soil_temp_noons:comments Comments on soil temperature measurements
soil_temp_sub_days:depth_l
evel_cm
centimeters
(cm)
The depth reported as a positive number below the ground surface. It
is the depth at which measurements where collected.
soil_temp_sub_days:current_
temp_c
degrees
Celsius
The soil temperature at the measurement time.
surface_temperature_noons:
average_surface_temperatur
e_c
degrees
Celsius
Average of surface temperatures taken within one hour of solar noon
for one homogeneous site (1-9 observations)
surface_temperature_noons:
surface_condition
Surface condition (wet or dry) taken within one hour of solar noon for
one homogeneous site
surface_temperature_noons:
average_snow_depth_mm
millimeters
(mm)
Average snow depth taken with surface temperature observations
taken within one hour of solar noon for one homogeneous site (1-9
observations)
surface_temperature_noons:
snow_depth_flag
Flag indicating that the land surface was covered by snow
surface_temperature_noons:
number_of_samples_taken
Number of places on the ground at which surface temperature was
measured
surface_temperature_noons:
comments
Comments on surface temperature measurements
surface_temperature_noons:
surface_cover_type
Cover type (e.g. grass, asphalt, etc.) taken within one hour of solar
noon for one homogeneous site
surface_temperature_noons:
homogeneous_site_short_len
gth_m
meters (m) Width of surface temperature homogeneous area if dimensions less
than 30 m x 30 m
surface_temperature_noons:
homogeneous_site_long_len
gth_m
meters (m) Length of surface temperature homogeneous area if dimensions less
than 30 m x 30 m
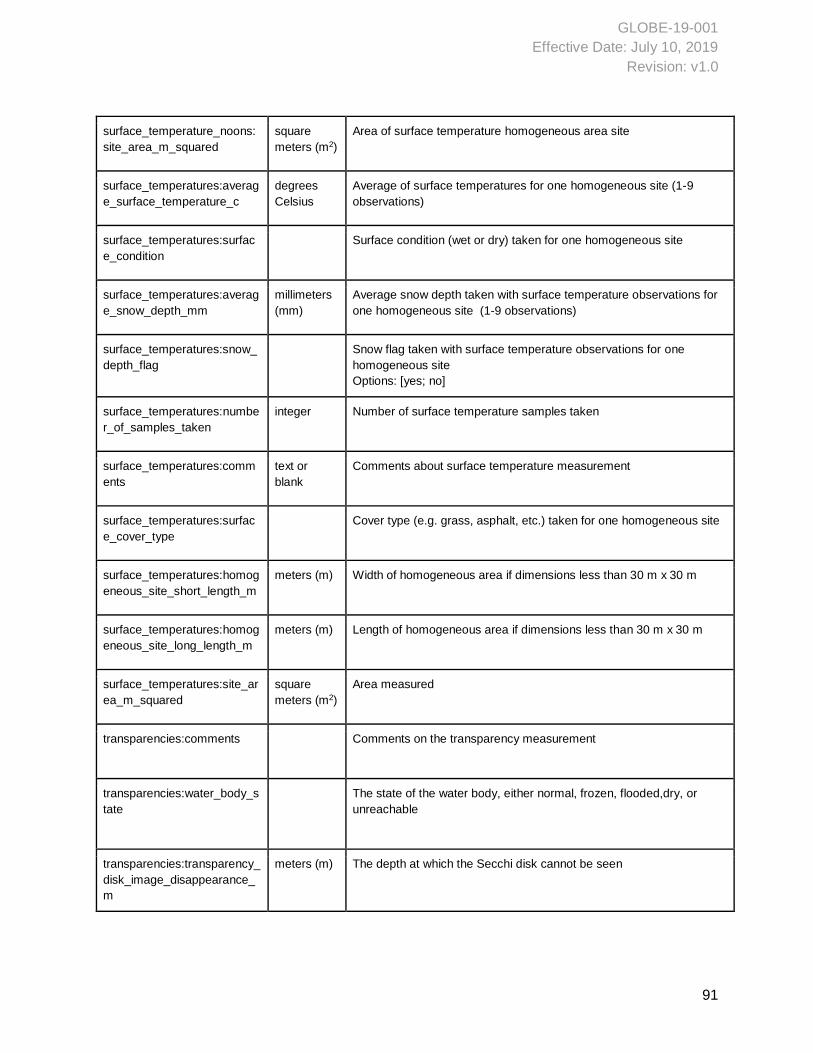
GLOBE-19-001
Effective Date: July 10, 2019
Revision: v1.0
91
surface_temperature_noons:
site_area_m_squared
square
meters (m2)
Area of surface temperature homogeneous area site
surface_temperatures:averag
e_surface_temperature_c
degrees
Celsius
Average of surface temperatures for one homogeneous site (1-9
observations)
surface_temperatures:surfac
e_condition
Surface condition (wet or dry) taken for one homogeneous site
surface_temperatures:averag
e_snow_depth_mm
millimeters
(mm)
Average snow depth taken with surface temperature observations for
one homogeneous site (1-9 observations)
surface_temperatures:snow_
depth_flag
Snow flag taken with surface temperature observations for one
homogeneous site
Options: [yes; no]
surface_temperatures:numbe
r_of_samples_taken
integer Number of surface temperature samples taken
surface_temperatures:comm
ents
text or
blank
Comments about surface temperature measurement
surface_temperatures:surfac
e_cover_type
Cover type (e.g. grass, asphalt, etc.) taken for one homogeneous site
surface_temperatures:homog
eneous_site_short_length_m
meters (m) Width of homogeneous area if dimensions less than 30 m x 30 m
surface_temperatures:homog
eneous_site_long_length_m
meters (m) Length of homogeneous area if dimensions less than 30 m x 30 m
surface_temperatures:site_ar
ea_m_squared
square
meters (m2)
Area measured
transparencies:comments Comments on the transparency measurement
transparencies:water_body_s
tate
The state of the water body, either normal, frozen, flooded,dry, or
unreachable
transparencies:transparency_
disk_image_disappearance_
m
meters (m) The depth at which the Secchi disk cannot be seen
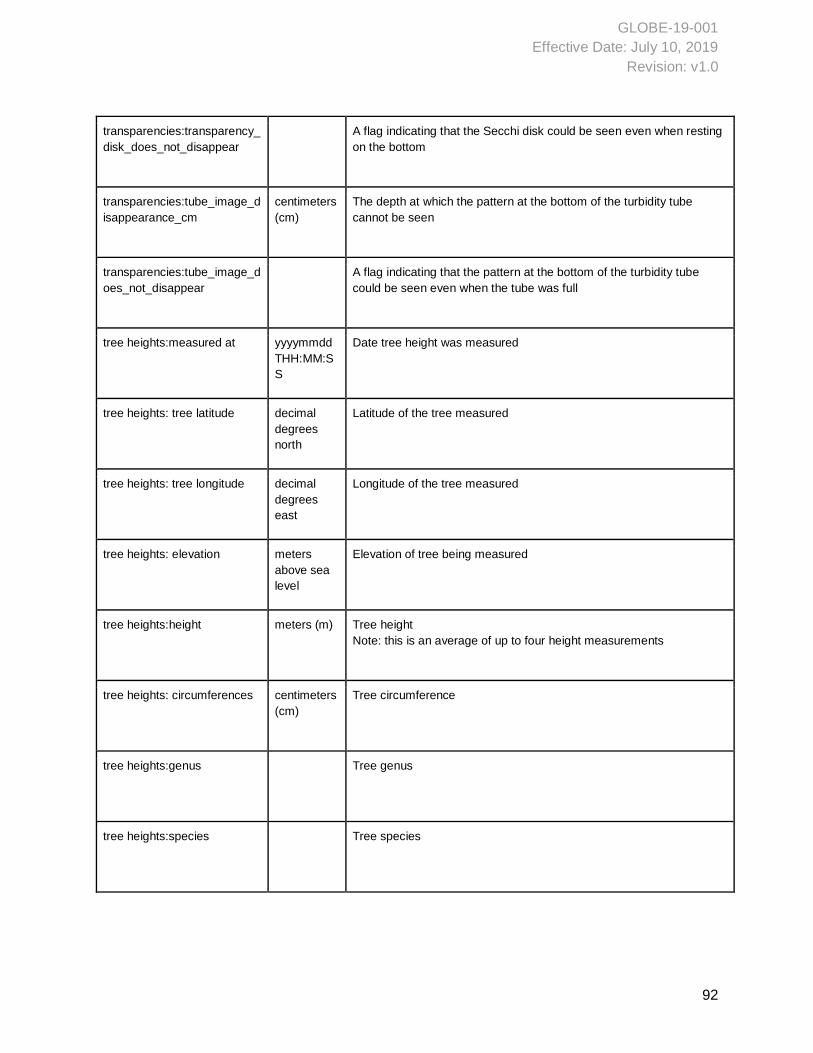
GLOBE-19-001
Effective Date: July 10, 2019
Revision: v1.0
92
transparencies:transparency_
disk_does_not_disappear
A flag indicating that the Secchi disk could be seen even when resting
on the bottom
transparencies:tube_image_d
isappearance_cm
centimeters
(cm)
The depth at which the pattern at the bottom of the turbidity tube
cannot be seen
transparencies:tube_image_d
oes_not_disappear
A flag indicating that the pattern at the bottom of the turbidity tube
could be seen even when the tube was full
tree heights:measured at yyyymmdd
THH:MM:S
S
Date tree height was measured
tree heights: tree latitude decimal
degrees
north
Latitude of the tree measured
tree heights: tree longitude decimal
degrees
east
Longitude of the tree measured
tree heights: elevation meters
above sea
level
Elevation of tree being measured
tree heights:height meters (m) Tree height
Note: this is an average of up to four height measurements
tree heights: circumferences centimeters
(cm)
Tree circumference
tree heights:genus Tree genus
tree heights:species Tree species
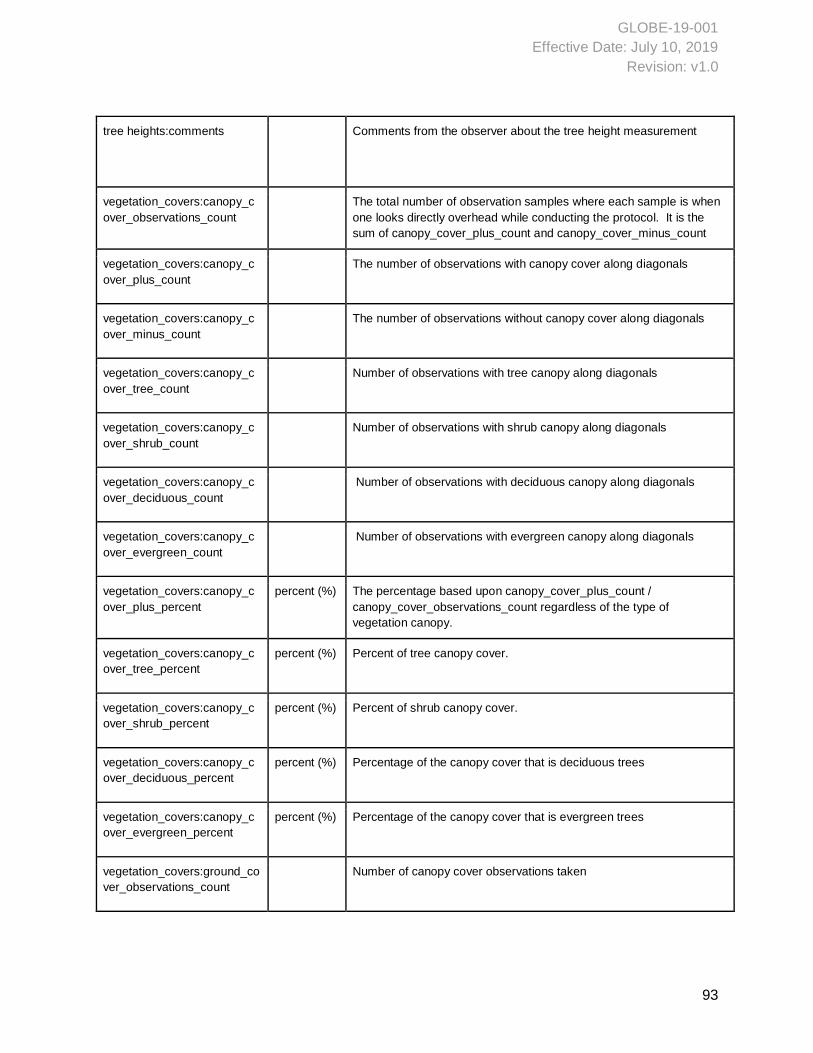
GLOBE-19-001
Effective Date: July 10, 2019
Revision: v1.0
93
tree heights:comments Comments from the observer about the tree height measurement
vegetation_covers:canopy_c
over_observations_count
The total number of observation samples where each sample is when
one looks directly overhead while conducting the protocol. It is the
sum of canopy_cover_plus_count and canopy_cover_minus_count
vegetation_covers:canopy_c
over_plus_count
The number of observations with canopy cover along diagonals
vegetation_covers:canopy_c
over_minus_count
The number of observations without canopy cover along diagonals
vegetation_covers:canopy_c
over_tree_count
Number of observations with tree canopy along diagonals
vegetation_covers:canopy_c
over_shrub_count
Number of observations with shrub canopy along diagonals
vegetation_covers:canopy_c
over_deciduous_count
Number of observations with deciduous canopy along diagonals
vegetation_covers:canopy_c
over_evergreen_count
Number of observations with evergreen canopy along diagonals
vegetation_covers:canopy_c
over_plus_percent
percent (%) The percentage based upon canopy_cover_plus_count /
canopy_cover_observations_count regardless of the type of
vegetation canopy.
vegetation_covers:canopy_c
over_tree_percent
percent (%) Percent of tree canopy cover.
vegetation_covers:canopy_c
over_shrub_percent
percent (%) Percent of shrub canopy cover.
vegetation_covers:canopy_c
over_deciduous_percent
percent (%) Percentage of the canopy cover that is deciduous trees
vegetation_covers:canopy_c
over_evergreen_percent
percent (%) Percentage of the canopy cover that is evergreen trees
vegetation_covers:ground_co
ver_observations_count
Number of canopy cover observations taken
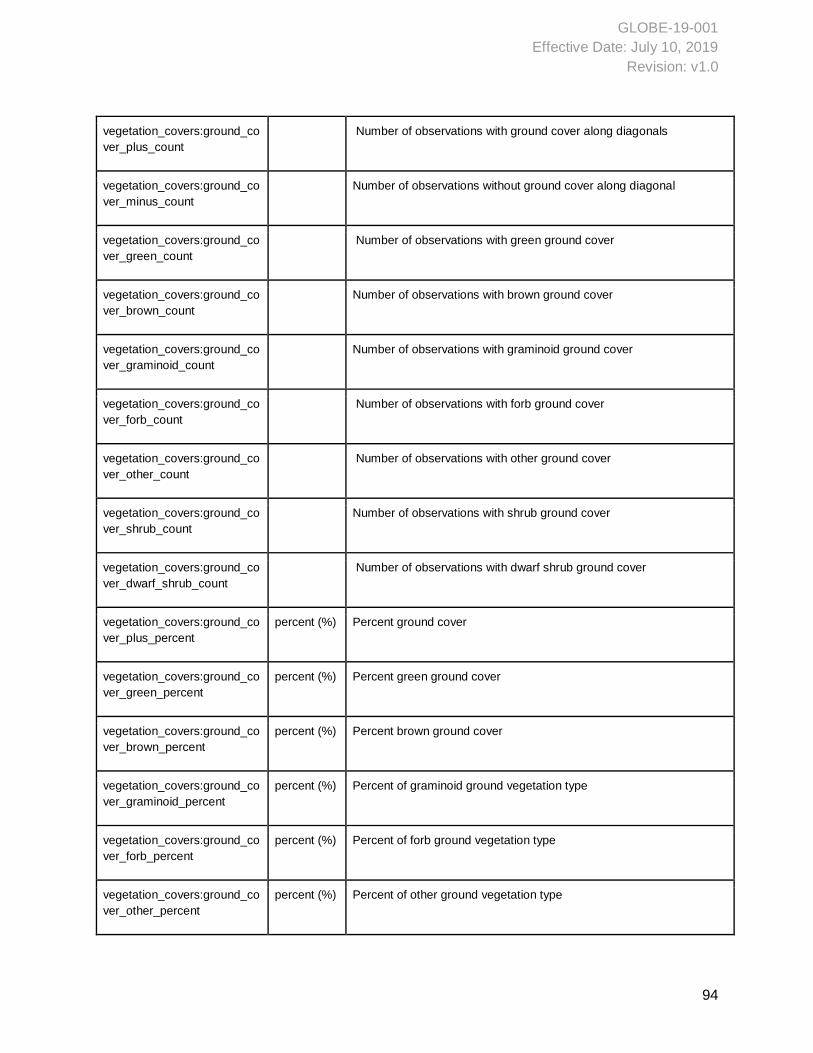
GLOBE-19-001
Effective Date: July 10, 2019
Revision: v1.0
94
vegetation_covers:ground_co
ver_plus_count
Number of observations with ground cover along diagonals
vegetation_covers:ground_co
ver_minus_count
Number of observations without ground cover along diagonal
vegetation_covers:ground_co
ver_green_count
Number of observations with green ground cover
vegetation_covers:ground_co
ver_brown_count
Number of observations with brown ground cover
vegetation_covers:ground_co
ver_graminoid_count
Number of observations with graminoid ground cover
vegetation_covers:ground_co
ver_forb_count
Number of observations with forb ground cover
vegetation_covers:ground_co
ver_other_count
Number of observations with other ground cover
vegetation_covers:ground_co
ver_shrub_count
Number of observations with shrub ground cover
vegetation_covers:ground_co
ver_dwarf_shrub_count
Number of observations with dwarf shrub ground cover
vegetation_covers:ground_co
ver_plus_percent
percent (%) Percent ground cover
vegetation_covers:ground_co
ver_green_percent
percent (%) Percent green ground cover
vegetation_covers:ground_co
ver_brown_percent
percent (%) Percent brown ground cover
vegetation_covers:ground_co
ver_graminoid_percent
percent (%) Percent of graminoid ground vegetation type
vegetation_covers:ground_co
ver_forb_percent
percent (%) Percent of forb ground vegetation type
vegetation_covers:ground_co
ver_other_percent
percent (%) Percent of other ground vegetation type
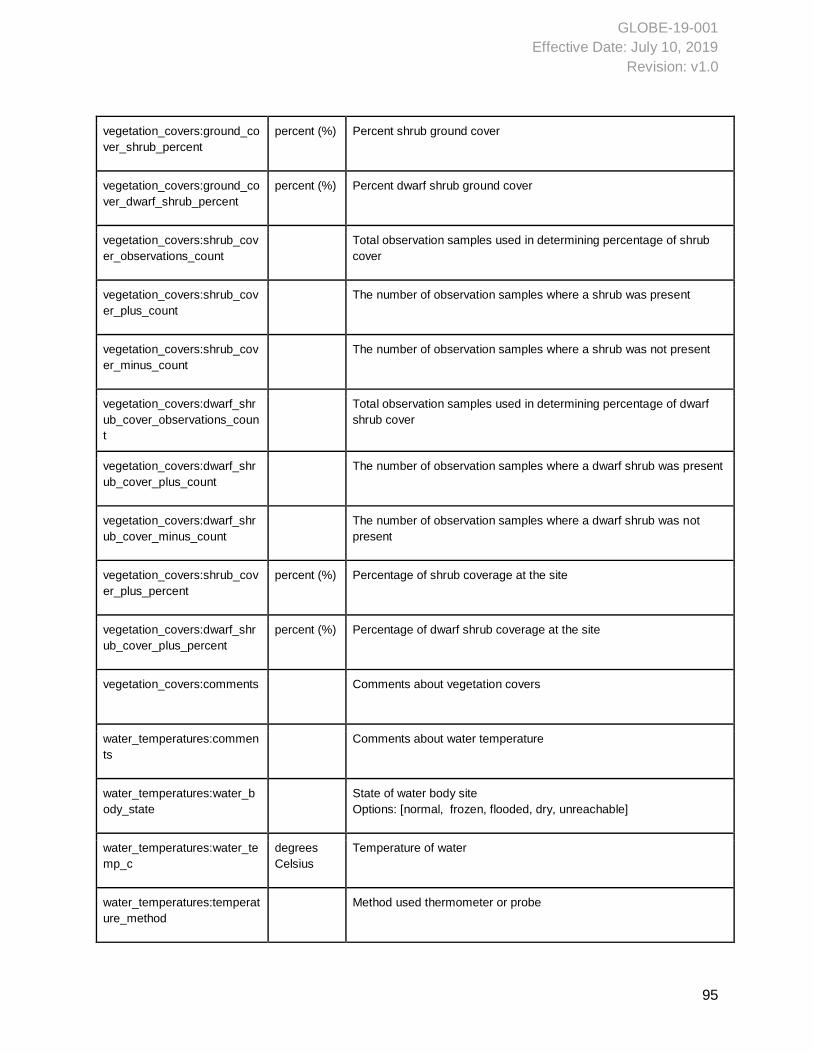
GLOBE-19-001
Effective Date: July 10, 2019
Revision: v1.0
95
vegetation_covers:ground_co
ver_shrub_percent
percent (%) Percent shrub ground cover
vegetation_covers:ground_co
ver_dwarf_shrub_percent
percent (%) Percent dwarf shrub ground cover
vegetation_covers:shrub_cov
er_observations_count
Total observation samples used in determining percentage of shrub
cover
vegetation_covers:shrub_cov
er_plus_count
The number of observation samples where a shrub was present
vegetation_covers:shrub_cov
er_minus_count
The number of observation samples where a shrub was not present
vegetation_covers:dwarf_shr
ub_cover_observations_coun
t
Total observation samples used in determining percentage of dwarf
shrub cover
vegetation_covers:dwarf_shr
ub_cover_plus_count
The number of observation samples where a dwarf shrub was present
vegetation_covers:dwarf_shr
ub_cover_minus_count
The number of observation samples where a dwarf shrub was not
present
vegetation_covers:shrub_cov
er_plus_percent
percent (%) Percentage of shrub coverage at the site
vegetation_covers:dwarf_shr
ub_cover_plus_percent
percent (%) Percentage of dwarf shrub coverage at the site
vegetation_covers:comments Comments about vegetation covers
water_temperatures:commen
ts
Comments about water temperature
water_temperatures:water_b
ody_state
State of water body site
Options: [normal, frozen, flooded, dry, unreachable]
water_temperatures:water_te
mp_c
degrees
Celsius
Temperature of water
water_temperatures:temperat
ure_method
Method used thermometer or probe
GLOBE-19-001
Effective Date: July 10, 2019
Revision: v1.0
96
water_temperatures:thermom
eter_probe_mfg
Manufacturer of thermometer probe
water_temperatures:thermom
eter_probe_model
Thermometer probe model
water_vapor_noons:precipita
ble_water
cm Precipitable water vapor measured within 1 hour of local solar noon
water_vapor_noons:comment
s
Comments on water vapor measurement
water_vapor_noons:observed
_sky_color
Sky color
Options: [
deep blue,
blue,
light blue,
pale blue,
milky]
Note: a guide to sky color is provided on page 10 of the GLOBE cloud
protocol.
water_vapor_noons:observed
_sky_clarity
Sky clarity (i.e., visibility)
Options: [
unusually clear,
clear,
somewhat hazy,
very hazy,
extremely hazy]
Note: a guide to sky visibility is provided on page 10 of the GLOBE
cloud protocol.
water_vapor_noons:associat
ed_remote_sensor
Satellite mission or instrument to which water vapor observation may
be compared
Note: open text field filled in by observer
water_vapor_noons:remote_
sensor_overflight_time
mm/dd/yy
HH:MM
Time the associated remote sensor most nearly flies over the water
vapor measurement site in UTC
Note: open text field filled in by observer
water_vapor_noons:remote_
sensor_maximum_elevation_
angle
degrees The highest angle the satellite mission is above the horizon for the
location and time of the water vapor measurement
Note: open text field filled in by observer
GLOBE-19-001
Effective Date: July 10, 2019
Revision: v1.0
97
Water_vapors:
precipitable_water
cm Precipitable water vapor measured
water_vapors:comments Comments on water vapor measurement
water_vapors:observed_sky_
color
Sky color
Options: [
deep blue,
blue,
light blue,
pale blue,
milky]
Note: a guide to sky color is provided on page 10 of the GLOBE cloud
protocol
water_vapors:observed_sky_
clarity
unusually
clear, clear,
somewhat
hazy, very
hazy,
extremely
hazy
Sky clarity (i.e., visibility)
Options: [
unusually clear,
clear,
somewhat hazy,
very hazy,
extremely hazy]
Note: a guide to sky visibility is provided on page 10 of the GLOBE
cloud protocol
water_vapors:associated_re
mote_sensor
Text Satellite mission or instrument to which water vapor observation may
be compared
Note: open text field filled in by observer
water_vapors:remote_sensor
_overflight_time
mm/dd/yy
HH:MM
Time the associated remote sensor most nearly flies over the water
vapor measurement site in Universal Coordinated Time (UTC)
Note: open text field filled in by observer
water_vapors:remote_sensor
_maximum_elevation_angle
degrees The highest angle the satellite mission is above the horizon for the
location and time of the water vapor measurement
Note: open text field filled in by observer
GLOBE-19-001
Effective Date: July 10, 2019
Revision: v1.0
98
Appendix 3. MUC code derivation This appendix contains a description of the methodology for determining MUC codes for a pixel
given one or more GLOBE Observer land cover measurements in one or more directions. This
only applies to land cover observations submitted via the GLOBE Observer app.
1. Sum the percent coverage for each direction by MUC Code
a. I.e., sum all “01n” MUC Code percentages for each direction (north, south, east,
west). If the user put 50% 01n coverage in all N/E/S/W directions, the sum would
be 200%. If the user input 20% coverage for the 02b MUC Code in only the N
and E directions, the sum would be 40%.
2. Divide the sum per MUC code by the number of directions the user input. For example, if
the user input 4 directions – divide by 4. In the case above, 01n has 200%/4 = 50%
overall, while 02b has 40%/4 = 10% overall.
a. Note: divide by the total number of directional measurements made, not the
number of times a specific MUC code shows up in a given direction. Even
though 02b was only reported in 2 directions, the user made a total of 4
directional measurements.
3. If any individual MUC code percent is greater than 60%, use that MUC code to store as
the representative value for that pixel, and lookup the corresponding MODIS values to
use for the associated map color.
a. If two or more MUC codes exceed 60%, use the one with the highest value.
b. If two or more MUC codes exceed 60% and are equal, we have no way of
choosing one over the other, so the system will randomly choose one.
4. If no individual MUC code exceeds 60%, sum MUC codes percentages by MODIS
grouping.
5. Use the highest total MUC-MODIS grouping to determine the representative MODIS
color, and use the highest MUC code value from within the grouping for the
representative GLOBE pixel MUC code.
a. Since GLOBE’s MUC code does not exactly map to the land cover app MUC
codes which have the letter suffix, store the MUC code as 01 in the GLOBE
database with the “n” suffix stored separately.
b. For the example initially provided:
i. On the Map page - display the code with the suffix if used (01n) on the
user’s map. Use the 01n to lookup the correct MODIS match (Evergreen
Needle leaf forests) and color. Display that color on the map’s pixel.
ii. On the user’s review page, the user will see: Overall Land Cover: MUC
Code 01n – Closely Spaced, Evergreen – Needle Leaved.
GLOBE-19-001
Effective Date: July 10, 2019
Revision: v1.0
99
There are 3 MODIS land cover classifications that do not map exactly to specific MUC codes,
and are not measured directly, but instead are a combination of one or more MUC codes.
1. Mixed Forests
a. Dominated by trees with a percent canopy cover of greater than 60%and
height exceeding 2 meters. Itconsists oftreecommunitieswith interspersed
mixtures ormosaicsofthe fourforest covertypes.Noneof the forest type
exceed60%of landscape.
2. Woody Savannas (open canopy – 30-60% trees)
a. Lands withherbaceousandotherunderstorysystems,andwithforest
canopycoverbetween30‐60%.Theforestcoverheightexceeds2meters.
3. Savannas (open canopy with grass)
a. landswithherbaceousandotherunderstorysystems,andwithforest
canopy coverbetween10‐30%.Theforest coverheightexceeds2meters.
Reference:
http://studentclimatedata.unh.edu/climate/albedo/MODISLandcoverClass_definitions.pdf
To see if any of these calculated values should be used to represent the pixel color:
1. If the sum of any single forest grouping of MUC codes are less than 60%.
a. I.e., all Evergreen Needleaf Forests (00, 01n, 03, 1, 11n, 13) or all Evergreen
Broadleaf Forests (01b, 11b) or Deciduous Needleleaf (02n, 12n), or Deciduous
Broadleaf (02b,12n).
2. Then sum all forest types (the combination of all four forest MUC codes listed above).
3. If the sum of all forest types is greater than 60%,
a. use the “Mixed Forests” color for MODIS matching on the map,
b. use the one forest MUC code with the highest percentage from the grouping with
the highest percentage to store in the GLOBE databased to represent the pixel
i. I.e., if Evergreen Needleaf Forests is the highest percentage grouping,
choose the MUC code from that grouping which has the highest value
(like 01n).
c. On the user’s review page, the user will see: Overall Land Cover: Mixed Forest.
Dominant MUC Code 01n – Closely Spaced, Evergreen – Needle Leaved.
4. If the sum of forest types is 30-60%:
a. If the sum of Grasslands (41,42,43,44) and Forest types** totals at least 90%* of
the classification
i. I.e., if forest is 30% and grass at least 60%, or forest 40%, grass at least
50% etc)
b. Use the “Woody Savanna” color for MODIS matching on the map
c. From the grouping (all Forests combined or Grasslands) which totals the highest
percentage, use the highest MUC code from that grouping to represent the pixel
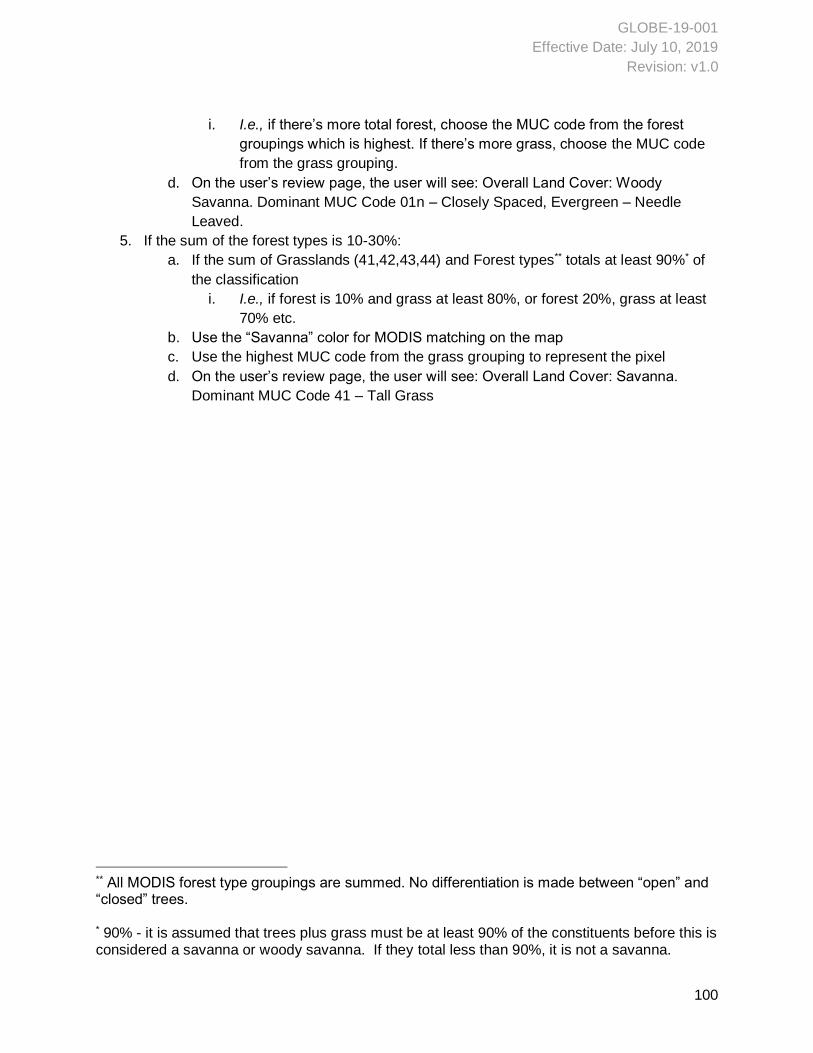
GLOBE-19-001
Effective Date: July 10, 2019
Revision: v1.0
100
i. I.e., if there’s more total forest, choose the MUC code from the forest
groupings which is highest. If there’s more grass, choose the MUC code
from the grass grouping.
d. On the user’s review page, the user will see: Overall Land Cover: Woody
Savanna. Dominant MUC Code 01n – Closely Spaced, Evergreen – Needle
Leaved.
5. If the sum of the forest types is 10-30%:
a. If the sum of Grasslands (41,42,43,44) and Forest types** totals at least 90%* of
the classification
i. I.e., if forest is 10% and grass at least 80%, or forest 20%, grass at least
70% etc.
b. Use the “Savanna” color for MODIS matching on the map
c. Use the highest MUC code from the grass grouping to represent the pixel
d. On the user’s review page, the user will see: Overall Land Cover: Savanna.
Dominant MUC Code 41 – Tall Grass
** All MODIS forest type groupings are summed. No differentiation is made between “open” and “closed” trees. * 90% - it is assumed that trees plus grass must be at least 90% of the constituents before this is considered a savanna or woody savanna. If they total less than 90%, it is not a savanna.