Embed Size (px)
Citation preview
Globalization Performance MetricsBecoming a Consistent Exporter
Short Deck and Supporting Data
Data as of 4Q 2013

2
Increasing global competitiveness1. Is the U.S. becoming more competitive internationally and domestically?
2. Is the U.S. dairy industry filling the latent demand gap?
3. Is the U.S. moving beyond commodity surplus disposal, supplier of last resort?
Strengthening domestic market4. Is U.S. becoming more competitive domestically?
Providing value to producers5. Is global market providing higher returns to U.S. producers?
Improving commercial focus6. Is the U.S. better fulfilling the needs of customers?
Stakeholder performance indicators

3
Consistent Exporter goal:
Increasing global competitiveness
Back to: Stakeholder Questions

4
U.S. milk solids exported exceeded trend growth during the 12 months ending Mar 2014 after being below trend during the 12 months ending Mar 2013
During the baseline period, the U.S. growth rate of 1.429 M lbs/mo represented 64% of global growth (Chart A2A)
U.S. milk solid exports averaged 18 M lbs/mo greater than the trend during the 12 months ending Mar 2014 compared with an average of 24 M lbs less than the trend during the 12 months ending Mar 2013 (Chart A2A)
U.S. increases cheese market competitiveness and is leading SMP/NDM exporter
U.S. cheese market share increased from 4.8% to 16.5% U.S. SMP/NDM market share increased from 25.6% to 30.0% (+4.4 points)… …however, the EU is a challenging competitor as its market share has also
increased from 14.7% to 24% (+9.3 points)
1) Is U.S. becoming more competitive internationally?
Back to: Stakeholder Questions
5
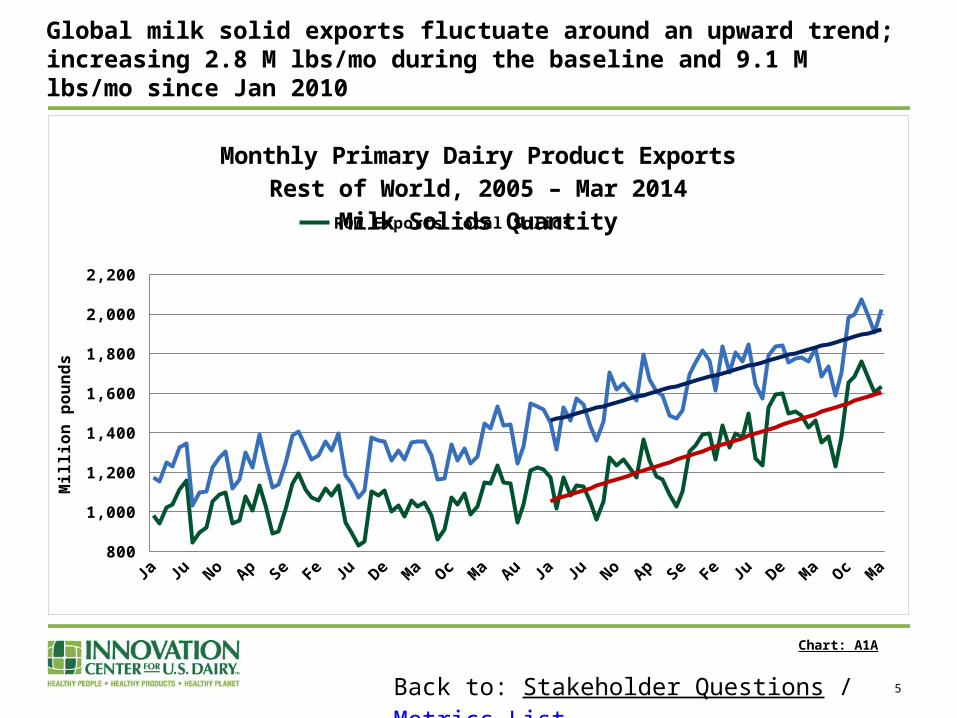
Global milk solid exports fluctuate around an upward trend; increasing 2.8 M lbs/mo during the baseline and 9.1 M lbs/mo since Jan 2010
Back to: Stakeholder Questions / Metrics List
Chart: A1A
Jan-0
5
Jul-0
5
Jan-0
6
Jul-0
6
Jan-0
7
Jul-0
7
Jan-0
8
Jul-0
8
Jan-0
9
Jul-0
9
Jan-1
0
Jul-1
0
Jan-1
1
Jul-1
1
Jan-1
2
Jul-1
2
Jan-1
3
Jul-1
3
Jan-1
4 800
1,000
1,200
1,400
1,600
1,800
2,000
2,200
Monthly Primary Dairy Product ExportsRest of World, 2005 – Mar 2014
Milk Solids QuantityROW Exports Total Solids ROW Linear Trend Since Jan 2010Global Exports Total Solids Global Linear Trend Since Jan 2010
Mill
ion
po
un
ds

6
Jan-0
5
Jul-0
5
Jan-0
6
Jul-0
6
Jan-0
7
Jul-0
7
Jan-0
8
Jul-0
8
Jan-0
9
Jul-0
9
Jan-1
0
Jul-1
0
Jan-1
1
Jul-1
1
Jan-1
2
Jul-1
2
Jan-1
3
Jul-1
3
Jan-1
4 100
150
200
250
300
350
400
450
Monthly Primary Dairy Product ExportsUnited States, Jan 2005 – Mar 2014
Milk Solids QuantityU.S. Exports Total Solids Linear Trend Since Jan 2010
Mill
ion
po
un
ds
U.S. milk solid exports averaged 18 M lbs over trend during 12 months ending Mar 2014 compared with 24 M lbs under trend during 12 months ending Mar 2013
Back to: Stakeholder Questions / Metrics List
Chart: A2A
7
2005–07 Annual Average 12 months Ending Mar 20140%
10%
20%
30%
40%
50%
60%
70%
80%
90%
100%
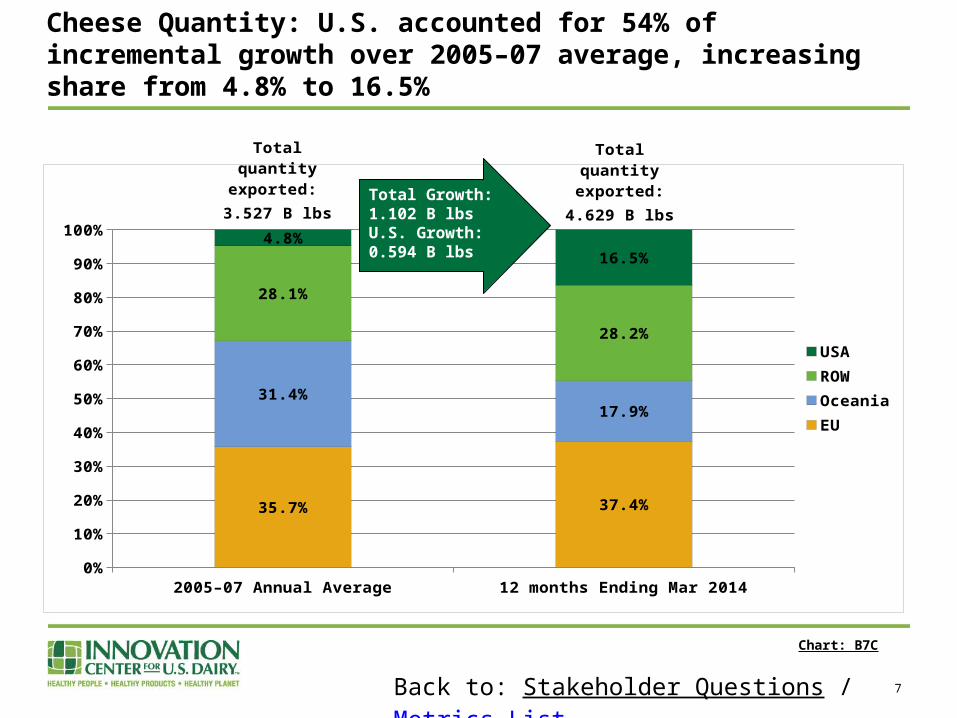
35.7% 37.4%
31.4%17.9%
28.1%
28.2%
4.8%16.5%
USAROWOceaniaEU
Total quantity exported: 3.527 B lbs
Total quantity exported:
4.629 B lbs
Cheese Quantity: U.S. accounted for 54% of incremental growth over 2005–07 average, increasing share from 4.8% to 16.5%
Total Growth:1.102 B lbs U.S. Growth:0.594 B lbs
Chart: B7C
Back to: Stakeholder Questions / Metrics List

8
2005–07 Annual Average 12 months Ending Mar 20140%
10%
20%
30%
40%
50%
60%
70%
80%
90%
100%
14.7%24.0%
40.6% 25.5%
19.1%20.4%
25.6% 30.0%
USAROWOceaniaEU
Total quantity exported: 2.356 B lbs
Total quantity exported:
4.221 B lbs
Skim Milk Powder Quantity: U.S. accounted for 36% of incremental growth over 2005–07 average, increasing share from 25.6% to 30.0%
Total Growth:1.865 B lbs U.S. Growth:0.664 B lbs
Chart: B3S
Back to: Stakeholder Questions / Metrics List

9
Global milk solids exports for the 12 months ended Mar 2014 were 49% greater than the baseline annual average
Global growth totaled 7.337 B lbs
U.S. growth totaled 2.01 B lbs
U.S. accounted for 27% of global growth in milk solids exported…
…increasing U.S. market share from 13.6% to 18.1%
U.S. market share (most recent 12 months) has increased for 13 consecutive months from Mar 2013 through Mar 2014 and has exceeded 17% for five consecutive months starting in Nov 2013
2) Is U.S. filling global latent demand gap?
Back to: Stakeholder Questions

10
2005–07 Annual Average 12 months Ending Mar 20140%
10%
20%
30%
40%
50%
60%
70%
80%
90%
100%
29.0% 27.2%
32.9%28.3%
24.5%26.4%
13.6% 18.1%
USAROWOceaniaEU
Total solids ex-ported:
14.94 B lbs
Total solids ex-ported:
22.27 B lbs
Primary Dairy Product Exports, Total Solids:U.S. accounted for 27% of incremental growth
Total Growth:7.34 B lbs U.S. Growth:2.01 B lbs
Chart: B1A
Back to: Stakeholder Questions / Metrics List

11
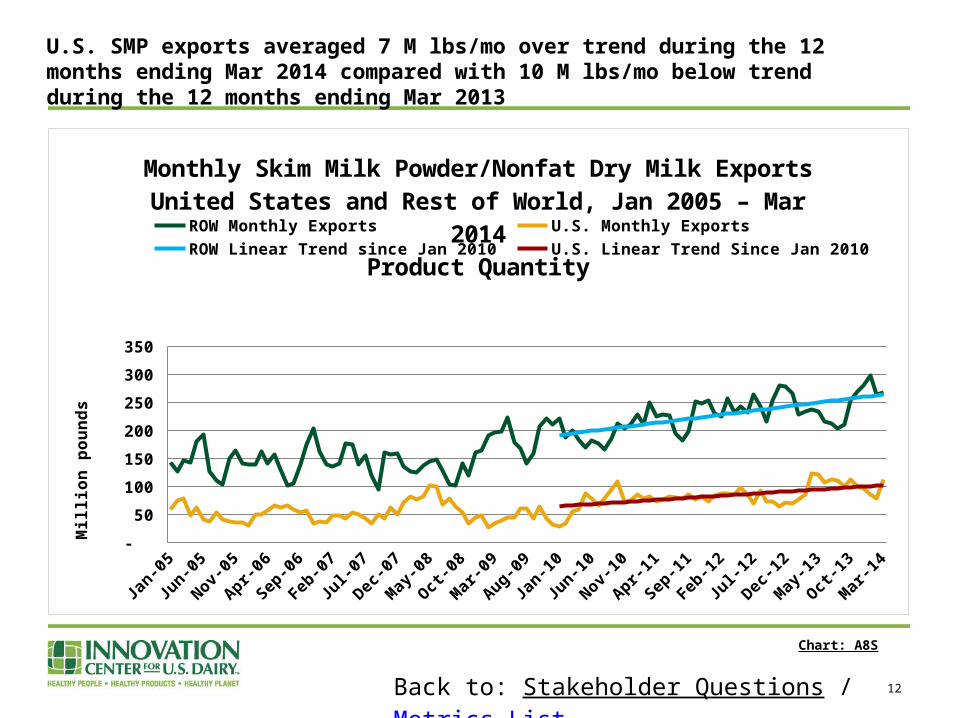
Historically, U.S. SMP/NDM exports were the last into the market and first out of the market
During the baseline period (2005–07), U.S. NDM/SMP exports decreased nearly 250,000 lbs/mo while exports from ROW increased 162,400 lbs/mo (Chart A8S)
U.S. SMP/NDM exports have grown more slowly than ROW SMP/NDM exports since Jan 2010
U.S. SMP exports increased by 750,000 lbs/mo (34.1% of total) while ROW exports increased 1.45 M lbs/mo (65.9% of total) (Chart A8S)
U.S. SMP/NDM exports have been above trend SMP/NDM exports averaged 7 M lbs/mo more than the trend for the 12
months ending Mar 2014 versus 10 M lbs/mo less than the trend for 12 months ending Mar 2013 (Chart A8S)
U.S. market share increased (25.6% to 30.0%), though the EU is a challenging competitor (14.7% to 24.0%) (Chart B3S)
3) Is U.S. moving beyond commodity surplus disposal and supplier of last resort?
Back to: Stakeholder Questions
12
Jan-0
5
Jul-0
5
Jan-0
6
Jul-0
6
Jan-0
7
Jul-0
7
Jan-0
8
Jul-0
8
Jan-0
9
Jul-0
9
Jan-1
0
Jul-1
0
Jan-1
1
Jul-1
1
Jan-1
2
Jul-1
2
Jan-1
3
Jul-1
3
Jan-1
4 -
50
100
150
200
250
300
350
Monthly Skim Milk Powder/Nonfat Dry Milk ExportsUnited States and Rest of World, Jan 2005 – Mar 2014
Product QuantityROW Monthly Exports U.S. Monthly ExportsROW Linear Trend since Jan 2010 U.S. Linear Trend Since Jan 2010
Mill
ion
po
un
ds
U.S. SMP exports averaged 7 M lbs/mo over trend during the 12 months ending Mar 2014 compared with 10 M lbs/mo below trend during the 12 months ending Mar 2013
Back to: Stakeholder Questions / Metrics List
Chart: A8S

13
Consistent Exporter goal:
Strengthening domestic market
Back to: Stakeholder Questions
14
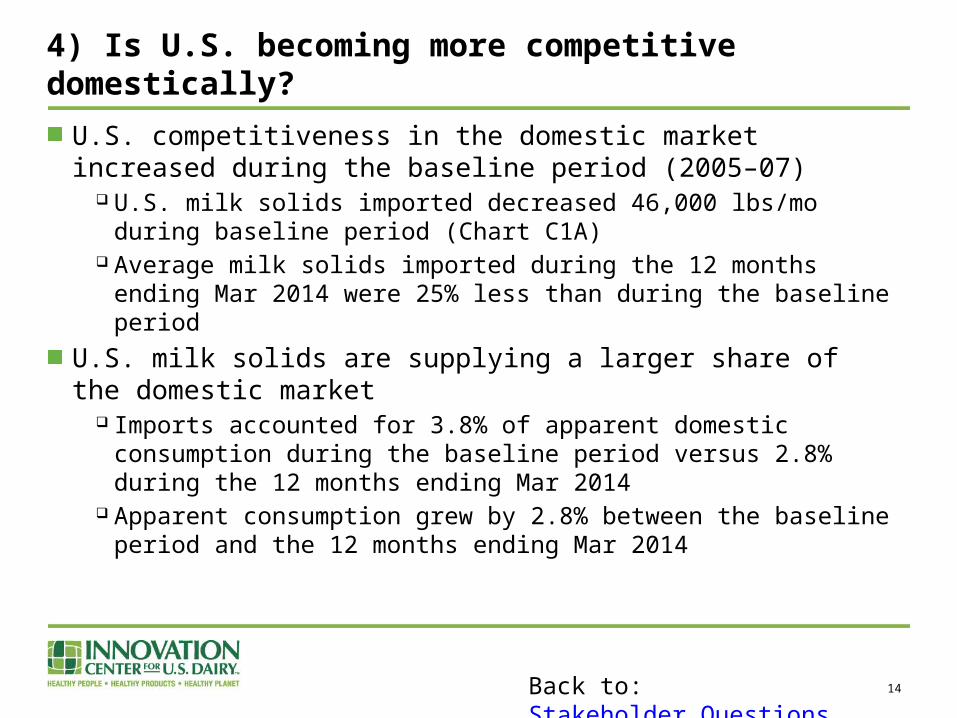
U.S. competitiveness in the domestic market increased during the baseline period (2005–07)
U.S. milk solids imported decreased 46,000 lbs/mo during baseline period (Chart C1A)
Average milk solids imported during the 12 months ending Mar 2014 were 25% less than during the baseline period
U.S. milk solids are supplying a larger share of the domestic market Imports accounted for 3.8% of apparent domestic consumption during the
baseline period versus 2.8% during the 12 months ending Mar 2014 Apparent consumption grew by 2.8% between the baseline period and the
12 months ending Mar 2014
4) Is U.S. becoming more competitive domestically?
Back to: Stakeholder Questions

15
Jan-0
5
Jul-0
5
Jan-0
6
Jul-0
6
Jan-0
7
Jul-0
7
Jan-0
8
Jul-0
8
Jan-0
9
Jul-0
9
Jan-1
0
Jul-1
0
Jan-1
1
Jul-1
1
Jan-1
2
Jul-1
2
Jan-1
3
Jul-1
3
Jan-1
4 -
50
100
150
200
250
300
350
400
450
Monthly Primary Dairy Product Exports and ImportsUnited States, Jan 2005 – Mar 2014
Milk SolidsImports Exports Linear Trend Since Jan 2010 Linear Trend Since Jan 2010
Mill
ion
po
un
ds
Milk solids exported increased at 2.03 M lbs/mo while imports increased at only 5,000 lbs/mo since Jan 2010
Back to: Stakeholder Questions / Metrics List
Chart: C1A
16
Consistent Exporter goal:
Providing value to producers
Back to: Stakeholder Questions
17
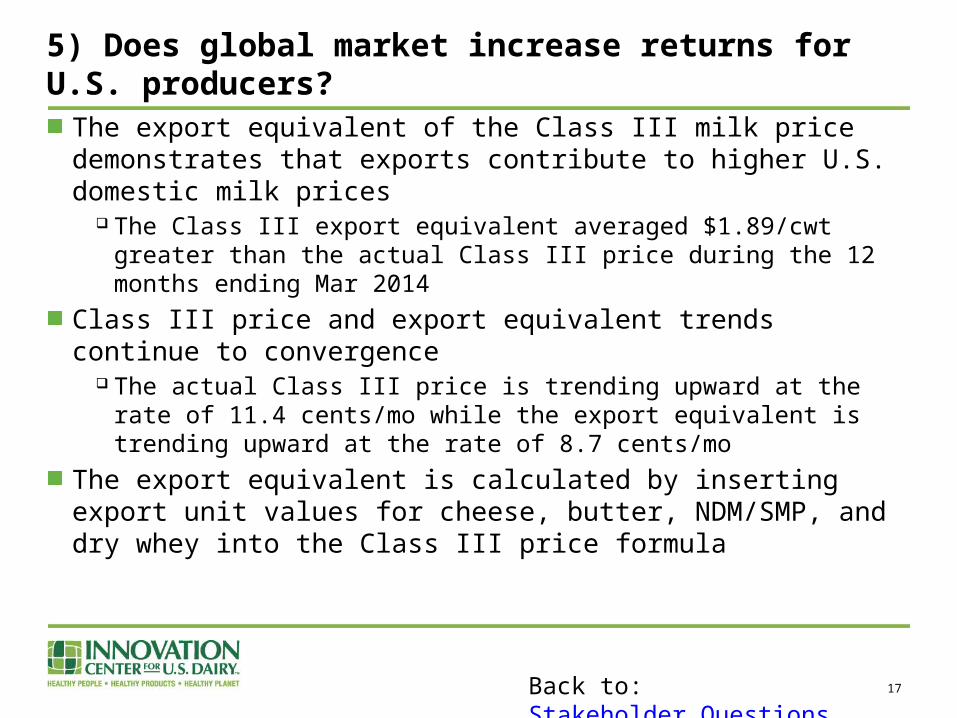
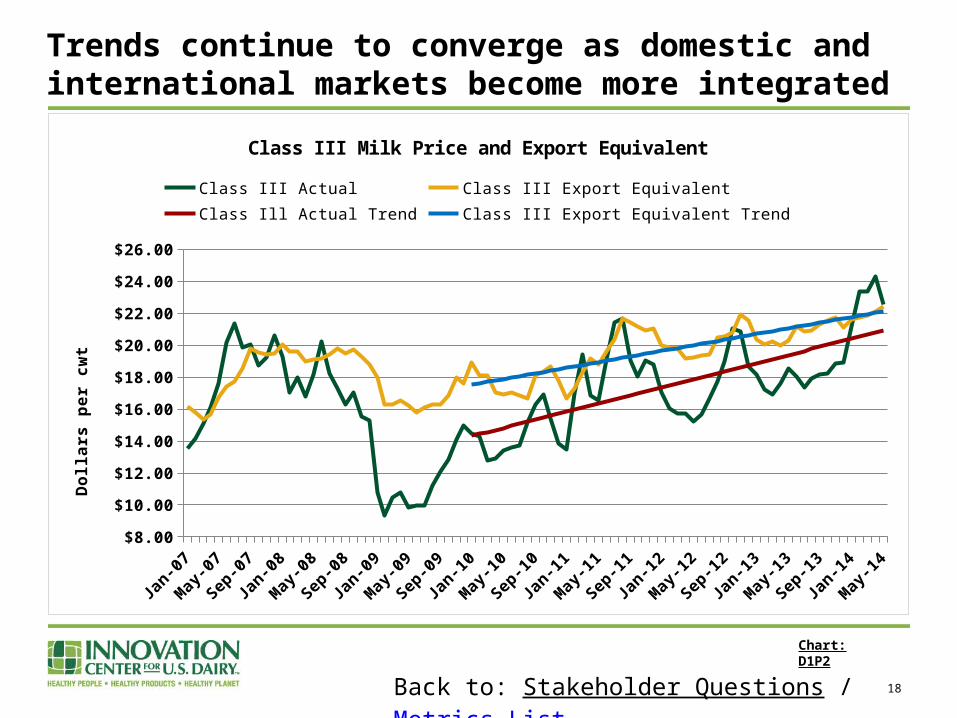
The export equivalent of the Class III milk price demonstrates that exports contribute to higher U.S. domestic milk prices
The Class III export equivalent averaged $1.89/cwt greater than the actual Class III price during the 12 months ending Mar 2014
Class III price and export equivalent trends continue to convergence The actual Class III price is trending upward at the rate of 11.4 cents/mo
while the export equivalent is trending upward at the rate of 8.7 cents/mo
The export equivalent is calculated by inserting export unit values for cheese, butter, NDM/SMP, and dry whey into the Class III price formula
5) Does global market increase returns for U.S. producers?
Back to: Stakeholder Questions
18
Jan-0
7
Jul-0
7
Jan-0
8
Jul-0
8
Jan-0
9
Jul-0
9
Jan-1
0
Jul-1
0
Jan-1
1
Jul-1
1
Jan-1
2
Jul-1
2
Jan-1
3
Jul-1
3
Jan-1
4$8.00
$10.00
$12.00
$14.00
$16.00
$18.00
$20.00
$22.00
$24.00
$26.00
Class III Milk Price and Export Equivalent
Class III Actual Class III Export EquivalentClass Ill Actual Trend Class III Export Equivalent Trend
Do
llars
pe
r c
wt
Trends continue to converge as domestic and international markets become more integrated
Back to: Stakeholder Questions / Metrics List
Chart: D1P2

19
Consistent Exporter goal:
Improving commercial focus
Back to: Stakeholder Questions
20
Measure: Global Dairy Buyer Survey
Summary of Baseline Data: U.S. viewed as an important source of future supply Long-term consistent commitment to the export market is needed Improvement wanted in product specs, quality and pricing stability
6) Is the U.S. better fulfilling the needs of customers?
Back to: Stakeholder Questions