Embed Size (px)
Citation preview

Journal of Agribusiness 23,2(Fall 2005):133S146© 2005 Agricultural Economics Association of Georgia
Globalization of the Frozen Potato Industry
Shiva S. Makki and Charles Plummer
This paper examines the globalization of the frozen potato industry, including theexpansion of production and processing of potato products in the global marketplace, and future prospects for the industry. Driven largely by the rising popularityof Western style cuisine, frozen french fries and other frozen potato products havebecome global commodities generating billions of dollars in revenue worldwide.This study finds that with markets for frozen potato products in the United Statesand other developed countries hardly expanding, the growth of the frozen potatoindustry will critically depend on industry’s ability to sustain growth in developingeconomies.
Key Words: french fries, frozen potato products, globalization, quick servicerestaurants
Driven largely by the rising popularity of Western style cuisine, particularly theofferings of quick service restaurants (QSRs), frozen french fries and other frozenpotato products have become global commodities generating billions of dollars inrevenue worldwide each year. Although exact worldwide production and salesfigures for frozen potato products are not available, it has been estimated that totalworld frozen potato production capacity is about 11 million metric tons (mmt) a year(Huffaker, 2003). Worldwide exports of frozen potato products (over 90% of whichare frozen french fries) in 2002 were valued at $2.2 billion. This value is at thewholesale level and does not account for the billions of dollars in value added frommarketing at the retail level worldwide.
After a long period of growth and expansion in the industry, however, manymajor markets are showing signs of maturing, with the growth rate in consumptionslowing or even declining during the past few years. Concerns about health andincreased consumption of alternative foods (e.g., other fruits and vegetables) in
Shiva S. Makki is an economist with the World Bank, Washington, DC, and adjunct faculty member with the OhioState University; Charles Plummer is an independent consultant located in Washington, DC. Senior authorship is notassigned.
A portion of this research was conducted when the authors were with the Economic Research Service, U.S.Department of Agriculture. The authors gratefully acknowledge helpful comments from Agapi Somwaru, Gary Lucier,Daniel Pick, Demcey Johnson, and Joy Harwood, as well as editorial assistance provided by Fadima Savadogo. Theviews expressed herein are the authors’ and not necessarily those of the Economic Research Service or the WorldBank.

134 Fall 2005 Journal of Agribusiness
1 A recent collection of medical studies concludes that QSRs have contributed to obesity problems in the UnitedStates. The supersizing of American waistlines has many QSRs scrambling for more diversified menus that includefruits and vegetables, but less emphasis on french fries. Increased consumer awareness has also pushed frozen potatomanufacturers to seek new markets elsewhere.
developed countries are likely to adversely affect the demand for potato products.1On the other hand, per capita consumption of potatoes is low but growing in manydeveloping countries. The growth of the frozen potato industry will critically dependon the industry’s ability to sustain growth in those developing markets.
This study examines the globalization of the frozen potato industry, including theexpansion of production and processing of potato products in the emerging markets,and prospects for the industry in the global market place. A cross-section of 33foreign destinations accounting for over 90% of total U.S. exports in frozen potatoesis analyzed to identify critical factors that affect frozen potato exports.
Growth of the Frozen Potato Industry
The rapid, continuing growth in the fast-food industry over the years is whatspawned growth in the frozen potato industry, first in the United States, and then theworld (Plummer and Makki, 2002). Although commercial production of french friesbegan in the United States on a small scale in the mid-1940s, it didn’t develop intoa major industry until after the inception of QSRs in the 1950s (figure 1). As QSRscontinued to expand, so did the frozen potato products industry, with U.S. outputincreasing from 0.58 mmt (129 million lbs.) in 1955 to 3.5 mmt (7.8 billion lbs.) in2002, peaking at nearly 4 mmt (8.8 billion lbs.) in 1999 (American Frozen FoodInstitute, 2002).
Despite this tremendous growth in U.S. frozen potato production, the ever-increasing domestic and international demand for frozen potato products farexceeded U.S. processing capacity. By the 1970s, processors in Canada and WesternEurope were producing frozen potato products to meet the growing demand. TheUnited States is the largest producer of frozen potatoes in the world, producing anestimated 3.5 mmt in 2002. Canada is ranked second with a production of 1.2 mmt,and the Netherlands is a close third with a production of 1.1 mmt. It is estimated thatthese three countries (the United States, Canada, and the Netherlands) collectivelyproduce somewhere between 55% and 75% of the world production of frozen potatoproducts (figure 2). Canada and the Netherlands are currently very close in frozenpotato production and capacity. Canada’s frozen potato industry is still growing,while the industries in the Netherlands and the United States are both stagnant orpossibly even declining slightly in size. The bulk of the remaining frozen potatoproduction resides in other European Union (EU) nations, particularly Belgium,France, Germany, and the United Kingdom. Production also occurs on a muchsmaller scale in Australia, New Zealand, Eastern Europe, Asia, Africa, and SouthAmerica, and as frozen potato consumption increases in these areas, local productionis likely to increase as well.

Makki and Plummer Globalization of the Frozen Potato Industry 135
0 5,000
10,000 15,000 20,000 25,000 30,000 35,000 40,000 45,000 50,000
1960 1965 1970 1975 1980 1985 1990 1995 2000 YEAR
0 1,000 2,000 3,000 4,000 5,000 6,000 7,000 8,000 9,000 10,000
QSRs
Frozen Packs
Source: American Frozen Food Institute (2002).
Figure 1. Number of quick service restaurants worldwide and U.S. frozenpotato product packs, 1960SSSS2001
No. ofQSRs
No. of FrozenPotato Packs
(000s)
Source: United Nations Statistics Division (2002).
Figure 2. World frozen potato production capacity share by country

136 Fall 2005 Journal of Agribusiness
Major Markets for Frozen Potato Products
The major markets for frozen potato products are still predominantly the developedeconomies of the United States, the European Union, Canada, and Japan. However,as these markets mature, they are likely to have only limited growth potential in thefuture. This is most evident in the United States, the oldest and largest single-countrymarket for frozen potato products, where demand appears to have leveled off inrecent years. According to statistics from the American Frozen Food Institute, percapita consumption of frozen potato products in the United States was an estimated12.5 kg (27.6 lbs.) per person in 2002 (product weight), down 5% from 2001, and8.5% below the record level set in 1996.
Further evidence of market maturity is the relatively slow expansion of traditionalburger and fry outlets in the United States compared with the world. For example,in 2002, the number of McDonald’s outlets in the United States increased by only3% from the previous year compared to a 3.9% average growth in the rest of theworld (Plummer and Makki, 2002). With nearly 13,500 outlets in the United Statesin 2002, there was one McDonald’s for approximately every 21,000 people.
Also showing signs of market maturity for frozen potato products is Japan, whereconsumption also seems to have declined recently following years of rapid growth.In 2002, per capita consumption of frozen french fries in Japan was 1.7 kg (3.7 lbs.)per person, down from a high of about 2.4 kg (5.3 lbs.) per person in 1999 (Plummerand Makki, 2002). Most of this consumption occurs through the food serviceindustry, with McDonald’s by far the leading supplier. After the United States andCanada, Japan ranks third in the number of McDonald’s outlets per capita, with oneoutlet for approximately every 33,000 people.
The European Union markets for frozen potato products also may be nearingmaturity. QSRs have been established in most EU countries since the 1970s, and in2002 there was one McDonald’s restaurant for roughly every 120,000 people(including Eastern Europe, where the industry is largely underdeveloped). Europeanper capita consumption of frozen potato products in 2002, although based on limiteddata from only 13 countries, was estimated at about 6.5 kg (14.3 lbs.) per person,about half the U.S. level. However, 2002 per capita consumption in the UnitedKingdom, by far the largest European market for frozen potato products, was anestimated 16 kg (35 lbs.) per person in 2002. France ranks second in the EU, witha per capita consumption estimated at 7.1 kg (15.7 lbs.) per person in 2002 (Pierce,2002, 2003).
Markets with the most growth potential for frozen potato products in the comingyears are likely to be those that are still largely untapped by the QSR industries,particularly in Asia and Latin America. As these regions continue to developeconomically, QSR outlets are expected to expand, increasing demand for frozenpotato products at a potentially rapid pace. In Latin America, there is currently onlyone McDonald’s for every 331,000 people, and in the Asian/Pacific region, thisnumber is only one outlet for roughly every half million people. Two countries withperhaps the most potential for QSR growth and potential demand for frozen potato
Makki and Plummer Globalization of the Frozen Potato Industry 137
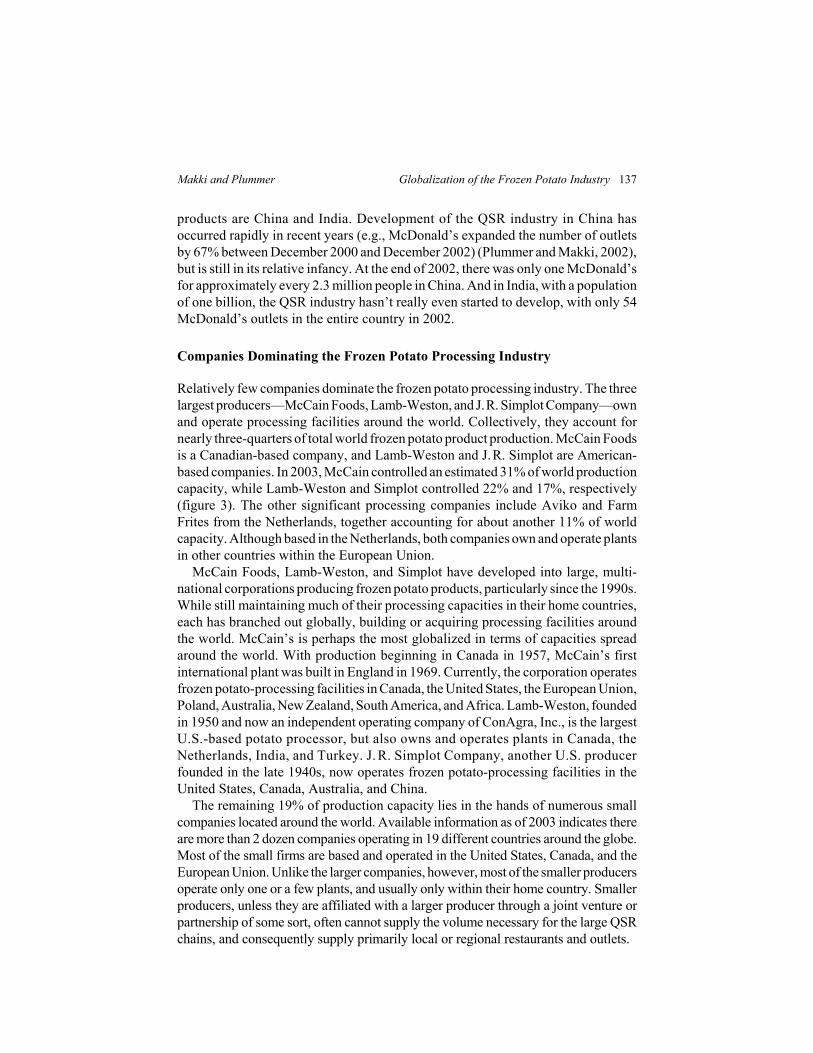
products are China and India. Development of the QSR industry in China hasoccurred rapidly in recent years (e.g., McDonald’s expanded the number of outletsby 67% between December 2000 and December 2002) (Plummer and Makki, 2002),but is still in its relative infancy. At the end of 2002, there was only one McDonald’sfor approximately every 2.3 million people in China. And in India, with a populationof one billion, the QSR industry hasn’t really even started to develop, with only 54McDonald’s outlets in the entire country in 2002.
Companies Dominating the Frozen Potato Processing Industry
Relatively few companies dominate the frozen potato processing industry. The threelargest producers—McCain Foods, Lamb-Weston, and J.R. Simplot Company—ownand operate processing facilities around the world. Collectively, they account fornearly three-quarters of total world frozen potato product production. McCain Foodsis a Canadian-based company, and Lamb-Weston and J.R. Simplot are American-based companies. In 2003, McCain controlled an estimated 31% of world productioncapacity, while Lamb-Weston and Simplot controlled 22% and 17%, respectively(figure 3). The other significant processing companies include Aviko and FarmFrites from the Netherlands, together accounting for about another 11% of worldcapacity. Although based in the Netherlands, both companies own and operate plantsin other countries within the European Union.
McCain Foods, Lamb-Weston, and Simplot have developed into large, multi-national corporations producing frozen potato products, particularly since the 1990s.While still maintaining much of their processing capacities in their home countries,each has branched out globally, building or acquiring processing facilities aroundthe world. McCain’s is perhaps the most globalized in terms of capacities spreadaround the world. With production beginning in Canada in 1957, McCain’s firstinternational plant was built in England in 1969. Currently, the corporation operatesfrozen potato-processing facilities in Canada, the United States, the European Union,Poland, Australia, New Zealand, South America, and Africa. Lamb-Weston, foundedin 1950 and now an independent operating company of ConAgra, Inc., is the largestU.S.-based potato processor, but also owns and operates plants in Canada, theNetherlands, India, and Turkey. J. R. Simplot Company, another U.S. producerfounded in the late 1940s, now operates frozen potato-processing facilities in theUnited States, Canada, Australia, and China.
The remaining 19% of production capacity lies in the hands of numerous smallcompanies located around the world. Available information as of 2003 indicates thereare more than 2 dozen companies operating in 19 different countries around the globe.Most of the small firms are based and operated in the United States, Canada, and theEuropean Union. Unlike the larger companies, however, most of the smaller producersoperate only one or a few plants, and usually only within their home country. Smallerproducers, unless they are affiliated with a larger producer through a joint venture orpartnership of some sort, often cannot supply the volume necessary for the large QSRchains, and consequently supply primarily local or regional restaurants and outlets.

138 Fall 2005 Journal of Agribusiness
Source: United Nations Statistics Division (2002).
Figure 3. World frozen potato production capacityshare by processor
Globalized Production and Foreign Direct Investment
Output of U.S. frozen potato products has benefited and expanded from the global-ization of the QSR industry. At the same time, increased worldwide demand has ledto globalization in the production sector. As worldwide demand for frozen potatoproducts increased, a natural progression for the processing industry has been toinvest directly in major markets abroad. Evidence suggests that the industry isbuilding and expanding potato processing plants worldwide. This allows processorsto utilize global sourcing to reduce transportation costs by minimizing shippingdistances of finished product. Globalized production also stabilizes the supply bylimiting the effects of local crop disasters and shortages should they occur in aparticular production region, while also allowing suppliers to avoid trade barriers insome instances.
The motivation for foreign direct investment (FDI) in frozen potatoes is no differ-ent from that in other related sectors such as wineries or beverages. Economics liter-ature suggests FDI is motivated primarily by pressures to reduce transaction costs,to access and develop foreign markets, and to overcome trade barriers (Pompelli andPick, 1999). FDI in frozen potatoes is also driven by a need for a cost-effective,stable, and adequate supply of frozen potatoes to meet the demands of a growingworldwide QSR sector. The expansion of processing plants around the world inrecent years is a testimony to increasing FDI in the frozen potato industry.
Makki and Plummer Globalization of the Frozen Potato Industry 139
Prospects for the U.S. Frozen Potato Industry
As noted previously, markets for frozen potato products in the United States andother developed countries are mature. Concerns about health and increased con-sumption of alternative foods in developed countries are likely to adversely affectthe demand for potato products. On the other hand, per capita consumption ofpotatoes in many developing countries is low but growing. The growth of the frozenpotato industry will critically depend on industry’s ability to sustain growth in thosedeveloping markets.
In this section, we examine various destination market characteristics that affectexports of U.S. frozen potato products, in an attempt to identify growth markets andquantify the effects such market characteristics have on U.S. exports. It is hypoth-esized that U.S. exports are likely to be affected by the size of the markets and thepurchasing power of consumers, as well as policies and institutions of destinationcountries. A cross-section of 33 foreign destinations is analyzed, accounting for over90% of total U.S. exports in frozen potatoes over the time period of 1989S2001. Thecharacteristics of developed and developing countries are examined separately, asmarket and other characteristics of these two groups are different and they affectexports differently. Depending on whether the country is developed or developing,the two country groups’ characteristics are expected to have different relationshipswith U.S. exports of frozen potato products.
In this study, high-income Organization for Economic Cooperation and Develop-ment (OECD) countries are considered to be developed countries, while low- andmiddle-income countries are considered to be developing countries. Of the 33selected countries, 19 comprise our developing-country group, with a combined urbanpopulation of 1.3 billion and gross domestic product (GDP) of over $13 trillion(table 1). Even though developing countries accounted for only 25% of U.S. frozenpotato exports in 2001, they offer the greatest potential for growth. During the1991S2001 period, the annual growth rate of U.S. exports to developing countrieswas 20.8%, while the growth rate of exports to developed countries was only 7.77%(table 1 and figure 4).
Analytical Framework
To analyze the factors determining U.S. exports of frozen potato products across abroad spectrum of economies with varying market sizes, per capita income levels,and institutions, we estimate time-series cross-section (TSCS) regressions that relatefrozen potato exports to destination country characteristics. The basic econometricspecification is as follows:
(1) Eit ' α % βXit % eit , (i ' 1, 2, ..., N; t ' 1, 2, ..., T ),
where E is U.S. exports of frozen potato products, X is a vector of exogenousvariables representing various country characteristics, α is the intercept term, β is a

140 Fall 2005 Journal of Agribusiness
Table 1. U.S. Frozen Potato Industry: Export Growth Rate, Export Market Share,and Destination Country Characteristics
DestinationCountry
ExportGrowth
Rate (%)1991S2001
ExportMarket
Share (%)2001
GDP(PPP $ bil.)
2001
GDP Growth
Rate (%) 1991S2001
GDP perCapita(PPP $)
2001
GDP perCapitaGrowth
Rate (%)1991S2001
UrbanPopulation(% of total)
2001
DEVELOPED MARKETS:Australia 13.70 0.33 492 5.44 25,370 4.29 91Belgium — 0.00 262 3.53 25,520 3.25 97Canada 10.33 4.70 843 4.70 27,130 3.72 80Denmark — 0.00 155 3.79 29,000 3.40 85France !6.38 0.00 1,420 3.50 23,990 3.11 76Germany !19.92 0.00 2,087 3.22 25,350 2.93 88Hong Kong 9.88 5.14 167 5.17 24,850 3.62 100 Japan 6.49 47.03 3,193 2.60 25,130 2.35 65Netherlands 26.78 0.26 436 4.27 27,190 3.65 65New Zealand — 0.00 74 4.66 19,160 3.64 86Singapore 6.29 1.94 94 8.42 22,680 5.67 100 South Korea 12.34 6.99 714 7.06 15,090 6.16 80Spain — 0.00 828 4.38 20,150 3.84 76United Kingdom 23.85 2.23 1,420 4.09 24,160 3.92 89
Summary: 7.77 68.62 12,186 3.74 23,912 3.70 84
DEVELOPING (EMERGING) MARKETS:Argentina — 0.00 424 4.45 11,320 3.16 90Brazil !27.25 0.00 1,269 4.50 7,360 3.13 82Chile 14.05 0.07 142 7.27 9,190 5.81 86China 67.51 6.36 5,111 11.30 4,020 10.27 37Colombia 29.16 0.07 303 4.12 7,040 2.25 75Costa Rica 23.59 0.29 37 6.50 9,460 4.37 60Dominican Repub. 54.92 0.20 60 7.59 7,020 5.88 59Ecuador !16.28 0.03 42 3.49 3,280 1.44 61Guatemala 26.17 0.52 51 5.47 4,400 2.85 46Honduras 7.38 0.07 19 4.31 2,830 1.61 45India 1.09 0.03 2,930 7.30 2,840 5.55 28Indonesia 10.34 0.97 615 5.21 2,940 3.80 43Malaysia 8.96 2.10 208 8.08 8,750 5.64 62Mexico 24.33 8.59 838 4.57 8,430 2.98 75Panama 45.76 0.48 17 5.03 5,750 3.33 57Peru 44.28 0.10 120 4.93 4,570 3.14 73Philippines 14.44 3.50 301 4.34 3,840 2.04 59Thailand 26.19 1.43 392 5.48 6,400 4.68 31Venezuela 20.70 0.17 140 2.93 5,670 0.85 87
Summary: 20.80 25.00 13,018 7.53 6,058 3.75 61
Sources: United Nations Statistics Division (2002); The World Bank (2003).Notes: GDP is gross domestic product; PPP is purchasing power parity; and a dash (—) indicates growth rate notavailable due to no reported exports in 2001.

Makki and Plummer Globalization of the Frozen Potato Industry 141
0
50
100
150
200
250
300
1991 92 93 94 95 96 97 98 99 2000 2001 YEAR
Source: United Nations Statistics Division (2002).
Figure 4. U.S. frozen potato exports to developed and emergingmarkets, 1991SSSS2001
!#! Emerging Markets: Export Growth Rate = 20.8% Export Market Share = 25%
!‚! Developed Markets: Export Growth Rate = 7.77% Export Market Share = 67%
Expo
rts ($
milli
ons)
vector of unknown parameters to be estimated, and eit is the error term. Subscript irepresents the country index and subscript t denotes time period, N is the number ofcountries, and T is the length of the time series for each country. The destinationcountry characteristics that are examined in this study include market size, economicdevelopment, trade openness, inflation rate, foreign direct investment (FDI), andshare of urban population.
The market size of the destination country is captured by the gross domesticproduct (GDP) in purchasing power parity (PPP) adjusted dollars, while the level ofeconomic development is captured by the per capita income in the destinationcountry, also in PPP-adjusted dollars. Both of these variables are expected to bepositively associated with exports. Trade openness, measured by the share of importsin the GDP, indicates the trade policies of the destination country. The annualinflation rate, on the other hand, is a proxy for the stability of a country’s fiscal andmonetary policies. A high inflation rate, for example, would indicate unstable macro-economic policies. Also, high inflation rates may suggest rapid devaluation of curren-cies in the destination countries, which could make imports more expensive. Theinflation rate is measured by the rate of change in the consumer price index (CPI).Trade openness is expected to be positively associated with exports, and inflation rateto be negatively associated with exports. We also control for gross FDI and urbanpopulation. FDI is measured in terms of aggregate inflow of foreign investments as ashare of GDP. Urban population is expressed as a share of total population.

142 Fall 2005 Journal of Agribusiness
The use of panel data has the advantage of providing additional insights into theeffects of both time and location characteristics, but the error term may exhibit serialcorrelation and heteroskedasticity. However, appropriate data transformations canmake the error term serial non-autoregressive and homoskedastic (Kmenta, 1986).We used the TSCSREG procedure included in the SAS software, which corrects thedata for both serial correlation and heteroskedasticity (SAS Institute, Inc., 1999).Specifically, the Parks method of estimation was chosen, which offers an efficientprocedure to model panel data with fixed effects (Parks, 1967). Based on preliminaryanalysis using the variance components method in the pooled data, the cross-sectionsaccount for most of the model’s error structure.
Econometric Results
Table 2 presents the parameter estimates for the developed and developing countries,as well as a combined estimation. As shown by the table, the model for developedcountries fits the data slightly better than the model for developing countries. Theadjusted R2 values are 0.93 and 0.85 for developed and developing countries, respec-tively. Findings of the econometric analysis indicate that U.S. exports of frozenpotato products are affected by various destination country characteristics and theirpolicies, discussed in further detail below.
Market Size
Market size of the importing country is perhaps the most important factor for thegrowth of the frozen potato industry. The purchasing power parity (PPP) adjustedGDP is used to measure the size of the destination country market. PPP adjustmentmakes the GDP comparable across different economies with different exchange ratesand costs of living. Larger market size was hypothesized to have a positive effect onU.S. exports of frozen potato products. Our econometric results confirm that thelarger the market size, the higher are U.S. exports of frozen potato products to bothdeveloped and developing countries. The estimated coefficients are statisticallysignificant (table 2).
Economic Development
Global per capita income grew rapidly in the 1990s, particularly in the emergingmarket economies. Increased purchasing power among consumers in those emergingeconomies has led to greater demand for food in general, and restaurant food inparticular. According to estimates, per capita income in the next decade is expectedto grow twice as fast in the developing countries relative to developed countries.This projected trend has significant implications for growth of the frozen potatoindustry in those markets. In this study, economic development is indicated by PPP-adjusted per capita income.

Makki and Plummer Globalization of the Frozen Potato Industry 143
Table 2. Parameter Estimates of U.S. Exports of Frozen Potato ProductsParameter Estimates
VariableDevelopedCountries
DevelopingCountries
AllCountries
Intercept !5,025.22* (!13.99)
!2,502.16* (!18.06)
!781.45* (!2.89)
Market Size 30.13* (29.29)
3.0486* (5.68)
16.64* (68.79)
Economic Development !0.1804* (!28.83)
0.1782* (15.14)
!0.0106 (!1.52)
Trade Openness 29.12* (22.32)
32.97* (23.81)
10.47* (7.48)
Inflation Rate !12.26* (!4.08)
!0.055* (!4.92)
!1.6716 (!0.45)
Share of Urban Population !0.0850* (!3.51)
!0.0088 (!1.74)
!0.0957* (!6.50)
Foreign Direct Investment (FDI) !10.46* (!9.26)
!30.50* (!10.65)
!44.71* (!33.74)
R2 0.9287 0.8530 0.9750
Notes: An asterisk (*) denotes t-score within 1% or better level of significance. Values in parentheses are t-statistics.
Results presented in table 2 suggest that per capita income affects U.S. exportsdifferently in developed and developing countries. In the case of developed countries,per capita income appears to be negatively related to U.S. exports of frozen potatoproducts, while the opposite is true for developing countries. The estimated coeffi-cients are statistically significant for both developed and developing countries.
A possible explanation for the finding of a negative relationship between exportsand per capita income in developed countries is that U.S. exports to developedcountry markets have leveled off somewhat in recent years due to market maturityand saturation. Consumers in these economies may be showing signs of declininginterest in frozen potato products—perhaps the result of increased consumer concernabout fat intake, and perhaps because of increased consumption of other foods (i.e.,diversity in the diet tends to increase with income). In contrast, income growthappears to be an important driving factor in the growth of U.S. exports in frozenpotato products to developing countries. QSRs, often selling frozen potato products,are typically a relatively inexpensive source of away-from-home food, and thereforeoften attract consumers with more restrictive budgets. The positive, statisticallysignificant coefficient implies that developing countries with high income growthrates are major growth markets for U.S. frozen potato products in the future.
Trade Openness
The trade openness of destination countries is a critical policy that influencesexports. Openness of a country to imports was hypothesized to have a positive effect

144 Fall 2005 Journal of Agribusiness
on U.S. exports in frozen potato products. As reported in table 2, the estimatedcoefficients for trade openness are positive and statistically significant in all threeequations, confirming that openness, as measured by share of imports of goods andservices in the destination country’s GDP, is positively associated with exports offrozen potato products in both developed and developing countries.
Inflation Rate
In this analysis, the inflation rate is used as a proxy for the degree of macroeconomicstability of a country. Inflation rate sends a signal to exporters on the stability offiscal and monetary policies in the destination country. In addition, inflationindirectly devalues the domestic currency and makes imported goods moreexpensive. Therefore, the inflation rate, measured as the annual percentage changein consumer prices, was expected to be negatively associated with U.S. exports offrozen potato products. Our results support this argument. The estimated coefficientsare negative and statistically significant for both developed and developing countries(table 2).
Share of Urban Population
With rapid urbanization in developing countries (the urban population is growingat 2.87% in developing countries compared to 0.76% in developed countries), thedemand for processed food products including frozen potatoes is expected to increase.This is because QSRs, the main outlet for frozen potato products, are typically moreconcentrated in urban areas of developing countries. The same is not necessarily trueof more sophisticated and better informed urban consumers in the developed world.In the case of developed countries, QSRs are more evenly distributed between urbanand rural areas, and urbanization may even have a negative impact on frozen potatoconsumption. As reported in table 2, the estimated coefficient for urban populationis negative for both developed and developing countries, but it is statistically signifi-cant only for developed countries—a result consistent with the declining demand forfrozen potato products in the developed countries.
Foreign Direct Investment
In recent years, there has been a rapid growth of FDI in potato production andprocessing. The exact impact of such FDI on exports is often hotly debated amongexperts (e.g., Malanowski, Handy, and Henderson, 1995; Overend, Connor, andSalin, 1995; Gopinath, Pick, and Vasavada, 1999; Makki, Somwaru, and Bolling,2004). Since the major purpose of FDI is to reduce transaction costs and improve thesupply of frozen potato products to QSRs, foreign production and processing ofpotatoes was hypothesized to substitute for exports from the home country. Resultsfrom table 2 show a significant, negative relationship between FDI and trade in bothdeveloped and developing country markets. This finding suggests that increased FDI

Makki and Plummer Globalization of the Frozen Potato Industry 145
may reduce exports of frozen potato products, implying substitution between thetwo. Moreover, it is consistent with the recent trends where multinational companiesare setting up production and processing facilities in foreign countries.
Concluding Comments
This study has examined the globalization of the frozen potato industry, includingthe expansion of production and processing of potato products in the global marketplace, and future prospects for the industry. Driven largely by the rising popularityof Western style cuisine, particularly the offerings of quick service restaurants,frozen french fries and other frozen potato products have become global commod-ities generating billions of dollars in revenue worldwide each year. In recent years,however, major markets including the United States, the European Union, and Japanare showing signs of maturing, with the growth rate in consumption slowing or evendeclining in some cases.
This analysis indicates that during the 1990s, the annual growth rate of U.S.frozen potato exports to developed countries was only 8%, but they accounted fornearly two-thirds of exports in volume. In contrast, U.S. frozen potato exports todeveloping countries grew at a rate of 21%, but accounted for only a third of totalexports. Concerns about health and increased consumption of alternative foods (e.g.,other fruits and vegetables) in developed countries are likely to decrease the demandfor potato products. However, per capita consumption of potatoes is low butincreasing in many developing countries.
The emerging markets may prove to be a potential source of future export growthfor U.S. frozen potatoes, and key factors such as an importing country’s market size,economic development, trade openness, and macroeconomic stability will likelydetermine the growth potential of the global frozen potato industry in the comingyears. Clearly, differences between developed and developing countries areimportant considerations when assessing the global market place for U.S. exports infrozen potato products. In the case of developing countries, for example, the percapita income is positively related to U.S. frozen potato exports, implying the likelypotential for further growth. In the case of developed countries, a negative associ-ation is found between per capita income and U.S. exports of frozen potato products,suggesting market maturity and saturation.
Several developing Asian countries including China, India, Indonesia, Malaysia,the Philippines, and Thailand, along with the Latin American countries of Chile,Brazil, and Mexico, are poised for significant economic growth in the next decade.These emerging markets have a combined urban population of over one billion, witha PPP-adjusted GDP of over $11 trillion. Additionally, these economies are growingfaster relative to developed country markets. Not only are growth rates of GDP andper capita income higher in developing countries, but also their food demand is moreincome-elastic. Producers of frozen potato products are likely to face increaseddemand as the demand for fast food rises in these countries.

146 Fall 2005 Journal of Agribusiness
References
American Frozen Food Institute. (2002). 2001 Frozen Food Pack Statistics Book. AFFI:McLean, VA.
Gopinath, M., D. Pick, and U. Vasavada. (1999). “The economics of foreign directinvestment and trade with an application to the U.S. food processing industry.”American Journal of Agricultural Economics 81, 442S452.
Huffaker, B., editor. (2003, September 18). North American Potato Market News 11(45).[Newsletter, Idaho Falls, ID].
Kmenta, J. (1986). Elements of Econometrics, 2nd edition. New York: Macmillan Pub-lishing Co., Inc.
Makki, S. S., A. Somwaru, and C. Bolling. (2004). “Foreign direct investment in thefood processing industry: A comparative analysis of developed and developing econ-omies.” Journal of Food Distribution Research 35, 61S67.
Malanowski, M., C. K. Handy, and D. R. Henderson. (1995). “Time-dependent relation-ships in U.S. processed food trade and foreign direct investment.” Paper presented atthe NCR-182 Conference on Foreign Direct Investment and Processed Food Trade,Arlington, VA.
Parks, R. W. (1967). “Efficient estimation of a system of regression equations whendisturbances are both serially and contemporaneously correlated.” Journal of theAmerican Statistical Association 62, 500S509.
Pierce, J. J. (2002, October). “EU frozen food consumption inches up, but maturemarkets face challenges.” Quick Frozen Foods International 44(2) [E. W. WilliamsPublications Co., Fort Lee, NJ]. Online. Available at www.qffintl.com.
———. (2003, October). “Europe’s growing frozen food market surpasses 12 millionton barrier.” Quick Frozen Foods International 45(2) [E. W. Williams PublicationsCo., Fort Lee, NJ]. Online. Available at www.qffintl.com.
Plummer, C., and S. S. Makki. (2002, October). “French fries driving globalization offrozen potato industry.” Agricultural Outlook, pp. 8S11.
Pompelli, G., and D. Pick. (1999). “International investment motivations of U.S.wineries.” International Food and Agribusiness Review 2(1), 47S62.
Overend, C., J. M. Connor, and V. Salin. (1995). “Foreign direct investment and U.S.exports of U.S. processed foods: Complements or substitutes?” Paper presented at theNCR-182 Conference on Foreign Direct Investment and Processed Food Trade,Arlington, VA.
SAS Institute, Inc. (1999). Data Analysis Sample Programs. Cary, NC: SAS Institute,Inc.
United Nations Statistics Division. (2002). Commodity trade statistics. United Nations,New York. Online. Available at http://unstats.un.org/unsd/comtrade/default.aspx.
The World Bank. (2003). World Bank Development database. Washington, DC.