Embed Size (px)
Citation preview

Economic History Association
The Impact of Globalization in the Roman Empire, 200 BC-AD 100Author(s): Ryan M. GeraghtySource: The Journal of Economic History, Vol. 67, No. 4 (Dec., 2007), pp. 1036-1061Published by: Cambridge University Press on behalf of the Economic History AssociationStable URL: http://www.jstor.org/stable/40056408 .
Accessed: 28/08/2013 13:42
Your use of the JSTOR archive indicates your acceptance of the Terms & Conditions of Use, available at .http://www.jstor.org/page/info/about/policies/terms.jsp
.JSTOR is a not-for-profit service that helps scholars, researchers, and students discover, use, and build upon a wide range ofcontent in a trusted digital archive. We use information technology and tools to increase productivity and facilitate new formsof scholarship. For more information about JSTOR, please contact [email protected].
.
Cambridge University Press and Economic History Association are collaborating with JSTOR to digitize,preserve and extend access to The Journal of Economic History.
http://www.jstor.org
This content downloaded from 159.178.22.27 on Wed, 28 Aug 2013 13:42:23 PMAll use subject to JSTOR Terms and Conditions
The Impact of Globalization in the Roman Empire, 200 BC-AD 100
Ryan M. Geraghty
The article employs a general equilibrium model to describe Italy's response to commodity and factor market integration during the expansion of the Roman Empire. This novel approach constructs a comprehensive story of the Italian economy that corroborates established developments and sheds light on contro- versial and unanswered questions. The success of the model supports arguments that Romans were rational economic actors and that the Roman economy was a well-integrated market system.
standard tenet of economics is that globalization, or the integration of world commodity and factor markets, has profound and predict-
able effects upon an economy's output mix, resource allocation, and in- come distribution. To study globalization and its effects, economists construct general equilibrium models that tell the story of the domestic impact of market integration.1 Yet no economic historian has employed general equilibrium techniques to study the development of the Roman imperial economy. Sparse data and uncertainty over the degree of impe- rial market integration and Romans' economic rationalism make the ap- plication of traditional models difficult.2 While acknowledging these limitations, this article employs a general equilibrium model to tell a coherent story of Italian peninsular development during Rome's expan- sion from 200 BC to AD 100. The novelty of this approach is the use of a formalized economic model to portray a broad picture of Italian eco- nomic development, and the purpose, beyond addressing questions of Roman history, is to argue that constructing such models is a powerful method of studying ancient history.
Historians make valid arguments that Rome's economic expansion had muted effects on the Italian economy, because subsistence farmers did not respond to market incentives and because Romans were moti- vated more by cultural and social factors than by economics.3 In addi- tion, historians contend that it is a mistake to project modern theories
The Journal of Economic History, Vol. 67, No. 4 (December 2007). © The Economic History Association. All rights reserved. ISSN 0022-0507.
Ryan M. Geraghty, 2124 Ashland Avenue, Santa Monica, CA 90405. E-mail: ryan.geraghty @gmail.com.
I am grateful for continuous advice and criticism from Jeffrey Williamson, Christopher Foote, Peter Temin, Christopher Jones, and Matthew Weinzierl. All errors, of course, are mine alone.
Williamson, Inequality: and O'Rourke, "Did the Great Irish Famine." 2 Sailer, "Framing the Debate." Garnsey, "Famine"; and Finley, Ancient Economy.
1036
This content downloaded from 159.178.22.27 on Wed, 28 Aug 2013 13:42:23 PMAll use subject to JSTOR Terms and Conditions
Impact of Globalization 1037
onto past societies that functioned in fundamentally different ways. Economic historians have dedicated much of their recent work, how- ever, to challenging these ideas for ancient Rome and for other places.5 For example, some scholars argue that Romans displayed economic ra- tionality in their management of landed estates and in their decisions about migration.6
Another controversial debate focuses on the importance of markets in Roman life and the extent to which imperial markets functioned as a "single economic unit."7 Whereas some historians argue that the impe- rial economy was neither integrated nor reliant upon markets for the ful- fillment of needs, others conclude that the market system was an impor- tant, if not the dominant, mode of exchange in the empire.8 Although he accepts that markets worked slowly and imperfectly, Peter Temin cata- logues the widespread use of prices across the empire and concludes that Roman provinces "functioned as part of a single comprehensive Mediterranean market."9
Approaching these debates directly requires knowing what Roman citizens were thinking or a more comprehensive knowledge of their in- teractions than the contradictory snippets that we possess today. Rather than speak directly to these debates, I develop and then formalize a con- ceptual understanding of the Italian economy based on the assumptions of perfect economic rationality and market integration. The consistency (or lack thereof) of the resulting predictions and the historical evidence provides an assessment of the model's assumptions and thus indirectly addresses the debates described above. In addition, the model provides a single, coherent view of Italian economic development that addresses many of the questions on which existing models and explanations are singularly focused. The success of the model in predicting what we know of Italian economic history supports the predictions on more con- troversial questions, the assumptions of economic rationality and mar- ket integration that underlay the model, and the approach itself. Of course, constructing a model is an iterative process and the model pre- sented here is basic and oversimplified. My aim, however, is only to convince readers that this approach to ancient history has enough poten- tial to merit the development of more refined and applicable models.
4 Finley, Ancient Economy, and Whittaker, Land. 5 Scheidel and von Reden, "Introduction"; and Schultz, Transforming Traditional Agricul-
ture. Rathbone, "Development"; Morley, "Metropolis "; and Kehoe, Management. Finley, Ancient Economy, p. 10. Finley, Ancient Economy; Garnsey, Cities; and Whittaker, Land.
9 Temin, "Market Economy," p. 169.
This content downloaded from 159.178.22.27 on Wed, 28 Aug 2013 13:42:23 PMAll use subject to JSTOR Terms and Conditions

1038 Geraghty
Economic historians have yet to employ general equilibrium models in the study of the ancient past, probably because the limited and uncer- tain data make the precise predictions possible in studies of the more re- cent past unattainable. More important than precise predictions, how- ever, is the broad picture of the Italian economy and its development that our economic reasoning and the available evidence convey. The lack of documentation from ancient Rome makes the available evidence a diverse array of archaeological findings, primary sources and govern- ment records, demographic and other models, and studies of more re- cent agricultural economies. Together with the application of economic logic, these fragments provide a picture of the past.
A GENERAL EQUILIBRIUM MODEL OF ROME
The general equilibrium model presented here is an integrated collec- tion of commodity and factor markets driven by supply and demand and together representing the entirety of the Italian economy. The model re- quires several simplifying assumption that are typical of general equi- librium analysis and will be described in what follows.10 The model's inputs are the exogenous variables, such as factor endowments and tradable commodity prices, determined in the empire as a whole and in- dependent of the Italian economy itself. By understanding the cause- and-effect relationships in the Italian economy and establishing how the exogenous variables evolved over time as a result of imperial expan- sion, one can measure the effects of expansion on the model's endoge- nous outputs, including the prices of tradable goods and resource inputs and the quantities of resources dedicated to each sector.
My model of the Roman economy consists of three main factors of production - land, labor, and slaves - and four final goods sectors - grain, wine, livestock, and urban goods. Two intermediate goods, feed and manure, provide realistic links between final goods sectors. The model also includes the annona, free grain provided to the populace of Rome by the imperial government. Finally, taxes expropriated from the provinces close the model and finance Italy's trade deficit.
Grain, wine, urban production, and livestock reflect the main sectors of the economy, making the model simple but realistic. Grain, the pri- mary commodity in the subsistence-based imperial economy, and wine, the primary luxury good, constituted 85 percent of the agriculture in cultivable areas.11 Livestock was prevalent further from cities in Italy's
10 O'Rourke, "Did the Great Irish Famine"; and Sodersten and Reed, International Economics. 1 '
Jongman, Economy, and Rathbone, "Development."
This content downloaded from 159.178.22.27 on Wed, 28 Aug 2013 13:42:23 PMAll use subject to JSTOR Terms and Conditions
Impact of Globalization 1039
higher altitude pastureland. Urban goods, which represent all produc- tion in cities and towns including pottery, cloth, furniture, glassware, ironware, and other metal products, help differentiate urban and rural populations.13 Although grain, wine, and urban goods were traded over long distances, the lack of refrigeration and the high cost of land trans- port made trade in livestock between Italy and the rest of the empire prohibitive.14 Transported "by the hoof," Italian livestock was delivered to nearby towns for local consumption.15
Thus, livestock prices are not tradable and determined within the model itself, whereas grain, wine, and urban goods prices are tradable and determined in imperial markets. This assumes that Italy was small compared to the imperial economy as a whole and did not impact prices determined in imperial markets. In fact, Italy was a significant imperial market, housing five of its 50 million people and possessing much of its wealth.16 Though I consider the impact of domestic markets in under- standing grain and wine prices, I leave the small open economy assump- tion in place to simplify the model.
The model also assumes that factor endowments of labor, slaves, and land were exogenous to the Italian economy. The quantity of labor was driven primarily by political shocks, such as conscription and coloniza- tion; high transportation costs prevented provincials from migrating in large numbers to take advantage of Italian economic prosperity.17 Simi- larly, the quantity of slaves was largely dependent on political shocks, mostly the winning of slaves in wars of conquests fought for territorial expansion or defense.18 The quantity of land in use was motivated both by economic forces, primarily the desire to bring new lands under culti- vation as the returns to agriculture grew, and by noneconomic forces, namely the pushing of peasants ejected from their old ancestral land to more marginal plots.19 Overall, assuming that factor endowments are
12 Morley, Metropolis; and Yeo, "Land and Sea Transportation." An excavation at the Pala-
tine indicates the relative importance of the different animals: 40 percent pigs, 30 percent sheep or goats, 20 percent fowl, and 10 percent cattle (Morley, Metropolis, p. 152).
Frank, Economic Survey. Yeo, "Land and Sea Transportation." 15 Morley, Metropolis. 16 Brunt, Italian Manpower.
17 Scheidel, "Human Mobility in Roman Italy, 1". Scheidel, "Human Mobility in Roman Italy, 2"; and Harris, "Roman Slave Trade." The de-
sire for additional slaves partially motivated some Roman wars, but the quest for Mediterranean supremacy, political prestige, and other forms of booty were usually more important. In fact, prisoners were often unforeseen consequences of conflicts, and Roman victories often provided thousands of slaves from single battles. Wars were also highly expensive, implying that the slave supply only responded to immense variation in price. See Shorter, Rome; Toynbee, Han- nibal 's Legacy: and Whittaker, Land.
19 Morley, Metropolis; Brunt, Italian Manpower; and Toynbee, Hannibal's Legacy.
This content downloaded from 159.178.22.27 on Wed, 28 Aug 2013 13:42:23 PMAll use subject to JSTOR Terms and Conditions

1040 Geraghty
exogenous is largely consistent with what we know of Italian labor, slaves, and land use at this time and usefully simplifies the model.
Though in later societies slaves and labor are often close substitutes, this model posits a differentiation between free and slave labor and the income shares that they receive from grain and wine production, based on their different characteristics in Roman society.20 Slaves worked harder and longer than peasants would tolerate.21 Peasant absences to fight wars reduced their reliability and their overall presence on the farm.22 Peasants excluded themselves from working on large estates alongside slaves for cultural reasons.23 Furthermore, while grain production requires intense labor only during peak season, wine production requires constant and in- tensive labor throughout the growing season.24 For this reason, slave la- bor, rather than free labor with its frequent absences and more lax work habits, was more profitably employed in wine production. The model captures this understanding by separating free and slave labor and by pos- iting different production functions for grain and wine.
The model includes the annona, or the dole of free grain provided by the imperial government, because it was a significant source of income for urban residents and probably an important psychological factor mo- tivating peasant migration to the capitol. At its peak some 300,000 Ro- man residents, or 5-10 percent of the Italian population, received the annona, and its prominence in the historical record suggest that its im- pact on the contentment of the Roman populace was greater than that.25 In addition, the prospect of free grain was probably appealing to peas- ants far from Rome, motivating their migration despite the annona's re- striction to only a slice of Roman residents. For the purposes of the model, I assume that the annona was free throughout its existence and distributed evenly among urban residents.
With the model broadly established, I now delve into and describe its parameters, which determine how changes in commodity prices and fac- tor endowments affect commodity and factor prices.26 The most impor- tant parameters define which and in what proportion the factors of pro-
20 Phillips, Slavery. Spun*, Arable Cultivation; and Rathbone, "Development." Spurr estimates that peasants
worked 150 days per year, whereas slaves were fully employed and worked 250 days per year. This sheds light on calculations of labor and slave costs. For example, Rathbone assumes that labor and slaves worked the same amount and calculates that slaves were more expensive than free peasants. Accounting for the shorter peasant work year, however, would make slave labor cheaper than peasant labor.
22 Hopkins, Conquerors. 23
Morley, Metropolis. 24
Rosafio, "Slaves." 25
Rickman, Corn Supply. 26 See Appendix Tables 4-7 for a complete summary of the model's parameters.
This content downloaded from 159.178.22.27 on Wed, 28 Aug 2013 13:42:23 PMAll use subject to JSTOR Terms and Conditions
Impact of Globalization 1 04 1
duction - labor, slaves, and land - receive income from the production and sale of each commodity. A combination of Roman contemporary agronomist texts, comparisons with later subsistence economies, and knowledge of the agricultural commodities themselves provide us the picture of how commodity revenues were split. What matters here are not exact figures but the overall picture of how resources combine to generate output.
Grain production requires a combination of free labor and land with small additions of slaves and manure. Roman peasants tended to pro- duce grain rather than wine for the reasons described previously.27 Agronomist texts and research on grain production in later periods largely corroborate this picture and add information on how agricultural output is divided amongst the labor force and landowners.28
Wine production, on the other hand, intensively demands slaves and largely excludes the other factors of production. Wine's dependence on slaves over free labor is described above, and its labor intensiveness and high value over land density make slaves more important than land as well. Agronomist texts educating contemporary Roman farmers on their vineyards paint a picture of wine production from which we can infer the share of each factor of production in wine output.29
Urban goods are produced by some combination of free labor and slaves. As no data exist on their relative importance, I assume that free labor and slaves shared the output of urban production evenly. Finally,
27 Again, grain's cyclical nature better suited their absences from the farm for war, grain re-
quired less intensive labor than did wine throughout the growing season, and, unlike wine, growing grain was not viewed as detrimental to their status.
The calibration of neoclassical production functions to a variety of subsistence economies, including Italy and Africa, shows that land's share of gross product is approximately one-half. See Clark and Haswell, Economics. Jongman's study of Pompeii provides evidence that the ag- ricultural workforce and land rents each absorbed half of total grain yields. Including manure and slaves requires reducing these proportions to 0.4, with manure and slaves contributing the remaining 0.2 of total product. See Jongman, Economy. A more detailed analysis of Roman
grain fanning based on the agronomist texts support this finding. An average plebeian family of four possessed a plot of about ten iugera, which J. K. Evans estimates produced approximately 250 modii of grain per annum for revenue of HS 1 ,000 per annum. See Evans, "Wheat Produc- tion"; and Duncan- Jones, Economy. Subsistence requirements amount to 0.56 of total produc- tion; as peasants satisfied their subsistence only partially with grain, peasant labor amounts to around 0.4-0.5 of their product, which is consistent with our earlier estimate.
29 Wine was far more labor-intensive than grain, requiring 25 to 35 days per iugerum com-
pared to grain's 10 to 15. See White, Roman Farming', and Spurr, Arable Cultivation. Cato's ideal vineyard of 100 iugera with yields of 1.6 cullei per iugerum earns a revenue of HS 16,000 and at a slave cost of HS 6,400 (assuming 16 slaves at a price of HS 2,000 each amortized over ten years with an additional subsistence cost of 50 modii of grain at HS 4 per modius), or 0.4 of total revenue. See Duncan- Jones, Economy; and Rathbone, "Development." Columella's pre- scription of one part free labor for each three parts slave labor leads a value of 0.15 for labor, and his estimate of land rents amount to HS 5,000 per annum for a 100 iugera plot for 0.3 of to- tal revenue. See Rathbone, "Development."
This content downloaded from 159.178.22.27 on Wed, 28 Aug 2013 13:42:23 PMAll use subject to JSTOR Terms and Conditions
1042 Geraghty
livestock production intensively employs land and feed and requires relatively little labor. As limited data exist for Rome, I apply Kevin O'Rourke's findings on livestock's factor income shares in pre- industrial Ireland to the Roman economy.30
Other parameters are the initial conditions of the Roman economy and the income elasticities of free labor, landowners, and slave owners, to whom all slave income accrues. The initial conditions describe an Italian economy dominated by grain production but lacking in wine, ur- ban, and livestock production, and abundant in labor and land but scarce in slaves.31 Income elasticities define how each factor of production spends the money it earns and thus affects how incomes are redirected to the consumption of other goods. Free labor primarily spends its money on subsistence and then spends small portions on other goods once subsistence requirements are satisfied.32 Landlords and slave own- ers spend their incomes on wine, urban goods, and livestock, reflecting their greater wealth spent on luxuries and the ease with which they cov- ered their subsistence needs.33
More detailed parameter specifications and explanations are included in the Appendix. Given the imprecise nature of the data, I examine the model's output for a broad range of parameters.
IMPERIAL EXPANSION AND THE EXOGENOUS SHOCKS TO THE ITALIAN ECONOMY
Imperial expansion affected the nature of the Italian economy in powerful ways. My model explains how the direct effects of expansion, or the exogenous shocks to the Italian economy, affected the decisions of economic actors and caused ripples throughout the economy. To study their consequences, we must first understand more completely the
30 O'Rourke, "Did the Great Irish Famine," p. 15. I use a land share of 0.5, a feed share of 0.35 and a slave share of 0.15 based on O'Rourke's figures.
I estimate a 0.10 urban labor share based on the size of Roman sewer systems, with the remainder of the labor force almost entirely dedicated to grain production. See Morley, Me- tropolis. I estimate that about 85 percent of Italy's land under cultivation produced grain; ap- proximately that amount was required to support its population of 4.9 million persons without grain imports. See Jongman, Economy. The remainder of the land was spent on wine or beef production. 32 Historians agree that laborers spent approximately 75 percent of their incomes on grain. See Garnsey, Famine, and Spurr, Arable Cultivation. I assume that laborers, with their near sub- sistence wages, produced urban goods at home, leaving 25 percent of their incomes for wine and livestock consumption.
The wealthy formed a trivial amount of the population, implying that their grain consump- tion was similarly trivial. Though income elasticities are not known, ancient texts suggest that wine was the most important consumption good for the wealthy, followed by urban products and then livestock. See Morley, Metropolis; and Purcell, "Wine."
This content downloaded from 159.178.22.27 on Wed, 28 Aug 2013 13:42:23 PMAll use subject to JSTOR Terms and Conditions
Impact of Globalization 1 043
shocks to the Italian economy and the degree of certainty and precision with which we know them.3 First I describe those that we know more confidently - the rise in the slave population, the expansion of land un- der cultivation, the decline in free labor, and growth of the annona - before addressing those that are more uncertain - the ambiguous change in grain prices and the rise in wine and urban goods prices. Throughout, I describe both the underlying cause-and-effect relationships that drive these changes and the available data.
The exogenous shock to the Italian economy most apparent in the historical record is the tremendous growth of the slave population after 200 BC. The constant influx of slaves from provincial wars more than offset slaves' high death rates and high rates of manumission and in fact accounted for virtually all of Italy's population growth during this pe- riod.35 Historians estimate that Italy's slave population was roughly 500,000 in 200 BC. Estimates of Italy's slave population 200 years later, based on war and economic records cataloguing slaves won from victo- ries and trades, range from 1.2 to 2 million people, or up to 30 percent of Italy's total population.36 Examining the estimates, I have most con- fidence in Walter Scheidel's detailed analysis of the demographic fac- tors affecting the slave population, which leads him to a conservative estimate of 1.2 million slaves in 1 BC.37 Of course, the precise figures based on historians' calculations are unimportant; what matters is the clear growth in the Italian slave population by a factor of two or more.
It is also fairly well established that the free population of Italy stayed constant or declined slightly after 200 BC. A balance of natural repro- duction against death rates, conscription, and colonization of the prov- inces determined the path of Italian population growth.38 Though we do not know whether the population remained constant or fell, it is clear
34 See Appendix Table 2 for a summary of the exogenous shocks considered in the model. Brunt, Italian Manpower, and Scheidel, "Human Mobility in Roman Italy, 2." 36 Ibid.
37 Scheidel, "Human Mobility in Roman Italy, 2." Higher estimates of around 2 million slaves
depend on estimates of slave populations in later periods, such as the antebellum South, Brazil, and the Caribbean, in which slave populations formed approximately 30 percent of the total population. Lower transportation costs in those economies permitted a higher degree of spe- cialization, however, than was possible in the Roman period. This makes the 30 percent figure improbably high for Roman society. Instead, Scheidel's estimates (Human Mobility in Roman
Italy, 2), based on the amount of slaves required for grain, wine, livestock, and urban produc- tion, amount to 1 .2 million, a high figure given the rapid death and manumission rates experi- enced by the slave population.
38 The main source of growth was natural increase. Based on eighteenth-century data, Scheidel estimates that the rural net rate of increase produces a 100 percent rise in the popula- tion by ad 14. A combination of high urban death rates, forced colonization, and high militari- zation rates reduce offset this source of growth and result in a small decline by most estimates. See Scheidel, "Human Mobility in Roman Italy, 1 ."
This content downloaded from 159.178.22.27 on Wed, 28 Aug 2013 13:42:23 PMAll use subject to JSTOR Terms and Conditions

1044 Geraghty
that the burden of imperial expansion, which required that free peasants serve in the army and populate foreign provinces, was a significant drain on the free labor population and stymied any material population gain. Most estimates point to a modest decline by 1 BC as the drain of imperial expansion overwhelmed natural reproduction.39
The expansion of land under cultivation during this period clearly fol- lows from our knowledge of Italian development, though little reliable evidence exists to support the claim. Gains in total population and the opening of provincial markets raised the returns of agriculture, making marginal lands profitable and motivating wealthier land and slave own- ers to push peasants to those marginal lands.40 The recovery of Italy from the Hannibalic War in the late third century BC also contributed to growth in land use.41 Based on the number of soldiers, the size of plots, and the degree to which these settlements did not disturb existing land- holders, the practice of granting soldiers settlement rights after wars by itself expanded land under cultivation by 5 percent.
2 Though the ar-
chaeological record provides evidence of expansion at this time, the lack of preserved remains from the prior period does not necessarily indicate that areas were uninhabited.43 However, the major factors driving the use of land all point to greater land use after 200 BC, and, though the data are lacking, an expansion in land under cultivation probably occurred.
The prominence of the annona in the historical record allows us to precisely quantify its growth. Originally, the Senate sold up to 40 modii of grain to about 50,000 Roman residents at a cost of HS 1.5 per mo- dius. By 54 BC, the annona provided 40 modii of free grain to nearly 300,000 Roman citizens, a number later reduced to 200,000.44
39 Brunt, Italian Manpower, Hopkins, Conquerors', and Scheidel, "Human Mobility in Roman Italy, 1." I use Brunt's figures of 4.4 million in 225 BC and 4.3 million in ad 14. Other historians arrive at different but roughly similar estimates. Scheidel uses 4 million in both 225 BC and ad 14 in his calculation of net migration rates. Hopkins estimates that Italy's population ranged from 4.0 million to 4.4 million by ad 14. Having examined figures within this range, I settled on Brunt's middle-of-the-road estimate.
Morley, Metropolis; and Toynbee, Hannibal 's Legacy. Toynbee, Hannibal's Legacy. Brunt, Italian Manpower. Brunt determines that only the settlements of Caesar and Augus-
tus in 59 BC and 30-25 bc succeeded in avoiding the appropriation of lands from peasants; thus, soldier land settlements contributed to a gain of 5 percent in the land endowment assuming each land allotment consisted of 5-10 iugera. 43 Garnsey, "Famine."
44 Rickman, Corn Supply. To include the annona in the model, I assume that it involved free grain distributions from inception and compute the quantity of grain distributed per capita. In the first period, the annona distributes two million modii, or 40 modii times 50,000 recipients, of grain to an urban population of 400,000 for an average of 5 modii per capita. In the second period, the annona distributes eight million modii, or 40 modii times 200,000 recipients, to 1 .2 million people for an average of 6 2/3 modii per capita, representing a gain of one-third.
This content downloaded from 159.178.22.27 on Wed, 28 Aug 2013 13:42:23 PMAll use subject to JSTOR Terms and Conditions
Impact of Globalization 1 045
The evolution of commodity prices after 200 BC is less clear than the more established changes in the slave and free labor populations, the degree of land use, and the annona. The lack of consistent price data makes any conclusions drawn from price comparisons tentative. How- ever, an examination of the evidence suggests that there was a signifi- cant expansion in trade throughout the empire, contributing to both strong correlations between commodity prices in Italy and the provinces and convergence between Italian and provincial prices. After 200 BC, the creation of provinces, the dispersion of the military and coinage, the construction of roads and canals, and the pacifying of the Mediterra- nean, among other factors, led to a substantial growth in imperial trade.45 Shipwreck data display a threefold rise in the number of ship- wrecks, a proxy for the number of voyages, from the third century BC to the first century BC.46 The growth of the money supply, which was used especially for long-distance exchanges, suggests a significant expansion in the quantity of traded goods.47 By the first century AD, commodity prices in Italy and in the provinces were highly correlated. For example, David Kessler finds a significant correlation between Egyptian and Ital- ian prices, with Italian prices responding to shocks in Egypt in a pre- dictable manner.48 In his analysis of supplying the city of Rome, Geoffrey Rickman concludes that "the situation in Rome was . . . [that] the local resources were not so relevant by the period of early Em- pire . . . What affected the Roman market more was first the failure of harvests in provinces overseas . . . ; secondly, inadequate supplies of shipping, and the destruction of corn ships in storms at seas . . ." 9
In addition, the growth of trade suggests that commodity prices in Italy and the provinces were converging. Imperial markets, primarily Egypt and North Africa, accounted for 50-75 percent of grain imports to Rome and at least 25 percent of demand for Italian wine.50 This sug- gests that imperial expansion led to an influx of provincial grain, de- pressing Italian grain prices; provided new markets for wine, raising Italian wine prices; and caused grain and wine prices in Italy and its provinces to converge. Indeed, according to Kessler, 90 percent of the grain price differential between Egypt and Italy was due to transporta- tion costs by the first century AD. x In the language of classical eco- nomic theory, Italy had a comparative advantage in wine and urban
45 Hopkins, "Taxes"; Greene, Archaeology; and Laurence, "Land Transport."
46 Parker, Ancient Shipwrecks. 47 Temin, "Market Economy"; and Duncan- Jones, Economy. 48 Kessler. "Feeding Rome."
49 Rickman, Corn Supply, p. 154. Kessler, "Feeding Rome"; Temin, "Market Economy"; and Tchernia, "Italian Wine." Kessler, "Feeding Rome."
This content downloaded from 159.178.22.27 on Wed, 28 Aug 2013 13:42:23 PMAll use subject to JSTOR Terms and Conditions
1046 Geraghty
goods production (because they employed intensively what Italy pos- sessed in abundance, slaves and an urban labor force) and a comparative disadvantage in grain (because grain employed intensively what Italy possessed in scarcity, land).
With this broad picture established, I now examine the factors affect- ing commodity prices and the available data in more detail. Economic forces pulled Italy's grain prices in opposite directions. The opening of the provinces substantially expanded the supply of grain reaching Ital- ian markets and placed downward pressure on grain prices. Meanwhile, domestic factors, primarily the growth in Italy's total population, in- creased demand, and the conversion of resources from producing grain to other goods reduced Italian supply, pushing prices higher. The path of grain prices becomes an empirical question on which the data are in- conclusive.52 For the purposes of the model, I follow the small open economy assumption and hold that grain prices fell. However, the model's results are consistent across a range of grain price changes, in- cluding constant prices and moderate price growth.
Unlike the case of grain, economic forces unambiguously pressured wine and urban goods prices higher. After 200 BC, both wine and urban goods faced greater demand from the rest of the empire and from do- mestic consumers.53 Whereas the data tentatively indicate that wine prices rose over our period, the data on urban goods prices are non- existent.54
Our understanding of directional changes and approximate magni- tudes is sufficient to draw logical conclusions about the development of the Italian economy from our conceptual framework of how the Italian economy worked. The following sections address the predictions of the model - first those that are consistent with existing evidence to establish the model's credibility and then those that address more controversial issues.
52 Duncan- Jones uses Trajan's alimentary scheme, which provided boys allowances of HS 16 per month and girls HS 10 per month, to infer a price of HS 4 per modius at the close of the first century ad. See Duncan- Jones, Economy. During the food shortages of ad 19 and ad 64, Ti- berius and Nero imposed price ceilings of HS 2 and HS 3 per modius, curiously low price fig- ures that suggest correspondingly low market prices. Prices fluctuated between HS 1 and HS 10 per modius during and after the Hannibalic War. See Garnsey, Famine. Few data exist for Italy in the late second century and early first century BC, but a price in Sicily of HS 3-3.5 per modius suggests that the Italian price was HS 5-6 per modius in the first century BC. See Rickman, Corn Supply. This tentatively points to a decline from HS 5 to HS 4 over our period. 53 Purcell, "Wine."
Cato, writing in the second century BC, employs an average wine price of HS 10 per am- phora. See Rathbone, "Development." Two centuries later, Columella uses an average wine price of HS 15, probably an exaggeration. Prices could vary significantly around these bench- marks, ranging from HS 8 to HS 64 in the first century. See Duncan- Jones, Economy.
This content downloaded from 159.178.22.27 on Wed, 28 Aug 2013 13:42:23 PMAll use subject to JSTOR Terms and Conditions

Impact of Globalization 1 047
RESULTS AND INTERPRETATION
What, then, does the model predict? The model's results turn out to be consistent across a broad range of plausible parameter values and exogenous inputs. Moreover, the model's directional predictions are largely consistent with the available evidence. On the other hand, the model's predictions of magnitude generally overshoot the historical re- ality, thus exposing the flaws in our assumptions of an Italian small open economy, perfect markets and economic rationality.
Nonetheless, the model's success in predicting known economic de- velopments in Italy after 200 BC lend credence to its implications for more controversial questions. Among its comforting successes are two major, well-documented developments in the Italian economy after 200 BC: the shift from grain to wine production in the countryside and the migration of free labor from rural to urban areas. The model also makes more controversial predictions: peasants migrate mostly due to pull factors and not push factors; slave owners gain from imperial ex- pansion while landowners lose; and the bulk of Italian wealth derives from the expropriation of resources and people from the provinces.
First among the predictions that lend credence to the model is the shift from grain to wine production in the Italian countryside, though the model overestimates the degree of this transition.56 In the model, the rise in wine prices relative to grain prices makes wine more profitable than grain. The growth in slaves relative to land and free labor makes slaves cheaper and wine production relatively less expensive. In re- sponse Romans redirect resources from grain to wine production, and Italy exports its wine surplus and imports its grain shortage.57
55 See Appendix Table 3 for a summary of the model's predictions. The model's average result is a decline in grain production of 36 percent and a fourfold gain
in wine production, ranging from a threefold gain to a fivefold gain. These changes result from a transfer of 51 percent of Italy's land from grain to wine production. This magnitude is far greater than the most likely historical reality. The model's overestimate directly follows from its simplify- ing assumptions and is an example of the model's known imprecision. Jongman's analysis esti- mates that no more than 5 percent of Italian land was converted to vineyards at this time. He shows that enough wine production for Italy's urban population required only 1 percent of its cul- tivable area, and that 20 percent of Italy's cultivable area would have produced enough wine for the entire empire. In this saturated market environment where few resources are able to satisfy market demand, the production of more wine would reduce prices, in turn limiting the amount of resources dedicated to wine. The model, however, does not account for this phenomenon because it assumes that Italian production does not have an effect on imperial market prices. This is given by the small open economy assumption, which is typical in computable general equilibrium mod- els. As I discuss, because of this and other simplifying assumptions the model cannot be used as an analytical tool to make quantitative predictions; however, these limitations do not call into question the conceptual story that the model conveys. See Jongman, "Slavery."
The model predicts that wine exports grow by a factor of 20 and grain imports by a factor of 17; in fact, grain imports grew by a factor of 6-12. See Garnsey and Sailer, Roman Empire.
This content downloaded from 159.178.22.27 on Wed, 28 Aug 2013 13:42:23 PMAll use subject to JSTOR Terms and Conditions
1048 Geraghty
The archaeological evidence of Italian trade with the provinces and land use and contemporary Roman accounts support this story. Grain imports to Italy grew from five million modii per year in 200 BC to 30- 60 million modii per year by 1 BC.58 Wine exports also peaked at this time; the excavation of amphorae, or wine containers, reveal significant Italian wine exports to Gaul that declined over the subsequent centu- ries.59 Shipwreck data also show that over half of shipwrecks on ship- ping routes from Italy to Gaul occurred in the second and first centuries BC. ° Examining the Italian countryside, archaeological digs throughout Campania and Etruria indicate a proliferation of wine-producing villa sites through the first century BC, with 22 percent of land in Etruria and 15 percent of land near Pompeii dedicated to wine production.61 The largest, most elaborate villas were inhabited in roughly the same 100 year period that corresponds with the growth, peak, and decline of the Italian wine industry. Contemporary Romans were aware of these changes. As Pliny the Elder writes, "Then come the favoured country of Campania; in this valley begins those vine clad hills with their glorious wine . . . famous all the world over, and ... the scene of the severest com- petition between Father Liber [wine] and Father Ceres [grain] . . . ."62
A second major prediction of the model is a significant migration of free labor from rural to urban areas.63 In the model, a combination of ris- ing urban goods prices, the expansion of the annona, and falling grain prices makes city life more attractive than country life, while higher re- turns to wine production motivate landowners to push peasants off their lands and convert them into villa estates. Although the question of why peasants migrated remains controversial, the mass migration of peasants predicted by the model is well established. Based on city and town re- mains and contemporary written records, historians estimate that the pen- insula's urban population grew from 500,000 in 200 BC to 1.2 million two centuries later. 4 Using estimates of urban death rates, Scheidel calculates that rapid urbanization absorbed 1.8 to 2.2 million peasants between 200 and 1 BC. The mass migration of peasants from the hinterland to Rome and other cities was a phenomenon not seen again in Western history un- til London's boom more than a millennium later.
58 Gamsey and Sailer, Roman Empire. Morley, Metropolis; Tchernia, "Italian Wine." Parker, "Ancient Shipwrecks." Greene, Archaeology; Arthur, Romans: and Jongman, Economy and Society. 62 Morley, Metropolis. The model predicts that the proportion of free labor living in urban rises by 20 percent of
the total population. The model's prediction of nearly 30 percent of peasants living in cities is consistent with historians' estimates. See Hopkins, Conquerors, for an estimate of Italy's urban population.
Brunt, Italian Manpower; and Scheidel, "Human Mobility in Roman Italy, 1."
This content downloaded from 159.178.22.27 on Wed, 28 Aug 2013 13:42:23 PMAll use subject to JSTOR Terms and Conditions

Impact of Globalization 1 049
In two major areas, the model's implications are consistent with the evidence, although the predicted magnitudes overestimate the historical reality. What, then, does it say about the more controversial and un- known questions of why peasants migrated, who gained and who lost, and how Italy became wealthy? Many existing theories about why peas- ants migrated emphasize that profit-hungry aristocrats and low grain prices pushed peasants from their land and that imperial expansion left ordinary Romans destitute by the first century AD. 5 More recent theo- ries, less prevalent in the literature, suggest that pull factors, notably opportunities in cities and towns, inspired most urban migration.66 The model can speak to the question by allowing us to estimate the fraction of the shift from grain to urban production driven by push and pull fac- tors. According to the model, pull factors, primarily the rise in urban goods prices and the expansion of the annona, drive 80 percent of peas- ant migration after 200 BC.
Scheidel's recent demographic analysis lends support to this conclu- sion. The variations of the push theory focus on peasant dislocation in the second century BC, either as a result of Hannibal's pillaging of the Italian countryside, falling grain prices, or constant militarization of the peas- antry.67 By contrast, pull theories focus on growing opportunities, such as the rise of the annona and Italian urban production, which became more
AS
prevalent in the first century BC and afterwards. Scheidel's analysis shows that growing Italian cities required an increasing supply of immi- grants to replenish their populations because urban death rates exceeded birth rates, a conclusion more consistent with the timing of pull theories than push theories.69 Scheidel's analysis favors pull theories of migration over the push theories and casts doubt on theories that imperial expansion impoverished Roman peasants by driving them from their lands.
The literature is unclear on who gained and who lost from imperial expansion, though it is generally agreed that peasants lost while aristo-
65 Hopkins, Conquerors; Brunt, Italian Manpower, and de Neeve, Colonus. Scheidel, "Human Mobility in Roman Italy, 1"; Morley, Metropolis; and Jongman,
"Slaves." 67 Arnold Toynbee argues that peasants fled their farms for the safety of city walls during the
Hannibalic War around in the late third century BC. During their absence, Hannibal wrecked their land and aristocrats bought abandoned, devastated plots at fire sale prices, leaving peasants destitute in cities and towns. However, P. W. de Neeve observes that Hannibal's destruction of
only a limited area of countryside is an insufficient explanation for the widespread rural depopu- lation apparent in the archaeological record. He argues that falling grain prices motivated peas- ants to abandon their farms for better opportunities in urban areas. Another plausible push the-
ory is that the constant burden of militarization over two centuries made peasants unable to sustain their livelihoods on their farms, forcing them to abandon their homes and migrate to ur- ban centers. See Toynbee, Hannibal 's Legacy; de Neeve, Colonus; and Hopkins, Conquerors.
Morley, Metropolis. Scheidel, "Human Mobility in Roman Italy, 1"; and Jongman, "Slaves."
This content downloaded from 159.178.22.27 on Wed, 28 Aug 2013 13:42:23 PMAll use subject to JSTOR Terms and Conditions

1050 Geraghty
crats gained. Our model, however, tells a different story. It acknowl- edges that falling grain prices reduce free labor's real income because most laborers were employed in grain production. This is almost en- tirely offset, however, by growing opportunities in urban areas and the expansion of the annona, for a minimal net effect on free labor in- come.70 The model's story thus contradicts those who believe that peas- ants were made destitute by falling grain prices, evictions, and slave imports. But it fits Peter Garnsey's conclusion that peasant livelihoods remained unaffected by imperial expansion, although for different rea- sons. Whereas Garnsey believes that peasants continued to farm their smallholdings undisturbed, the model predicts that peasants maintained their incomes only by responding to changing economic conditions and moving to urban areas.71 The massive migration of free labor from the countryside to cities and towns - around two million peasants over 200 years, at approximately the same rate as English peasant migration in the nineteenth century - suggests that the model's story is more accu- rate.72
Overall, the model tells a more complex story about land and slave owners. Landowners lose while slave owners gain, as falling grain prices and more scarce free labor make grain production less profitable and rising wine prices and more abundant slaves make wine production more lucrative. Wealth thus shifts to aristocrats wealthy enough to own slaves at the expense of middling landowners who cannot afford slaves and for whom selling their lands and migrating to cities is an unappeal- ing option.73 Projecting these predictions onto the past, aristocrats' in- comes would have declined in the second century BC, as grain prices fell, only to rise again to new heights as wine production flourished.
There is some evidence of trouble for Roman landowners in the sec- ond century BC and substantial evidence for high and climbing returns to owning slaves. Landlords' ability to purchase large plots of land in the second century suggests depressed prices at that time.74 The decline in the structure and size of rural residences and the depopulation of pro- ductive areas indicate that formerly wealthy aristocrats had fallen on hard times.75 On the other hand, the price of slaves, or the present value
70 The model predicts that real wages decline by 9 percent because downward pressure from falling grain prices and rising wine prices more than offsets upward pressure from rising urban prices and the expansion of the annona.
71 Garnsey, Cities. For a comparison to English migration, see Scheidel, "Human Mobility in Roman Italy, 1 ." 73 The model predicts that land rents decline by a total of 46 percent, while slave prices grow
by a total of 160 percent. As a result, aristocrats' real income grows by 92 percent. Hopkins, Conquerors. Morley, Metropolis', and de Neeve, Colonus.
This content downloaded from 159.178.22.27 on Wed, 28 Aug 2013 13:42:23 PMAll use subject to JSTOR Terms and Conditions

Impact of Globalization 1051
of slave returns, grew significantly during this period. A catalogue of the prices slaves paid for their freedom at Delphi indicates a 50 percent gain in slave prices, or the present value of slave returns, after 200 BC.76 Mentions of slave prices in contemporary sources, including Livy and Tacitus, suggest an eight- to tenfold gain in slave prices between 200 BC and AD 200.
As the wine industry flourished and the returns to slave owning grew, slave owners accumulated enormous and unprecedented for- tunes. Richard Duncan-Jones's catalogue of Roman private fortunes reveals that the number of Romans with more than HS 200 million grew sixfold by the early imperial era.78 Sites in Latium and Campania became larger, more common, and of much higher quality construc- tion and decoration after 100 BC, and praise of magnificent villas in these areas replaced descriptions of fertile grain lands.79 Indeed, the first century BC witnessed the construction of more elaborate and finer villas than ever before.
As slave owners became wealthier Roman society became immensely unequal, a reality evident at the time. Seneca compares the unimpres- sive size of the residence of general and consul Scipio Africanus, circa 200 BC, to those of his own day in the first century AD.81 Livy com- ments that the wealth requirements for Senate membership doubled dur- ing this period.82 A calculation of Gini coefficients based on Livy's fig- ures suggest that the Gini coefficient of the Italian population rose from 0.11 in the second century BC to 0.23 100 years later. Indeed, the aver- age senator generated 200 times more income than a peasant's subsis- tence wages in the early imperiumP Roman fortunes of HS 400 million surpassed sixteenth- and seventeenth-century English totals by a factor of 1 8-72 in wheat equivalent, and Gini coefficients of Roman land- ownership compare to British figures from the early modern age.84 The model also provides an explanation why and how this occurred - not through the exploitation of peasants, but through the importing of vast
76 Hopkins, Conquerors, p. 1 59. The inscriptions indicate that prices rose from 403 drachmae
to 641 drachmae in the final two centuries BC. Jones, "Slavery." Here I combine Jones's two conclusions: that Roman slave prices in the
second century ad were eight to ten times higher than Athenian prices in the fourth century BC and that Roman prices in the second century BC were low compared to the Athenian prices. 7 Duncan- Jones, Economy, p. 343. 79 Rathbone, "Development"; and Morley, Metropolis. 80 Curti, Dench, and Patterson, "Archaeology."
Frank, Economic Survey. Shatzman, Senatorial Wealth. Jongman, Economy. I assume from Cato that the rate of return on senator landholdings was
6 percent. 84 Duncan- Jones, Economy, p. 5. The Roman Empire exceeded Britain in population by a fac- tor of 18.
This content downloaded from 159.178.22.27 on Wed, 28 Aug 2013 13:42:23 PMAll use subject to JSTOR Terms and Conditions
1052 Geraghty
quantities of slaves and the opening of new provincial markets for slave-intensive production.
Finally, the model addresses the question of the sources of Roman wealth after 200 BC. In the model Roman wealth derives from two po- tential sources - the expropriation of provincial wealth, including grain and slaves, and the gains from the market economy. Although the litera- ture often describes Rome's seizure of vast quantities of provincial wealth in the form of tribute and slaves, the questions of how much Italy gained and whether its gains derived from expropriation or mar- kets are hardly addressed.85 The model predicts that Italy's total factor income rises 25 percent during this period: 5 percent from market inte- gration and 20 percent from seizures of wealth and people.86 In other words, the Italian economy's expansion is driven primarily by the ex- propriation of provincial wealth, but also significantly by gains from trade. The prediction only provokes further questions, as few data exist to corroborate or deny this interpretation.
That the model's story fit the historical evidence in two well- established aspects of Italian development - the rural transition from grain to wine production and the migration of peasants to cities and towns - makes its more controversial predictions plausible. These con- troversial predictions find support in the historical evidence as well. The model's success also lends credence to its assumptions of a well- integrated market system in the Roman empire and of economic ration- ality among the Romans. The degree to which the model's predictions of magnitude overshoots observed historical phenomena, however, re- veal that its oversimplified assumptions fail to capture the more com- plex reality of Roman times.
CONCLUSION
In this article I construct a simplified general equilibrium model of the Roman economy, in order to shed light both on the validity of my assumptions and on the big questions of Italian economic development. I proceed to defend and explain the model and to describe the changes exogenous to the model that resulted from Rome's imperial expansion. Although the model's predictions of magnitude tend to overstate ob- served phenomena, its directional predictions - the conclusions drawn from the underlying logic on which the model is based - tell a broad
85 Whittaker, Land. In this calculation, I count gains from changes in commodity prices and returns to labor,
land, and slavery as gains from market integration and gains from changes in taxes collected and the slave endowment as gains from provincial exploitation.
This content downloaded from 159.178.22.27 on Wed, 28 Aug 2013 13:42:23 PMAll use subject to JSTOR Terms and Conditions
Impact of Globalization 1053
story of Roman economic development that is confirmed by the avail- able historical evidence. This fit between the model and the available evidence supports the model's other predictions and its assumption of well-integrated imperial markets and Roman economic motivation and rationalism.
Further research can apply such models to study other aspects of an- cient history, such as the decline of Italy after the first century AD or the impact of monetary inflation in the later empire, or use them to refine our assumptions about the Roman economy. Imperial markets suffered from immense communication lags and costs not reflected in this model.87 Romans were not solely motivated by economics but also by rules-of-thumb, social pressures, and conventions.88 They were not pure profit maximizers but instead focused on maintaining their subsistence and reducing their risk of ruin.89 Italy was a major part of the Roman economy and probably affected commodity prices throughout the em- pire. The model's simplified assumptions about these realities make it a useful tool for telling the broad story of Italian economic development but limit its use as a precise predictive tool. Introducing these complexi- ties into the model would make its story a more realistic portrayal of Italian economic development and would refine, but not substantially change, our understanding.
The basic power of a model is its formalization of our understanding of cause and effect relationships. The combination of formalized under- standing and the available data allows us to make more powerful pre- dictions than we can make with the available data alone. This makes models a useful for the study of ancient history, where our data are lim- ited. Furthermore, the power of an economic model such as that used here is its crystallization of a coherent story that considers the complex interactions of many simultaneous changes in an economy and delivers a broad series of testable predictions. This quantified story is more comprehensive and more testable than the historical models often fo- cused on single questions in isolation. Despite these advantages, I be- lieve that historians and economists alike have hesitated to employ eco- nomic models in their study of the ancient world because the degree of precision that these models typically require is unknowable for that era. However, economic models do not necessitate knowing the precise out- line of an economy to tell a basic, coherent, and accurate story. The broad
87 Yeo, "Land and Sea Transportation"; Morley, Metropolis', and Duncan- Jones, Economy. Finley, Ancient Economy; Temin, "Market Economy"; Purcell, "Wine"; and Hopkins,
Conquerors. Garnsey, Cities.
This content downloaded from 159.178.22.27 on Wed, 28 Aug 2013 13:42:23 PMAll use subject to JSTOR Terms and Conditions
1054 Geraghty
use of economic models in the study of the distant past would make a significant positive impact on our understanding of ancient history.
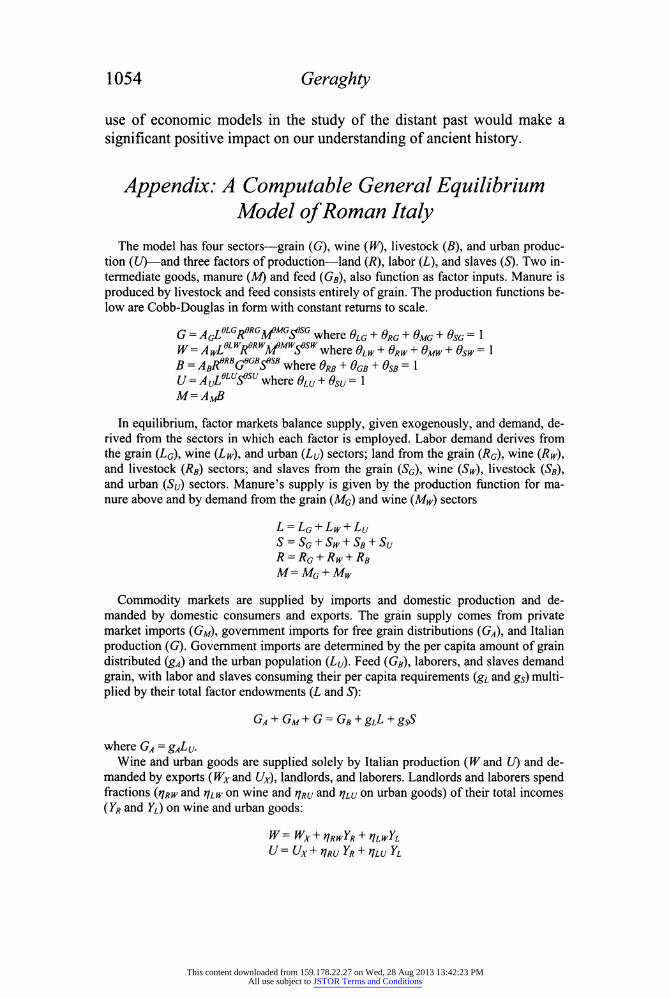
Appendix: A Computable General Equilibrium Model of Roman Italy
The model has four sectors - grain (G), wine (W), livestock (#), and urban produc- tion (U) - and three factors of production - land (R), labor (L), and slaves (S). Two in- termediate goods, manure (M) and feed (GB)9 also function as factor inputs. Manure is produced by livestock and feed consists entirely of grain. The production functions be- low are Cobb-Douglas in form with constant returns to scale.
G = AcLeLGReRGKfMG?fSG where 0LG + 6RG + QMG + 0SG = 1 W = AwLeLWReRW\fMWtf)sw where 0LW+0RW+0w+0sw = 1 B = ABRdRBGeGB^SB where 0RB + 0GB + 0SB=\ U = AuL6W^slJ where 0LU + 0su=l M=AmB
In equilibrium, factor markets balance supply, given exogenously, and demand, de- rived from the sectors in which each factor is employed. Labor demand derives from the grain (LG)9 wine (Z,^), and urban (Ly) sectors; land from the grain (RG), wine (Rw), and livestock (RB) sectors; and slaves from the grain (SG), wine (Sw), livestock (SB), and urban (Su) sectors. Manure's supply is given by the production function for ma- nure above and by demand from the grain (MG) and wine (Mw) sectors
L = LG + Lw + Lu S = SG + Sw + SB + Su R = RG + Rw + RB M=MG + MW
Commodity markets are supplied by imports and domestic production and de- manded by domestic consumers and exports. The grain supply comes from private market imports (GM), government imports for free grain distributions (GA), and Italian production (G). Government imports are determined by the per capita amount of grain distributed (gA) and the urban population {Lv). Feed (GB), laborers, and slaves demand grain, with labor and slaves consuming their per capita requirements (gi and gs) multi- plied by their total factor endowments (Z, and S):
GA + GM+G = GB + gLL+gsS
where GA=gALu. Wine and urban goods are supplied solely by Italian production (W and U) and de-
manded by exports (Wxand Ux), landlords, and laborers. Landlords and laborers spend fractions (rjRW and rjLW on wine and r/RU and rjLU on urban goods) of their total incomes (YR and YL) on wine and urban goods:
W=Wx+fiRwYR + riLwYL U=Ux+rjRUYR + rlLUYL
This content downloaded from 159.178.22.27 on Wed, 28 Aug 2013 13:42:23 PMAll use subject to JSTOR Terms and Conditions
Impact of Globalization 1055
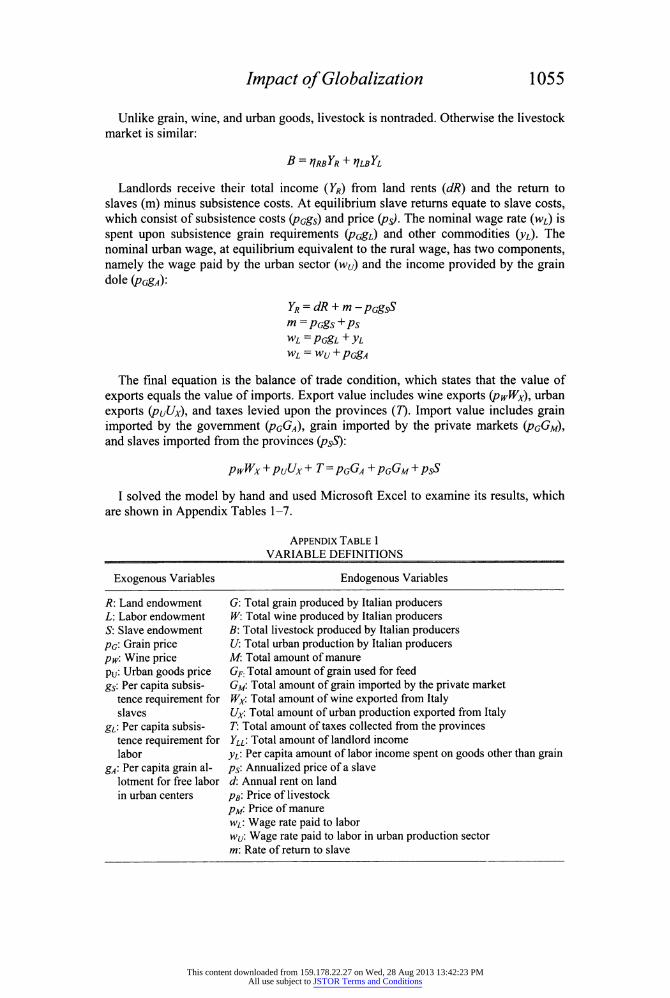
Unlike grain, wine, and urban goods, livestock is nontraded. Otherwise the livestock market is similar:
B = rjRBYR + rjLBYL
Landlords receive their total income (YR) from land rents (dR) and the return to slaves (m) minus subsistence costs. At equilibrium slave returns equate to slave costs, which consist of subsistence costs (pGgs) and price (ps). The nominal wage rate (wL) is spent upon subsistence grain requirements (pGgi) and other commodities (yL). The nominal urban wage, at equilibrium equivalent to the rural wage, has two components, namely the wage paid by the urban sector (wu) and the income provided by the grain dole (pGgA)'
YR = dR + m-pGgsS m=PGgs+Ps WL=PGgL+yL WL = Wu+PGgA
The final equation is the balance of trade condition, which states that the value of exports equals the value of imports. Export value includes wine exports (pwWx), urban exports (puUx), and taxes levied upon the provinces (7). Import value includes grain imported by the government (pgGa), grain imported by the private markets (pgGm), and slaves imported from the provinces (psS):
PwWx+PuUx+ T=pGGA +pGGM + psS
I solved the model by hand and used Microsoft Excel to examine its results, which are shown in Appendix Tables 1-7.
Appendix Table 1 VARIABLE DEFINITIONS
Exogenous Variables Endogenous Variables
R: Land endowment L: Labor endowment S: Slave endowment pG: Grain price pw\ Wine price Pu: Urban goods price gs: Per capita subsis-
tence requirement for slaves
gL: Per capita subsis- tence requirement for labor
gA: Per capita grain al- lotment for free labor in urban centers
G: Total grain produced by Italian producers W\ Total wine produced by Italian producers B: Total livestock produced by Italian producers U: Total urban production by Italian producers M: Total amount of manure GF Total amount of grain used for feed GM: Total amount of grain imported by the private market Wx: Total amount of wine exported from Italy Ux: Total amount of urban production exported from Italy T: Total amount of taxes collected from the provinces YLL: Total amount of landlord income yL\ Per capita amount of labor income spent on goods other than grain ps'. Annualized price of a slave d: Annual rent on land pB: Price of livestock Pm. Price of manure wL: Wage rate paid to labor wy. Wage rate paid to labor in urban production sector m: Rate of return to slave
This content downloaded from 159.178.22.27 on Wed, 28 Aug 2013 13:42:23 PMAll use subject to JSTOR Terms and Conditions
1056 Geraghty
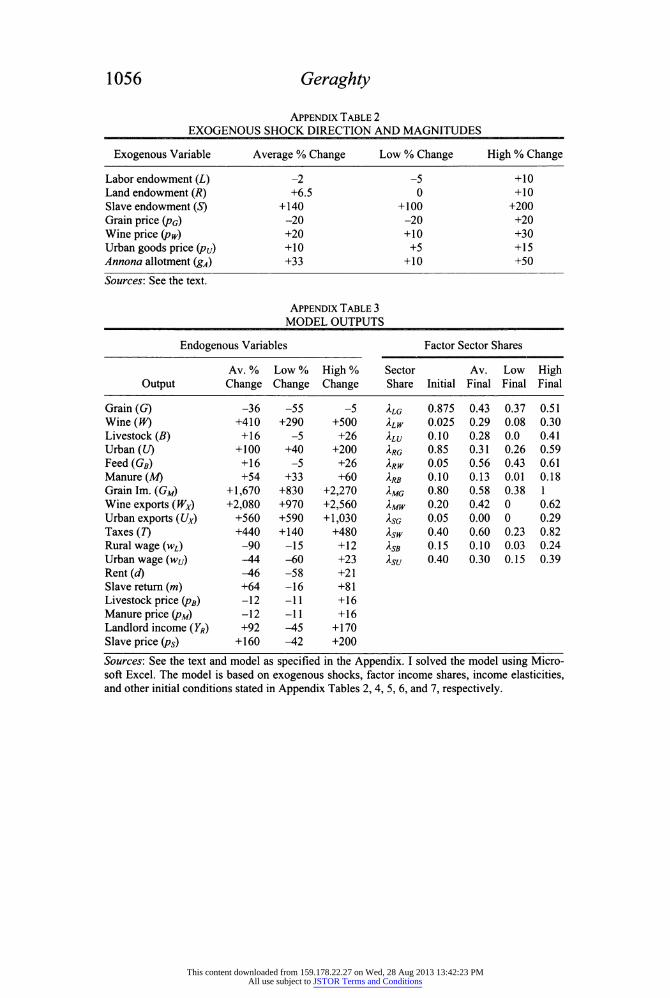
Appendix Table 2 EXOGENOUS SHOCK DIRECTION AND MAGNITUDES
Exogenous Variable Average % Change Low % Change High % Change
Labor endowment (I) -2 -5 +10 Land endowment (R) +6.5 0 +10 Slave endowment (5) +140 +100 +200 Grain price (pG) -20 -20 +20 Wine price 0M +20 +10 +30 Urban goods price (pv) +10 +5 +15 Annona allotment (gA) +33 +10 +50
Sources: See the text.
Appendix Table 3 MODEL OUTPUTS
Endogenous Variables Factor Sector Shares
Av. % Low% High% Sector Av. Low High Output Change Change Change Share Initial Final Final Final
Grain (G) -36 -55 -5 kLG 0.875 0.43 0.37 0.51 Wine(JF) +410 +290 +500 kLW 0.025 0.29 0.08 0.30 Livestock (5) +16 -5 +26 kw 0.10 0.28 0.0 0.41 Urban (U) +100 +40 +200 kRG 0.85 0.31 0.26 0.59 Feed(G5) +16 -5 +26 kRW 0.05 0.56 0.43 0.61 Manure (M) +54 +33 +60 kRB 0.10 0.13 0.01 0.18 Grain Im. (GM) +1,670 +830 +2,270 kMG 0.80 0.58 0.38 1 Wine exports (Wx) +2,080 +970 +2,560 Aw 0.20 0.42 0 0.62 Urban exports (Ux) +560 +590 +1,030 kSG 0.05 0.00 0 0.29 Taxes (7) +440 +140 +480 ksw 0.40 0.60 0.23 0.82 Rural wage (wL) -90 -15 +12 kSB 0.15 0.10 0.03 0.24 Urban wage (wt/) -44 -60 +23 ksu 0.40 0.30 0.15 0.39 Rent(rf) -46 -58 +21 Slave return (m) +64 -16 +81 Livestock price (pB) -12 -11 +16 Manure price (pM) - 1 2 - 1 1 +16 Landlord income (YR) +92 -45 +170 Slave price (ps) +160 -42 +200
Sources: See the text and model as specified in the Appendix. I solved the model using Micro- soft Excel. The model is based on exogenous shocks, factor income shares, income elasticities, and other initial conditions stated in Appendix Tables 2, 4, 5, 6, and 7, respectively.
This content downloaded from 159.178.22.27 on Wed, 28 Aug 2013 13:42:23 PMAll use subject to JSTOR Terms and Conditions

Impact of Globalization 1057
Appendix Table 4 EXOGENOUS FACTOR INCOME SHARES
Factor Income Share Average Value Low Value High Value
6LG 0.4 0.3 0.5 6RG 0.4 0.3 0.5 Omg 0.15 0.1 0.2 0SG 0.05 0.01 0.10 6LW 0.15 0.1 0.2 0RW 0.3 0.2 0.4 Bmw 0.1 0.05 0.15 0sw 0.45 0.3 0.6 Orb 0.5 0.4 0.6 6GB 0.35 0.3 0.4 0SB 0.15 0.1 0.2 6W 0.5 0.4 0.7 0su 0.5 0.3 0.6
Note: A factor income share is the proportion of income derived from the sale of an output that is earned by each factor in its production. For example, the share of total revenue from grain production that the labor producing grain sees as income is labor's factor income share of grain (Ota). Sources: See the text.
Appendix Table 5 INITIAL FACTOR SECTOR SHARES
Factor Sector Share Average Value Low Value High Value
kLG 0.875 0.8 0.95 kLW 0.025 0.01 0.1 kLU 0.10 0.05 0.15 kRG 0.85 0.7 0.9 kRW 0.05 0.01 0.10 kRB 0.1 0.05 0.15 kMG 0.8 0.7 0.9 Xmw 0.2 0.1 0.3 kSG 0.05 0.01 0.10 ksw 0.4 0.3 0.5 ksB 0.15 0.1 0.2 ksu 0.4 0.3 0.5
Note: A factor sector share is the proportion of the factor dedicated to the production of a sector. For example, the proportion of labor dedicated to grain production is the factor sector share of labor with respect to grain (kLG). Sources: See the text.
This content downloaded from 159.178.22.27 on Wed, 28 Aug 2013 13:42:23 PMAll use subject to JSTOR Terms and Conditions
1058 Geraghty
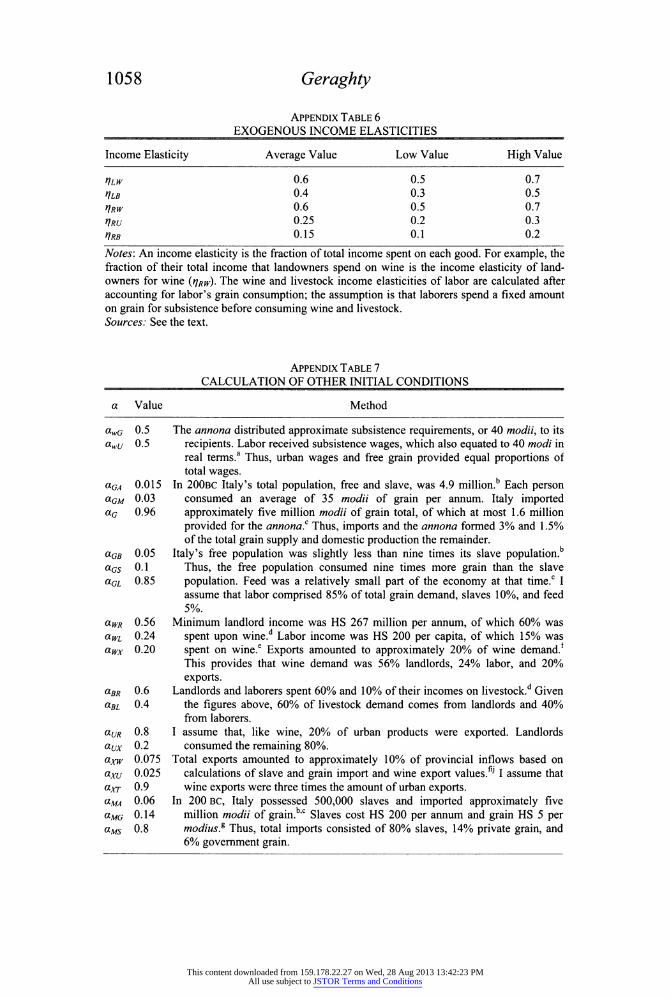
Appendix Table 6 EXOGENOUS INCOME ELASTICITIES Income Elasticity Average Value Low Value High Value
nLW 0.6 0.5 0.7 rjLB 0.4 0.3 0.5 nRW 0.6 0.5 0.7 nRU 0.25 0.2 0.3 nRB 0.15 0.1 0.2
Notes: An income elasticity is the fraction of total income spent on each good. For example, the fraction of their total income that landowners spend on wine is the income elasticity of land- owners for wine {nRW). The wine and livestock income elasticities of labor are calculated after accounting for labor's grain consumption; the assumption is that laborers spend a fixed amount on grain for subsistence before consuming wine and livestock. Sources: See the text.
Appendix Table 7 CALCULATION OF OTHER INITIAL CONDITIONS a Value Method
awG 0.5 The annona distributed approximate subsistence requirements, or 40 modii, to its awU 0.5 recipients. Labor received subsistence wages, which also equated to 40 modi in
real terms.a Thus, urban wages and free grain provided equal proportions of total wages.
aGA 0.015 In 200bc Italy's total population, free and slave, was 4.9 million.5 Each person aGM 0.03 consumed an average of 35 modii of grain per annum. Italy imported aG 0.96 approximately five million modii of grain total, of which at most 1.6 million
provided for the annona.0 Thus, imports and the annona formed 3% and 1.5% of the total grain supply and domestic production the remainder.
aGB 0.05 Italy's free population was slightly less than nine times its slave population.5 aG$ 0.1 Thus, the free population consumed nine times more grain than the slave aGL 0.85 population. Feed was a relatively small part of the economy at that time.0 I
assume that labor comprised 85% of total grain demand, slaves 10%, and feed 5%.
aWR 0.56 Minimum landlord income was HS 267 million per annum, of which 60% was awi 0.24 spent upon wine.d Labor income was HS 200 per capita, of which 15% was awx 0.20 spent on wine.e Exports amounted to approximately 20% of wine demand.f
This provides that wine demand was 56% landlords, 24% labor, and 20% exports.
aBR 0.6 Landlords and laborers spent 60% and 10% of their incomes on livestock.*1 Given aBL 0.4 the figures above, 60% of livestock demand comes from landlords and 40%
from laborers. aUR 0.8 I assume that, like wine, 20% of urban products were exported. Landlords aux 0.2 consumed the remaining 80%. axw 0.075 Total exports amounted to approximately 10% of provincial inflows based on axu 0.025 calculations of slave and grain import and wine export values.^ I assume that olxt 0.9 wine exports were three times the amount of urban exports. aMA 0.06 In 200 bc, Italy possessed 500,000 slaves and imported approximately five aMG 0.14 million modii of grain.bc Slaves cost HS 200 per annum and grain HS 5 per aMS 0.8 modius.g Thus, total imports consisted of 80% slaves, 14% private grain, and
6% government grain.
This content downloaded from 159.178.22.27 on Wed, 28 Aug 2013 13:42:23 PMAll use subject to JSTOR Terms and Conditions

Impact of Globalization 1059
Appendix Table 7 - continued
a Value Method
olrr 0.65 Italy contained 40 million iugera of land, of which 40% was cultivated. I assume aRS 0.35 that the average price per iugerum was HS 400, and that the return on land was
6%.h Italy possessed 500,000 slaves that cost HS 400 per annum.8 This means that land accounts for 65% of landlord income and slaves 35%.
amQ 0.5 Slave prices of HS 2,000 provide amortized prices of HS 200. Slave subsistence amp 0.5 costs also amounted to HS 200.g Thus, slave costs were 50% price and 50%
subsistence. awG 0.75 Labor spent approximately 75% of their income on grain and 25% on other any 0.25 consumption goods.a anL 0.60 Italy's free population of 4.4 million earned HS 200 per capita per annum. e Its ans 0.14 slave population of 500,000 earned returns of HS 400 per capita per annum. g
anR 0.25 Italy possessed 40 million iugera of land, of which 40% was under cultivation. anT 0.01 As above, the average land price was HS 400, and the average return was 6%.h
Taxes paid for grain imports of five million modii at HS 4 per modius.c
Notes'. This table provides my assumptions on the Italian economy's initial conditions around 200 bc where not already given by factor income shares, factor sector shares, or income elastic- ities. Included in this table (in order) are the proportion of urban labor's total wages derived from the production of urban goods and the annona; the proportion of grain consumed in Italy originating from Italian farms, grain imports, and the annona; the proportion of each commodity output (grain, wine, livestock, and urban goods) consumed by labor, slaves, landlords, and (for grain) as feed; the proportion of total exports in the form of wine, urban goods, and taxes; the proportion of total imports in the form of the annona, other grain, and slaves; the proportion of landlord income earned from land and slaves; the proportion of slave prices derived from sub- sistence costs and slave prices; the proportion of labor income spent on grain and other goods; and the proportion of total GDP derived from labor, slaves, land, and taxes. Sources'. aGarnsey Cities, Peasants and Food, p. 96. b Brunt Italian Manpower, p. 121. c Rickman, Corn Supply, pp. 36-42. d Jongman, Economy and Society, p. 195; and Table 6.
eGarnsey , Cities, Peasants and Food, p. 96; and Table 6. f Tchernia, "Italian Wine," p. 92. g Rickman, Corn Supply, p. 151; and Duncan- Jones, Economy, p. 12. h Duncan- Jones, Economy, pp. 51-52. 1 Garnsey and Sailer, Roman Empire.
] Scheidel, "Human Mobility in Roman Italy, 2."
REFERENCES
Arthur, Paul. Romans in Northern Campania: Settlement and Land-Use Around the Massico and the Garigliano Basin. London: British School at Rome, 1991.
Brunt, P. A. Italian Manpower, 225 B.C.-A.D. 14. Oxford: Clarendon Press, 1971. Clark, Colin, and Margaret Haswell. The Economics of Subsistence Agriculture. Third
Edition. London: Macmillan, 1967. Curti, Emmanuele, Emma Dench, and John R. Patterson. "The Archaeology of Central
and Southern Roman Italy: Recent Trends and Approaches." The Journal of Ro- man Studies 86 (1996): 170-89.
Duncan- Jones, Richard. The Economy of the Roman Empire: Quantitative Studies. Cambridge: Cambridge University Press, 1982.
This content downloaded from 159.178.22.27 on Wed, 28 Aug 2013 13:42:23 PMAll use subject to JSTOR Terms and Conditions
1060 Geraghty
Evans, J. K. "Wheat Production and its Social Consequences in the Roman World." The Classical Quarterly 31 (1981): 428-42.
Finley, Moses I. The Ancient Economy. Berkeley: University of California Press, 1973.
Frank, Tenney. An Economic Survey of Ancient Rome, Volume V: Rome and Italy of the Empire. Paterson, NJ: Pageant Books, 1959.
Garnsey, Peter. Cities, Peasants, and Food in Classical Antiquity. Ed. Walter Schei- del. Cambridge: Cambridge University Press, 1998.
. Famine and Food Supply in the Graeco-Roman World: Responses to Risk and Crisis. Cambridge: Cambridge University Press, 1988.
Garnsey, Peter, and Richard Sailer. The Roman Empire: Economy, Society, and Cul- ture. Berkeley: University of California Press, 1987.
Greene, Kevin. The Archaeology of the Roman Empire. London: B. T. Batsford Ltd, 1986.
Harris, William V. "Towards a Study of the Roman Slave Trade." In The Seaborne Commerce of Ancient Rome: Studies in Archaeology and History, edited by J. H. D'Arms and E.C. Kopff. Rome: American Academy at Rome, 1990.
Hopkins, Keith. Conquerors and Slaves: Sociological Studies in Roman History. Vol. 1. Cambridge: Cambridge University Press, 1978.
. "Taxes and Trade in the Roman Empire (200 B.C.-A.D. 400)." The Journal of Roman Studies 70 (1980): 101-25.
Jones, A. H. M. "Slavery in the Ancient World." The Economic History Review 9, no. 2 (1956): 185-99.
Jongman, Willem. The Economy and Society of Pompeii. Amsterdam: J. C. Gieben, 1988.
. "Slavery and the Growth of Rome: The Transformation of Italy in the Second and First centuries B.C.E." In Rome the Cosmopolis, edited by Catherine Ed- wards and Greg Woolf, 100-22. Cambridge: Cambridge University Press, 2003.
Kehoe, Dennis P. Management and Investment on Estates in Roman Egypt during the Early Empire. Bonn: Dr. Rudolf Habelt Gmbh, 1992.
Kessler, David. "Feeding Rome: The Roman Grain Market, 200 BC-200 AD." Har- vard Undergraduate Economic Thesis, 2004. Available in Harvard Archives.
Laurence, Ray. "Land Transport in Roman Italy: Costs, Practice, and the Economy." In Trade, Traders, and the Ancient City, edited by Helen Parkins and Christopher Smith. London: Routledge, 1998.
Morley, Neville. Metropolis and Hinterland: The City of Rome and the Italian Econ- omy, 200 B.C-A.D.200. Cambridge: Cambridge University Press, 1996.
de Neeve, P. W. Colonus: Private Farm-Tenancy in Roman Italy during the Republic and the early Principate. Amsterdam: J. C. Gieben, 1984.
O'Rourke, Kevin. "Did the Great Irish Famine Matter?" This Journal 51, no. 1 (1991): 1-22.
Parker, A. J. Ancient Shipwrecks of the Mediterranean and the Roman Provinces. Ox- ford: BAR International Series, 1992.
Phillips, William D. Slavery from Roman Times to the Early Transatlantic Trade. Minneapolis: University of Minnesota Press, 1985.
Purcell, N. "Wine and Wealth in Ancient Italy." The Journal of Roman Studies 75 (1985): 1-19.
Rathbone, Dominic W. "The Development of Agriculture in the 'Ager Cosanus' dur- ing the Roman Republic: Problems of Evidence and Interpretation." The Journal of Roman Studies 1\ (1981): 10-23.
This content downloaded from 159.178.22.27 on Wed, 28 Aug 2013 13:42:23 PMAll use subject to JSTOR Terms and Conditions
Impact of Globalization 1061
Rickman, Geoffrey. The Corn Supply of Ancient Rome. Oxford: Clarendon Press, 1980.
Rosafio, Pasquale. "Slaves and Coloni in the Villa System." In Landuse in the Roman Empire, edited by Jesper Carlsen, Peter Orsted, and Jens Erik Skydsgaard, 145- 58. Rome: Analecta Romana Instituti Danici, 1994.
Sailer, Richard. "Framing the Debate over Growth in the Ancient Economy." In The Ancient Economy, edited by Walter Scheidel and Sitta von Reden. New York: Routledge, 2002.
Scheidel, Walter. "Human Mobility in Roman Italy, 1: The Free Population." The Journal of Roman Studies 94 (2004): 1-26.
. "Human Mobility in Roman Italy, 2: The Slave Population." The Journal of Roman Studies 95 (2005).
Scheidel, Walter, and Sitta von Reden. "Introduction." In The Ancient Economy, ed- ited by Walter Scheidel and Sitta von Reden. Edinburgh: Edinburgh University Press, 2002.
Schultz, Theodore W. Transforming Traditional Agriculture. New Haven, CT: Yale University Press, 1964.
Shatzman, Israel. Senatorial Wealth and Roman Politics. Brussels: Latomus Revue D'Erudes Latines, 1975.
Shorter, David. Rome and her Empire. New York: Longman, 2003. Sodersten, Bo, and Geoffrey Reed. International Economics. Third Edition. London:
Macmillan, 1994. Spurr, M. S. Arable Cultivation in Roman Italy c.200 B.C-c.A.D. 100. London: Soci-
ety for the Promotion of Roman Studies, 1986. Tchernia, Andre. "Italian Wine in Gaul at the End of the Republic." In Trade in the
Ancient Economy, edited by Peter Garnsey, Keith Hopkins, and C. R. Whittaker, 87-105. Berkeley: University of California Press, 1983.
Temin, Peter. "A Market Economy in the Early Roman Empire." The Journal of Ro- man Studies 91 (2001): 169-81.
Toynbee, Arnold J. Hannibal 's Legacy: The Hannibalic War 's Effects on Roman Life, Volume II: Rome and her Neighbors after Hannibal's Exit. London: Oxford Uni- versity Press, 1995.
White, K. D. Roman Farming. Ithaca, NY: Cornell University Press, 1970. Whittaker, C. R. Land, City, and Trade in the Roman Empire. Brookfield, VT: Va-
rorium, 1993. Williamson, Jeffrey G. "The Impact of the Corn Laws just Prior to Repeal." Explora-
tions in Economic History 27 (1990): 123-56. . Inequality, Poverty, and History: The Kuznets Memorial Lectures of the Eco-
nomic Growth Center, Yale University. Oxford: Basil Blackwell, 1991. Yeo, Cedric. "Land and Sea Transportation in Imperial Italy." Transactions and Pro-
ceedings of the American Philological Society 11 (1946): 221-44.
This content downloaded from 159.178.22.27 on Wed, 28 Aug 2013 13:42:23 PMAll use subject to JSTOR Terms and Conditions