Embed Size (px)
Citation preview
Globalization and Poverty:Implications of South Asian Experience for the Wider Debate
Jeffery RoundUniversity of Warwick
John WhalleyUniversities of Warwick and Western Ontario
August 2002
Abstract
This paper discusses linkages between globalization and poverty in four South Asian countries,drawing upon eight papers prepared for a DFID-supported project. These countries were chosen,in part, because liberalization occurred in these countries in the mid 1980s to early 1990s andwas substantial, providing clear globalization shocks as a laboratory experiment to discusslinkage. Countries generally seem to experience declines in absolute poverty over the periodwith roughly constant relative poverty (i.e. inequality). Determining linkage effects is, however,difficult as the analyses show. Excluded, non-globalization, variables such as changes inremittances in the Pakistan case, account for much of the inequality change, and once removedcan change its sign. Depending upon whether trade liberalization is in the form of tariff change.Whether tariff revenue is forgone by an equal yield VAT or a progressive income tax or otherfactors, different inequality impacts can be attributed to globalization. Grand generalizations asto globalization-poverty linkage do not seem to follow from these country episodes.
KEYWORDS: Globalization, poverty, inequality, South Asia
JEL classification: O2, O53
AcknowledgementThis paper was prepared for an ESCOR project ‘Exploring the Links Between Globalization and Poverty in SouthAsia’ which is part of the Globalisation and Poverty Programme, funded by the Department of InternationalDevelopment (DFID) UK. For International Development (DFID) UK. The Programme includes fourteen projectson a three-year programme of research exploring the linkages between globalisation processes and poverty. Earlierversions of this paper were presented at the 5th Annual CSGR conference ‘Globalization, Growth and (In)Equality’,March, 2002 and at the MIMAP modellers meeting. University of Laval, June, 2002. We thank participants for theirhelpful comments.

1
1. Introduction
Substantial heat and in some ways limited light surrounds the linkages between globalization and
poverty. Despite the allegations and concerns that globalization adversely affects the poor
(Khor, 2002; Watkins, 2002), and especially so in poorer countries, and counter-claims that it has
‘supported’ poverty reduction (World Bank, 2002), conclusive evidence on the linkages and the
magnitude of effects is difficult to find. There is extensive literature discussing the possible
channels through which globalization and poverty are linked1 and a body of theoretical and
empirical literature seeming to provide evidence either in one direction or the other (O’Rourke,
2001; McKay, Winters and Kedir, 2000; Dollar and Kraay, 2001; and Weller and Hersch, 2002)
so the outcomes are, at best, ambiguous.
Precise definitions of globalization are elusive, but it is usually interpreted as an increase in
integration between and within countries, manifested through an increase in the movement of
commodities, labour, capital (financial and physical capital), and technology. The wide-ranging
nature of these globalization processes and the inherent difficulties in identifying and measuring
them, in terms of either their initial shocks or their impacts on various parts of the economic
system (especially their impact on welfare and poverty) creates a number of analytical and
empirical challenges. Even if we focus on one kind of globalization shock (e.g. trade
liberalization) and we consider the consequences analytically (via a modeling framework) it
might be seen to have quite different effects in different models and under different rules and
experiments.
1 For example, McCulloch, Winters and Cerera (2001) review the transmission channels of trade liberalization onpoverty.

2
As regards poverty, great care is needed in clarifying what form of poverty one is discussing. It
can be interpreted as 'money-metric' based poverty or expressed in terms of more broadly-based
social indicators (Ravallion, 1993). Clearly the measure of poverty used matters. Measures
depend on the choice of relative or absolute numbers below poverty lines, on nominal or real
incomes, the reference unit (households, individuals, household subgroups); or they may rely on
other measures of relative poverty based on skilled/unskilled wage differentials, or on the
relative incomes of population subgroups. Data on poverty is often fragmentary, and where
available data may be inconsistent one source compared with another, so inferences are quite
difficult to make2.
In this paper we address many of these analytical difficulties by identifying some linkages
between globalization and poverty in four South Asian economies that have been the subject of
investigation in a DFID project, involving researchers from Bangladesh, India, Pakistan, and Sri
Lanka. In the project each researcher has executed some modeling work aimed at quantitatively
evaluating the sign and significance of key elements of linkage; how capital flows and changes
in foreign remittances occurring simultaneously with tariff changes influence the results of
tariff/inequality studies; how significant export surges in garment industries have been for
reducing gender inequality; how the separate influences of trade and technical change occurring
under globalization can be measured; and other such targeted analyses. In the course of
executing this work, broader questions have also been considered. Just what has been the record
on poverty and inequality change in these countries as globalization processes have occurred?
2 Throughout this paper inequality is referred to as relative poverty’ in order to reflect the income or well-being ofone group (e.g. the poor) relative to another (e.g. the rich).

3
When did major globalization shocks (such as trade liberalization) occur, and how did inequality
measures seemingly respond and when? What does a crude data based analysis of linkage
suggest? What are some of the pitfalls in using data in model based counterfactual analyses in
trying to unearth directions and size of linkage mechanisms? The paper addresses these issues
by considering some of the broader themes and results that emerge from the project.
An appraisal of the data on poverty in the South Asian countries suggests that major change has
occurred in terms of absolute poverty (numbers below the poverty line) and that this change has
accelerated as growth performance has picked up post liberalization. Nevertheless the broad
picture is one of relatively unchanging relative poverty (inequality) in the region over the last
few decades (at least until recently) despite a major trade liberalization in the late 1980s and
early 1990s. Still, some paradoxical situations do emerge from the data; increasing inequality in
Pakistan post liberalization; a period of slightly increasing and then falling relative poverty in
Bangladesh post liberalization; and some evidence of sharper increases in inequality in India in
the late 1990s. A major change does seem to have occurred in terms of absolute poverty
(numbers below the poverty line) in the region, and this change has accelerated as growth
performance has picked up post liberalization. But it is difficult to ascribe precise reasons for
these poverty outcomes.
In assessing the role of various elements of linkage, the paper makes a number of points. One is
that the choice of poverty measure, even going beyond the relative and absolute poverty issue,
matters. Another is that the structure of models used to unearth linkage is critical. Models with
specific immobile factors have localized rents that change in a narrow and focused way with
4
trade liberalization; models with mobile factors do not have this feature. Quotas in models (if
unauctioned) confer rents which liberalization takes away; quotas which are auctioned or sought
(rent seeking) do not have these features. Trade policies that raise revenues (tariffs), if replaced
by similar revenue raising instruments (a progressive income tax, or a VAT), may see their
perceived inequality effects largely determined by the replacement policies. Many other pitfalls
exist in such analyses, to the point that one can argue that meaningful discussion of globalization
poverty linkage can only take place if very precise contours for the discussion exist. Is
globalization inequality worsening in a particular model of a particular economy using certain
assumptions and conducting a precise experiment? Without such specificity, precise answers to
the linkage conundrums cannot be given; with any small change in setup the answers could
change.
As such, our paper differs from the recently published DFID Handbook on Trade Liberalization
and Poverty (McCulloch, Winters and Cirera (2001)) that provided the background work to the
DFID White Paper on globalization. This piece argued that ‘in general, trade liberalization is an
ally in the fight against poverty’ (McCulloch, et al, 2002; 3) without drawing the
relative/absolute distinction. It focused on impacts on goods prices, wages, and employment; not
the conventional equilibrium/shifting impacts. It also suggested that agriculture and services
were key sectors for poverty alleviation with limited intersectoral analysis; and did not highlight
the many pitfalls in assessing the nature and magnitude of linkage. The current paper uses
detailed analyses of the South Asian experience to add to the debate on globalization and poverty
linkage. Besides this introductory section the paper is organized into four other sections.
Section 2 considers the evidence and some of the difficulties (both conceptual and practical) in

5
determining when liberalization occurs and at what speed. In two of the countries (Sri Lanka
and Pakistan) liberalization was gradual, whereas in India and Bangladesh liberalization was
much more rapid. The evidence on changes in poverty is briefly reviewed in Section 3. Section
4 then draws together the results from the simulation exercises. There is considerable variety in
terms of both the experiments and the modeling approaches. We purposely do not use one single
generic model and apply it to each country. Instead, the models range from small, stylized, and
more transparent models to much larger, CGE models embracing macro and micro closures. The
final section, Section 5, distills from these experiments some conclusions about the broad effects
of globalization on poverty.
2. Dating globalization shocks in four South Asian economies
As 'globalization' and 'liberalization' are terms which are open to such wide interpretation, it is
not surprising that there is little consensus about identifying dates when countries may be said to
have 'globalized' or 'liberalized'. But the issue pervades much of the literature, most notably in
the recent paper by Dollar and Kraay (2001) in which they attempt to subdivide a sample of
developing countries into 'post-1980 globalisers' and the rest (i.e. essentially 'non-globalisers').
Their aim was to consider the relative growth and poverty performance of the two groups.
Dollar and Kraay identify post-1980 globalisers in terms of two alternative, simple, trade-related
measures. The first is an outcome measure, based on the growth in trade relative to GDP while
the second is a policy measure, based on the decline in average tariff rates. Each measure has
some deficiencies and Dollar and Kraay acknowledge certain anomalies in the classifications.

6
A second measure, the Sachs-Warner index (Sachs and Warner, 1997) is more to do with the
timing of liberalization than with the aim of producing a binary classification. Their measure is
based on five tests: (1) average tariff rates below 40%; (2) average quota and licensing coverage
of imports of less than 20%; (3) a black market exchange premium of less than 20%; (4) no
extreme controls (taxes, quota and state monopolies) on exports; and (5) not considered a
socialist country by the Kornai standard (Sachs and Warner, 1997; 339). An economy is deemed
to be open to trade if all five tests are satisfied. In principle of course, the Sachs-Warner index
could be used to identify the speed as well as the timing of liberalisation, by observing how
rapidly the five tests are satisfied. However, each test is scored on a pass/fail basis so it would
give no indication of how rapidly average tariff rates or average quota coverage (say) are
reduced, it would only indicate the rate at which the cumulative position on the five tests has
been attained.
Some countries are generally believed to have liberalized more quickly than others in terms of
key indicators (especially trade and financial indicators) and objective measures are hard to
devise. The four South Asian countries considered here are a case in point. India and
Bangladesh appear in both of Dollar and Kraay's lists of 'Post-1980 globalisers'; Pakistan appears
in the list under one criterion (a reduction in tariffs) but not the other (and Dollar and Kraay seem
unconvinced by its inclusion anyway); and Sri Lanka does not appear at all. However, in the
original Sachs-Warner index (Sachs and Warner, 1995) the picture is a little different. Sri Lanka
and India are included in the list of developing countries that had ‘opened’ by 1994 (after initial
closure) and Bangladesh and Pakistan are in the list of countries that were still closed by 1994.
But all four countries have liberalized, at least to a large degree. What really distinguishes them

7
is the speed at which they have liberalised their trade. So to appraise this more carefully we now
consider some evidence for each country in turn. Table 1 provides some comparable evidence
on trends in average tariff rates (unweighted) and the coverage ratios of NTBs over the period
1984-1993. These are crude measures and they do not necessarily cover the entire relevant
periods for all four countries, but they are indicative of a general increasing trend in trade
liberalization policies.
Table 1 Pre- and Post-Uruguay Round Nontariff barriers for All Goods, 1984-93 (Coverage ratio of NTBs)
Country 1984-87 1988-90 1991-93
Bangladesh 49.4
India 80.7 65.4 62.6
Pakistan 83.1 25.4 14.5
Sri Lanka 13.9 10.1 3.8
Trends in Tariff Rates (unweighted, percent), 1980-99
Bangladesh India Pakistan Sri Lanka
1981 74.31982 77.61983 99.9 77.0 41.31984 77.01985 77.0 31.01986 81.8 100.0 66.01987 98.8 68.9 27.31988 102.2 69.0 27.31989 94.0 65.01990 81.8 64.8 28.31991 88.6 79.2 66.0 26.91992 71.0 53.0 61.1 25.01993 50.0 47.8 56.0 24.21994 42.0 47.8 51.0 26.01995 41.0 50.7 20.01996 27.4 38.7 41.71997 24.6 35.0 20.01998 23.8 30.0 46.51999 22.2 32.2
Source: World Bank: (http://publications.worldbank.org/catalog/content-download?revision_id=1526199)

8
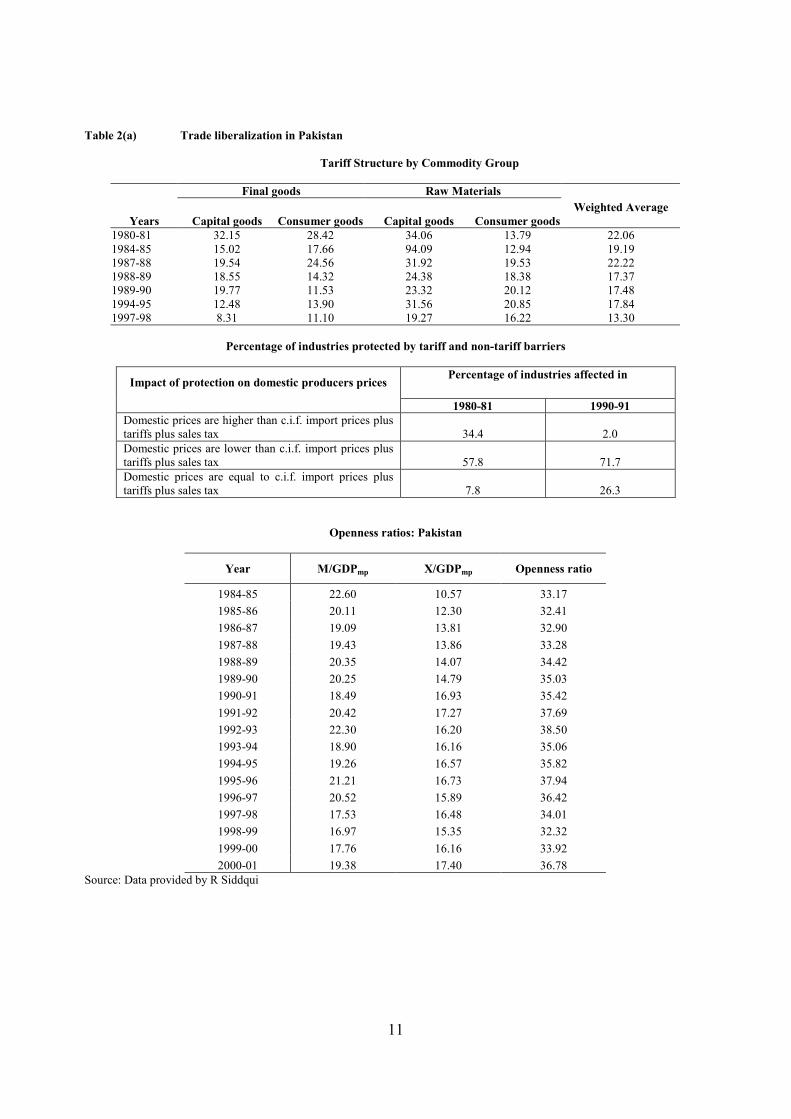
Pakistan
Although Sachs and Warner (1995) list Pakistan as not having yet liberalized by 1994, some
liberalization measures were introduced as early as 1981 with some dismantling of quotas on a
range of imported goods, including capital goods. But the replacement of non-tariff barriers by
tariffs from 1987-88 onwards combined with some reduction in tariff rates marked the beginning
of the main era of trade liberalization. Table 2(a) shows that there was a marked shift in the
decade of the 1980s in the percentage of industries where domestic prices exceeded import prices
including tariffs towards those where domestic prices are lower. This is an indication of a
reduction in non-tariff barriers in this period. During the 1990s there was a gradual but general
reduction in tariff rates, the (weighted) average tariff rate declining from 22.2% to 13.3% over
the decade from 1988 to 1998. The effect of a change in trade policy can sometimes be observed
by changes in the openness ratios. The final panel in Table 2(a) shows a barely discernible
change in openness over the period from 1984 to 2001. But this is an imperfect measure; so
many other factors may be affecting the openness outcome besides tariff and quota reductions.
Bangladesh
The move towards liberalization in Bangladesh commenced in 1979, although between 1979 and
1990 the reforms were introduced at a relatively slow rate. The trade reforms introduced during
the 1980s were mainly geared towards rationalising and, to a lesser extent, reducing import
tariffs and removing quantitative restrictions. From 1990 onwards Bangladesh embarked on
much more liberal policy reforms, involving both trade and financial liberalisation, and
privatization. Both the number of commodities subject to tariffs and quota restrictions and the

9
level of tariffs declined significantly between 1990 and 1999; Table 2(b) shows the number of
QRs in place fell by two thirds. Also, the average import tariffs declined (un-weighted) from
over 57% to 20%. In the face of these quite dramatic changes the 1990 and 1995 the openness
ratio increased quite sharply (from 17.3% to 25.0 %). However, in respect of some other facets
of liberalisation, progress has been less pronounced. Foreign direct investment (FDI) (measured
as a ratio of GDP), though rising during the first half of the 1990s, now averages only 0.03
percent of GDP which is only a 25% of the corresponding ratio for all developing countries and
is only 75% of the ratio for South Asian countries. The pace of financial integration, measured
by portfolio equity investment, is also very slow.
India
The devaluation of the rupee by 20% in 1991 marked the beginning of a major trade
liberalization programme in India. Table 2(c) records some evidence on tariffs and quotas in the
subsequent period. In the pre-1990 period, India's trade policy regime was marked by a structure
of high tariff levels, and especially by a range of non-tariff restrictions via import licenses. Some
modest trade liberalization began in 1985 when there were some simplifications to the quotas,
although restrictions were not removed, there were some simplifications. Tariff levels were
reduced quite significantly over a period of seven years, the (weighted) average tariff rate falling
from around 87% in 1990/91 to about 20% in 1997/98. Before liberalization, the top tariff was
400% and about 60% of tariffs were in the range 110-150%. But liberalization involved more
than trade reform. Initially the exchange rate was highly over-valued and the devaluation in
1991 was a significant shock. Also with exchange controls applying to both capital and current

10
accounts, and there were restrictions on FDI flows into India. Both sets of restrictions have been
relaxed and are recognized as key elements of the reform package.
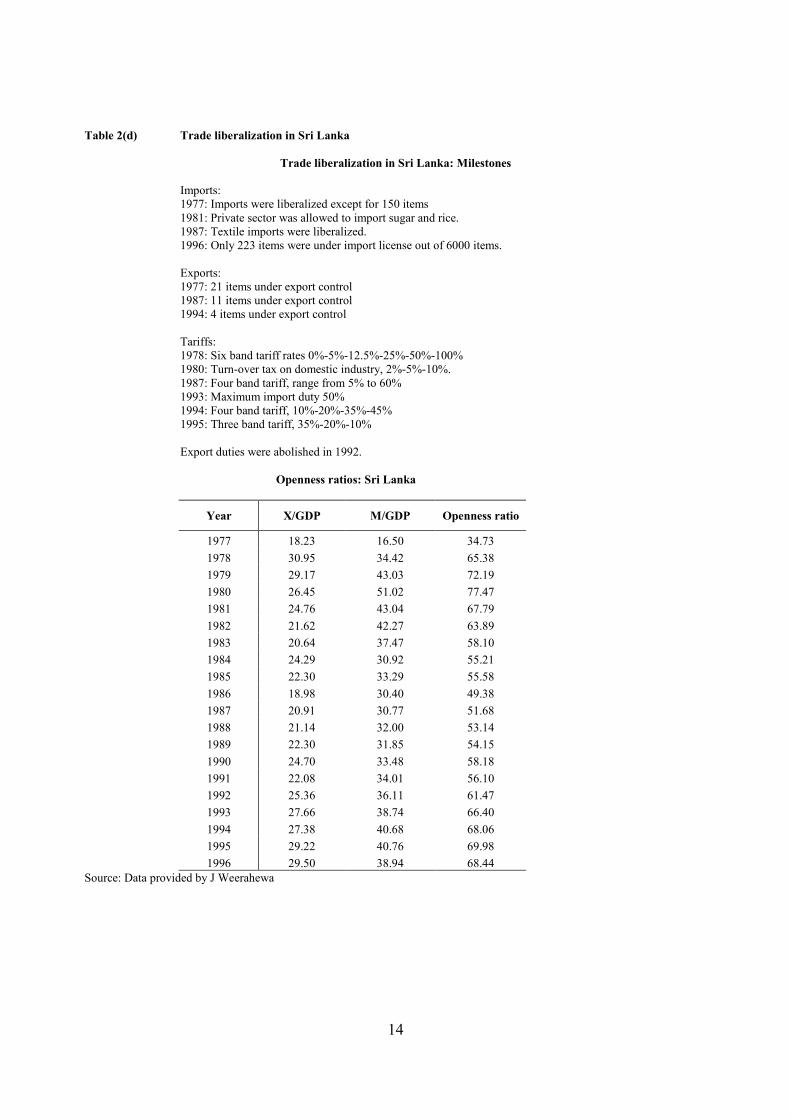
Sri Lanka
Sri Lanka embarked on a series of trade reform measures in 1977 when exchange control was
removed. Prior to this, the country faced a complex structure of tariff and non-tariff measures,
with 19 major tariff bands with tariff rates as high as 500%. Many import quotas were removed
in 1977, the 19 tariff bands were reduced to 6 in 1978 (top rate of 100%) and by 1995 were
further reduced to 3 bands (top rate of 35%). Similarly, export controls and duties were also
gradually reduced; duties on all minor agricultural exports (that is, with the exception of tea,
coconut and rubber) were abolished by 1988, and the duties on major agricultural exports were
removed in 1992. The main feature of Sri Lanka’s liberalization is not so much the degree and
intensity of reform but the relatively long time horizon over which the reforms were introduced.
In terms of the openness ratio (an outcome measure) Table 2(d) shows some rather mixed results.
At face value, the ratio leaps from 34.7% in 1977 to 65.4% in 1978, presumably as a direct result
of the initial relaxation of exchange and import controls. But after 1978 neither the total (X plus
M) nor the individual ratios show clearly discernible trends. This again illustrates the general
point that outcomes may subsume both the effects of the policy instruments, as well as a
complexity of responses.
11
Table 2(a) Trade liberalization in Pakistan
Tariff Structure by Commodity Group
Final goods Raw Materials
Years Capital goods Consumer goods Capital goods Consumer goodsWeighted Average
1980-81 32.15 28.42 34.06 13.79 22.061984-85 15.02 17.66 94.09 12.94 19.191987-88 19.54 24.56 31.92 19.53 22.221988-89 18.55 14.32 24.38 18.38 17.371989-90 19.77 11.53 23.32 20.12 17.481994-95 12.48 13.90 31.56 20.85 17.841997-98 8.31 11.10 19.27 16.22 13.30
Percentage of industries protected by tariff and non-tariff barriers
Percentage of industries affected inImpact of protection on domestic producers prices
1980-81 1990-91Domestic prices are higher than c.i.f. import prices plustariffs plus sales tax 34.4 2.0Domestic prices are lower than c.i.f. import prices plustariffs plus sales tax 57.8 71.7Domestic prices are equal to c.i.f. import prices plustariffs plus sales tax 7.8 26.3
Openness ratios: Pakistan
Year M/GDPmp X/GDPmp Openness ratio
1984-85 22.60 10.57 33.171985-86 20.11 12.30 32.411986-87 19.09 13.81 32.901987-88 19.43 13.86 33.281988-89 20.35 14.07 34.421989-90 20.25 14.79 35.031990-91 18.49 16.93 35.421991-92 20.42 17.27 37.691992-93 22.30 16.20 38.501993-94 18.90 16.16 35.061994-95 19.26 16.57 35.821995-96 21.21 16.73 37.941996-97 20.52 15.89 36.421997-98 17.53 16.48 34.011998-99 16.97 15.35 32.321999-00 17.76 16.16 33.922000-01 19.38 17.40 36.78
Source: Data provided by R Siddqui

12
Table 2(b) Trade liberalization in Bangladesh
Import Liberalization in Bangladesh
A. Quantitative Restrictions (QRs)Trade reasonsPeriod Total QRs in placea
Banned Restricted MixedNon-trade
reasons
1989/90 315 135 66 52 621990/91 239 93 47 39 601995/97 115 5 6 12 92
B. Average Import TariffsPeriod Un-weighted Import-weighted
1991/92 57.3 24.11992/93 47.4 23.61993/94 36.0 24.11994/95 25.9 20.81995/96 22.3 17.01996/97 21.5 18.01998/99 20.2 14.1a There are a total of 1,240 four digit tariff headings under the Harmonized System.
Openness Ratios: Bangladesh
1990/91 1991/92 1992/93 1993/94 1994/95 1995/96Imports/GDP 11.12 11.22 12.70 13.31 15.50 15.63Exports/GDP 6.15 6.37 7.41 8.05 9.21 9.35Openness ratio 17.27 17.59 20.11 21.36 24.71 24.98
Source: Data provided by M Mujeri

13
Table 2(c) Trade liberalization in India
Average tariff structure
1990-91 1993-94 1995-96 1996-97 1997-98 1999-00 2000-01
Unweighted 125 71 41 39 35Weighted 87 47 25 22 20 Consumer goods 153 86 36 33 25 Intermediate goods 77 42 22 19 18 Capital goods 97 50 29 29 24Maximum tariff rate 355 85 50 52 45 40 35
NTBs on imports
1998-99 1999-00Types of NTBs Products %share Products %share
Free 7213 70.2 8170 79.3NTBs 3068 29.8 2134 20.7 Prohibited 59 0.6 Restricted 2831 27.5
TOTAL 10281 100 10304 100
Openness ratios: India
1982 1987 1991 1992 1995 1996 1997 1998X/GDP 0.064 0.061 0.091 0.095 0.110 0.106 0.108 0.111M/GDP 0.088 0.075 0.091 0.103 0.122 0.118 0.121 0.126Openness ratio 0.153 0.136 0.182 0.198 0.233 0.224 0.230 0.238
Source: Data provided by B Pradhan
14
Table 2(d) Trade liberalization in Sri Lanka
Trade liberalization in Sri Lanka: Milestones
Imports:1977: Imports were liberalized except for 150 items1981: Private sector was allowed to import sugar and rice.1987: Textile imports were liberalized.1996: Only 223 items were under import license out of 6000 items.
Exports:1977: 21 items under export control1987: 11 items under export control1994: 4 items under export control
Tariffs:1978: Six band tariff rates 0%-5%-12.5%-25%-50%-100%1980: Turn-over tax on domestic industry, 2%-5%-10%.1987: Four band tariff, range from 5% to 60%1993: Maximum import duty 50%1994: Four band tariff, 10%-20%-35%-45%1995: Three band tariff, 35%-20%-10%
Export duties were abolished in 1992.
Openness ratios: Sri Lanka
Year X/GDP M/GDP Openness ratio
1977 18.23 16.50 34.731978 30.95 34.42 65.381979 29.17 43.03 72.191980 26.45 51.02 77.471981 24.76 43.04 67.791982 21.62 42.27 63.891983 20.64 37.47 58.101984 24.29 30.92 55.211985 22.30 33.29 55.581986 18.98 30.40 49.381987 20.91 30.77 51.681988 21.14 32.00 53.141989 22.30 31.85 54.151990 24.70 33.48 58.181991 22.08 34.01 56.101992 25.36 36.11 61.471993 27.66 38.74 66.401994 27.38 40.68 68.061995 29.22 40.76 69.981996 29.50 38.94 68.44
Source: Data provided by J Weerahewa
15
3. Identifying poverty responses in an era of globalization
The broad picture on the changes in absolute and relative poverty experienced during the last two
decades in each of the four South Asian countries under study can be set against the background
of their records on globalization. As discussed extensively elsewhere (Ravallion, 1993), it is
usually quite difficult to provide a clear and unequivocal assessment of either the level or change
in poverty. For example, there are issues about whether we refer to income (or consumption)
based measures, or whether we should take into consideration broader social indicators (health,
mortality, literacy, etc.). Comparative modeling work based on income or other money-metric
measures is more tractable. However, even if we confine ourselves to these there are still many
alternative poverty measures (headcount, poverty gap, and other αP measures, etc.) that can be
used to assess changes in poverty. So in this context, the aim is not to present a comprehensive
or definitive profile of changes in poverty in each country but, instead, to provide some overall
indications of the magnitude and directions of change, distilled from the individual project
material. In most cases the evidence is predominantly based on the authors’ own poverty
assessments carried out under the MIMAP project.
Pakistan
Evidence on changes in poverty in Pakistan (see Table 3(a)) suggests that in the period from the
mid 1980s through to the early 1990s, absolute poverty (measured by the headcount ratio, and
based on consumption measures and local and international poverty lines) declined substantially.
But then from 1992/3 there was a period of high volatility in these measures although they are
set in the context of a rising trend. Measures of relative poverty and inequality tell a similar

16
story. The Gini coefficient was fairly constant throughout much of the period, although it
declined slightly from 1984/5 through to 1996/7, but was then followed by a steep rise between
1996/7 and 1998/9. Other manifestations of relative poverty, such as urban-rural differences,
suggest a similar decline during the period before 1987/88 followed by an increase in the later
period.
Bangladesh
The picture concerning the changes in poverty and inequality over the period from the early
1980s through to the mid to late 1990s (Table 3(b)) reveals fairly clear evidence that the level of
absolute poverty has fallen in Bangladesh, while there is some evidence that inequality appears
to be increasing. Based on detailed evidence from Household Expenditure Surveys conducted at
intervals of two or three years from 1983/84 through to 1995/96, and extended through to 1999
using the Poverty Monitoring Survey (Mujeri and Khondker, 2000a), the headcount index has
fallen quite sharply. These trends are quite robust irrespective of the choice of the absolute
poverty line (‘poor’ and ‘hard core’ poor). Taking the broad sweep of results into account the
headcount index has fallen from around 63% in 1983/4 down to 45% in 1999. A similar trend is
found in both urban and rural areas, although the downward trend in rural areas seems less
pronounced and this is significant because this is where the overwhelming majority of the poor
live.
India
The assessment of changes in poverty in India has been the subject of much ongoing debate.
Clearly, as over 25% of the World's poor live in India (under World Bank estimates), estimates

17
of the change as well as the level of poverty in India will be highly significant to global
estimates. But as Deaton (2001, 2002) has explained, there is much uncertainty about recent
poverty estimates. Large-scale household surveys have been infrequent; the recent release of the
1999-2000 consumption survey was the first since 1993-94, and there have been major revisions
to the latest survey questionnaire which make comparisons between them difficult. The trend
has been downwards, Table 3(c) confirms the outcome on absolute poverty measured by
headcount ratios up to 1997. The situation since then, based on smaller ('thin') surveys indicate
poverty may be rising. But Deaton has re-estimated the headcount ratios on the basis of the
1999-2000 survey and confirms a continuing downward trend, reaching 28 percent in
comparable terms in that year. Measures of inequality are less available and are no more certain.
The second panel, showing Gini ratios for urban and rural areas separately, indicate a slight
decline, although this is within the range of year on year fluctuations. A sizeable portion of
national inequality can be attributed to 'between rural and urban areas' inequality.
Sri Lanka
Poverty profiles of Sri Lanka have often been viewed in much broader terms than simply income
and/or consumption. Human development, as measured by the HDI, has been notably higher
than would usually be expected of Sri Lanka’s level of income per capita and is similar to the
HDI scores of higher income economies. Table 3(d) sets out some comparable data on poverty
and inequality beginning in 1980-81, which is some way into the liberalization period. After
some apparent initial increase in absolute poverty during the early 1980s (except in the Estate
sector) there is evidence of a decline in the second half of the 1980s, and a further reversal in the
first half of the 1990s. Overall (i.e. national) inequality shows a slight increase and then a

18
decrease over the same period, although there is a good deal of variation within the urban, rural
and estate sectors, suggesting that there may be problems of comparability between survey
results. The results confirm how difficult it is to generate comparable poverty statistics and to
discern trends and movements over time. Gunetilleke (2000) reports on a growing awareness, in
Sri Lanka, of relative deprivation and of broader perceptions of poverty than is captured in
headcount ratios and Gini coefficients. This further exacerbates the difficulties of assessing
linkage between policies and outcomes.
Table 3(a): Poverty Trends in Pakistan
Absolute poverty and inequality
Year Headcount ratios Gini (household) Ratio highest 20%to lowest 20%
1963-64 40.2 0.386 7.11966-67 44.5 0.355 5.71969-70 46.2 0.336 5.21971-72 0.345 5.41979-80 30.7 0.373 6.11984-85 0.369 6.21985-86 5.81986-87 28.6 5.51987-88 29.2 0.348 5.51990-91 29.4 0.407 8.61992-93 35.9 7.81993-94 35.7 0.348 7.31996-97 ∗ 0.407 7.1
Source: Data provided by R Siddiqui

19
Table 3(b): Poverty trends in Bangladesh
Absolute poverty
Year Headcount ratios(Rural)
Headcount ratios(Urban)
Headcount ratios(National)
1983-84 61.9 67.7 62.61985-86 54.7 62.6 55.71988-89 47.8 47.6 47.81991-92 47.6 46.7 47.51995-96 47.1 49.7 47.91996 47.9 44.4 47.01997 46.8 43.4 46.01998 47.6 44.3 46.71999 44.9 43.3 44.7
Inequality
Year Gini (household)(Rural)
Gini (household)(Urban)
Gini (household)(National)
1983-84 0.350 0.370 0.3601985-86 0.360 0.370 0.3701988-89 0.368 0.381 0.3791991-92 0.364 0.394 0.3881995-96 0.384 0.444 0.4321996 0.430 0.380 0.43019971998 0.370 0.310 0.370
Source: Data provided by M Mujeri
Table 3(c) Poverty trends in India
Absolute poverty
Year Headcount ratios(Rural)
Headcount ratios(Urban)
Headcount ratios(National)
1977-78 50.6 40.5 48.41983 45.3 35.7 43.01986-87 38.8 34.3 37.71989-90 34.3 33.4 34.11991 37.4 33.2 36.31992 43.5 33.7 40.91993-94 36.7 30.5 35.01994-95 39.8 33.5 38.51995-96 37.5 28.0 35.01997 35.6 30.0 34.4
Inequality
Year Gini ratios(Rural)
Gini ratios(Urban)
Gini ratios(National)
1973-74 0.276 0.3011977-78 0.339 0.3851983-84 0.298 0.3301987-88 0.298 0.3541993-94 0.282 0.339
Source: Data provided by J Weerahewa

20
Table 3(d): Poverty trends in Sri Lanka
Absolute poverty
Year Headcount ratios(Urban)
Headcount ratios(Rural)
Headcount ratios(Estate)
Headcount ratios(national)
1980-81 16.9 25.9 25.0 ∗1985-86 18.4 35.6 20.5 30.91990-91 15.0 22.0 12.4 19.91995-96 14.7 27.0 24.9 25.2
Source: Department of Census and Statistics; data provided by J Weerahewa
Inequality
Year Gini (household)(Urban)
Gini (household)(Rural)
Gini (household)(Estate)
Gini (household)(national)
1980-81 0.44 0.38 0.27 0.431985-86 0.48 0.43 0.31 0.461990-91 0.62 0.42 0.25 0.471995-96 0.46 0.48 0.44 0.481996-97* 0.47 0.40 0.27 0.43
Source: Department of Census and Statistics (data based on spending units) Data provided by J Weerahewa
4. Evaluating the mechanisms of globalization-poverty linkage in South Asia
After assessing the data on changes in poverty in South Asian economies and liberalization
episodes (taken for the purposes here as the globalization shocks), the next step is to assess what
form the linkage actually takes. The central difficulty is that the data outcome that is observed
reflects the combined influence of several factors, some of which are seemingly unconnected
with liberalization per se. Some form of counterfactual analysis is therefore needed to isolate the
component of the overall change that is attributed to globalization influences.
If, for now, we take globalization to be equated with trade liberalization, primarily in the South
Asian countries but also in OECD export markets, a number of channels of influence on
inequality can be identified.
21
Tariff-based liberalization
The central form of linkage to poverty from tariff-based liberalization discussed in the theoretical
literature is from relative goods prices which change as tariffs fall to factor prices. These effects
are associated with Stolper and Samuelson (1941) who provided conditions under which the
factor that is intensive in the production of the imported good would lose. Stolper-Samuelson
effects in the South Asian case would therefore appear as a reduction in the relative return to
labour used in protected sectors, typically more skilled labour. These effects are widely thought
to be pro-poor.
Many other related effects also arise however. If the rich purchase relatively more of the
imported good, then reductions in tariffs will be more beneficial to them on the demand side. If
there are fixed, or specific, factors used in production, then the owners of these factors rather
than owners of factors more generally will be the losers. Depending upon how tariff revenues
are, or are not, replaced various distributional effects will follow. Replacing revenues using a
progressive income tax will have different effects from a VAT or payroll tax, for instance. If
quotas remain in effect as tariffs are changed, their effects are only lump sum since they merely
affect the value of the quota rents. Other distortions in the economy can be germane. If there is
average product pricing of labour in the traditional (agricultural) sector and marginal product
pricing of labour in the modern sector, then tariffs can affect these distortions and intersectoral
migration patterns change with policy change.

22
Quota-based Liberalization
The South Asian economies were also characterized, pre-liberalization, by extensive use of both
tariffs and non-tariff measures in the form of quotas and other trade restraints. Quotas, however,
when changed, can produce quite different effects on poverty than from tariffs. A number of
sub-cases can be identified.
One case is where import quotas are merely allocated by national governments, so recipients of
quotas also receive quota rents. In this case, trade liberalization that removes the quotas also
takes away the quota rents. If quotas are allocated to the rich, such liberalization becomes pro-
poor in its income redistribution effects, in addition to having the relative goods and factor prices
effects noted above for the tariff case.
Another case is where the quotas are auctioned by governments, so that in this case revenues
accrue very much like the tariff case. In these situations, the poverty implications of tariff and
quota based liberalization become very similar.
Yet another case is where quotas are sought after via rent-seeking behaviour that uses real
resources. Examples would be taking on surplus labour to demonstrate unemployment in the
enterprise so that a licensing board will allocate quotas for imports of machinery. Such instances
are discussed for India pre-liberalization in Mohammed and Whalley (1984) who for India in the
1970s put rent-seeking costs for all major policy interventions in India (not just trade) at 15-40%
of GDP. If rent-seeking accompanies trade-based quotas, then no revenues accrue to either the
private sector or to government and no income effects arise directly from quota removal.

23
Economy Wide Models
The ways in which these elements of linkage can be investigated usually involve the use of
numerical simulation models, typically of the general equilibrium variety. Econometric methods
are unable to deal with the richness of the underlying structural forms involved and generally are
not used. Numerical simulation and computable general equilibrium modelling approaches are
much more useful for counterfactual analysis.
The typical procedure is to build a model with goods and factors, with trade in goods but no
trade in factors. Such models are usually calibrated to a base year data set around which
counterfactual equilibrium analysis is performed (see Shoven and Whalley, 1992). The
counterfactuals typically involve the removal or reduction of tariffs and quotas, with an equal
yield replacement tax in the tariff case (often a VAT surcharge).
Increasingly, these models are being used in double calibration mode with calibration taking
place to a pair of years’ data. This is because the use of the model is ex post rather than ex ante;
seeing how important one of a number of components of a combined change are for a change
that has occurred (such as a change in inequality). The methods used for this are discussed in
Abrego and Whalley (2002).
Many issues arise with using these models. One is that the precise structural form used can, to a
large degree, predetermine the conclusions. Models with fixed factors, for instance, tend to yield
concentrated outcomes from liberalization, while models with mobile factors yield smaller but
24
broader economy-wide effects. Short run models with adjustment costs can produce sharply
different implications from longer run models without them (see Edwards and Whalley, 2002).
Another is that results are parameter dependent. Typically, a subset of key model parameters are
pre-selected (such as key elasticities of substitution) and liberalization impacts change as
parameter values change, often quite sharply. General results are thus typically not generated by
numerical simulation. Results are indicative rather than definitive.
Yet another issue is how poverty is analyzed using these approaches. The typical model tends to
analyze factor price effects (such as the differential between skilled and unskilled wage rates)
rather than a broader concept of income including capital income and transfers and taxes.
Siddiqui’s (2002a) data for Pakistan suggests a high income share for capital income (perhaps
30% in aggregate) indicating how partial this approach is. Some modelling efforts (such as
Cockburn, 2001) have attempted to add micro-simulation detail to conventional factor income
type analyses. These approaches allow for calculations of movement of individual incomes
above and below the poverty line, and other broader measures of income change.
Results from models
In Table 4, we have attempted to summarize some of the results from a sample of numerical
simulation models used to analyze globalization-poverty linkages, mainly in South Asian
countries, but with Vietnam added due to its policy relevance.

25
Table 4 Recent Numerical Models Evaluating Linkage Between Trade Liberalization and Poverty
Author Country Type of Model Base Year Data Usedin Calibration
Conclusion
Weerahewa(2002a)
Sri Lanka Static 2 sectorRicardo-Viner typemodel
Double calibration topairs of years (1977,1994, 2000)
Trade plays no essential role inexplaining poverty change (either relativeor absolute). Technical change andendowment changes are the main drivers.
Khondker andMujeri (2002b)
Bangladesh Static 2 sectorRicardo-Viner typemodel
Double calibration to1985 and 1996 data
Trade is the minor determinant ofpoverty change compared to technicalchange and endowment growth
Siddiqui andKemal (2002a)
Pakistan Static 11 sectorRicardo-Viner typemodel
Single calibration to datafor 1989-90 and forwardprojections
Non-globalization variables are key tounderstanding how globalization affectspoverty measures. Model runs includingor excluding remittance changes alter thesign of effects
Pradhan et al(2002b)
India Static 13 sectorRicardo-Viner typemodel
Single calibration to datafor 1994 and forwardprojections
Trade policy change has small impact onpoverty effects
Chan et al(2001)
Vietnam Static 12 sector fixedfactor model
Single calibration to datafor 1997 and forwardprojection
Trade policy change is pro-rich, since inVietnam consumption data suggest therich buy proportionately more importsthan the poor
Three of these (Weerahewa, 2002a, Mujeri and Khondker, 2002b, and Pradhan, 2002a) use
double-calibration techniques for simple models of Sri Lanka, Bangladesh and India respectively
to analyze the relative importance of trade, technical change, and endowment change as
determinants of inequality change. They take liberalization to be given by the actual tariff and
quota changes fro the years that are analyzed, looking at revenue-preserving change.
A feature of these models is that they all embody some degree of factor specificity. This is due
to a general model feature that if models capture all factors as being fully mobile across sectors
then typically only a relatively small range of factor price changes can be accommodated as
resulting from a goods price change without encountering problems of equalisation. These
problems are also noted in Johnson (1966) and Abrego and Whalley (2001) and are widely
accepted in the modelling literature. As a result, pure Stolper-Samuelson effects do not show
through from these models as rewards to fixed factors are involved.

26
Nonetheless, these studies all point to the conclusion that the influences of trade-based
liberalization, and of trade in general, on both absolute and relative poverty (i.e. inequality) are
quite small. This is the strong and broad conclusion from these studies.
Other results shed further light on this conclusion. Siddiqui and Kemal (2002a) show how, in the
Pakistan case, there is a clear and potentially major role for excluded variables in the analysis of
linkage. In the early 1990s both absolute and relative poverty increased in Pakistan. But this
occurred along with a reduction in remittances that tend to go heavily to the poor (as a
percentage of income). If the remittance change is removed from the analysis then trade changes
alone generate an opposite effect both on absolute and relative poverty.
Table 4 also refers to results from a Vietnam model project, which, while not for South Asia, are
also germane to the cases here. These results show trade policy changes to be pro-rich because
household budget data show that expenditure shares on imports are significantly higher for the
rich than for the poor.
Other studies, not cited in Table 4, shed further light on these linkages. Pradhan (2002a)
analyzes both tariff-based and quota-based liberalization in India, showing how impacts on
inequality measures under liberalization change. Siddiqui and Kemal (2002b) analyze the
poverty impacts of trade liberalization under scenarios where capital flows are also liberalized at
the same time, concluding that relatively little added impact occurs. Weerahewa (2002b)
analyzes how outward trade surges in textiles and apparel from Sri Lanka impact on the relative

27
male-female ratio, concluding that outward orientation has served to partially lower the gap in
this case. Bussolo and Whalley (2002) show how in the Indian case, changes in transaction costs
that occur contemporaneously with trade liberalization also serve to impact on relative wage
inequality, particularly when it is factor biased in effect.
5. Conclusions
Globalization shocks in South Asia appear worthy of careful study because, to the outside
observer, they appear to have occurred dramatically and to be concentrated over a relatively
short time period. If there are discernible impacts of globalization on poverty measures, then
surely they could show through in these cases. Here, we examine the four cases of Pakistan, Sri
Lanka, India and Bangladesh over the 1980s and 1990s.
At first sight, they seem to be cases of declining absolute poverty, which accelerates some time
after liberalization, and relatively constant inequality. There are departures from this situation,
rising absolute and relative poverty in Pakistan, and a few years of rising relative poverty in
Bangladesh. All in all, at a broad sweep of the brush the picture seems to be one of almost no
impact on relative poverty, and some acceleration (through higher growth) on absolute poverty.
However, separating out the linkages from other effects and influences, many problems are
encountered. There are conceptual problems with measuring and dating liberalization. These
are measurement and data problems in ascertaining exactly what has happened to poverty
changes over the time period, especially with regard to different measures and income concepts.
There are problems with model-based analyses. Model structures make a difference, as does the

28
precise liberalization experiment used. Hence, even in a case where, at first sight, the linkages
between globalization and poverty are seemingly exposable, conceptual, data, and modelling
issues preclude overly firm conclusions. Specificity of experiment, model, and other factors all
matter. The debate on globalization and poverty linkages appears to be pitched at too general a
level even in these cases to be able to draw firm conclusions.
References
Abrego, L. and J. Whalley (2001) ‘Decomposing Wage Inequality Change Using General EquilibriumModels’, Working Paper, University of Warwick (mimeo).
Bussolo, M. and J. Whalley (2002) ‘How many forms do I have to fill in to export my coffee? The role oftransaction costs in explaining economic performance in Latin America’, DFID project paper.
Chan, N. and T. K. Dung (2001) ‘Development of CGE Model to Evaluate Tariff Policy in Vietnam’,MIMAP Modelling Meeting, Singapore(http://www.bellanet.org/mimap/dynamic/dyn_workinpr2/vnpaper2-10.doc?OutsideInServer=rules)
Cockburn (2001) ‘Trade Liberalisation and Poverty in Nepal, A Computable General Equilibrium MicroSimulation Analysis’, CREFA, Université Laval Québec, Canada(www.crefa.ecn.ulaval.ca/develop/cge-train.html)
Deaton, A. (2001) ‘Computing prices and poverty rates in India, 1999-2000’, RPDS working paper,Princeton University.(http://lnweb18.worldbank.org/sar/sa.nsf/Attachments/adp/$file/prices+poverty+55thRound+all.pdf)
Deaton, A. (2002) ‘Is World Poverty Falling?’ Finance and Development, 39 (2) June: 4-7.
Deaton, A., and J. Dreze (2002) ‘Poverty and Inequality in India: A Re-Examination’, RPDS workingpaper, Princeton University. (http://www.wws.princeton.edu/%7Erpds/Downloads/aug16_all%20paper.pdf)
Dollar, D. and A. Kraay (2001) ‘Trade, Growth and Poverty’, paper presented to the WIDER conferenceon ‘Growth and Poverty’, May.(http://www.wider.unu.edu/conference/conference-2001-1/dollar%20and%20kraay.pdf)
Johnson, H. G. (1966) ‘Factor Market Distortions and the Shape of the Transformation Curve’,Econometrica, 34: 686-698.
Khor, M. (2002) ‘A Perspective of Globalisation and its Implications for Developing Countries’, paperpresented to the CSGR conference on Globalisation, Growth and (In)Equality, University ofWarwick, March 2002. (http://www.warwick.ac.uk/fac/soc/CSGR/PKhor.pdf)

29
McCulloch, N., L. A. Winters and X. Cirera (2001), Trade Liberalization and Poverty: A Handbook.London, UK: Centre for Economic Policy Research.
McKay, A., L. A. Winters and A. M. Kedir (2000) ‘A Review of the Empirical Evidence on Trade, TradePolicy and Poverty’, A report to DFID prepared as a background document for the SecondDevelopment White Paper.(http://www.globalisation.gov.uk/BackgroundWord/EmpiricalEvidenceOnTradeAndrewMcKay.doc)
Mohammed, S and J. Whalley (1984) ‘Rent-Seeking in India: Its Costs and Policy Significance’, Kyklos,37(3); 387-413.
Mujeri, M. and B. Khondker (2002a) ‘Poverty Implications of Trade Liberalisation in Bangladesh: AGeneral Equilibrium Approach’, DFID project paper.
Mujeri, M. and B. Khondker (2002b) ‘Decomposing Wage Inequality Change in Bangladesh: AnApplication of the Double Calibration Technique’, DFID project paper.
O’Rourke, K., and J. G. Williamson (1999) Globalization and History: The Evolution of a Nineteenth-Century Atlantic Economy, MIT Press.
Pradhan (2002a) ‘The role of education in wage inequality change in India: 1988-97’, DFID projectpaper.
Pradhan (2002b) ‘Assessing the effects of trade liberalisation on inequality in India: a simulationexercise’, DFID project paper.
Ravallion, M. (1993) Poverty Comparisons, Fundamentals of Pure and Applied Economics Volume 56,Harwood Academic Press, Chur, Switzerland.
Sachs, J. D., and A. M. Warner (1995) ‘Economic Reform and the Process of Global Integration’,Brookings Papers on Economic Activity 1995, 1 (August): 1-118.
Sachs, J. D., and A. M. Warner (1997) ‘Sources of Slow Growth in African Economies’, Journal ofAfrican Economies, 6 (3): 335-76.
Shoven, J. and J. Whalley (1992) Applying General Equilibrium, Cambridge University Press.
Siddiqui, R. and A. R. Kemal (2002a) ‘Remittances, trade liberalization and poverty in Pakistan: theRole of excluded variables in the analysis of poverty change’, DFID project paper.
Siddiqui, R. and A. R. Kemal (2002b) ‘Poverty inducing or poverty reducing? A CGE-basedanalysis of foreign capital inflows in Pakistan’, DFID project paper.
Stolper, W. F. and P. A. Samuelson (1941) ‘Protection and Real Wages’, Review of Economic Studies, 9:58-73.
Watkins, K. (2002) ‘Making Globalization Work for the Poor’, Finance and Development, 39 (1) March:24-26 (and a response by Dollar and Kraay, 27-28)
30
Weerahewa, J, (2002a) ‘Decomposition of poverty in Sri Lanka: roles of technology, trade andgovernment transfers’, DFID project paper.
Weerahewa, J, (2002b) ‘The influence of garment exports on male-female wage inequality in Sri Lanka’,DFID project paper.
Weller, C. and A. Hersh (2002) ‘The Long and Short of It: Global Liberalization, Poverty and Inequality’,Economic Policy Institute, Washington D.C. (http://www.epinet.org/)
World Bank (2002) Globalization, Growth and Poverty: Building an Inclusive World Economy, NewYork: Oxford University Press for the World Bank.