Embed Size (px)
Citation preview

Globalisation & the world of workMegan Lilly Associate Director – Education & Training
Overview
1. The centrality of skilling to industry
2. The current situation for youth and the state of youth transition
3. Policy directions
Globalisation
“the widening, deepening and speeding up of worldwide interconnectedness” OECD
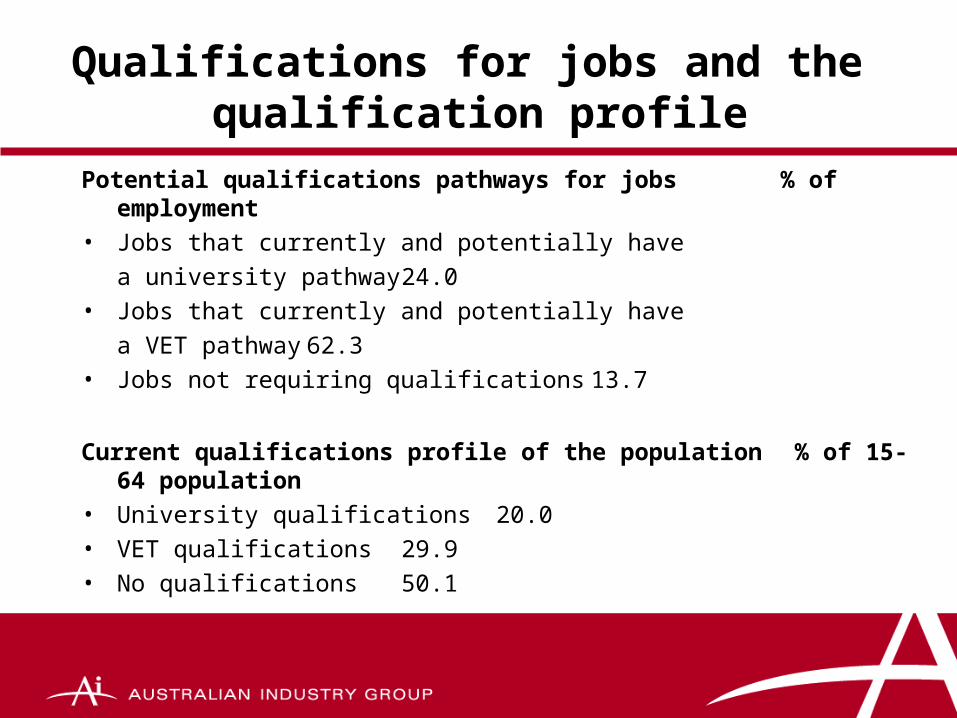
Qualifications for jobs and the qualification profile
Potential qualifications pathways for jobs % of employment
• Jobs that currently and potentially have
a university pathway 24.0
• Jobs that currently and potentially have
a VET pathway 62.3
• Jobs not requiring qualifications 13.7
Current qualifications profile of the population % of 15-64 population
• University qualifications 20.0
• VET qualifications 29.9
• No qualifications 50.1
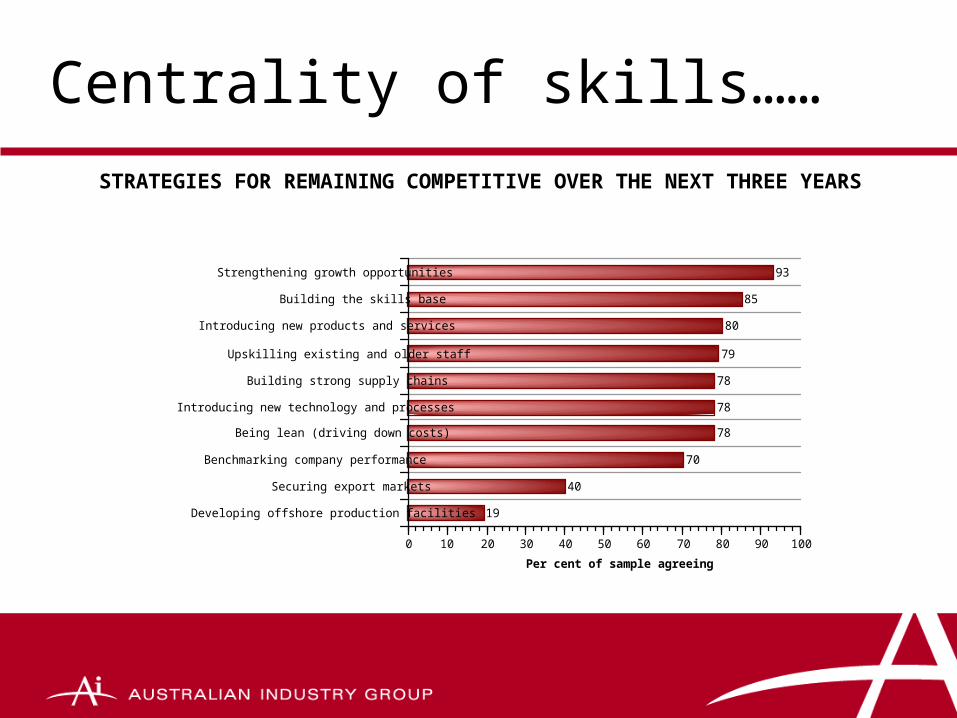
Centrality of skills……
Developing offshore production facilities
Securing export markets
Benchmarking company performance
Being lean (driving down costs)
Introducing new technology and processes
Building strong supply chains
Upskilling existing and older staff
Introducing new products and services
Building the skills base
Strengthening growth opportunities
0 10 20 30 40 50 60 70 80 90 100
Per cent of sample agreeing
93
85
80
79
78
78
78
70
40
19
STRATEGIES FOR REMAINING COMPETITIVE OVER THE NEXT THREE YEARS
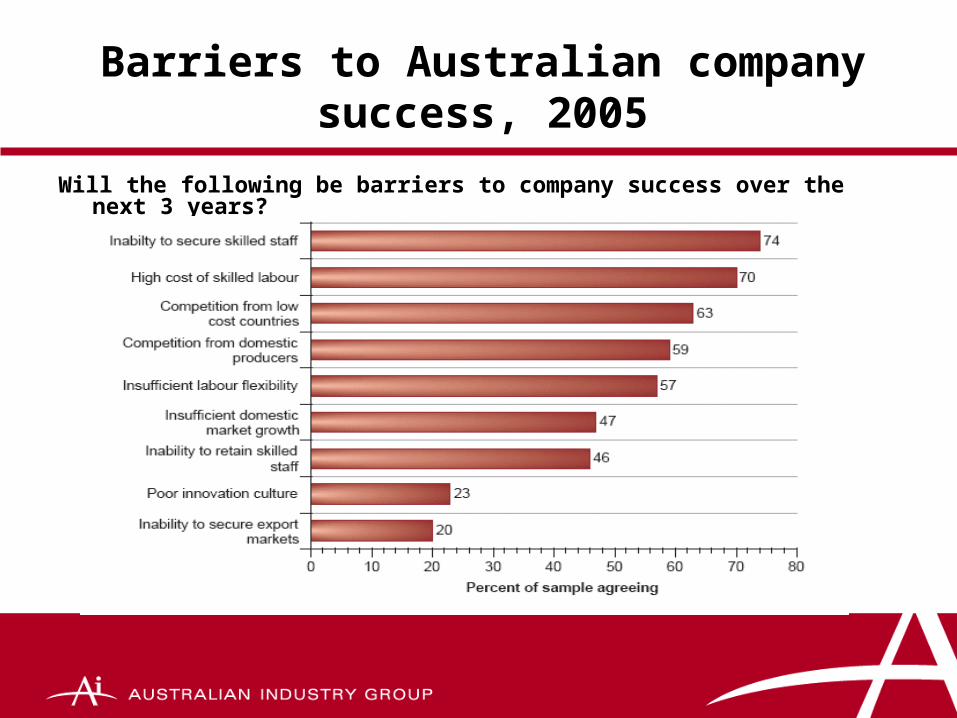
Barriers to Australian company success, 2005
Will the following be barriers to company success over the next 3 years?
Current Situation for Youth
A significant proportion not completing school or its vocational equivalent
Consistent proportion of school leavers making a poor or mixed transition from school
Large numbers without school or equivalent qualifications are not in full-time work or learning
Low levels of Indigenous participation and achievement in education

Polarised Nature of Australian Unemployment Rates
Unemployment Rate
0
1
2
3
4
5
6
7
8
9
Pe
r c
en
t Skilled
Unskilled
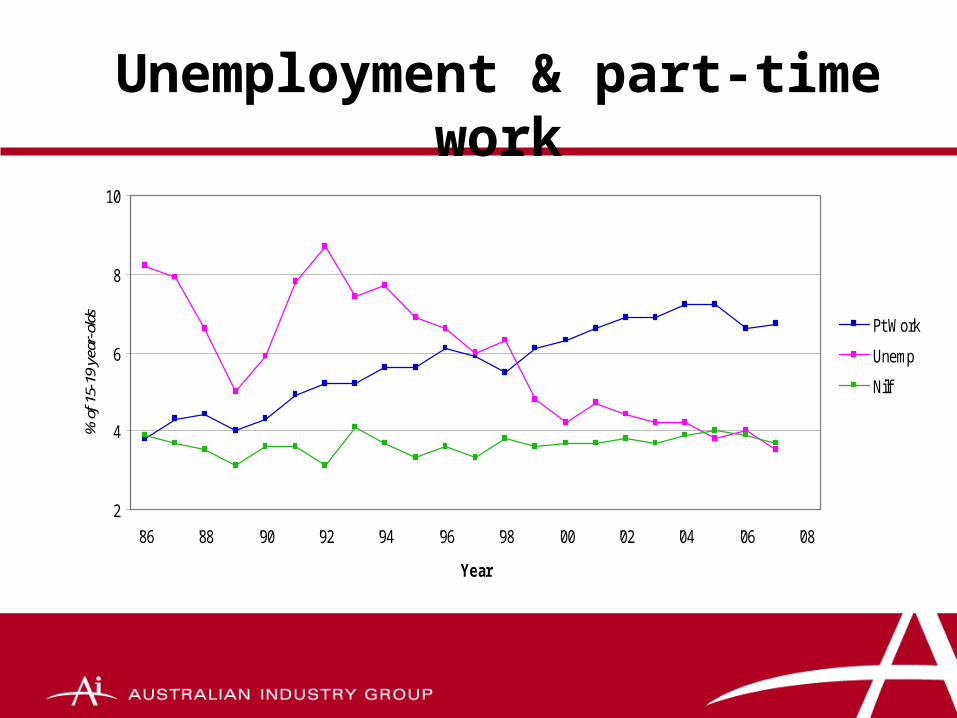
Unemployment & part-time work
2
4
6
8
10
'86 '88 '90 '92 '94 '96 '98 '00 '02 '04 '06 '08
Year
% o
f 15-
19 y
ear-
olds Pt Work
Unemp
Nilf
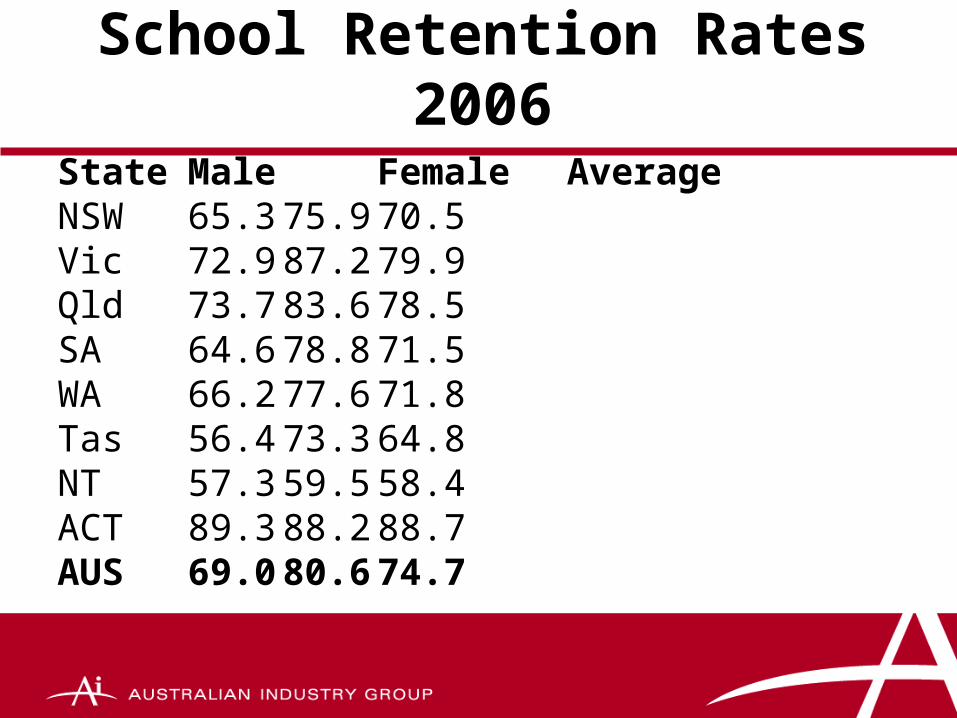
School Retention Rates 2006
State Male Female AverageNSW 65.3 75.9 70.5Vic 72.9 87.2 79.9Qld 73.7 83.6 78.5SA 64.6 78.8 71.5WA 66.2 77.6 71.8Tas 56.4 73.3 64.8NT 57.3 59.5 58.4ACT 89.3 88.2 88.7AUS 69.0 80.6 74.7
Economic Impact of Increasing Retention
2005 Access Economics estimated that lifting retention to completion of school or apprenticeship to 90% by 2010 would:
increase workforce by 65,000 boost economic productivityexpand the economy by $10b by 2040
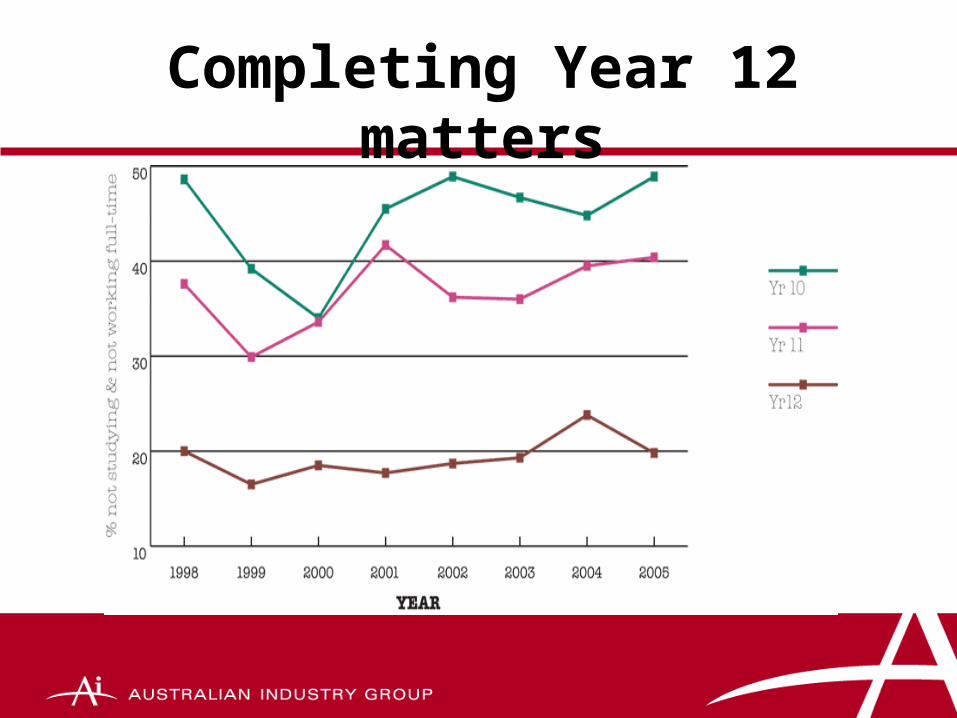
Completing Year 12 matters
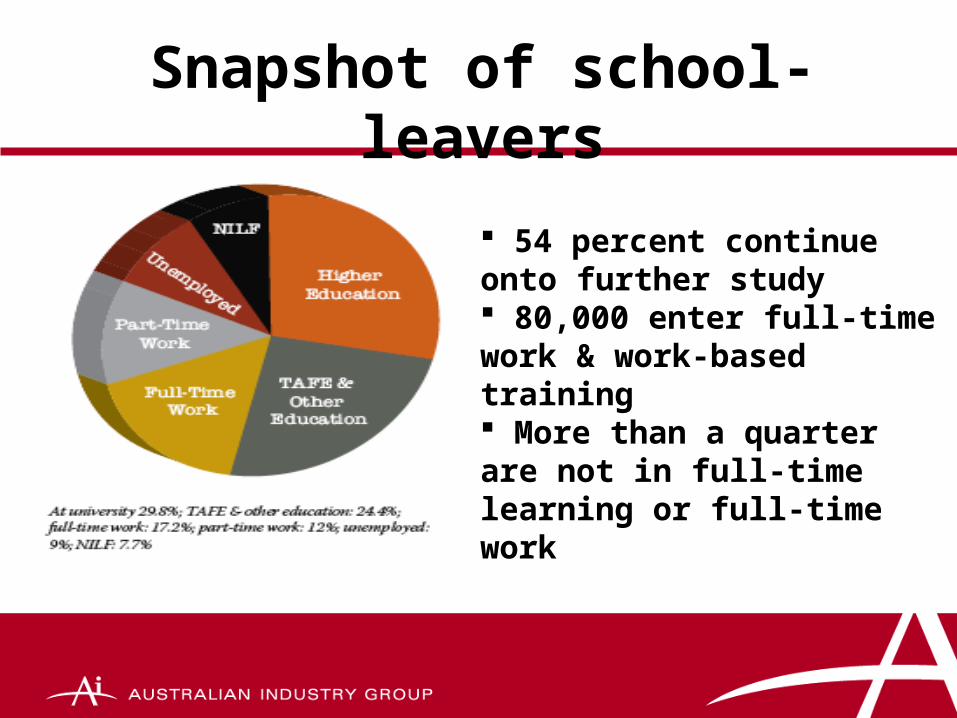
Snapshot of school-leavers
54 percent continue onto further study 80,000 enter full-time work & work-based training More than a quarter are not in full-time learning or full-time work
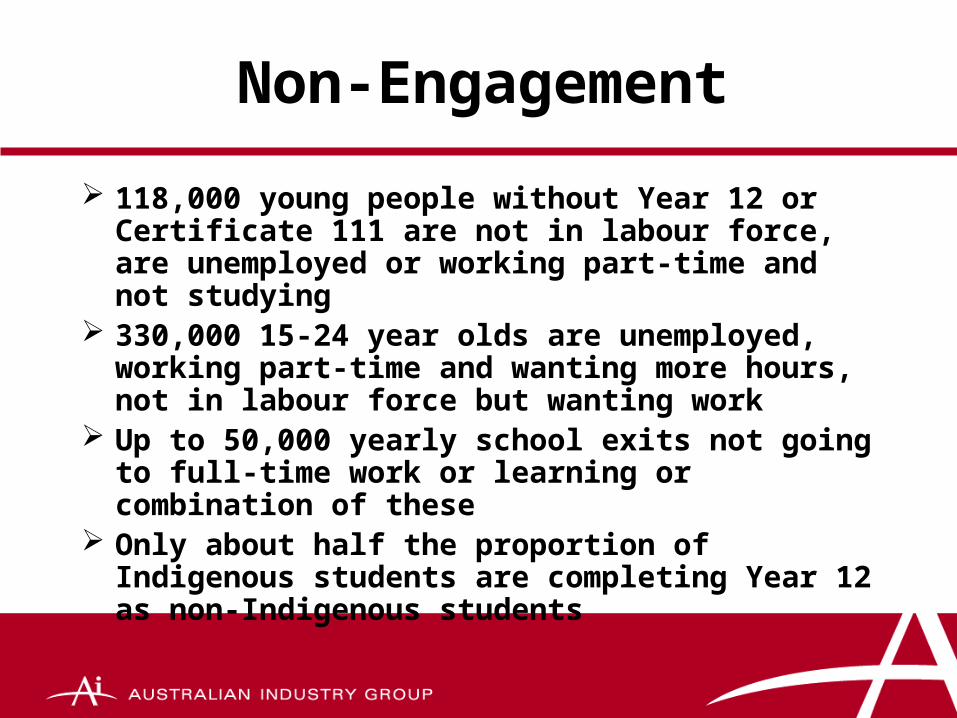
Non-Engagement
118,000 young people without Year 12 or Certificate 111 are not in labour force, are unemployed or working part-time and not studying
330,000 15-24 year olds are unemployed, working part-time and wanting more hours, not in labour force but wanting work
Up to 50,000 yearly school exits not going to full-time work or learning or combination of these
Only about half the proportion of Indigenous students are completing Year 12 as non-Indigenous students
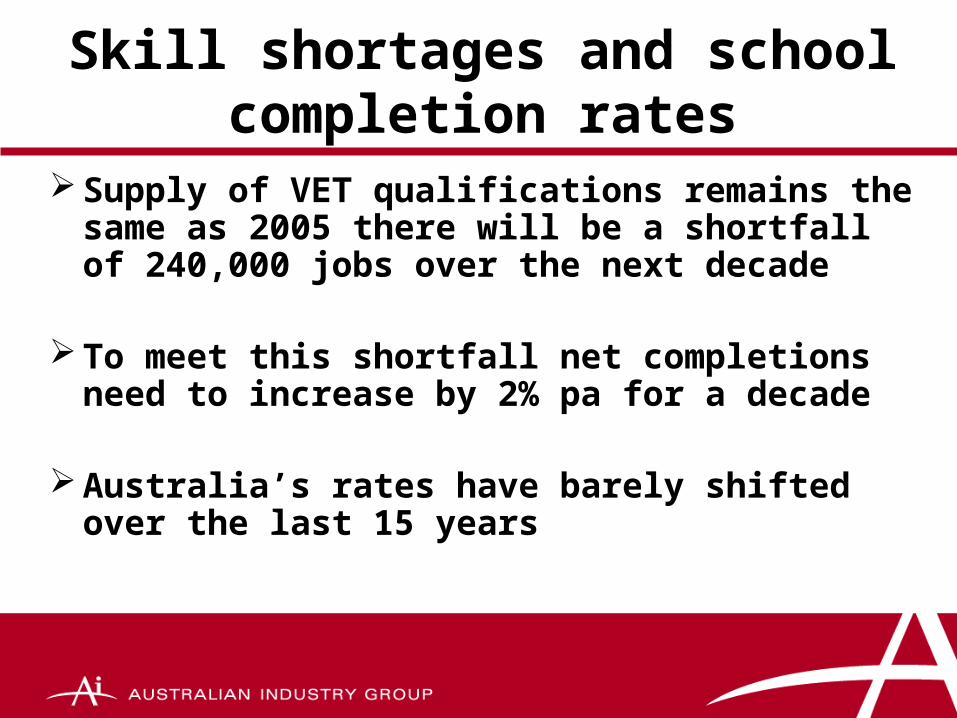
Skill shortages and school completion rates
Supply of VET qualifications remains the same as 2005 there will be a shortfall of 240,000 jobs over the next decade
To meet this shortfall net completions need to increase by 2% pa for a decade
Australia’s rates have barely shifted over the last 15 years
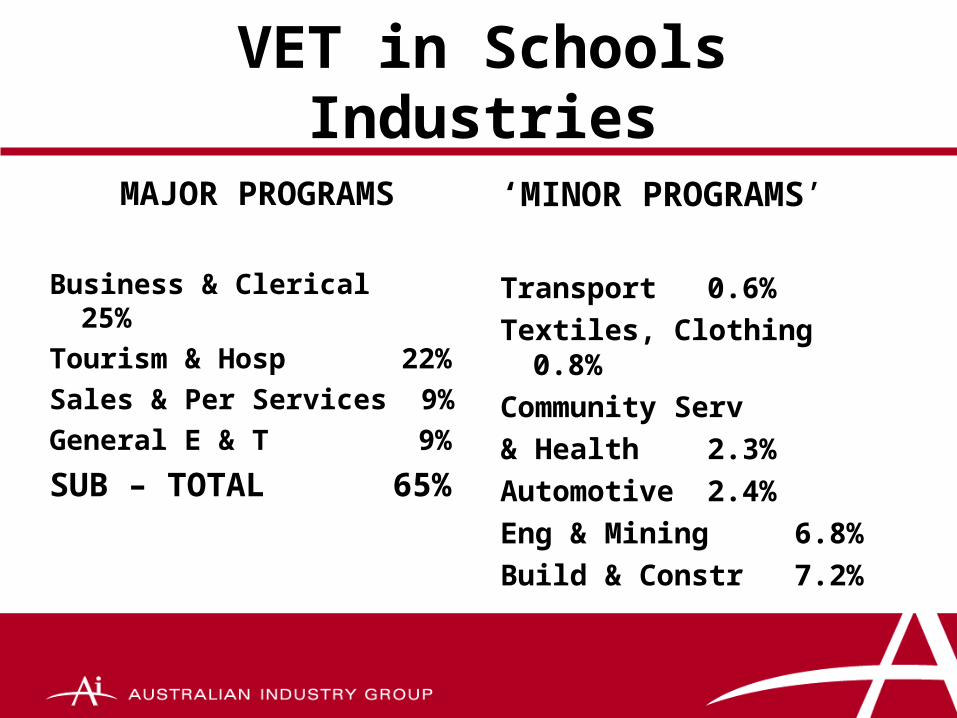
VET in Schools Industries
MAJOR PROGRAMS
Business & Clerical 25%
Tourism & Hosp 22%
Sales & Per Services 9%
General E & T 9%
SUB – TOTAL 65%
‘MINOR PROGRAMS’
Transport 0.6%
Textiles, Clothing 0.8%
Community Serv
& Health 2.3%
Automotive 2.4%
Eng & Mining 6.8%
Build & Constr7.2%
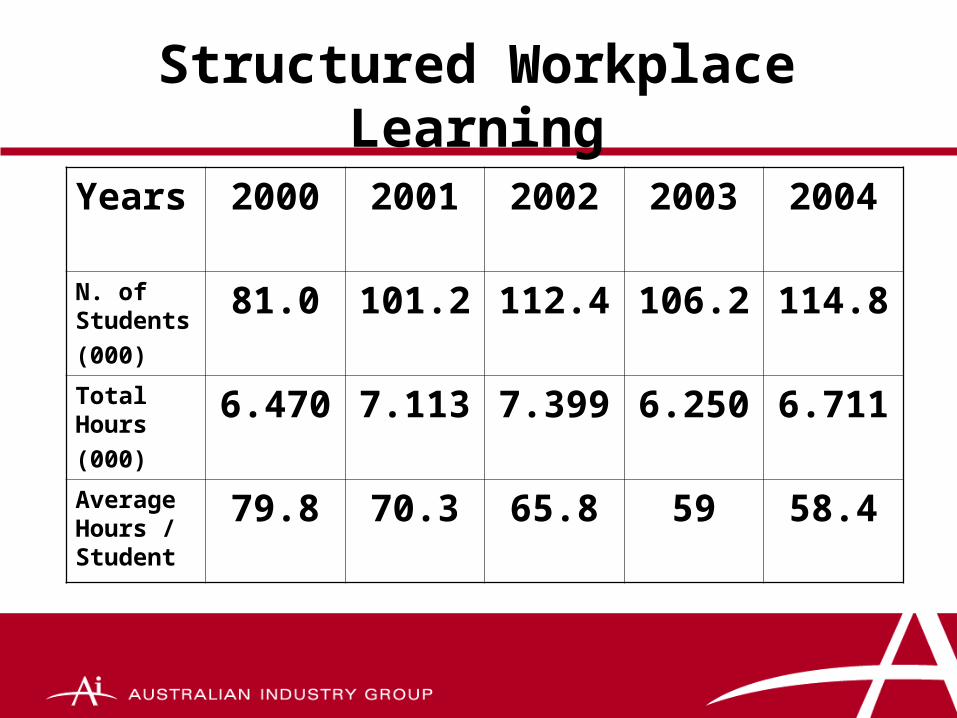
Structured Workplace Learning
Years 2000 2001 2002 2003 2004
N. of Students
(000)
81.0 101.2 112.4 106.2 114.8
Total Hours
(000)
6.470 7.113 7.399 6.250 6.711
Average Hours / Student
79.8 70.3 65.8 59 58.4
State of Youth Transitions
Most recent OECD report of youth transitions:
“There is agreement that, in order to improve youth job prospects, it is essential to combat school failure. In particular, early and sustained intervention can help prevent a vicious circle of cumulative disadvantages.”The Changing Nature of the School-to-Work Transition Process in OECD Countries, 2007
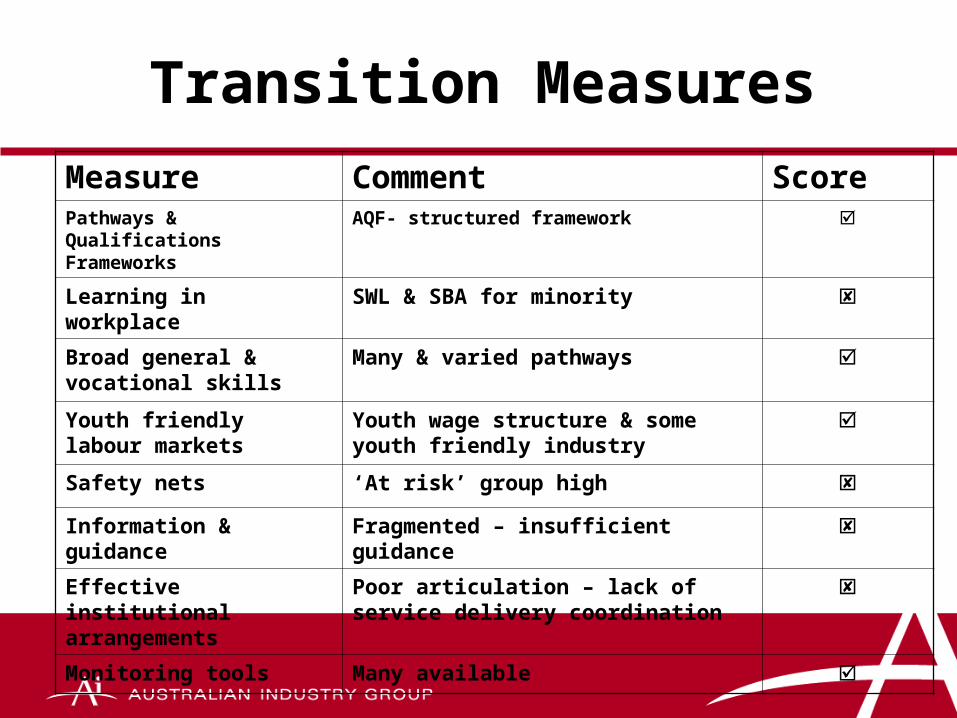
Transition Measures
Measure Comment ScorePathways & Qualifications Frameworks
AQF- structured framework
Learning in workplace SWL & SBA for minority
Broad general & vocational skills
Many & varied pathways
Youth friendly labour markets
Youth wage structure & some youth friendly industry
Safety nets ‘At risk’ group high
Information & guidance Fragmented – insufficient guidance
Effective institutional arrangements
Poor articulation – lack of service delivery coordination
Monitoring tools Many available
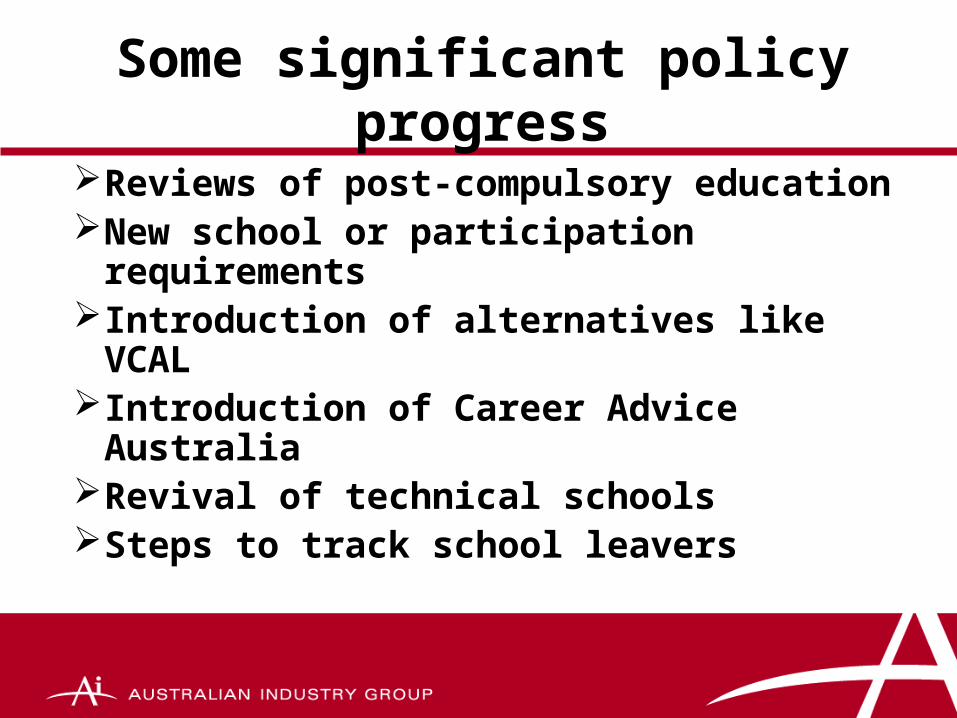
Some significant policy progress
Reviews of post-compulsory educationNew school or participation
requirementsIntroduction of alternatives like VCALIntroduction of Career Advice AustraliaRevival of technical schoolsSteps to track school leavers
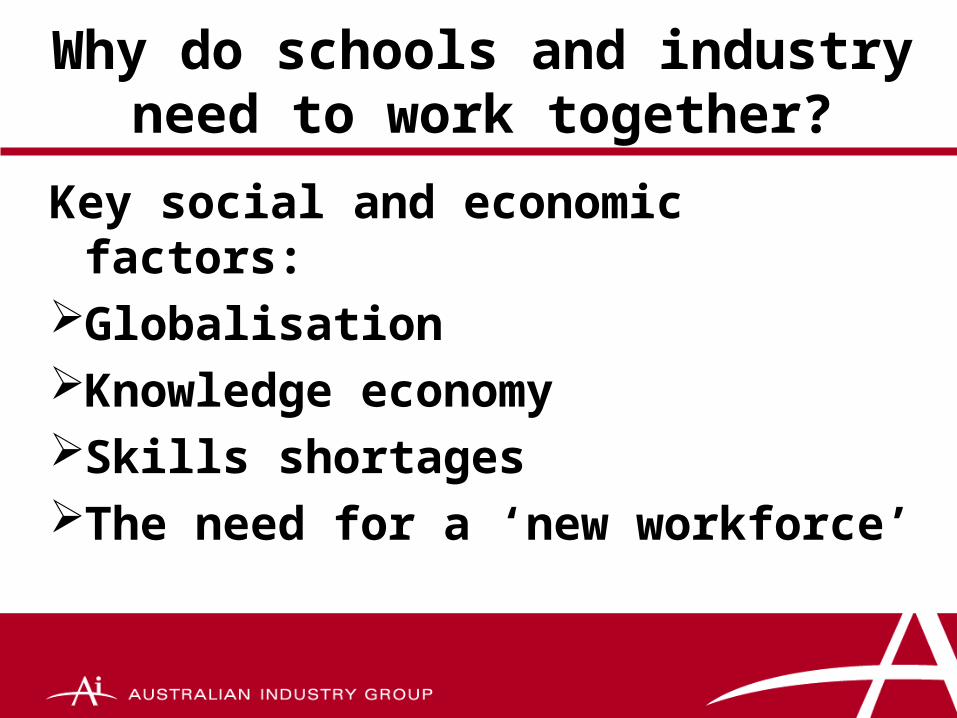
Why do schools and industry need to work together?
Key social and economic factors:GlobalisationKnowledge economySkills shortagesThe need for a ‘new workforce’
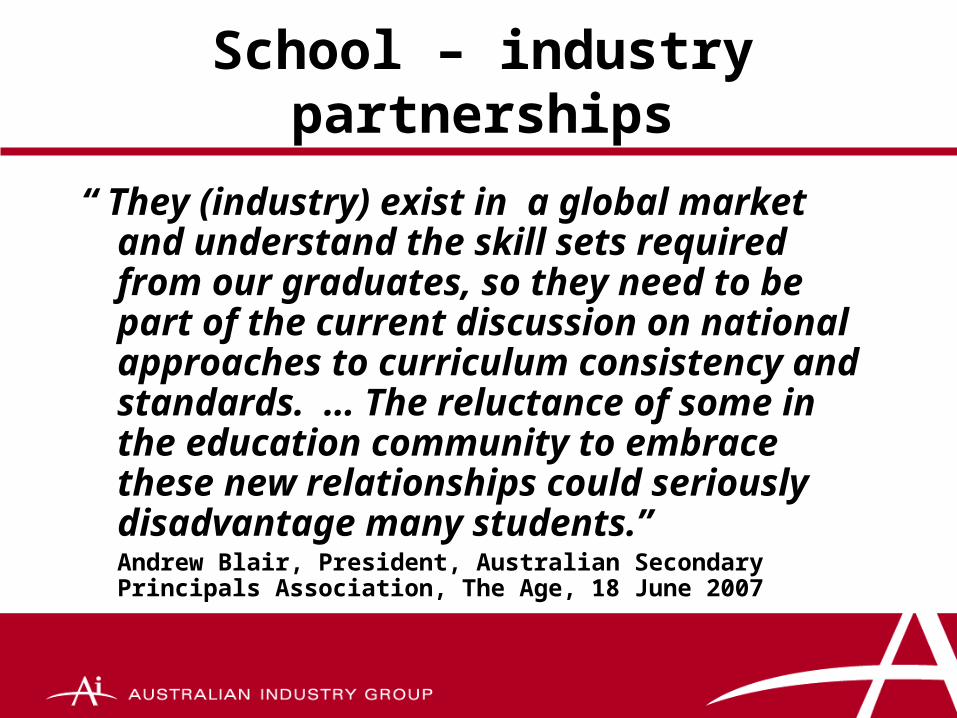
School – industry partnerships
“ They (industry) exist in a global market and understand the skill sets required from our graduates, so they need to be part of the current discussion on national approaches to curriculum consistency and standards. … The reluctance of some in the education community to embrace these new relationships could seriously disadvantage many students.”Andrew Blair, President, Australian Secondary Principals Association, The Age, 18 June 2007
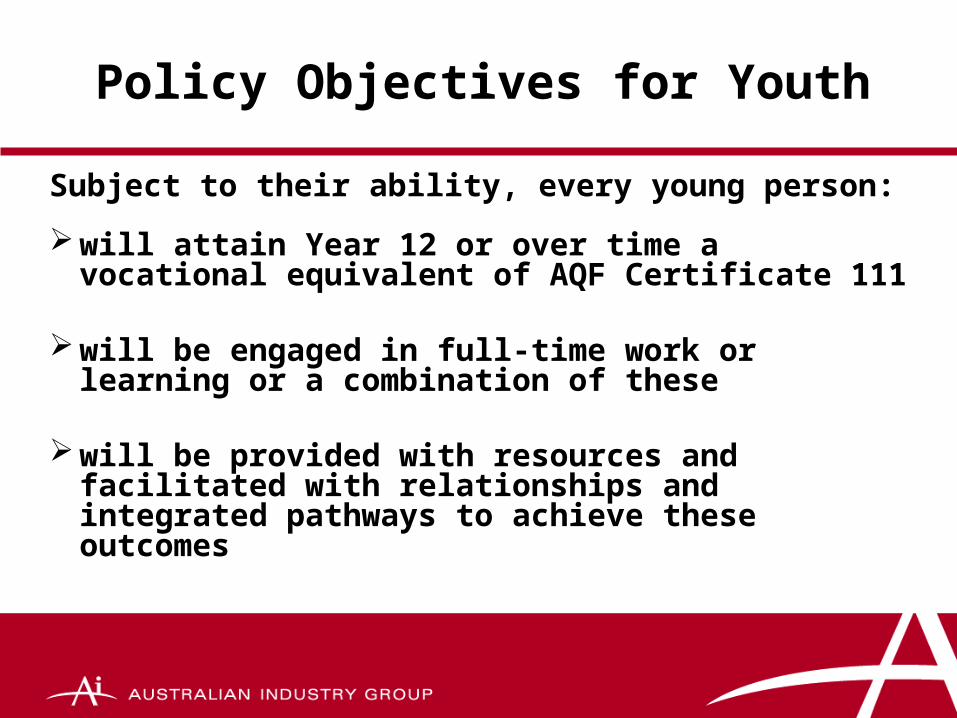
Policy Objectives for Youth
Subject to their ability, every young person:
will attain Year 12 or over time a vocational equivalent of AQF Certificate 111
will be engaged in full-time work or learning or a combination of these
will be provided with resources and facilitated with relationships and integrated pathways to achieve these outcomes
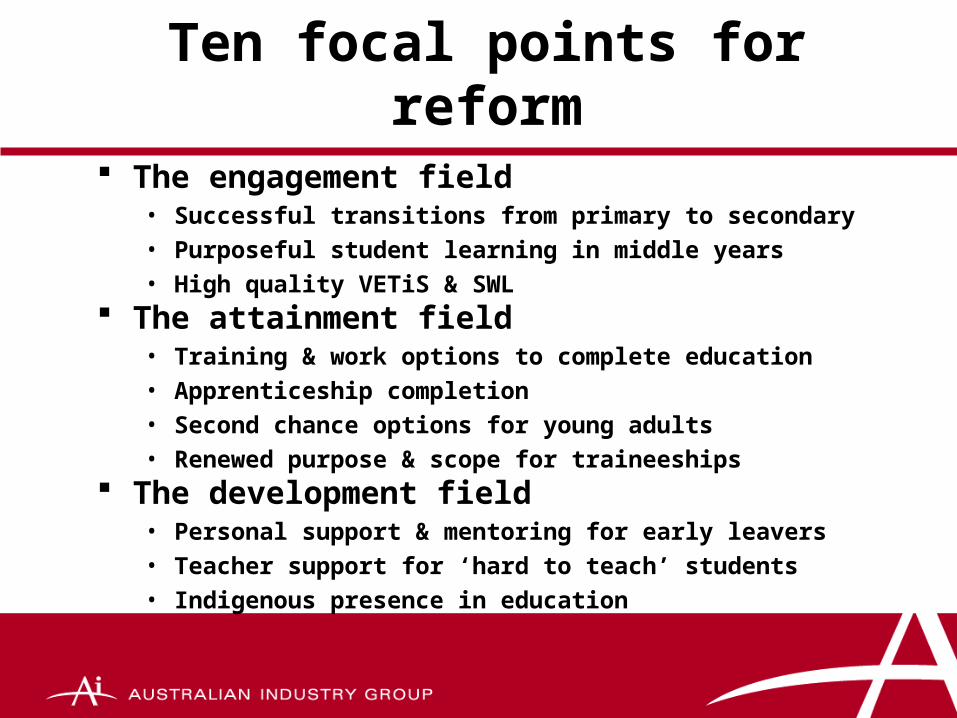
Ten focal points for reform
The engagement field• Successful transitions from primary to secondary• Purposeful student learning in middle years• High quality VETiS & SWL
The attainment field• Training & work options to complete education• Apprenticeship completion• Second chance options for young adults• Renewed purpose & scope for traineeships
The development field• Personal support & mentoring for early leavers• Teacher support for ‘hard to teach’ students• Indigenous presence in education
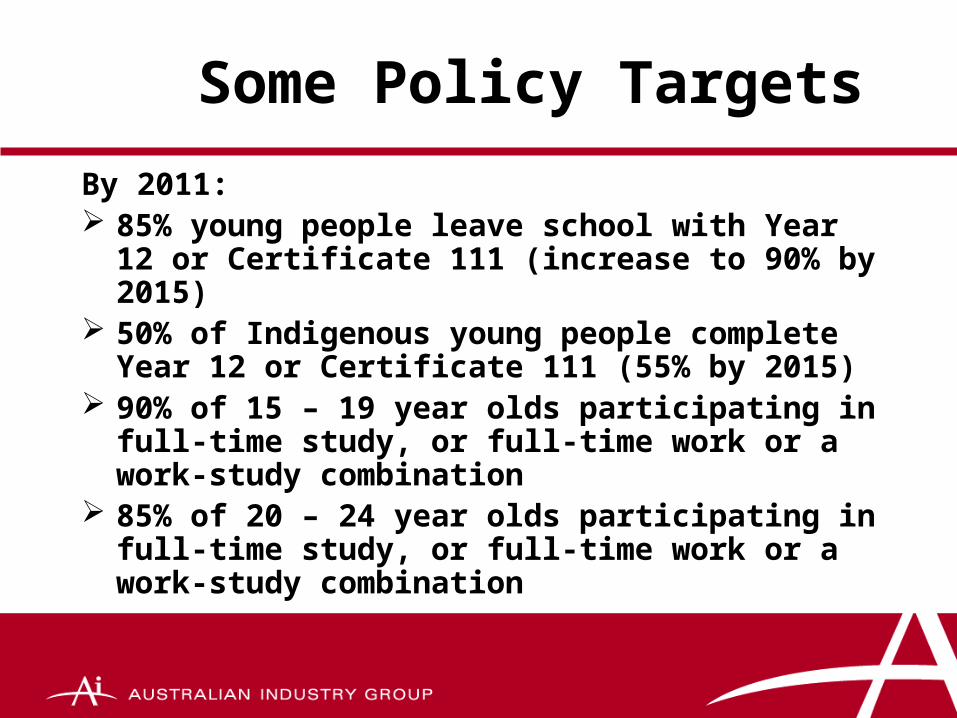
Some Policy Targets
By 2011: 85% young people leave school with Year 12 or
Certificate 111 (increase to 90% by 2015) 50% of Indigenous young people complete Year
12 or Certificate 111 (55% by 2015) 90% of 15 – 19 year olds participating in full-time
study, or full-time work or a work-study combination
85% of 20 – 24 year olds participating in full-time study, or full-time work or a work-study combination
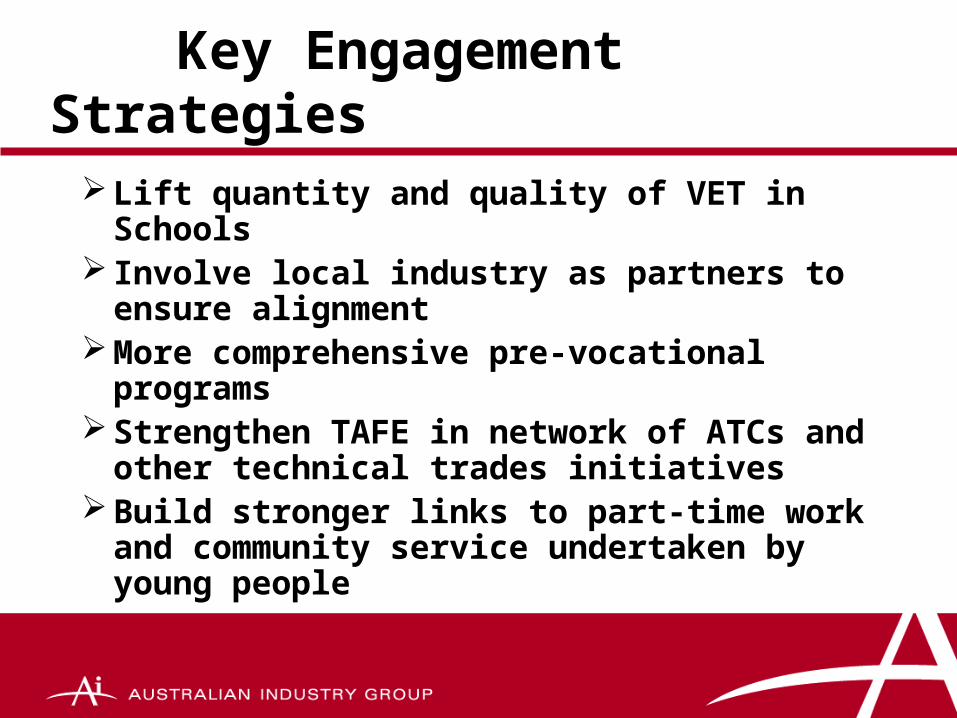
Key Engagement Strategies
Lift quantity and quality of VET in Schools Involve local industry as partners to
ensure alignment More comprehensive pre-vocational
programs Strengthen TAFE in network of ATCs and
other technical trades initiatives Build stronger links to part-time work and
community service undertaken by young people
Key Attainment Strategies
Lift completion rate of upper secondary education
Recognise diverse learning pathwaysGuarantee ‘second chance’ place in
TAFE/ACEReview purpose and scope of
traineeships
Key Development Strategies
Personal support for potential school leavers to make successful transition
Improve teacher support and preparation for ‘hard to teach’ students
An Indigenous presence in schools and support for Indigenous students/communities